Chapter 23
Cardiopulmonary Response to Exercise in Health and Disease
After reading this chapter you will be able to:
• Describe why continual regeneration of adenosine triphosphate (ATP) is necessary to sustain exercise
• Explain how aerobic and anaerobic metabolic processes differ in their ability to generate ATP
• Explain how oxygen consumption and carbon dioxide production differ in aerobic metabolism of carbohydrates and fats
• Explain why the changes in respiratory, cardiovascular, and metabolic processes are different below than above the anaerobic threshold
• Explain how caloric expenditure is related to oxygen consumption
• Use exercise test data to differentiate cardiac and pulmonary limitations to exercise
• Explain why sedentary and athletically trained individuals differ in their ability to perform exercise
• Use exercise test data to differentiate obstructive and restrictive pulmonary limitations to physical activity
• Use exercise test data to prescribe appropriate physical activity in cardiopulmonary rehabilitation programs
maximum exercise ventilation (< ?xml:namespace prefix = "mml" /> max)
max)
maximum oxygen consumption ( O2max)


Physiology of Exercise
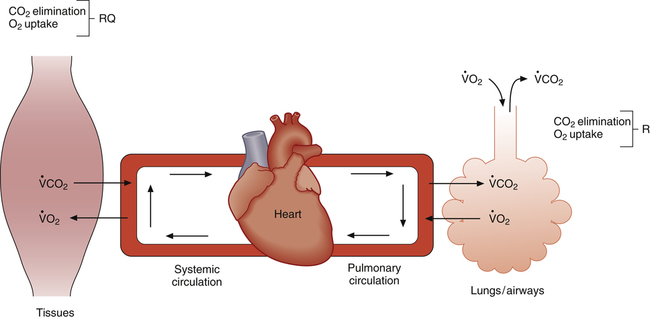
Strenuous exercise greatly increases the body’s requirements for oxygen delivery and carbon dioxide elimination. Close coupling between increased metabolic activity and cardiopulmonary function is necessary to supply adequate oxygen to exercising muscles and maintain a normal blood acid-base balance. This coupling is schematically represented in Figure 23-1.
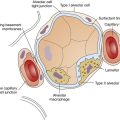
Normal exchange of O2 and CO2 between muscle cells and the air requires the following:1 (1) efficient alveolar ventilation, (2) pulmonary blood flow matched to ventilation, (3) adequate blood hemoglobin content, (4) adequate cardiac pump function, (5) systemic blood flow matched to tissue requirements, and (6) ventilatory control mechanisms sensitive to arterial blood gas changes. These factors normally interact in a finely coordinated fashion, responding precisely to the metabolic needs of exercising muscle.
Metabolism during Exercise
The source of energy for skeletal muscle contraction is adenosine triphosphate (ATP). The structure of the ATP molecule is symbolized as follows:2

The bonds between the  radicals, designated by the symbol ~, are high-energy phosphate bonds. The process of metabolism breaks these bonds, releasing the energy needed to form and break cross-bridges between the muscle’s actin and myosin myofibrils, as described in Chapter 17; in this way, muscle fibers shorten and generate force. During exercise conditions, each high-energy bond stores about 7300 calories (7.3 kcal) per mole of ATP molecules.2 The hydrolysis of the first
  bond produces 7300 calories, generating adenosine diphosphate (ADP) in the process. Hydrolysis of the remaining
  bond yields yet another 7300 calories and creates adenosine monophosphate (AMP) for a total energy release of about 14.6 kcal/mol.2
ATP stores in skeletal muscle are extremely small and can sustain strenuous muscular activity for only about 3 seconds.2 Therefore ATP molecules must be reconstituted continuously during exercise through aerobic (with oxygen) and anaerobic (without oxygen) metabolic processes.
The energy required for sustained exercise is derived from internal and external mechanisms.3 Internal mechanisms include anaerobic production of ATP, O2 release from hemoglobin, and dissolved O2 uptake from plasma and tissue fluids. External mechanisms involve the delivery of atmospheric O2 molecules to the tissues. Atmospheric O2 is relatively unimportant for power surges of a few seconds and the first few minutes of exercise. Internal mechanisms are crucial for initiating exercise because of the delay involved in transporting atmospheric O2 to the tissues. As exercise continues, energy production becomes primarily dependent on the adequate delivery of atmospheric O2 to the tissues. As exercise intensity reaches maximum limits, internal anaerobic sources of energy become increasingly important.
Aerobic Metabolism
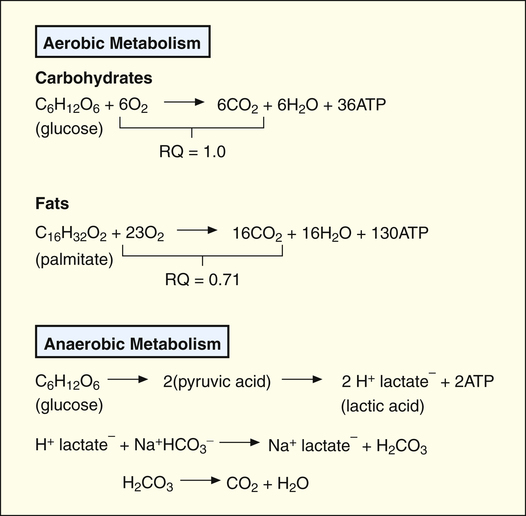
Aerobic metabolism of carbohydrates (glucose), fats (fatty acids), and proteins (amino acids) provides the major energy source for ATP synthesis.2 During exercise, stored glycogen in the muscles breaks down into glucose. Glucose breaks down into pyruvic acid, which reacts with O2 in the cell’s mitochondria, forming ATP, CO2, and water; thus the aerobic or oxidative process of ATP synthesis consumes O2 and generates CO2.
Aerobic metabolism of fatty acids also produces ATP molecules. For a given rate of ATP production, fat metabolism requires more O2 than carbohydrate metabolism (Figure 23-2). This means carbohydrate metabolism uses O2 more efficiently and requires less cardiovascular work per mole of ATP synthesis. However, fat metabolism generates less CO2 per mole of ATP produced than carbohydrate metabolism (see Figure 23-2); in other words, fat metabolism requires less ventilatory work than carbohydrate metabolism in generating a given amount of energy.2


Anaerobic Metabolism and Lactic Acid Production
The breakdown of this bond supplies the immediate energy for ATP resynthesis from ADP, as shown:

However, this process produces only enough ATP to fuel muscle contraction for 8 to 10 seconds during heavy exercise.2
If the cardiovascular system does not supply enough O2 for aerobic metabolism, glucose from muscle glycogen is metabolized in a process called anaerobic glycolysis. In this process, pyruvic acid is metabolized anaerobically into lactic acid and ATP (see Figure 23-2). The lactic acid subsequently diffuses into the interstitial fluid and blood, creating lactic acidosis, a form of metabolic acidosis. Increased blood lactic acid concentration indicates the presence of anaerobic metabolism, implying inadequate O2 delivery to the tissues.
Anaerobic Threshold
As exercise intensity increases, energy requirements gradually increase until aerobic metabolism alone can no longer meet the demand for ATP resynthesis. Consequently, the body must rely on anaerobic metabolism to generate additional ATP. The onset of anaerobic metabolism, the anaerobic threshold, normally occurs at about 50% to 65% of the body’s maximum oxygen consumption ( O2max).3 Because fat cannot be metabolized anaerobically, less fat is used as exercise intensity increases.2 The major energy sources at maximal exercise are aerobic and anaerobic glucose metabolism. For this reason, the body’s glucose stores limit exercise endurance. Sustained exercise such as marathon running may totally deplete glucose stores, explaining the reason some marathon runners suddenly fatigue or “hit the wall” after about 20 miles.
Figure 23-2 shows that aerobic metabolism produces ATP far more efficiently than anaerobic metabolism. In aerobic metabolism, one molecule of glucose produces 36 molecules of ATP compared with only two molecules of ATP in anaerobic glucose metabolism. In addition, anaerobic glucose metabolism generates two lactic acid molecules. Blood bicarbonate immediately buffers newly formed lactic acid, generating more CO2, adding to the CO2 already produced by aerobic metabolism (see Figure 23-2). This increased CO2 production stimulates a proportional increase in ventilation.3
Respiratory Quotient and Respiratory Exchange Ratio
The respiratory quotient (RQ) is the ratio of CO2 molecules produced to O2 molecules consumed by the tissues ( ), as shown in Figure 23-1.2 (In Figure 23-2, the RQ for glucose is about 1.0, whereas for fat, it is 0.71.) The fat RQ is lower because fat metabolism generates less CO2 per ATP molecule than carbohydrate metabolism. At rest, the body metabolizes nearly equal amounts of fats and carbohydrates, yielding an RQ of about 0.85.2 As exercise intensity increases, the RQ rises toward 1.0 as the metabolic substrate changes to glucose.
The respiratory exchange ratio (R) is the ratio between CO2 elimination and O2 uptake, measured from inhaled and exhaled gases at the mouth (see Figure 23-1).2 In steady-state conditions, R equals RQ. The steady state is characterized by a CO2 elimination rate that matches the CO2 production rate; likewise, the lung’s O2 uptake rate equals the tissue’s O2 consumption rate in steady-state conditions. During short bursts of maximal exercise such as the 100-yard dash, RQ and R are different because tissue O2 consumption and CO2 production momentarily exceed the lung’s O2 uptake and CO2 elimination. Like RQ, R increases as exercise intensity increases; the onset of anaerobic metabolism further increases R as bicarbonate reacts with lactic acid and generates more CO2
Exercise Testing Methods
Clinical Focus 23-1 Arterial Carbon Dioxide Pressure during Exercise


From these data, do you expect her PaCO2 to be low, normal, or high?


bicycle’s pedal resistance. For example, the subject may exercise at a certain treadmill speed and angle for 3 minutes, after which the speed and angle are increased for the next 3 minutes, and so on. The subject exercises through a well-defined series of stages, each more difficult than the last, until maximum capacity is reached. During this time, a machine called a metabolic cart measures the inhaled and exhaled O2 and CO2 concentrations, tidal volume (VT), respiratory rate, and minute ventilation.
To obtain these measurements, the subject breathes through a specially designed mouthpiece attached to the metabolic cart by large-bore tubes. Nose clips prevent breathing through the nose. The lips must be sealed tightly around the mouthpiece to prevent mixing of respiratory gases with atmospheric air. An electrocardiogram (ECG) machine measures the heart rate (HR) and ECG pattern during the exercise test. Depending on the data desired, various other physiological parameters may be measured. Table 23-1 lists physiological measurements grouped according to the invasiveness of the test and the monitoring equipment needed.
TABLE 23-1
Measurements during Graded Exercise Testing
| Level of Rest | Measurements |
| Group 1 | No mouthpiece |
| Patient response and symptoms | |
| Heart rate | |
| Blood pressure | |
| ECG | |
| SaO2 by oximetry | |
| Group 2 | Mouthpiece, oxygen, and carbon dioxide analyzer |
| Respiratory rate | |
| Tidal volume | |
| Minute ventilation | |
| End-tidal gas measurements | |
 O2 and O2 pulse O2 and O2 pulse |
|
 CO2 CO2 |
|
| Respiratory exchange ratio | |
| Group 3 | Arterial line |
| Blood gas values: PaO2, PaCO2, and pH | |
 and lactate and lactate |
|
| VD/VT | |
| Group 4 | Right-sided heart catheter |
| Pulmonary artery pressures | |
| Cardiac output | |
| Mixed venous PO2 and SO2 |
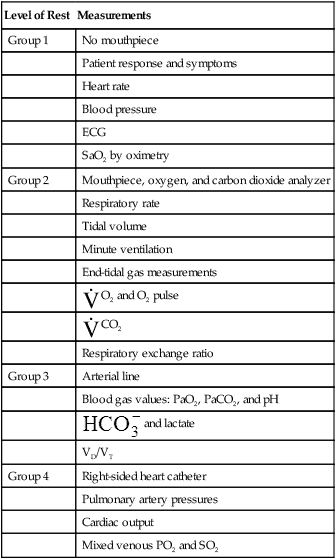


Modified from Martin L: Pulmonary physiology in clinical practice: the essentials for patient care and evaluation, St Louis, 1987, Mosby.
Physiological Changes during Exercise
Oxygen Consumption, Cardiac Output, and Blood Pressure
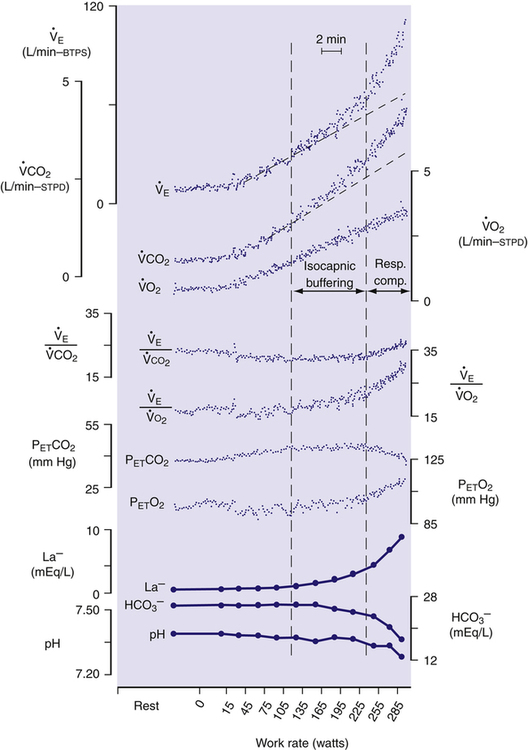
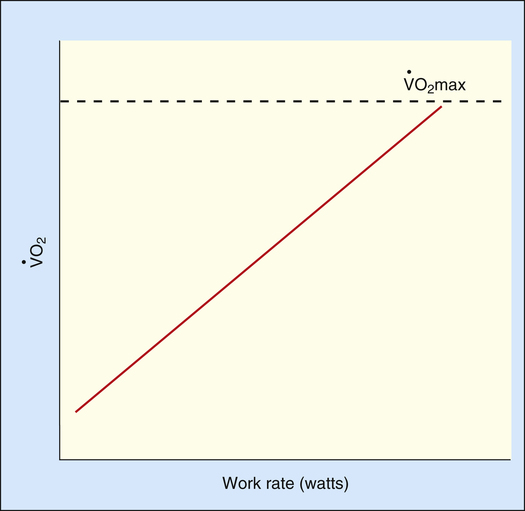
Figure 23-3 represents the exercise performance of a normal person.  O2 increases linearly with the work rate from rest to maximal exercise. The slope of
  O2 increase is about the same for all normal people; it is unaffected by training, age, or gender.1 Because
  O2 depends primarily on the amount of work done by exercising muscle,
  O2 can be predicted from the work rate.2,3


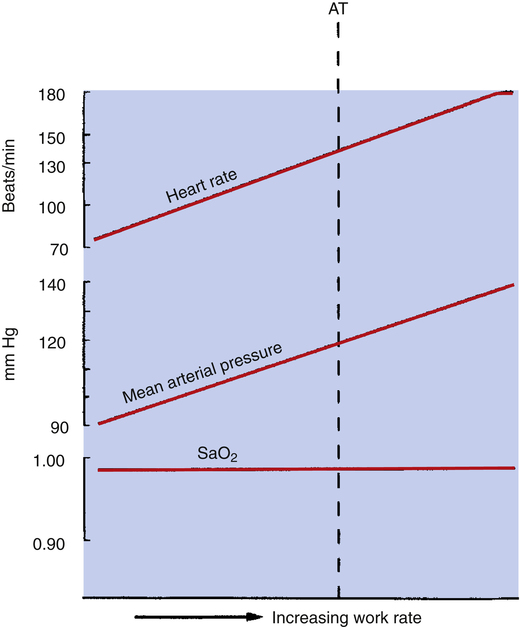
As exercise intensifies, contracting muscles consume ever greater amounts of ATP, which means aerobic ATP regeneration requires an increasingly greater O2 supply from the blood flow. Cardiac output rises to meet this demand by increasing stroke volume (SV) and heart rate. SV increases to its maximum value within the first half of the tolerable work rate range (at about 45% of the maximum  O2).3 From that point on, SV remains fairly constant; the only way the heart can increase its output further is to increase its rate of contraction. The early increase in SV is the result of an increased ejection fraction rather than greater diastolic filling; sympathetic nervous stimulation and circulating epinephrine increase systolic ejection.3 Heart rate increases linearly with O2 requirements until the maximum heart rate (HRmax) is achieved (Figure 23-4).
As cardiac output increases with exercise, systolic blood pressure rises significantly (often ≥200 mm Hg). Diastolic pressure changes little, if at all, in normal, healthy people because the peripheral vasculature dilates significantly in response to increased O2 demand, which greatly reduces vascular resistance.2,3 Thus, the pulse pressure (systolic – diastolic) increases significantly, forcing open all of the capillaries in working skeletal muscle. In heavy exercise, up to 80% of the cardiac output is diverted to skeletal muscle, making possible greatly increased O2 delivery and  O2 rates.
HRmax is age related and does not change with fitness. The predicted HRmax for adults is as follows:4

HRmax, and thus, cardiac output are reduced in older persons because their hearts are less responsive to beta-adrenergic stimulation.4 An unconditioned person and a conditioned athlete of the same age have the same HRmax, but the conditioned athlete has a much greater SV and therefore a much higher cardiac output at HRmax. For a given amount of submaximal exercise, a conditioned person’s HR is much lower than the HR of a sedentary person. This explains why a sedentary person reaches the HRmax sooner and at much lower exercise intensity than an athlete. Because the unconditioned person’s cardiac output is lower at the HRmax, maximum O2 delivery and  O2 are also lower.
Carbon Dioxide Production, Respiratory Exchange Ratio, and Minute Ventilation
The increased metabolic activity of exercising muscles raises not only the  O2 but also the
  CO2. Before the anaerobic threshold is reached,
  CO2 increases linearly and parallel with
  O2. Thus, R remains constant. The ventilation rate and depth rise to accommodate the increase in
  CO2, producing a linear increase in
  parallel with
  CO2 and
  O2 (see Figure 23-3, before anaerobic threshold).
Although it is generally accepted that increased  CO2 during exercise is the stimulus for the higher
  , some evidence suggests that a neurally mediated, muscle-derived signal plays a role. Apparently, peripheral muscle receptors send signals to the central nervous system, increasing blood pressure, HR, and ventilation. These signals are enhanced by muscle ischemia but are not present in ischemia alone without exercise.5 Thus, muscle movement appears to be partly responsible for the increased
  of exercise.
The ventilatory response to exercise was discussed in Chapter 11. The immediate hyperpnea of exercise has long been a controversial subject and remains incompletely understood.3 The abrupt increase in  at the onset of exercise (phase I) occurs long before any chemical or humoral change can occur in the body. Rather than being geared to a chemoreceptor reflex mechanism, the abrupt increase in ventilation appears to be a response to anticipated future metabolic demand. Evidence points to a sophisticated internal respiratory controller that integrates multiple afferent and efferent signals to predict the level of metabolic activity that will occur and then adjusts ventilation before the fact.6 A study of children with congenital central hypoventilation syndrome revealed that passive leg motion induced by a motor-driven ergocycle increased
  , although these children had no
  response to inhaled CO2.7 Increased
  occurred immediately with the first breath after the onset of pedaling motion in children with congenital central hypoventilation syndrome and normal controls. This study supports the idea that muscle or joint receptors play a role in exercise hyperpnea.
Normal people increase  by increasing both VT and respiratory rate. Early in exercise, a higher VT produces most of the increase in
  . After about 60% to 70% of the vital capacity is reached, VT plateaus, and increased respiratory rate is responsible for additional
  increases.8
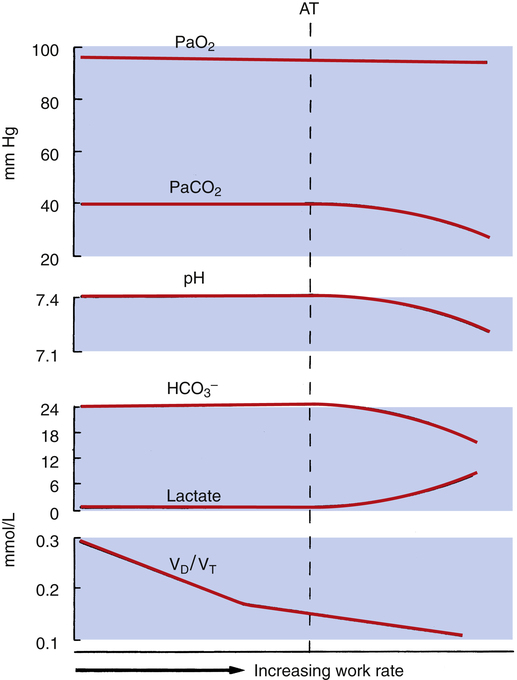
Figure 23-5 shows that dead space-to-tidal volume ratio (VD/VT) decreases as exercise progresses. The initial steep reduction in VD/VT reflects early increases in VT with respect to the fixed anatomical dead space. VD/VT decreases from normal values of 0.3 to 0.4 at rest to 0.15 to 0.2 in exercise, in part due to a larger VT but also because of significant blood flow diversion to previously underperfused upper lung zones.3,8 As the respiratory rate begins to account for more of the increase in  , the decline in VD/VT is less steep.
Events Occurring after Anaerobic Threshold
As shown in Figure 23-3, the anaerobic threshold is the point at which the  CO2 slope becomes steeper than the
  O2 slope, indicating an increase in CO2 generation rate. This increase in CO2 generation is due to the bicarbonate buffering of anaerobically produced lactic acid.3,4 The increased generation of CO2 stimulates ventilation, and the
  slope rises in parallel with the
  CO2 slope, maintaining a constant PaCO2. In the end, the amount of CO2 exhaled per minute increases with respect to the amount of O2 taken up by the lungs, and R increases. The new
  slope has two phases. For some time, immediately after an aerobic threshold (AT) appears, the
  slope rises to match the increased
  CO2 slope. This short phase is referred to as isocapnic buffering, in which ventilation increases in concert with CO2, momentarily compensating for the evolving lactic acidosis (see Figure 23-3).
As bicarbonate stores diminish and arterial pH falls, ventilation is stimulated more intensely, causing a second-phase increase in  , out of proportion with the
  CO2 increase. (See the steeper
  slope after the second dotted vertical line in Figure 23-3.) The sharper rise in
  relative to
  CO2 represents hyperventilation; thus, PaCO2 falls, as is reflected by the decrease in PETCO2. (Recall that PETCO2 is normally about equal to PaCO2.) At the same time, PETO2 also increases because the increase in
  supplies O2 to the lungs more rapidly than it can be taken up.
As exercise intensity progresses to maximum levels, arterial pH falls further as blood lactate increases and bicarbonate concentration falls (see Figure 23-5). In other words, at maximal exercise, hyperventilation fails to compensate adequately for the lactic acidosis of anaerobic metabolism.
The increased ventilation with respect to  CO2 and
  O2 at AT causes
  and
and  to increase. These two ratios are called ventilatory equivalents for carbon dioxide and oxygen respectively.
  O2 begins to increase soon after AT is reached because the increased CO2 produced by lactic acid buffering adds to the ventilatory drive.
  CO2 does not increase until after the isocapnic buffering period. At this point, metabolic acidosis drives
  further, increasing it out of proportion to the increase in
  CO2 (see Figure 23-3).
A commonly accepted noninvasive method for determining AT is the V-slope method, which relates  CO2 to
  O2.4 At the anaerobic threshold, the
  CO2 slope becomes steeper than the
  O2 slope, signaling the onset of lactic acid buffering. Values for R,
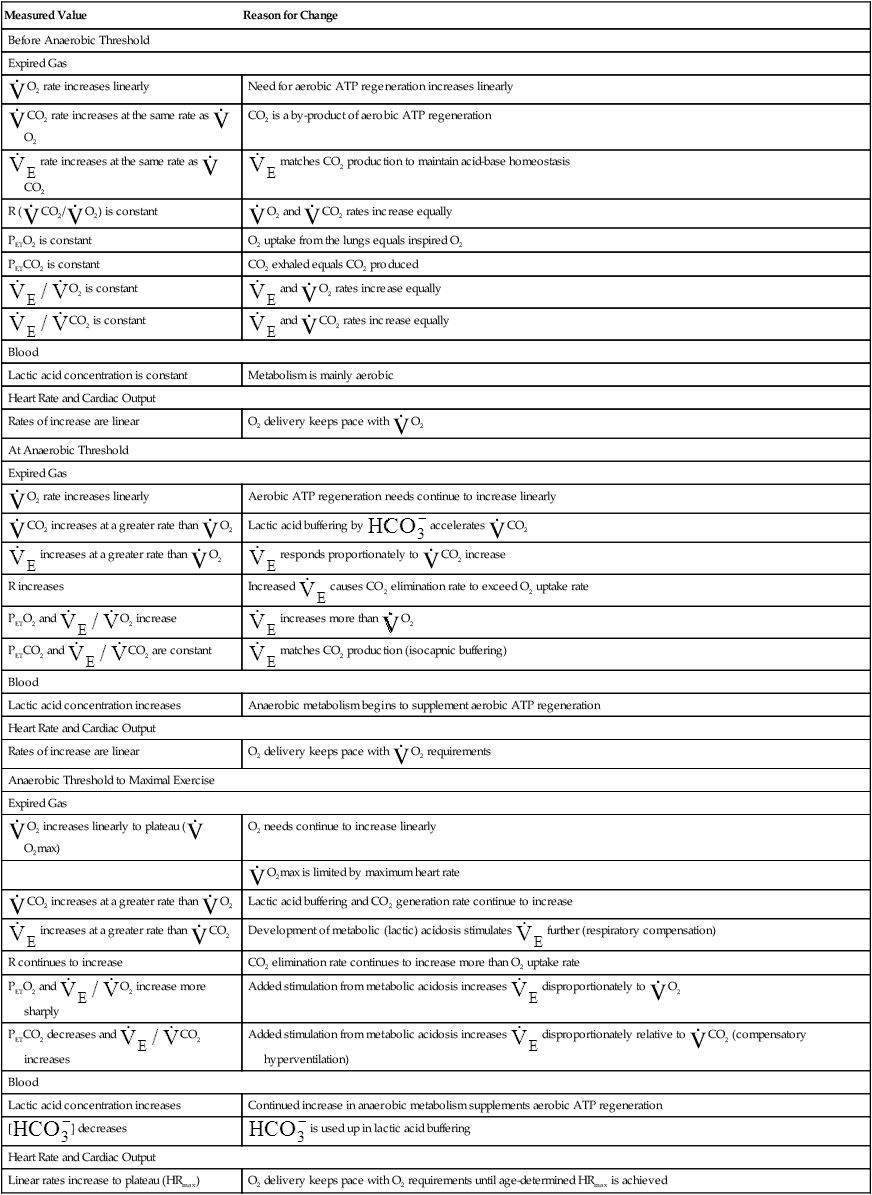
  O2, and PETO2 also increase at AT. Table 23-2 summarizes changes during progressive exercise.
TABLE 23-2
Physiological Changes during Exercise as Work Rate Increases
| Measured Value | Reason for Change |
| Before Anaerobic Threshold | |
| Expired Gas | |
 O2 rate increases linearly O2 rate increases linearly |
Need for aerobic ATP regeneration increases linearly |
 CO2 rate increases at the same rate as CO2 rate increases at the same rate as  O2 O2 |
CO2 is a by-product of aerobic ATP regeneration |
 rate increases at the same rate as rate increases at the same rate as  CO2 CO2 |
 matches CO2 production to maintain acid-base homeostasis matches CO2 production to maintain acid-base homeostasis |
R ( CO2/ CO2/ O2) is constant O2) is constant |
 O2 and O2 and  CO2 rates increase equally CO2 rates increase equally |
| PETO2 is constant | O2 uptake from the lungs equals inspired O2 |
| PETCO2 is constant | CO2 exhaled equals CO2 produced |
 O2 is constant O2 is constant |
 and and  O2 rates increase equally O2 rates increase equally |
 CO2 is constant CO2 is constant |
 and and  CO2 rates increase equally CO2 rates increase equally |
| Blood | |
| Lactic acid concentration is constant | Metabolism is mainly aerobic |
| Heart Rate and Cardiac Output | |
| Rates of increase are linear | O2 delivery keeps pace with  O2 O2 |
| At Anaerobic Threshold | |
| Expired Gas | |
 O2 rate increases linearly O2 rate increases linearly |
Aerobic ATP regeneration needs continue to increase linearly |
 CO2 increases at a greater rate than CO2 increases at a greater rate than  O2 O2 |
Lactic acid buffering by  accelerates accelerates  CO2 CO2 |
 increases at a greater rate than increases at a greater rate than  O2 O2 |
 responds proportionately to responds proportionately to  CO2 increase CO2 increase |
| R increases | Increased  causes CO2 elimination rate to exceed O2 uptake rate causes CO2 elimination rate to exceed O2 uptake rate |
PETO2 and  O2 increase O2 increase |
 increases more than increases more than  O2 O2 |
PETCO2 and  CO2 are constant CO2 are constant |
 matches CO2 production (isocapnic buffering) matches CO2 production (isocapnic buffering) |
| Blood | |
| Lactic acid concentration increases | Anaerobic metabolism begins to supplement aerobic ATP regeneration |
| Heart Rate and Cardiac Output | |
| Rates of increase are linear | O2 delivery keeps pace with  O2 requirements O2 requirements |
| Anaerobic Threshold to Maximal Exercise | |
| Expired Gas | |
 O2 increases linearly to plateau ( O2 increases linearly to plateau ( O2max) O2max) |
O2 needs continue to increase linearly |
 O2max is limited by maximum heart rate O2max is limited by maximum heart rate |
|
 CO2 increases at a greater rate than CO2 increases at a greater rate than  O2 O2 |
Lactic acid buffering and CO2 generation rate continue to increase |
 increases at a greater rate than increases at a greater rate than  CO2 CO2 |
Development of metabolic (lactic) acidosis stimulates  further (respiratory compensation) further (respiratory compensation) |
| R continues to increase | CO2 elimination rate continues to increase more than O2 uptake rate |
PETO2 and  O2 increase more sharply O2 increase more sharply |
Added stimulation from metabolic acidosis increases  disproportionately to disproportionately to  O2 O2 |
PETCO2 decreases and  CO2 increases CO2 increases |
Added stimulation from metabolic acidosis increases  disproportionately relative to disproportionately relative to  CO2 (compensatory hyperventilation) CO2 (compensatory hyperventilation) |
| Blood | |
| Lactic acid concentration increases | Continued increase in anaerobic metabolism supplements aerobic ATP regeneration |
[ ] decreases ] decreases |
 is used up in lactic acid buffering is used up in lactic acid buffering |
| Heart Rate and Cardiac Output | |
| Linear rates increase to plateau (HRmax) | O2 delivery keeps pace with O2 requirements until age-determined HRmax is achieved |


Controversy exists over whether unavailability of O2 causes the increased blood lactate measured during progressive exercise.3 If tissue cells do not use O2, anaerobic metabolism sustains ATP synthesis, generating lactate in the process. However, O2 unavailability is not necessarily the cause of an increased blood lactate concentration. An elevated blood lactate concentration means its production rate exceeds its metabolism rate. In other words, an increase in blood lactate may simply reflect that its metabolism rate cannot keep up with its production, not that O2 is unavailable. Therefore, blood lactate concentration may not accurately reflect the degree of O2 limitation.3 Nevertheless, the onset of lactic acidosis is delayed in exercising subjects breathing high O2 concentrations. In addition, high workloads elicit lower than normal blood lactate concentrations when patients are breathing supplemental O2. Conversely, the lactate threshold is reached sooner and maximum lactate concentration is higher when a patient is breathing a low fractional concentration of oxygen in inspired gas (FIO2). These findings provide strong evidence that anaerobic threshold is an O2-dependent mechanism.9
Arterial Blood Gases
Figure 23-5 shows that arterial blood gases remain remarkably constant up to the anaerobic threshold. As discussed earlier, [ ] and pH decrease after reaching AT as
  buffers lactic acid; about 22 mEq of CO2 are evolved for each 1 mEq of lactic acid buffered.3 Hyperventilation does little to raise PaO2 and has even less effect on SaO2 (see Figure 23-4); that is, room air FIO2 limits the increase in PaO2, and SaO2 is already near its maximum level under normal resting conditions (refer to the oxygen-hemoglobin equilibrium curve in Chapter 8). Thus, arterial oxygen content does not increase significantly from rest to maximal exercise. For these reasons, increased O2 delivery to the tissues depends entirely on the increase in cardiac output in normal individuals.
Oxygen Diffusion Capacity
O2 diffusion capacity almost triples with exercise.2 At rest, blood flow through many pulmonary capillaries is extremely slow or even stopped. During exercise, increased cardiac output perfuses all capillaries to their maximum capacities, greatly increasing the surface area for diffusion. In addition, increased pulmonary vascular pressure produces a more uniform vertical distribution of pulmonary blood flow, greatly improving apical perfusion and increasing the diffusion surface area.8
Oxygen Cost of Work
After a steady state is reached during exercise,  O2 can be predicted from the work rate (watts) whether the exercising individual is trained or untrained, old or young, male or female.9 The linear relationship between
  O2 and work rate (Figure 23-6) has a slope of about 10 mL
  O2/watt. This relationship reflects the fact that the same number of O2 molecules is always used to generate the specific number of ATP molecules needed to produce a particular muscular contraction force. For this reason, the terms
  O2 and work rate can be used interchangeably. In other words, work efficiency is relatively constant in people in steady-state exercise. Work efficiency is expressed as follows:9


In this calculation, the external work and energy cost of performing the work are converted to their caloric equivalents.  O2 can be converted to its caloric equivalent if the following information is known: (1) the number of calories produced when the body metabolizes 1 g of carbohydrate, fat, or protein and (2) the amount of O2 used in the process. (Such conversions are the basis for indirect calorimetry, a process for determining the resting energy expenditure and caloric nutritional needs in critically ill patients.) Likewise, the work rate (watts) can be converted to caloric equivalents from its relationship with
  O2. The normal work efficiency for lower extremity bicycle work is about 0.30, or 30%.9

In clinical practice, work is generally not measured in watts; instead, it is measured in milliliters per minute of  O2 per kilogram of body weight. The average resting
  O2/kg for a 70-kg, 40-year-old man is about 3.5 mL O2/min/kg, a value known as a metabolic equivalent (MET).4 The number of METs associated with a given level of work is calculated by first measuring the total O2 consumed per minute and dividing by body weight (kg); the result is then divided by 3.5. For example, 35 mL O2/min/kg is equal to 10 METs. However, estimating
  O2 from the work rate is inaccurate if the exercising subject fails to reach a steady state—a state in which tissue
  O2 and O2 uptake in the lungs are equal. In addition,
  O2 may not increase linearly with the work rate in patients with cardiovascular disease.
Oxygen Debt
The body cannot store much O2. During heavy exercise of short duration, the body consumes most of the stored O2 in the lungs, blood, and muscle fibers within about one minute, and the lungs cannot take up O2 fast enough to meet the body’s requirements; this creates an O2 debt. The debt is repaid in the immediate recovery period as the subject hyperventilates, and the lungs take up much greater amounts of O2 than the muscles normally require at rest. O2 taken up during the recovery phase is used to reconstitute the high-energy ATP system and to metabolize lactic acid.2
Normal Exercise-Limiting Factors
Cardiac Factors
At maximal exercise, HR may triple compared with rest, and SV may double, producing a cardiac output up to six times above normal.3,4 O2 delivery and  O2 increase to the same degree. Nevertheless, cardiac capacity is the factor that normally limits exercise; ventilatory capacity does not limit the ability of normal, healthy people to perform work.1,2
Cardiac capacity is determined chiefly by the maximum attainable HR. Early in exercise, SV reaches a maximum value, whereas HR continues to increase. O2 delivery and  O2 reach maximum limits because HR does so. Because healthy individuals can generally attain their predicted HRmax, the heart rate reserve (HRR) is normally zero during maximal exercise.1 HRR is calculated as shown:


The O2 pulse increases only when work rate increases, theoretically because blood flow distribution to working tissues improves, allowing for greater O2 extraction per unit of blood. An increase in O2 pulse is thus a marker for improved blood flow distribution.3 Fick’s equation (see Chapter 8) can be rearranged as follows to show that the O2 pulse is equal to SV multiplied by the arterial-venous O2 content difference:


Rearranging for the O2 pulse gives the following:


Pulmonary Factors
During maximal exercise,  may be as high as 150 L per minute, about 25 times resting
  . The respiratory rate approximately triples, whereas the VT increases about sixfold, up to about 60% or 70% of the vital capacity.8 Despite these large increases, normal, healthy people still do not attain their measured maximum voluntary ventilation (MVV) during maximal exercise.8 The breathing reserve (BR) is usually defined as the difference between MVV and maximum exercise ventilation (
 max),8 as the following equation shows:

BR represents a theoretical potential for increasing ventilation further once the point of maximum exercise is reached. MVV (measured over 12 to 15 seconds) is normally 20% to 50% larger than the ventilation an individual attains during maximal exercise.8,10–12 MVV is commonly estimated by multiplying the forced expiratory volume in 1 second (FEV1) by 40 (MVV = FEV1 × 40).13 Does this mean normal people have the potential to increase their ventilation by an additional 20% to 50% once they reach the point of maximum exercise? They probably cannot. The maximum ventilation that can be voluntarily sustained for 15 minutes or longer corresponds to 55% to 80% of the MVV in normal people.10,12 Electromyographic studies show signs of diaphragmatic fatigue in normal people who are ventilating at greater than 70% of the MVV, a level commonly attained during maximal exercise. If  max is compared with the maximal sustainable ventilation over the same time frame, BR is quite small, even in normal subjects. Nevertheless, BR calculated in the traditional way (MVV −
  max) is an important quantitative indicator of ventilatory reserve; it is higher in normal people and lower in people with pulmonary disease. Although respiratory muscle fatigue may occur during maximal exercise in normal subjects, it is not clear that this fatigue actually limits exercise.10
Some studies show that maximum ventilatory capacity may be an exercise-limiting factor in elite, world-class athletes.13,14 Trained athletes in these studies were able to exercise at intensities beyond levels that elicited  O2max. This supramaximal exercise was predicted to require 115% of the measured
  O2max. These athletes were able to sustain supramaximal exercise to the extent that they could increase their minute ventilation. In other words, although they reached their maximum cardiac capacity, these athletes were able to use their remaining ventilatory capacity to exercise further. In this sense, ventilatory capacity was the factor that determined maximal exercise intensity.
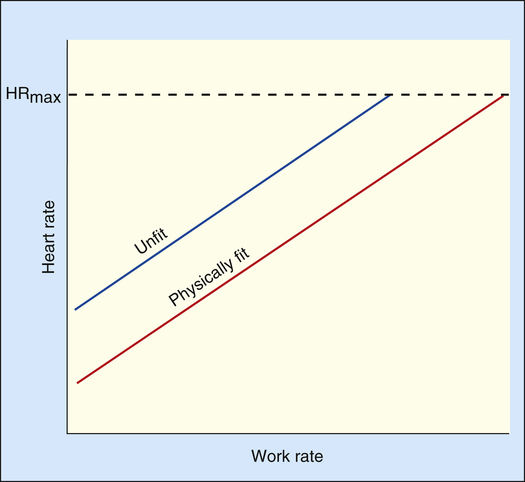
Physically Conditioned versus Physically Unconditioned

At a given work rate, the unconditioned individual has a higher HR than the conditioned person (Figure 23-7). Although the same amount of O2 is required to perform the work, the lower SV of the unconditioned person requires a faster HR. During maximal exercise, determined by HRmax, the unconditioned person has a relatively low work output, cardiac output, oxygen-delivery rate, and  O2max. For these reasons,
  O2max is an indicator of fitness. The average
  O2max of an untrained 20-year-old person is about 40 to 50 mL/min/kg and that of a 60-year-old person is about 28 to 35 mL/min/kg. The
  O2max of highly trained athletes is 1.5 to 1.7 times greater than that of nonathletes.13,15
Physical training programs raise  O2max by increasing the heart’s muscle mass, SV, and cardiac output. Such cardiac hypertrophy and increased pumping effectiveness occur only with aerobic, endurance types of training, not with short, high-energy sprint types of training.2 Training increases the amount of O2 the muscles can extract from the blood, partly because muscle capillary density is increased and distribution of blood flow to working muscles is improved and partly because of an enhanced capacity of trained muscles to use O2.3 At the cellular level, trained muscles have larger and more numerous mitochondria and increased levels of aerobic enzymes; these factors combined with an increased capillary density enhance carbohydrate metabolism and ATP production.3
Physiological Basis for Clinical Exercise Testing
Differentiating Cardiac and Pulmonary Causes of Exercise Intolerance
Cardiopulmonary exercise testing is widely used to distinguish between circulatory and ventilatory exercise limitations.16 Cardiac and pulmonary defects produce their own unique kinds of abnormal test results, allowing the contribution of each system to exercise intolerance to be evaluated.
Cardiac Disease
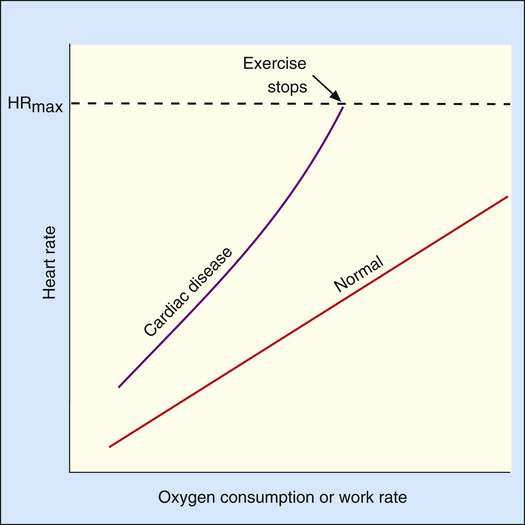
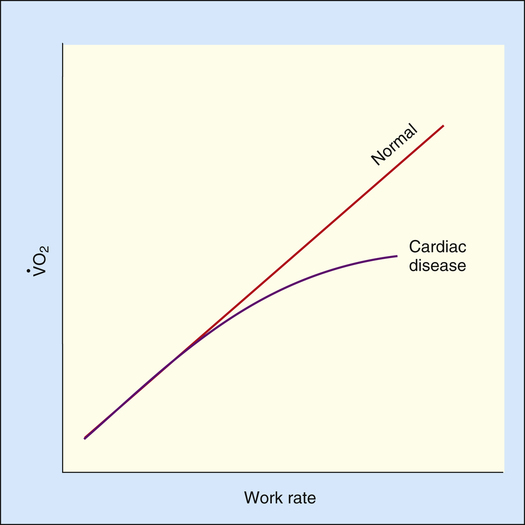
The heart limits exercise when it fails to pump enough blood to meet the body’s O2 needs and the ventilatory reserve is not yet exhausted. Low cardiac output means either HR or SV fail to increase adequately. Most commonly, cardiac diseases limit increases in SV, causing the body to rely on a higher HR to keep pace with increasing O2 requirements. As a result, HR rises at an ever-increasing pace in a nonlinear fashion with respect to  O2; HR is abnormally high for a given cardiac output (Figure 23-8). This produces a low O2 pulse (
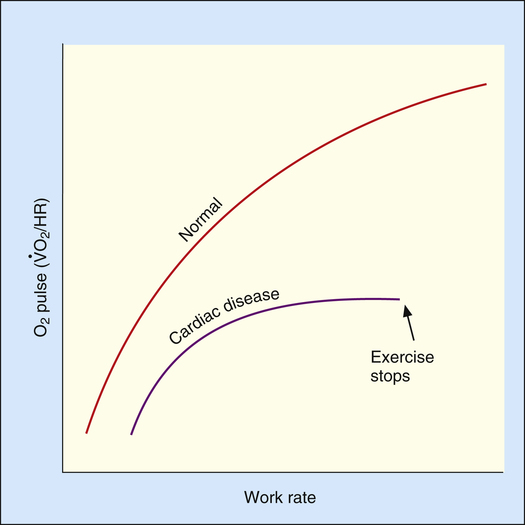
 O2/HR). Because HR increases more rapidly than
  O2 increases, the O2 pulse reaches a maximum value early and plateaus (Figure 23-9). Although cardiac output increases during exercise, it cannot keep pace with increasing tissue O2 needs. This inadequate increase in cardiac output means O2 delivery increases at an inadequate rate, which limits the increase in
  O2. Consequently, the relationship between
  O2 and work rate is not linear, as it is in healthy people (Figure 23-10).1


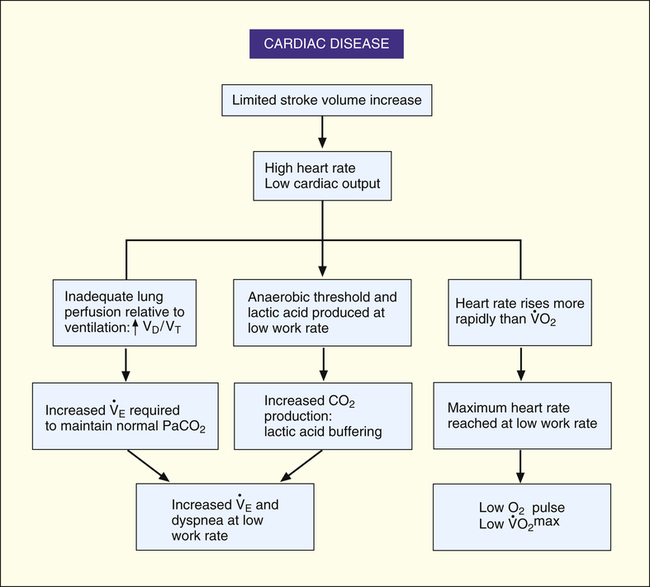
Low cardiac output and O2 delivery cause people to reach anaerobic threshold and generate lactic acid at low work rates. The subsequent buffering of this acid by bicarbonate increases CO2 generation. Consequently,  requirements increase, and the patient develops dyspnea early in exercise. Low cardiac output also reduces pulmonary blood flow with respect to ventilation, increasing alveolar dead space and VD/VT. This further increases the
  required to maintain CO2 homeostasis. Figure 23-11 summarizes the typical consequences of exercise in a patient with cardiac disease.
Pulmonary Disease

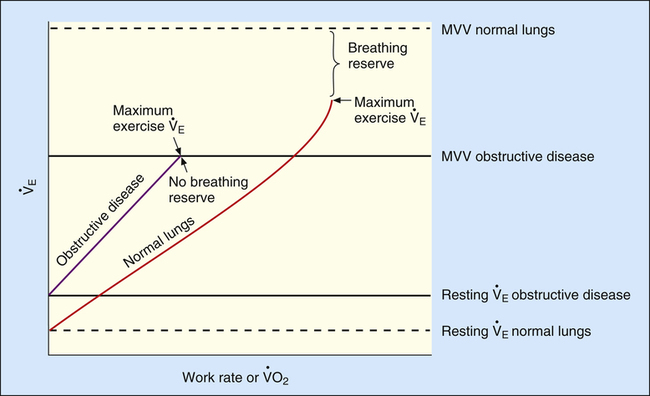
Severe airflow obstruction greatly reduces MVV because high airway resistance slows maximum expiratory flow during rapid respiratory rates. This increased resistance prevents the lungs from emptying to normal resting levels during exercise. As a result, the lungs develop increased end expiratory volumes; this decreases inspiratory capacity (IC), further limiting ventilatory capacity.17 MVV may be so low that it is matched or exceeded by  max.8 Individuals with severe obstruction reach their ventilation limits before they reach their maximum HR or predicted
  O2max. In other words, they are more limited in their ability to eliminate CO2 than in their ability to make O2 available to the tissues. The mechanical pulmonary apparatus simply cannot move air fast enough to satisfy ventilatory demands of exercise.
Abnormal ventilatory mechanics in obstructive disease produces significant ventilation-perfusion ( ) mismatches. Certain lung regions are hypoventilated, whereas others are hyperventilated. In COPD, the degree to which alveolar ventilation is reduced is less than the degree to which dead space ventilation is increased, which results in a greater than normal VD/VT. A greater VD/VT decreases ventilatory efficiency, requiring a higher total
  to maintain a normal
  and CO2 elimination rate. Consequently,
  CO2 and
  O2 are increased. Patients with COPD usually have a higher resting
  than healthy people for the same metabolic rate.18 The higher resting
  combined with a lower MVV leaves less ventilatory reserve available to accommodate the demands of exercise. The BR (MVV −
  max) remaining at maximal exercise is often zero in patients with advanced COPD (Figure 23-12).

Because MVV depends on patient effort and motivation, it is often indirectly estimated from FEV1. Various studies show that MVV in normal subjects and patients with COPD is accurately estimated by the following formula:19–21

If ventilatory capacity alone limits exercise, low breathing reserve and high HR reserve are expected at the point of maximal exercise. Also, a low  O2max is expected because HRmax is not achieved, limiting O2 delivery. VD/VT remains elevated and relatively constant with increasing exercise rather than decreasing, as in normal people.18 (This is manifested as a relatively constant difference between PaCO2 and PETCO2.) A patient with pulmonary limitations stops exercising because of severe dyspnea as BR approaches zero (see Figure 23-12).
During pulmonary-limited exercise, the anaerobic threshold generally occurs in the normal range, about midway between resting  O2 and predicted
  O2max. However, ventilatory capacity may limit obstructed patients so severely that dyspnea prevents them from exercising to levels necessary for anaerobic metabolism.1 Nevertheless, studies show that most patients with COPD reach the anaerobic threshold and develop metabolic acidosis during maximal exercise.18 Abnormal lung mechanics prevent
  from responding adequately to the subsequent decrease in pH and increase in CO2. Consequently, acidosis worsens rapidly after anaerobic metabolism begins.
Depending on the disease severity, PaO2 may increase, remain constant, or decrease with exercise.18 Exercise improves  in some instances (because of improved lung perfusion), increasing the PaO2. A decreasing PaO2 during exercise distinguishes emphysema from chronic bronchitis. Emphysema is characterized by a destruction of the capillary vascular bed. High blood flow during exercise exceeds the alveolar capillary membrane O2 diffusion capacity, causing PaO2 to decrease. PaO2 remains constant or increases with exercise in pure chronic bronchitis because the membrane surface area is not affected in this disease.
Restrictive disease such as pulmonary fibrosis is characterized by a nonuniform distribution of inflammatory scar tissue throughout the alveoli, creating alternating areas of low and normal compliance. Scar tissue may replace the capillary bed in severely involved units or merely thicken the alveolar capillary membrane. The result is a high VD/VT, a reduced surface area for gas exchange, impaired diffusion, and overall low lung compliance. Low lung compliance decreases all lung volumes and capacities, especially IC. The small IC limits the patient’s ability to increase the VT during exercise. Consequently, the breathing rate increases earlier in exercise and to a much greater extent than normal. As a result, the VT/IC ratio increases and approaches 1.0. During maximal exercise in restrictive disease, the breathing rate usually exceeds 50 breaths per minute.1 As with obstructive disease,  max often nearly equals MVV, reducing BR.
As exercise progresses in patients with restrictive diseases, the limited diffusion capacity leads to a decrease in PaO2. This occurs because an increased cardiac output decreases the time that capillary blood is in contact with alveolar gas; there is not enough time for alveolar O2 to diffuse into the capillary blood. As with obstructive disease, dyspnea usually causes the patient to stop exercising before HRmax is reached, lowering the  O2max. Box 23-1 summarizes exercise test abnormalities in patients who have obstructive and restrictive lung diseases.


Exercise Tests and Prescription in Cardiopulmonary Rehabilitation
Depending on the factor that limits exercise, patients may benefit from endurance training, controlled breathing and relaxation exercises, and exercises while breathing supplemental O2.22 For endurance training such as walking or bicycling, exercise intensity should be high enough to produce a HR greater than 60% but less than 80% of the predicted HRmax. About 30 minutes of exercise at this intensity every other day is needed to achieve the classic training effect (i.e., decreased HR for a given submaximal workload). The Karvonen equation is commonly used to compute a target HR range for endurance training in cardiac patients; this method adds from 45% to 85% of the difference between HRmax and resting HR to the resting heart rate as follows:23


Target HR range for endurance training is 92 to 120 beats per minute.
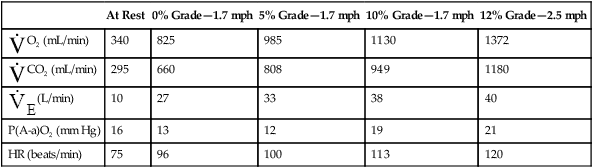
Clinical Focus 23-2 Origin of Exercise Limitation
| At Rest | 0% Grade—1.7 mph | 5% Grade—1.7 mph | 10% Grade—1.7 mph | 12% Grade—2.5 mph | |
 O2 (mL/min) O2 (mL/min) |
340 | 825 | 985 | 1130 | 1372 |
 CO2 (mL/min) CO2 (mL/min) |
295 | 660 | 808 | 949 | 1180 |
 (L/min) (L/min) |
10 | 27 | 33 | 38 | 40 |
| P(A-a)O2 (mm Hg) | 16 | 13 | 12 | 19 | 21 |
| HR (beats/min) | 75 | 96 | 100 | 113 | 120 |


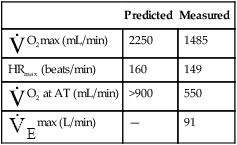
| Predicted | Measured | |
 O2max (mL/min) O2max (mL/min) |
2250 | 1485 |
| HRmax (beats/min) | 160 | 149 |
 O2 at AT (mL/min) O2 at AT (mL/min) |
>900 | 550 |
 max (L/min) max (L/min) |
— | 91 |
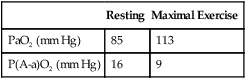
Following are resting versus maximal exercise data:
| Resting | Maximal Exercise | |
| PaO2 (mm Hg) | 85 | 113 |
| P(A-a)O2 (mm Hg) | 16 | 9 |
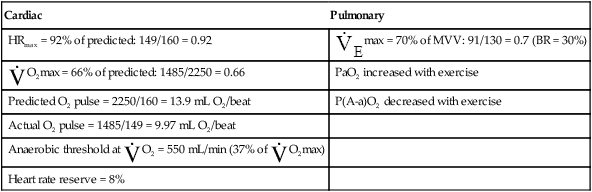
Data relevant to cardiac (see Figure 23-11) and pulmonary function (see Box 23-1) are as follows:
| Cardiac | Pulmonary |
| HRmax = 92% of predicted: 149/160 = 0.92 |  max = 70% of MVV: 91/130 = 0.7 (BR = 30%) max = 70% of MVV: 91/130 = 0.7 (BR = 30%) |
 O2max = 66% of predicted: 1485/2250 = 0.66 O2max = 66% of predicted: 1485/2250 = 0.66 |
PaO2 increased with exercise |
| Predicted O2 pulse = 2250/160 = 13.9 mL O2/beat | P(A-a)O2 decreased with exercise |
| Actual O2 pulse = 1485/149 = 9.97 mL O2/beat | |
Anaerobic threshold at  O2 = 550 mL/min (37% of O2 = 550 mL/min (37% of  O2max) O2max) |
|
| Heart rate reserve = 8% |


It is more accurate to use the actual HRmax obtained from an exercise test rather than the predicted HRmax.23 An alternative, even more accurate method (recommended for both cardiac patients and healthy adults) is based on oxygen consumption reserve ( O2R), which is the difference between
  O2max measured during a stress test and the resting O2 consumption:23


Because people with severe ventilatory limitations may be unable to exercise at intensities required to reach the anaerobic threshold, one might question whether exercise can improve cardiovascular fitness. However, studies of endurance training in patients with varying degrees of ventilatory impairment show improved endurance in all patients, regardless of pulmonary disease severity.24 All patients can experience cardiovascular benefits from cardiopulmonary rehabilitation programs, regardless of lung function. Conversely, habitual aerobic exercise in older, fit adults does not slow the normal functional decline in the aging lung. A study of highly fit adults 67 to 73 years of age revealed normal deterioration rates in  O2max and pulmonary mechanics.25