Ventilation
After reading this chapter, you will be able to:
• Calculate the partial pressures of gases under dry and 100% relative humidity conditions
• Explain how minute ventilation, alveolar ventilation, and dead space ventilation are interrelated
• Determine whether hyperventilation or hypoventilation is present by reviewing the arterial carbon dioxide pressure (PaCO2)
• Explain why alveolar ventilation affects PaCO2
• Explain the rationale underlying the calculation of anatomical dead space, alveolar ventilation, and physiological and anatomical dead space-to-tidal volume ratios
• Predict the effects of minute ventilation changes on alveolar ventilation, dead space ventilation, and PaCO2
• Explain how ventilatory pattern affects dead space-to-tidal volume ratio and, subsequently, alveolar ventilation and PaCO2
• Describe the theoretical basis for measuring and calculating dead space and alveolar ventilation


Partial Pressures of Respiratory Gases
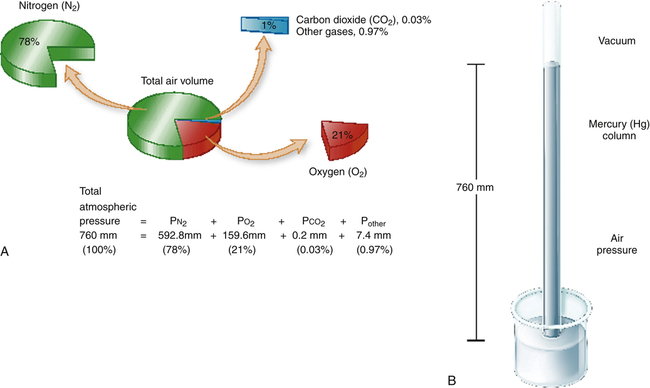
The measurement of respiratory gas pressures must be understood to comprehend the function of the lung as a gas-exchange organ. Air is a gas mixture of mostly nitrogen (N2) and O2, with traces of argon, CO2, and other gases (Figure 4-1, A). The total combined pressure exerted by these atmospheric gases, the barometric pressure (PB), can be measured by a mercury (Hg) barometer, as shown in Figure 4-1, B. At sea level, atmospheric pressure exerts a force equal to the weight of a mercury column 760 mm high. By convention, standard atmospheric pressure at sea level is expressed simply as the height of the mercury column it supports, or 760 mm Hg. (The term torr is equivalent to mm Hg. In this book mm Hg is used.)

The partial pressure of carbon dioxide (PCO2) is similarly calculated:

In physiological calculations, the PCO2 of inspired air is considered to be 0 mm Hg.

Classification of Ventilation
Minute or Total Ventilation


 E is easy to measure but not particularly useful in evaluating the amount of ventilation that participates in gas exchange (respiration) at the alveolar level. Not all the
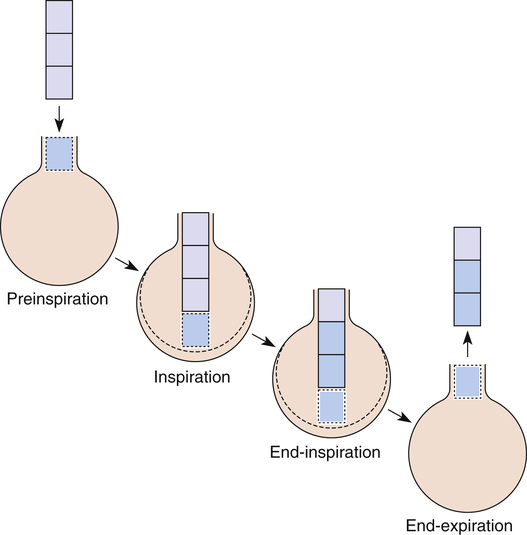
  E reaches the alveoli because the last part of each inspiration (about one third of the VT) stays in the conducting airways and is eliminated with the next expiration (Figure 4-2). Likewise, the first one third of the next inspired VT is reinspired exhaled air; it consists of the air left in the conducting airways from the last exhalation. Thus, only part of the
  E ventilates the alveoli; this part is called alveolar ventilation (
 A). The remaining part ventilates conducting airways, which is called anatomical dead space ventilation (
 Danat).
  E can be expressed in terms of its components (
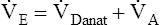 ). This equation can be rearranged to solve for any of its components (
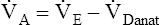 or
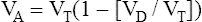
or 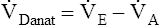 ). A single VT can be similarly expressed (VT = VDanat + VA), where VDanat is anatomical dead space volume and VA is alveolar volume.
Dead Space Ventilation
Anatomical Dead Space
The conducting airways from the mouth and nose down to and including terminal bronchioles constitute anatomical dead space (VDanat). Ventilation of these airways is necessary to move gas to and from the alveoli, but no gas exchange occurs between blood and air across their walls. The fresh gas filling the conducting airways at the end of inspiration (see Figure 4-2, left) is exhaled and is sometimes called “wasted” ventilation because it takes no part in respiration. The term wasted ventilation is synonymous with dead space ventilation. Dead space is defined as airspaces that are ventilated but do not exchange gases with the pulmonary circulation.
Gas Composition of Anatomical Dead Space
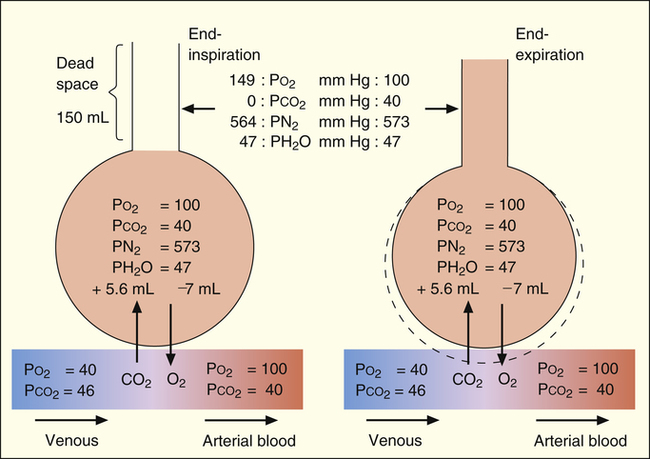
The composition of VDanat gas is different at the end of expiration than at the end of inspiration (Figure 4-3). An inspired VT of 500 mL completely flushes the normal 150 mL of VDanat with atmospheric air, leaving behind a PCO2 of 0 mm Hg and a PO2 of 149 mm Hg (see Figure 4-3, left). Dead space gas is identical in composition to inspired air except that it is 100% humidified. After the 500 mL of VT is completely exhaled, the 150 mL of VDanat (see Figure 4-3, right) is wholly occupied by gas that came from the alveoli. The humidified atmospheric air that occupied the dead space at end-inspiration was exhaled ahead of the alveolar gas (i.e., this gas was wasted because it did not participate in respiration). At end-tidal expiration, dead space gas is identical in composition to the average alveolar gas composition. Under normal circumstances, end-tidal expiratory gas is assumed to be identical in composition to alveolar gas.
Measuring Anatomical Dead Space
VDanat is related to lung size; in normal adults, anatomical dead space is approximately 1 mL per pound of ideal body weight.1 The Fowler technique provides a more precise measurement of VDanat (Figure 4-4).2 In the Fowler technique, the subject first exhales maximally to residual volume (RV), then takes a maximal inhalation of 100% O2 to total lung capacity, then exhales maximally to RV again. This technique is based on the fact that air is a mixture of N2 and O2. An N2 analyzer is used to measure continuously the exhaled N2 concentration at the mouth after the single maximal inspiration of 100% O2. N2 concentration measured at the mouth decreases abruptly to 0 during the 100% O2 inspiration (see Figure 4-4). At the end of inspiration, VDanat contains pure O2, which is the first gas to be exhaled. This means that N2 concentration remains at 0% for the first part of the expiration.
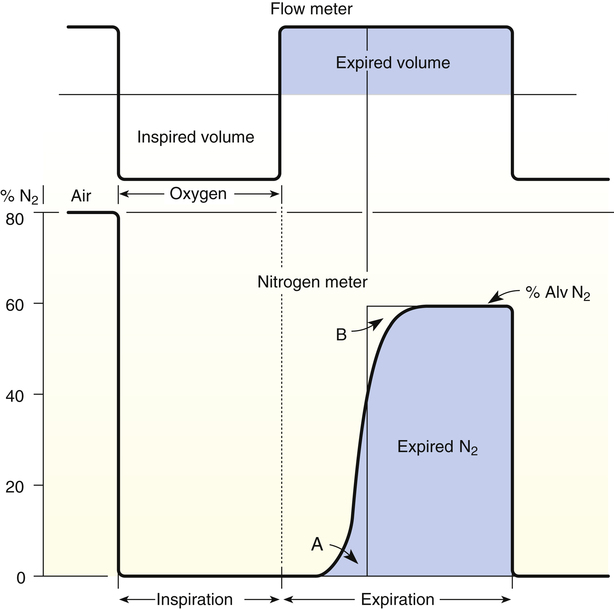
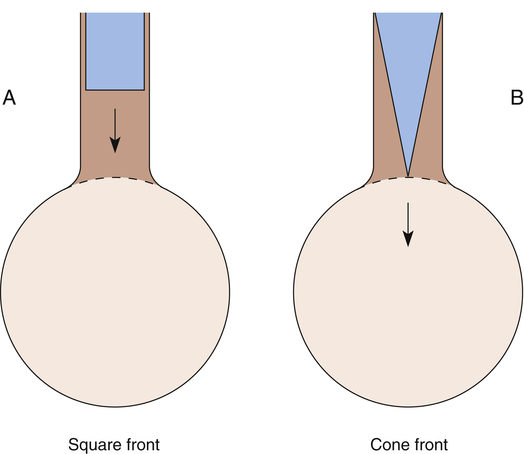
As expiration proceeds, alveolar gas (which still contains some N2) moves up into the conducting airways, and dead space N2% gradually increases to alveolar levels—note the S-shaped curve in Figure 4-4. The increase in N2% would be sharp and abrupt if dead space and alveolar gas were completely separated, as illustrated by the hypothetical square front in Figure 4-5, A. If this were the case, N2% would remain at 0% until all dead space gas was expired, and then it would abruptly increase to alveolar levels when alveolar gas suddenly appeared, as shown by the theoretical thin, solid vertical line in Figure 4-4. VDanat would simply be the volume exhaled to the sharp increase in N2%. However, alveolar gas moves through conducting airways in a conical rather than square front (see Figure 4-5, B), mixing with dead space gas. This movement makes it difficult to detect the exact point at which only the VDanat has been expired. It is necessary to construct a line representing the theoretical square front that would be seen if all N2-free dead space gas were expired first, followed by only N2-containing alveolar gas. The hypothetical square front is constructed by placing a vertical line (see Figure 4-4) such that area A equals area B (i.e., in effect, the vertical line averages alveolar and dead space gas compositions). The dead space volume is the volume expired up to the hypothetically constructed square front.


Alveolar Ventilation


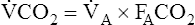
All CO2 in exhaled gas comes from ventilated alveoli that have blood flowing through their capillaries. The source of this CO2 is tissue metabolism. Normal aerobic metabolism produces CO2, which is carried by venous blood to the lungs (see Figure 4-3). The mixed venous PCO2 (P CO2) approaching the alveoli is several millimeters of mercury higher than PACO2. Thus, CO2 diffuses into the alveoli.
Inspiration brings fresh CO2-free gas into the alveoli, and expiration removes a portion of the CO2-rich alveolar gas (see Figure 4-3). The balance between metabolic CO2 production per minute ( CO2) and its rate of elimination (
 A) determines the PCO2 of alveolar gas and the PCO2 of the blood leaving the lung.


Hyperventilation and Hypoventilation
If  A momentarily removes more CO2 per minute than is metabolically produced, alveolar and blood PCO2 decrease, and a state of hyperventilation exists. Similarly, if
  A momentarily removes less CO2 than the body produces, alveolar and blood PCO2 increase, and a state of hypoventilation exists. Normally, alveolar gas and blood PCO2 values equilibrate as blood flows past alveoli and enters the left ventricle. As Figure 4-3 shows, arterial blood arising from the left ventricle has the same PCO2 as the alveoli (PACO2 = PaCO2).


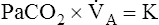
Alveolar Ventilation and PACO2
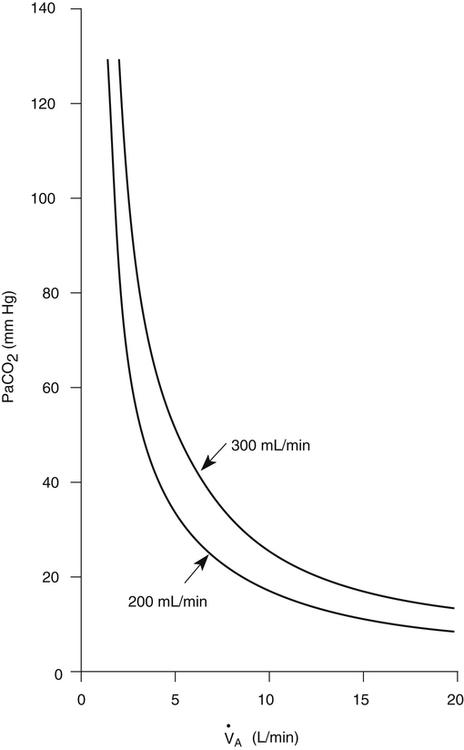
PACO2 is inversely related to 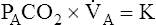
 A; if
A; if  A is reduced by half, PACO2 doubles. If
  A doubles, PACO2 (and PaCO2) is reduced by half. For example, if a
  A of 5 L per minute produces a PACO2 of 40 mm Hg, a
  A of 10 L per minute produces a PACO2 of 20 mm Hg. Similarly, a
  A of 2.5 L per minute produces a PACO2 of 80 mm Hg. The
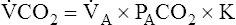
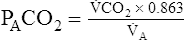
  A equation illustrates this relationship ().3 In this equation, K is a constant. (See Appendix III for the derivation of this equation.) This equation is based on the assumption that during a steady state of blood flow and ventilation, CO2 production (
 CO2) is constant and equal to CO2 elimination. Normally, PACO2 and PaCO2 have almost identical values; as a rule,
  A has the same relationship with PaCO2 as it has with PACO2. Figure 4-6 illustrates the inverse relationship between PaCO2 and
  A
A

PCO2 Equation


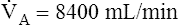
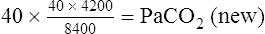
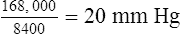
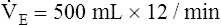
Clinical Focus 4-2 Predicting the Change in PACO2 for a Given Change in Minute Ventilation


Initial  E and
E and  A are calculated as follows:


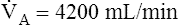
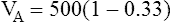
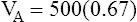
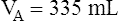
Because VDanat remains the same at 160 mL,  A must decrease. This is shown as follows:

After the change in respiratory rate, arterial blood gases reveal a PaCO2 increase from 40 mm Hg to 49 mm Hg (see Clinical Focus 4-4). CO2 production remained the same, and the reduced  A resulted in a decreased removal of CO2 from the body, creating a state of hypoventilation.
 A is measured in liters per minute, and PACO2 is measured in millimeters of mercury (see Appendix III for the derivation of K). Equation 2 can be solved for PACO2 as follows:
In this equation, 1/K is equal to 0.863. The classic PCO2 equation is written as follows:
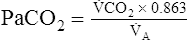
Equation 5 means that the balance between the rate of CO2 elimination ( A) and the rate of CO2 production (
 CO2) determines the PaCO2. For example, under normal resting conditions, the body produces about 200 mL of CO2 each minute, and alveolar ventilation is about 4 L per minute; using equation 5, PaCO2 is calculated to be about 43 mm Hg. If
  A decreases to 3 L per minute while
  CO2 stays the same, PaCO2, as calculated with equation 5, would increase to about 58 mm Hg, indicating the presence of hypoventilation. If instead the metabolic rate increases, increasing CO2 production to 300 mL per minute, but
  A stays at 4 L per minute, PaCO2 increases to 65 mm Hg, again indicating hypoventilation. In the latter example, the lungs fail to increase
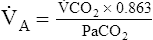
  A to meet the increased need for CO2 elimination. (See Appendix III for the complete derivation of equation 5 and the 0.863 factor.) Equation 5 also can be solved for
  A; if the PaCO2 and
  CO2 are known,
  A can be calculated as follows:


Ratio of Dead Space to Tidal Volume
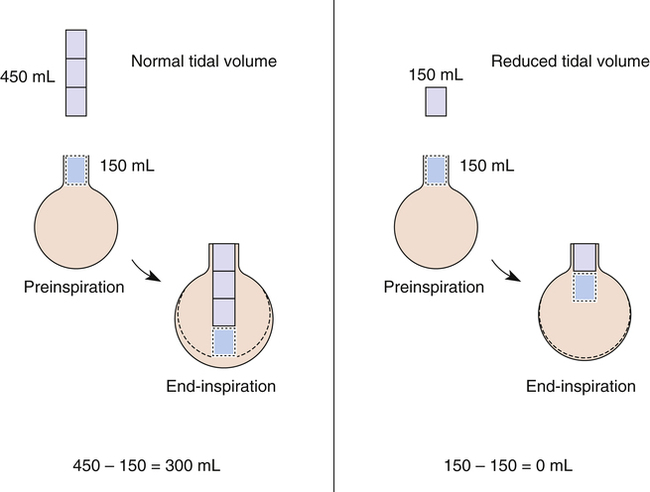
 A can be calculated if the fraction of VT that is dead space (VD/VT) is known. Normally, about 30% to 40% of the inspired VT remains in conducting airways, never reaching alveoli (see Figure 4-2, left), which means
  D constitutes about 30% to 40% of
  E.3 It follows that about 60% to 70% of the
  E is
E is  A. Shallow tidal volumes increase VD/VT because conducting airway volume (VDanat) remains constant (see Figure 4-2, right). Deep breaths decrease VD/VT for the same reason, causing a larger percentage of the inspired volume to reach the alveoli.

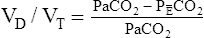
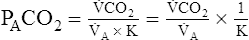
In this equation,  is the mean carbon dioxide pressure of mixed-expired gas (dead space plus alveolar gas). (See Appendix III for the derivation of the Bohr equation.)
The Bohr equation is based on the premise that all CO2 in mixed-expired gas originates from the alveoli and not the dead space. Figure 4-7 illustrates this point; the lightly shaded blocks represent CO2-free inspired air, and the darkly shaded blocks represent CO2-containing alveolar gas. The CO2 in exhaled gas (two dark blocks) comes from the alveoli; dead space gas, which contains no CO2 (one light block), makes up the rest of the exhaled volume.
 is always less than PACO2 because the exhaled VT consists of VDanat gas, which has a PCO2 of 0 mm Hg, mixed with alveolar gas (Figure 4-8). The degree to which VDanat gas reduces the PCO2 of mixed expired gas is reflected by the size of the difference between PACO2 and
  . This difference is proportional (
 ) to VDanat (see Figure 4-8), shown as follows:
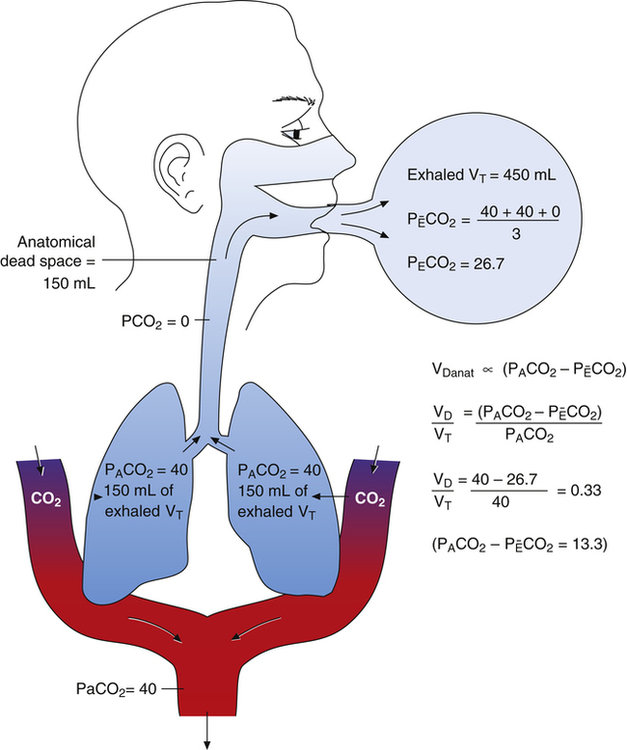


In Figure 4-8, two thirds of the exhaled VT originates from alveoli (PACO2 of 40 mm Hg), and one third originates from VDanat (PCO2 of 0), yielding a mixed-expired PCO2 of 26.7 mm Hg. The Bohr equation confirms that VD/VT is 0.33 (i.e., that VDanat is one third of VT). The  difference in the numerator of the Bohr equation reflects only the presence of VDanat. It does not accurately reflect the presence of VDA. As illustrated in Figure 4-9, if some alveoli lose their blood flow, the PCO2 values hypothetically decrease to 0, causing average PACO2 to decrease also. (Average PACO2 is measured through an analysis of the gas stream at end-expiration.) Mixed-expired gas in Figure 4-9 contains anatomical plus alveolar dead space gas, causing
  to decrease to 13.3 mm Hg. (Compare Figures 4-8 and 4-9.) If alveolar dead space is present, and the
  difference is improperly used in the numerator of the Bohr equation, the calculated VD/VT is 0.34 (see Figure 4-9), essentially the same as in Figure 4-8, where no VDA is present. However, if the
  difference is used in the Bohr equation, the physiological, or total, dead space can be calculated. This form of the Bohr equation takes into account both VDA and VDanat4 The term (
 ) should be used with the Bohr equation in the clinical setting because the size of this difference is directly proportional to the total VD. This is shown as follows:
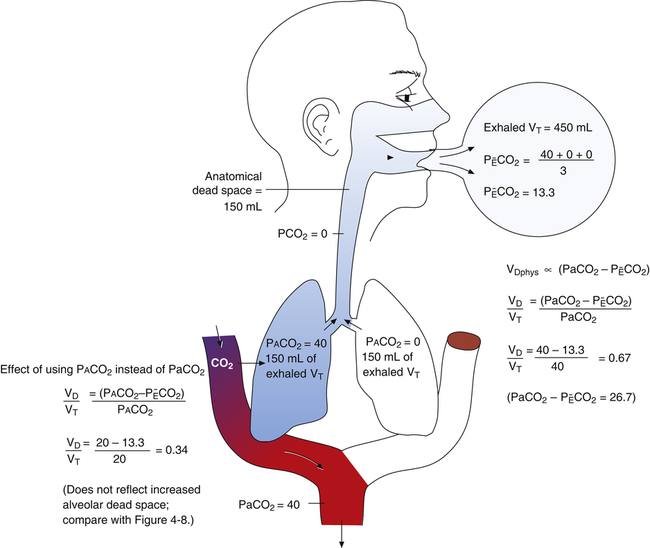
 difference is directly proportional to physiological dead space (VDanat plusVDA).
Figure 4-9 illustrates the Douglas bag method for clinically measuring the mixed-expired gas in determining VD/VT. The person’s expired gas is collected over several minutes in a large, previously airless balloon (Douglas bag). An arterial blood sample is obtained at the same time. Mixed-expired and PaCO2 values are used in the Bohr dead space equation. (The Douglas bag is no longer used clinically, but it is used in this example to illustrate the concept.)


Ventilatory Pattern, Dead Space, and Alveolar Ventilation
The rate and depth of ventilation affect  A and VD/VT. Figure 4-10 illustrates that
  E is an unreliable indicator of
  A. In parts A, B, and C, VDanat and
  E are identical. (
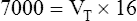
 E is 8000 mL per minute and VDanat is 150 mL in each instance.) Figure 4-10, B, represents a normal VT and respiratory rate.
  D is the product of respiratory frequency and VD (
 D = VD × f).
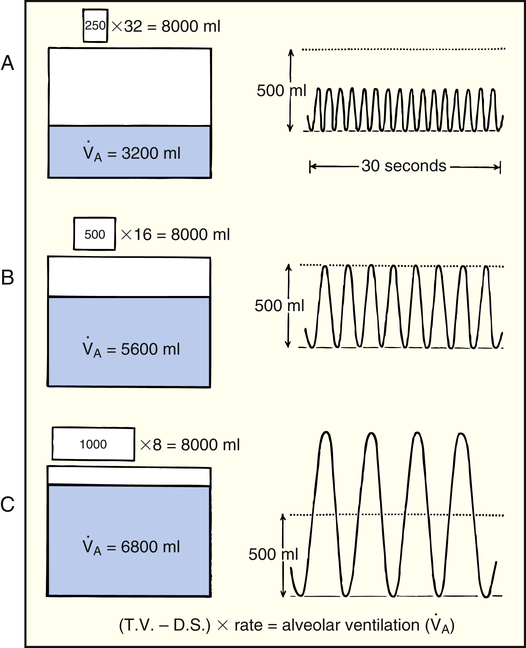


In Figure 4-10, B,  D equals 16 multiplied by 150, or 2400 mL per minute. The
  A of 5600 mL per minute is equal to
  E −
E −  D (8000 − 2400 = 5600 mL/min). For the following discussion, it is assumed that this
  A maintains a normal PaCO2 of 40 mm Hg, representing neither hyperventilation nor hypoventilation. Figure 4-10, A, illustrates the inefficiency of rapid (tachypnea), shallow (hypopnea) breathing. The lung still achieves a
  E of 8000 mL per minute, but
  D necessarily increases (
 D = 32 × 150 = 4800 mL/min, compared with a
  D of 2400 mL per minute in B). This leaves only 3200 mL per minute for
  A compared with 5600 mL per minute in B. VD/VT increases also; in Figure 4-10, B, it is 150/500, which equals 0.3, and it is 150/250 or equal to 0.6 in part A. In Figure 4-10, B, 70% of the
  E is involved in alveolar gas exchange, whereas only 40% is similarly involved in part A. Rapid, shallow breathing is a common signal of respiratory distress and possible ventilatory failure.
Figure 4-10, C, illustrates a slow (bradypnea), deep (hyperpnea) breathing pattern that also achieves a  E of 8000 mL per minute. Because VDanat is constant, all the additional VT enters alveoli, increasing
  A.
A.  D is only 8 × 150, which equals 1200 mL per minute, leaving 6800 mL per minute for
  A. VD/VT is 150/1000 or equal to 0.15, meaning 85% of
  E participates in gas exchange. Slow, deep breathing is the most efficient ventilatory pattern in terms of the fraction of
  E received by alveoli.
Clinical Focus 4-4 Predicting the Effect of Changes in Alveolar Ventilation on Arterial Pressure of Carbon Dioxide
You also have the following information about your patient: