Ventilation
After reading this chapter you will be able to:
 Describe the physiologic functions provided by ventilation.
 Describe the pressure gradients responsible for gas flow, diffusion, and lung inflation.
 Identify the forces that oppose gas movement into and out of the lungs.
 Describe how surface tension contributes to lung recoil.
 Describe how lung, chest wall, and total compliance are related.
 State the factors that affect resistance to breathing.
 Describe how various lung diseases affect the work of breathing.
 State why ventilation is not evenly distributed throughout the lung.
 Describe how the time constants affect alveolar filling and emptying.
 Identify the factors that affect alveolar ventilation.
 State how to calculate alveolar ventilation, dead space, and the VD/VT ratio.
Mechanics of Ventilation
Normal ventilation is a cyclic activity that has two phases: inspiration and expiration. During each cycle, a volume of gas moves in and out of the respiratory tract. This volume, measured during either inspiration or expiration, is called the tidal volume (VT). The normal VT refreshes the gas present in the lung removing CO2 and supplying O2 to meet metabolic needs. The VT must be able to meet changing metabolic demands, such as during exercise or sleep. The vital capacity and its subdivisions provide the necessary reserves for increasing ventilation (see Chapter 19).
< ?xml:namespace prefix = "mml" />
Pressure = Force generated by the respiratory muscles or a mechanical ventilator, or both, during inspiration
Volume = Volume change (e.g., VT)
Elastance = Distensibility of the lungs and thorax (Δpressure/Δvolume); elastance is the reciprocal of compliance (Δvolume/Δpressure)
Resistance = Airflow and tissue resistance (Δpressure/Δflow)
Pressure Differences During Breathing
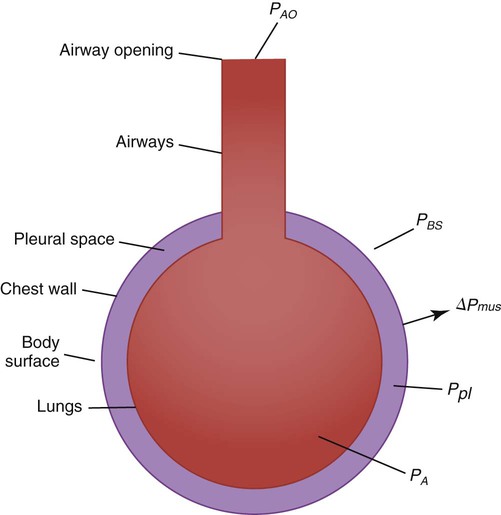
The equation of motion is a mathematical model describing the behavior of a graphic model of the lungs. The graphic model is shown in Figure 10-1.1 The model lumps all the resistive properties of the many airways into a single flow-conducting tube and lumps all the elastic properties of the alveoli and airways into a single elastic compartment. Surrounding the “lungs” is another elastic compartment representing the chest wall. This graphic representation of the respiratory system allows us to define points in space where pressures may be measured (or inferred) as defined in Table 10-1. Mathematical models relating pressure, volume, and flow corresponding to this graphic model are constructed using pressure differences between the points. The various components of the graphic model are defined as everything that exists between these points in space. The respiratory system is everything that exists between the pressure measured at the airway opening (PAO) and the pressure measured at the body surface (PBS). The associated pressure difference is transrespiratory pressure (PTR):
TABLE 10-1
Measurable Pressures Used in Describing Respiratory System Mechanics
| Name | Symbol | Definition |
| Pressure at the airway opening | PAO | Pressure measured at the opening of the respiratory system airway (e.g., mouth and nose, tracheostomy opening, and distal end of endotracheal tube) |
| Pleural pressure | Ppl | Pressure measured in the pleural space, changes in which are often estimated by measuring pressure changes in the esophagus |
| Alveolar pressure | PA | Pressure in the alveolar (gas space) region of the lungs |
| Body surface pressure | PBS | Pressure measured at the body surface |
Sometimes it is useful to define transthoracic pressure difference (PTT) as:
Table 10-2 summarizes these equations.
TABLE 10-2
Pressure Differences Used in Describing Respiratory System Mechanics
| Definition | Name | Symbol |
| PAO − PBS | Transrespiratory pressure difference | ΔPTR |
| PAO − PA | Transairway pressure difference | ΔPTAW |
| PAO − Ppl | Transpulmonary pressure difference | ΔPTP |
| PA − Ppl | Transalveolar pressure difference | ΔPTA |
| PA − PBS | Transthoracic pressure difference | ΔPTT |
| Ppl − PBS | Trans–chest wall pressure difference | ΔPTCW |
| Global muscle pressure difference | ΔPmus |
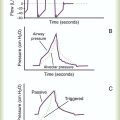
Pleural pressure continues to decrease until the end of inspiration. Alveolar filling slows when alveolar pressure approaches equilibrium with the atmosphere, and inspiratory flow decreases to zero (Figure 10-2). At this point, called end-inspiration, alveolar pressure has returned to zero, and the intrapleural pressure—and hence transpulmonary pressure gradient—reaches the maximal value (for a normal breath) of approximately 10 cm H2O.

Forces Opposing Inflation of the Lung
Elastic Opposition to Ventilation
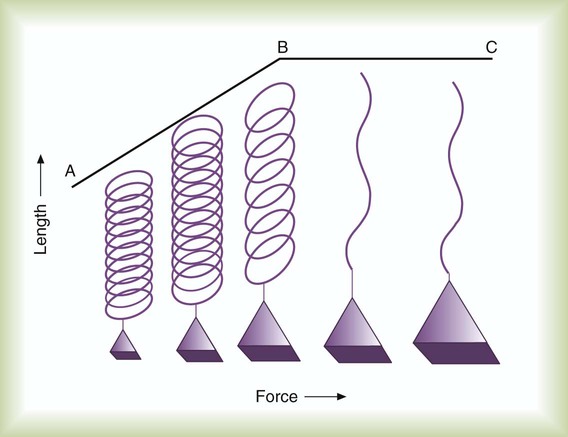
Elastin and collagen fibers are found in the lung parenchyma. These tissues give the lung the property of elasticity. Elasticity is the physical tendency of an object to return to an initial state after deformation. When stretched, an elastic body tends to return to its original shape. The tension developed when an elastic structure is stretched is proportional to the degree of deformation produced (Hooke’s law). An example is a simple spring (Figure 10-3). When tension on a spring is increased, the spring lengthens. However, the ability of the spring to stretch is limited. When the point of maximal stretch is reached, further tension produces little or no increase in length. Additional tension may break the spring.
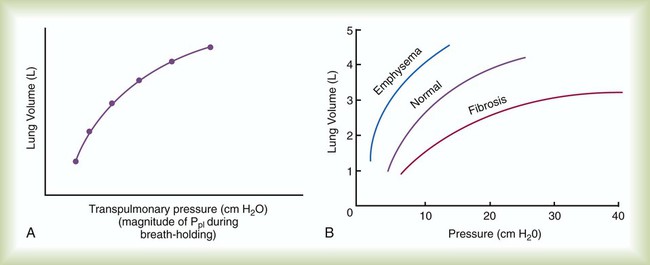
In the respiratory system, inflation stretches tissue. The elastic properties of the lungs and chest wall oppose inflation. To increase lung volume, pressure must be applied. This property may be shown by subjecting an excised lung to changes in transpulmonary pressure and measuring the associated changes in volume (Figure 10-4). To simulate the pressures during breathing, the lung is placed in an airtight jar. The force to inflate the lung is provided by a pump that varies the pressure around the lung inside the jar, simulating Ppl. This action mimics the pleural pressure changes associated with thoracic expansion and contraction. The changes in transpulmonary pressure are made in discrete steps, allowing the lungs to come to rest in between so that all of the applied pressure opposes elastic forces and none of it opposes resistive forces (i.e., flow is zero when the measurements are made). The amount of stretch (inflation) is measured as volume by a spirometer. Changes in volume resulting from changes in transpulmonary pressure are plotted on a graph.
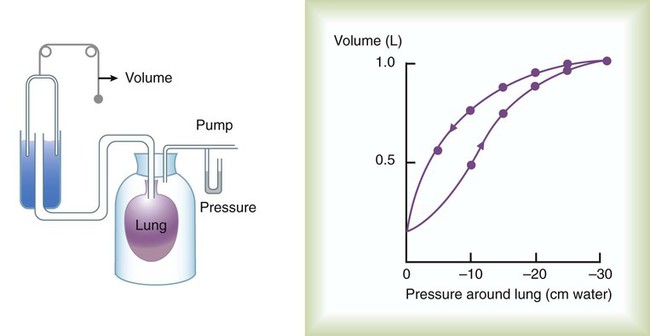
During inspiration in this model, increasingly greater negative pleural pressures are required to stretch the lung to a larger volume. As the lung is stretched to its maximum (total lung capacity [TLC]), the inflation “curve” becomes flat. This flattening indicates increasing opposition to expansion (i.e., for the same change in transpulmonary pressure, there is less change in volume).2
As with a spring when tension is removed, deflation occurs passively as pressure in the jar is allowed to return toward atmospheric. Deflation of the lung does not follow the inflation curve exactly. During deflation, lung volume at any given pressure is slightly greater than it is during inflation. This difference between the inflation and deflation curves is called hysteresis.2 Hysteresis indicates that factors other than simple elastic tissue forces are present. The major factor, particularly in sick lungs, is the opening of collapsed alveoli during inspiration that tend to stay open during expiration until very low lung volumes are reached.

Expressed in terms of compliance:
Surface Tension Forces
Part of the hysteresis exhibited by the lung is a result of surface tension forces in the alveoli. If a lung is filled with fluid such as saline, the pressure-volume curves look much different than the pressure-volume curves of an air-filled lung (Figure 10-5). Less pressure is needed to inflate a fluid-filled lung to a given volume. This phenomenon indicates that a gas-fluid interface in the air-filled lung changes its inflation-deflation characteristics.
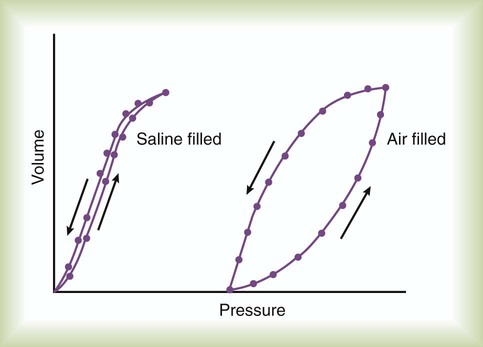
The recoil of the lung is a combination of tissue elasticity and these surface tension forces in the alveoli. During inflation, additional pressure is needed to overcome surface tension forces. During deflation, surface tension forces are reduced, resulting in altered pressure-volume characteristics (i.e., the leftward shift seen in Figure 10-4). In the intact lung (i.e., within the chest), the volume history also affects the degree of hysteresis that occurs. Factors such as the initial volume, the tidal excursion, and whether the lungs have been previously inflated or deflated help determine the volume history and the shape of the pressure-volume curves of the lung.
 Problem
A phospholipid called pulmonary surfactant reduces surface tension in the lung. Alveolar type II cells probably produce pulmonary surfactant (see Chapter 8). In contrast to typical surface-active agents, pulmonary surfactant changes surface tension according to its area.3 The ability of pulmonary surfactant to reduce surface tension decreases as surface area (i.e., lung volume) increases. Conversely, when surface area decreases, the ability of pulmonary surfactant to reduce surface tension increases. This property of changing surface tension to match lung volume helps stabilize the alveoli. Any disorder that alters or destroys pulmonary surfactant can cause significant changes in the work of distending the lung.
Lung Compliance
A graph of change in lung volume versus change in transpulmonary pressure (Figure 10-6, A) is the compliance curve of the lungs. Figure 10-6, B compares a normal lung compliance curve with curves that might be observed in patients who have emphysema (obstructive lung disease) or pulmonary fibrosis (restrictive lung disease). The curve from a patient with emphysema is steeper and displaced to the left. The shape and position of this curve represent large changes in volume for small pressure changes (increased compliance). Increased compliance results primarily from loss of elastic fibers, which occurs in emphysema. The lungs become more distensible so that the normal transpulmonary pressure results in a larger lung volume. The term hyperinflation is used to describe an abnormally increased lung volume. A distinctly opposite pattern is seen in pulmonary fibrosis. Interstitial fibrosis is characterized by an increase in connective tissue. The compliance curve of a patient with pulmonary fibrosis is flatter than the normal curve, shifted down and to the right. As a result, there is a smaller volume change for any given pressure change (decreased compliance). Consequently, the lungs become stiffer, usually with a reduced volume.
Chest Wall Compliance
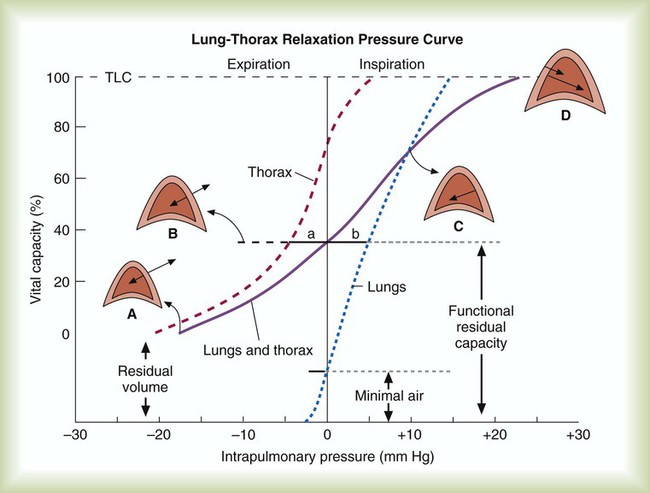
Inflation and deflation of the lung occur with changes in the dimensions of the chest wall (see Chapter 8). The relationship between the lungs and the chest wall can be illustrated by plotting their relaxation pressure curves separately and combined (Figure 10-7). In the intact thorax, the lungs and chest wall recoil against each other. The point at which these opposing forces balance determines the resting volume of the lungs, or functional residual capacity. This is also the point at which alveolar pressure equals atmospheric pressure. The normal FRC is approximately 40% of the TLC. If the normal lung–chest wall relationship is disrupted, the lung tends to collapse to a volume less than the FRC, and the thorax expands to a volume larger than the FRC.
 Rule of Thumb
Inhalation occurs when the balance between the lungs and chest wall shifts. Energy from the respiratory muscles (primarily the diaphragm) overcomes the contractile force of the lungs. At the beginning of the breath, the tendency of the chest wall to expand facilitates lung expansion. When lung volume nears 70% of the vital capacity, the chest wall reaches its natural resting level. To inspire to a lung volume greater than about 70% of TLC, the inspiratory muscles must overcome the recoil of both the lungs and the chest wall (see Figure 10-7).
For exhalation, potential energy “stored” in the stretched lung (and chest wall at high volumes) during the preceding inspiration causes passive deflation. To exhale below the resting level (FRC), muscular effort is required to overcome the tendency of the chest wall to expand. The expiratory muscles (see Chapter 8) provide this energy.
Airway Resistance
 is flow, PAO is pressure at the airway opening, and PA is alveolar pressure.
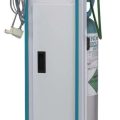
Raw in nonventilated patients is usually measured in a pulmonary function laboratory (see Chapter 19). Flow ( ) is measured with a pneumotachometer. Alveolar pressures are determined in a body plethysmograph, an airtight box in which the patient sits. By momentarily occluding the patient’s airway and measuring the pressure at the mouth, alveolar pressure can be estimated (i.e., mouth pressure equals alveolar pressure under conditions of no flow). By relating flow and alveolar pressure to changes in plethysmograph pressure, airway resistance can be calculated.
 Problem
Factors Affecting Airway Resistance
Poiseuille’s law (see Chapter 6) defines laminar flow through a smooth, unbranched tube of fixed dimensions (i.e., length and radius). The pressure required to cause a specific flow of gas through a tube is calculated as follows:

 = Gas flow (ml/sec)
 Rule of Thumb
Another way to express the relationship between pressure and flow is as follows:

Under certain conditions, gas flow through a tube changes significantly. The orderly pattern of concentric layers is no longer maintained. Gas molecules form irregular currents. This pattern is called turbulent flow. Transition from laminar to turbulent flow depends on the following factors: gas density (d), viscosity (h), linear velocity (v), and tube radius (I). Table 10-3 compares changes in flow and pressure resulting from laminar and turbulent flow.
TABLE 10-3
Comparison of Driving Pressures, Laminar versus Turbulent Flow
| Flow | Laminar | Turbulent |
| 1 | 1 | 1 |
| 2 | 2 | 4 |
| 4 | 4 | 16 |
| 8 | 8 | 64 |
| 16 | 16 | 256 |
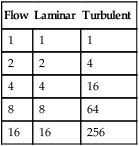
Values are nondimensional units showing proportional effect.
 Rule of Thumb
Distribution of Airway Resistance
Branching of the tracheobronchial tree increases the cross-sectional area with each airway generation (Figure 10-8). As gas moves from the mouth to the alveoli, the combined cross-sectional area of the airways increases exponentially (see Chapter 8). According to the laws of fluid dynamics, this increase in cross-sectional area causes a decrease in gas velocity. The decrease in gas velocity promotes a laminar flow pattern, particularly in smaller (i.e., <2 mm) airways.
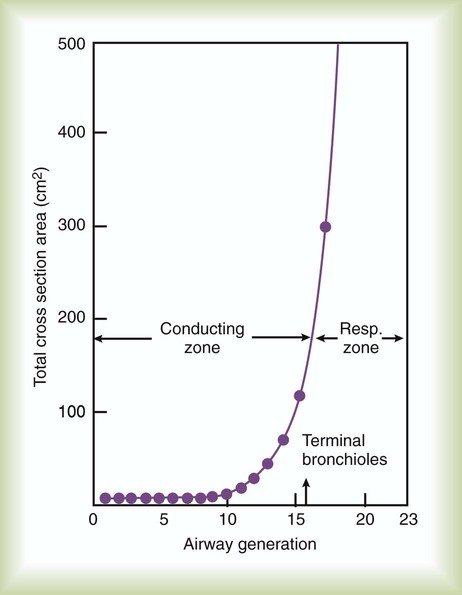
Turbulent flow predominates in the mouth, trachea, and primary bronchi (Table 10-4). Gas velocity is high in the bigger airways, favoring turbulent flow patterns. At the level of the terminal bronchioles, the cross-sectional area increases more than 30-fold. Gas velocity is very low here. In normal small airways, flow is laminar. The driving pressure across these airways is less than 1% of the total driving pressure for the system.
TABLE 10-4
Distribution of Airway Resistance
| Location | Total Resistance (%) |
| Nose, mouth, upper airway | 50 |
| Trachea and bronchi | 30 |
| Small airways (<2 mm) | 20 |
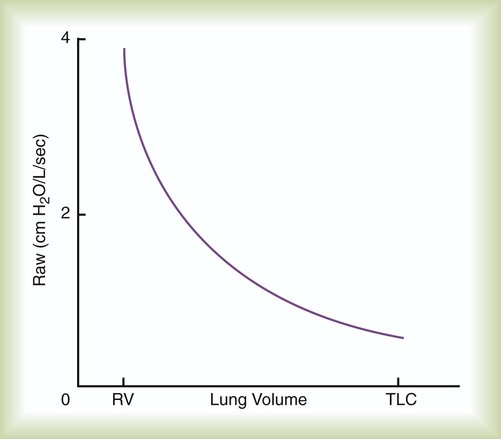
The diameter of the airways is not constant. During inspiration, the stretch of surrounding lung tissue and widening transpulmonary pressure gradient increase the diameter of the airways. The higher the lung volume, the more that these factors influence airway caliber (Figure 10-9). The increase in airway diameter with increasing lung volume decreases airway resistance. As lung volume decreases toward residual volume, airway diameters also decrease; this explains why wheezing (see Chapter 15) is most often heard during exhalation. Airway resistance increases dramatically at low lung volumes.
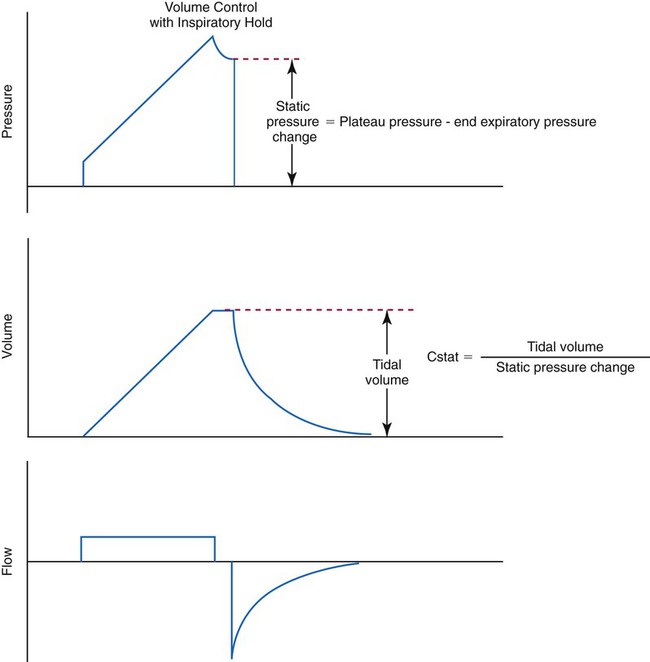
Static Versus Dynamic Mechanics
Resistance and compliance can be evaluated under static or dynamic conditions.4 The term static implies that flow throughout the respiratory system has ceased and all ventilatory muscle activity is absent (Pmus = 0). Static conditions can be imposed with an inspiratory pause when a patient is sedated and being mechanically ventilated. In contrast, the term dynamic means that flow at the airway opening is zero. Mechanics are evaluated under dynamic conditions, for example, when a nonintubated patient breathes spontaneously. In this case, the pressure difference used to calculate lung resistance and elastance is PTP, and the driving pressure is Pmus instead of the ventilator.
In a single-compartment model (see Figure 10-1), estimation of resistance and compliance under static and dynamic conditions yields the same values. However, in a real respiratory system, composed of multiple compartments with different time constants (each compartment being a resistance in series with a compliance), mechanics estimated during static conditions yield different values than when evaluated during dynamic conditions. For a multiple-compartment system, when flow is zero at the airway opening, there may still be flow between compartments (pendelluft). As a result, dynamic mechanics become dependent on the respiratory frequency.5,6 Typically, both compliance and resistance decrease as frequency increases.
 (t) is flow as a function of time. Usually P is either transrespiratory pressure difference or transpulmonary pressure difference. Because only one pressure difference can be measured, the effect of compliance has to be separated out from the effect of resistance.
 (1) = 0 and
  (2) = 0, Δ
 = 0 − 0 = 0, and the equation of motion simplifies to:
Rearranging this equation gives the equation for compliance:

To calculate resistance, we use a similar logic and eliminate the term ΔV/C by selecting two points in time when volumes are equal (i.e., V at time 1 equals V at time 2) so that ΔV = V(2) − V(1) = 0. In this case, we cannot select the two times as the beginning and end of inspiration because the flow term would be zero. Typically, times corresponding to midinspiration are chosen for dynamic conditions (when doing calculations by hand),7 and the beginning and end of an inspiratory pause are chosen for static conditions:
Rearranging this equation gives:

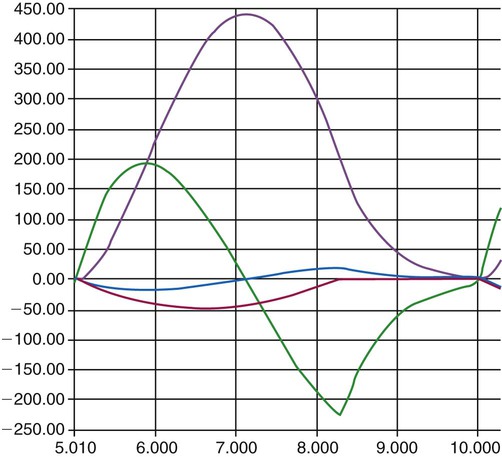
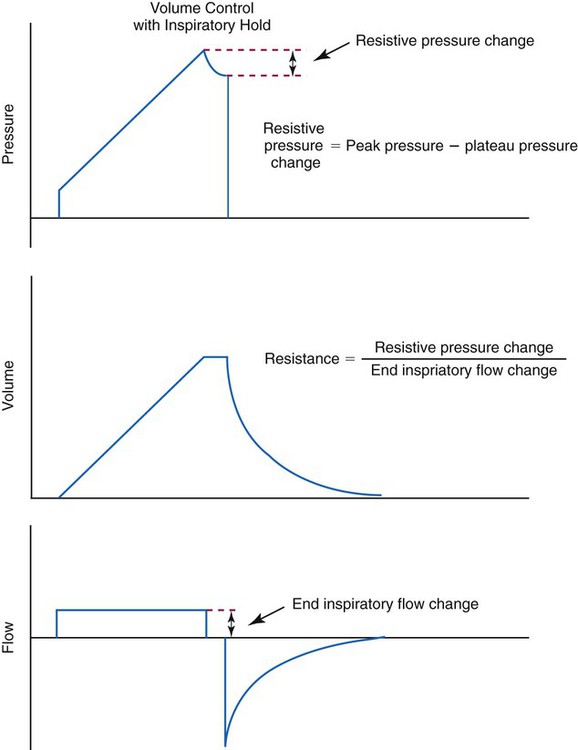
Many intensive care ventilators are capable of evaluating static mechanics when an inspiratory pause is set during volume control ventilation with constant inspiratory flow. The pressure, volume, and flow waveforms that result and the associated calculations are shown in Figures 10-10 and 10-11. When mechanics are calculated under dynamic conditions, estimates for resistance and compliance are calculated using linear regression.8
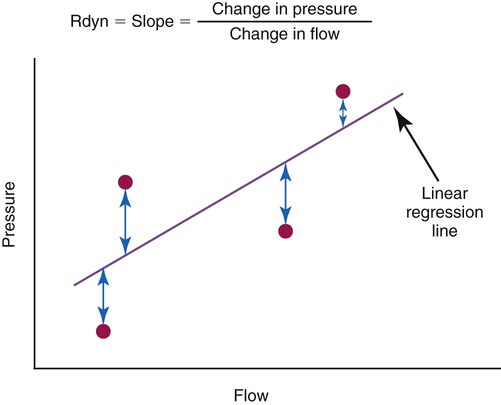
A simplified conceptual explanation of how linear regression could be used to calculate resistance under dynamic conditions is shown in Figure 10-12. Measurements of pressure and flow are made every few milliseconds and plotted as shown. Using linear regression, a straight line is fit to the data that minimizes the squared distances from the line to individual data points (shown by the arrows). The slope of the line, ΔP/Δ , is the resistance. A similar procedure can be performed to calculate elastance if the horizontal axis is volume (or compliance if the vertical axis is volume and the horizontal axis is pressure). In practice, data for pressure, volume, and flow are fit to the equation of motion all at once. Conceptually, the equation represents a plane in three dimensions (i.e., pressure, volume, and flow). The projection of the plane on the pressure-volume axis is a straight line whose slope is elastance, whereas the projection on the pressure-flow axis is also a straight line whose slope is resistance. Dynamic respiratory mechanics evaluation may be more appropriate than static mechanics for guiding lung protective ventilation strategies in patients with acute lung injury and acute respiratory distress syndrome (ARDS).9
Mechanics of Exhalation
Airway caliber is determined by several factors, including anatomic (i.e., physical) support provided to the airways and pressure differences across their walls. Anatomic support comes from cartilage in the wall of the airway and from “traction” provided by surrounding tissues. The larger airways depend mainly on cartilaginous support. Because smaller airways lack cartilage, they depend on support provided by surrounding lung parenchyma.10
Forceful contraction of the expiratory muscles causes pleural pressure to increase from its normal negative value to above atmospheric (Figure 10-13). Alveolar pressure during forced exhalation equals the sum of pleural pressure and the elastic recoil pressure of the lung itself.11
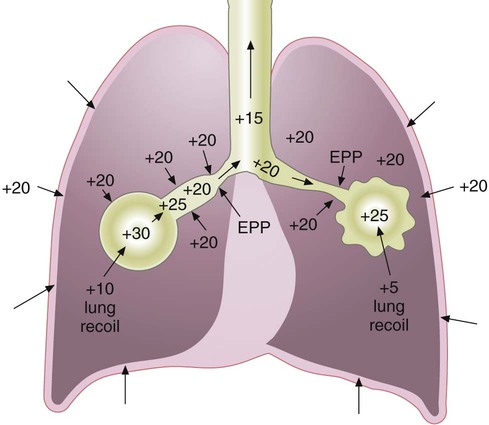
The pressure along the airway decreases as gas flows from the alveoli toward the mouth. Moving “downstream” (toward the mouth), transmural pressure (the pressure difference between inside and outside the airway wall) decreases continually. At some point along the airway, the pressure inside equals the pressure outside in the pleural space (transmural pressure equals zero). This point is referred to as the equal pressure point (EPP). Downstream from this point, pleural pressure exceeds the airway pressure. The resulting negative transmural pressure gradient causes airway compression and can lead to collapse. Airway compression increases expiratory airway resistance and limits flow. At the EPP, greater expiratory effort increases pleural pressure, restricting flow further.12 Once the transmural pressure has increased sufficiently to cause this flow limitation (at the EPP), airflow becomes effort independent with airway caliber and elastic recoil pressure determining flow. Dynamic compression of the airways (narrowing of the airways owing to an increase in surrounding pressures) is responsible for the characteristic flow patterns observed in forced expiratory tests of pulmonary function (see discussion of flow-volume curves in Chapter 19).
In healthy individuals, dynamic airway compression occurs only at lung volumes well below the resting expiratory level. Additional anatomic support is provided by the surrounding lung parenchyma. This tissue support opposes the collapsing force created by negative transmural pressure gradients. In pulmonary emphysema, the elastic tissue responsible for supporting the small airways is damaged. Destruction of elastic tissue has multiple outcomes. It increases the compliance of the lung (i.e., elastic recoil decreases; see Figure 10-13). Emphysema also obliterates the anatomic structures responsible for small airway support.12 This combination of decreased elastic recoil and loss of support for the small airways allows the airways to collapse during exhalation. Airway collapse causes air trapping and increase in the resting volume of the lung. Expiratory flow is limited by airway collapse during exhalation and can occur during tidal breathing when emphysematous changes in the lung are severe.13
Work of Breathing
Mechanical


Graphically, the integral of pressure difference with respect to volume is the area between the pressure-volume curve and the volume axis (Figure 10-14). P represents a pressure difference across a structure (i.e., inside pressure minus outside pressure), and the pressure difference defines the structure for which work is evaluated. The work the muscles do to inflate the pulmonary system is defined by the transpulmonary pressure, PTP:
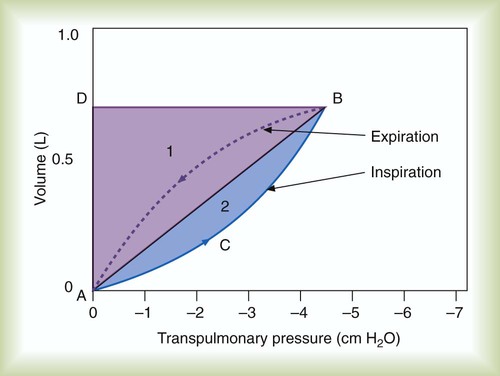


Figure 10-14 shows a graph of transpulmonary pressure versus lung volume derived from measurements taken during dynamic conditions (e.g., during a normal inspiration). The line AB connects two points in time when flow is zero. As discussed earlier, the slope of this line (ΔV/ΔPTP) represents dynamic pulmonary or lung compliance (also called “chord” compliance because in mathematics a chord of a curve is a geometric line segment whose end points both lie on the curve). The work done overcoming purely elastic forces opposing inflation is represented by the triangular area 1 in Figure 10-14. The work required to overcome flow resistive forces is represented by area 2. The total mechanical work for one breath is the sum of the work overcoming both the elastic and the resistive forces opposing inflation; this is represented as the sum of areas 1 and 2. In healthy adults, approximately two-thirds of the work of breathing can be attributed to elastic forces opposing ventilation. The remaining one-third is a result of frictional resistance to gas and tissue movement.
Traditionally, static pressure-volume curves have been created by injecting the lungs with discreet volume steps using a large calibrated syringe (“super syringe”).14 Alternatively, the line AB can be approximated under clinical conditions using a very slow inspiratory flow (with the patient heavily sedated) producing what is called a quasistatic pressure-volume curve.15 Evaluation of this type of pressure-volume curve can be useful for setting optimal positive end expiratory pressure (PEEP).16 Ventilators made by Hamilton Medical, Inc., (Reno, NV) offer what they call the “PV Tool,” which generates a quasistatic pressure-volume curve using a slow pressure ramp rather than a slow inspiratory flow. This method allows evaluation of both compliance and lung recruitability.17
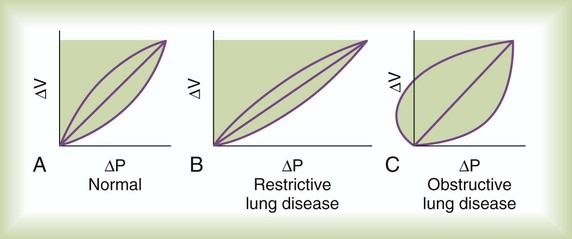
In the presence of pulmonary disease, work of breathing can increase dramatically (Figure 10-15). The areas of the volume-pressure curves for patients with obstruction or restriction are greater than in healthy subjects.18 The reasons for these increases in the mechanical work are quite different. In restrictive lung disease, the area of the volume-pressure curve is greater because the slope of the static component (compliance) is less than normal. The area of the volume-pressure curve in obstructive lung disease is increased because the portion associated with frictional resistance is markedly widened. The leftward “bulge” of the loop indicates positive pleural pressure that can occur during expiration, notably when lung compliance is increased (see Figure 10-15, C).
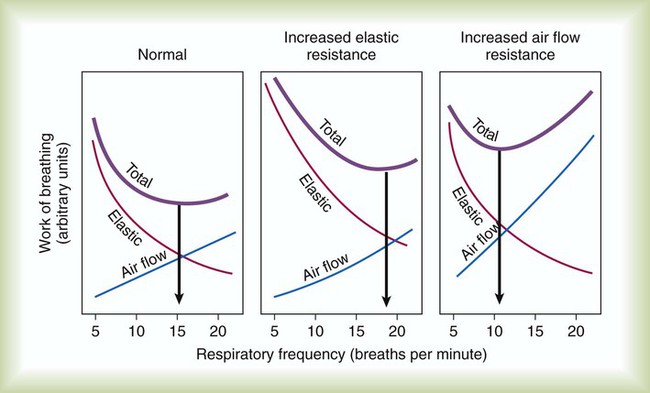
Similar adjustments occur in individuals who have lung disease (Figure 10-16). Patients with “stiff lungs” (i.e., increased elastic work of breathing), such as in pulmonary fibrosis, often assume a rapid, shallow breathing pattern. This pattern minimizes the mechanical work of distending the lungs but at the expense of more energy to increase breathing rate. Patients who have airway obstruction may assume a ventilatory pattern that reduces the frictional work of breathing. Breathing slowly and using pursed lip breathing during exhalation minimize airway resistance.
Increased work of breathing is often complicated by respiratory muscle weakness, which may result from electrolyte imbalance, acidemia, shock, sepsis, or diseases affecting the muscles themselves.18 When increased work of breathing occurs with respiratory muscle weakness, inspiratory muscles can fatigue. VT decreases and respiratory rate increases as the muscles fatigue and fail. Gas exchange may be compromised by ventilation/perfusion imbalances and increased dead space resulting from the low VT (see the section on Efficiency and Effectiveness of Ventilation later).
Metabolic
 O2) by the respiratory muscles reflects their energy requirements. It also provides an indirect measure of the work of breathing.
 O2 at rest and at increased levels of ventilation. If no other factors increase O2 consumption, the additional O2 uptake is a result of respiratory muscle metabolism. The O2 cost of breathing in healthy individuals averages 0.5 to 1.0 ml of O2 per liter of increased ventilation. This range represents less than 5% of the O2 consumption of the body. At high levels of ventilation (i.e., >120 L/min), the O2 cost of breathing increases tremendously and may exceed 30% of the O2 consumption of the body.
 O2 of the respiratory muscles is closely related to the inspiratory pressures generated by the diaphragm. This
 In the presence of pulmonary disease (either obstructive or restrictive), the O2 cost of breathing may increase dramatically with increasing ventilation (Figure 10-17). In an obstructive disease such as emphysema, increased ventilation causes the O2 consumption of the respiratory muscles to increase rapidly. This abnormally high O2 cost of breathing is one factor that limits exercise in such patients. Increased O2 consumption by the respiratory muscles may also contribute to the failure to wean patients from mechanical ventilation.19 Intubation and mechanical ventilation in cases of shock may be indicated to decrease the excess O2 consumption of the respiratory muscles and preserve the limited O2 delivery (DO2) for other vital body organs.
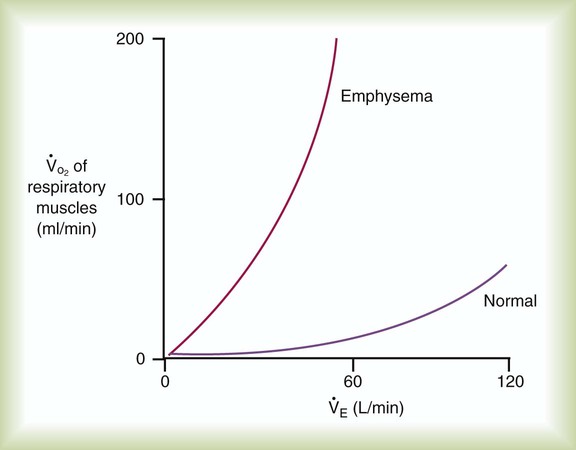
 ) of the respiratory muscles is minimal at levels of ventilation up to about 100 L/min in normal subjects. The metabolic demand is significantly higher in obstructive lung disease (e.g., emphysema) even at low and moderate levels of ventilation.
 Problem
 O2) between unassisted breathing and passive assisted breathing during mechanical ventilation. Although O2 consumption requires complicated equipment (indirect calorimetry or metabolic cart), simply looking at the mixed venous O2 saturation (
 ) before and after initiation of weaning may be a good surrogate for O2 cost of breathing. If the
  was 75% (normal) before initiation of weaning, and after 30 minutes of spontaneous breathing trial the value is 60% without other reason for increased O2 consumption, it is fair to assume that the O2 cost of breathing has increased significantly, and failure of weaning or extubation is possible.
Distribution of Ventilation
Neither ventilation nor perfusion is distributed evenly in healthy lungs, resulting in uneven ventilation ( )/perfusion (
 ) ratio (
 = 0.8). Regional and local factors account for this unevenness in the distribution of ventilation. Uneven ventilation helps explain why the lung is imperfect for gas exchange. In disease, the distribution of ventilation can worsen dramatically. The resulting deficiencies in gas exchange can be life-threatening. The maldistribution of ventilation in disease represents a primary cause of impaired O2 and CO2 exchange (see Chapter 11).
 Rule of Thumb
Mini Clini
Altering Patient Position to Improve Oxygenation
Altering patient position can improve oxygenation in some pulmonary diseases.20
 Problem
Regional Factors
Differences in Thoracic Expansion
The conical configuration of the thorax and the action of the respiratory muscles cause proportionately greater expansion at the lung bases than at the apices (see Chapter 8). Expansion of the lower chest is approximately 50% greater than expansion of the upper chest.21 The action of the normal diaphragm preferentially inflates the lower lobes of the lung.
Transpulmonary Pressure Gradients
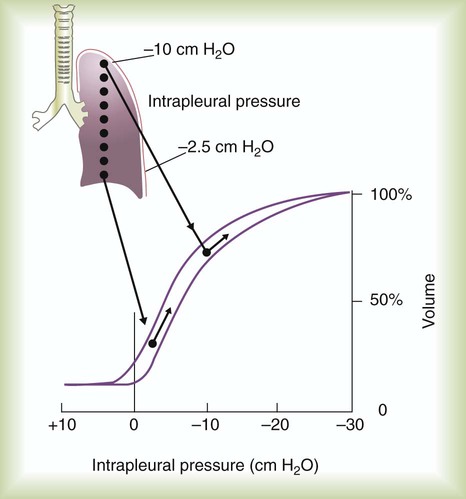
Top-to-bottom differences in pleural pressure have an even greater effect on the distribution of ventilation, especially in the upright lung.3 Pleural pressure increases by approximately 0.25 cm H2O for each 1 cm, from the lung apex to its base for the average-sized adult lung. This increase in pressure results from the weight of the lung itself and the effect of gravity. In an adult-sized lung (approximately 30 cm from apex to base), pleural pressure at the apex is approximately −10 cm H2O. At the base, pleural pressure is only about −2.5 cm H2O. Because of these differences, the transpulmonary pressure gradient at the top of the upright lung is greater than it is at the bottom. As a result, alveoli at the apices have a larger resting volume than do alveoli at the bases.
Because of their larger volume, alveoli at the apices expand less during inspiration than alveoli at the bases. Apical alveoli rest on the upper portion of the lung’s pressure-volume curve (Figure 10-18). This part of the curve is relatively flat. Each unit of pressure change causes only a small change in volume. Alveoli at the lung bases are positioned on the steeper middle portion of the pressure-volume curve. For each unit of pressure change, there is a larger change in volume (greater compliance). For a given transpulmonary pressure gradient, alveoli at the bases expand more than alveoli at the apices. The bases of the upright lung receive approximately four times as much ventilation as the apices.
Local Factors
Each respiratory unit has an elastic element, the alveolus, and a resistive element, the airway. Change in alveolar volume and the time required for the change to occur depend on the compliance and resistance of each respiratory unit.3 In terms of compliance, the more distensible the lung unit, the greater the volume change at a given transpulmonary pressure. Lung units with high compliance have less elastic recoil than normal. These units fill and empty more slowly than normal units. Lung units with low compliance (high elastic recoil) increase their volume less. They fill and empty faster than normal. Alveolar surfactant helps to stabilize alveoli of different sizes and even out the filling and emptying times.
Time Constants
For passive expiration (with any mode of ventilation), it is:
where e is the base of the natural logarithms (approximately 2.72). The product of resistance and compliance (RC in the equation) has units of time (usually seconds) and is called the time constant. It is referred to as a “constant” because for any value of resistance and compliance, the time constant always equals the time necessary for the lungs to fill or empty by 63%. For unit of inspiratory or expiratory time equal to the time constant, lung volume changes by 63%. After two time constants, lung volume has changed 86%; after three time constants, it has changed 95%. This relationship relates to ventilator settings in that for pressure control modes, inspiratory time must be at least three time constants long to deliver 95% of the volume that is possible with the given pressure settings and lung mechanics. For any mode, expiratory time must be set to at least three time constants for the lungs to empty passively to 95% (i.e., 5% of inspired volume still remains) (Figure 10-19).
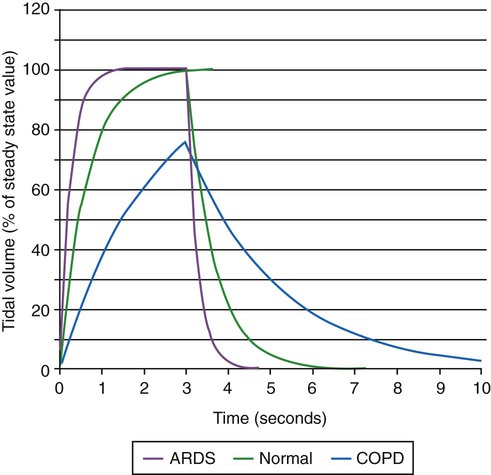
A lung unit has a long time constant if resistance or compliance is high. Units with long time constants take longer to fill and to empty than units with normal compliance and resistance (see Figure 10-19). Lung units have a short time constant when resistance or compliance is low. Lung units with short time constants fill and empty more rapidly than lung units with normal compliance and resistance.
Time constants affect local distribution of ventilation in the lung. The effects of unequal time constants within the lung are different for volume control (VC) ventilation (with constant inspiratory flow) compared with pressure control (PC) ventilation (with constant inspiratory pressure). For lung units with equal resistance and compliance, both VC and PC result in equal distribution of volume. For lung units with different resistance and compliance but with equal time constants, the distribution of volume depends only on the ratio of resistance or compliance for both modes of ventilation. For lung units with different time constants but equal resistances, VC gives more uniform volumetric expansion and perhaps lower risk of volutrauma than PC. For lung units with different time constants but equal compliances, PC gives more uniform volumetric expansion and possibly lower risk of volutrauma than VC.22
Frequency Dependence of Compliance
Variations in time constants can affect ventilation throughout the lung. Abnormal ventilation is characteristic of obstruction in the small airways. This type of obstruction occurs in emphysema, asthma, and chronic bronchitis.23 The time constants of many lung units are increased in obstructive lung disease. These long time constants are mainly caused by increased resistance to flow in the small airways. Loss of normal tissue elastic recoil, such as in emphysema, also contributes to slowed filling and emptying.
At increased breathing rates, units with long time constants fill less and empty more slowly than units with normal compliance and resistance. Increasingly more inspired gas goes to lung units with relatively normal time constants. When more inspired volume goes to a smaller number of lung units, higher transpulmonary pressures must be generated to maintain alveolar ventilation. Compliance of the lung seems to decrease as breathing frequency increases. This phenomenon is called frequency dependence of compliance.5 If dynamic compliance decreases as the respiratory rate increases, some lung units must have abnormal time constants. Any stimulus to increase ventilation, such as exercise, may redistribute inspired gas. Mismatching of ventilation and perfusion can result in hypoxemia, severely limiting an individual’s ability to perform daily activities.
Efficiency and Effectiveness of Ventilation
 Problem
Efficiency
 , which is calculated as the product of frequency of breathing (fB) times the expired tidal volume:

 values range from 5 to 10 L/min in healthy adult subjects at rest.
 , is the product of breathing frequency (fB) and alveolar volume per breath (VA):
 is always less than
  because of the effect of dead space.
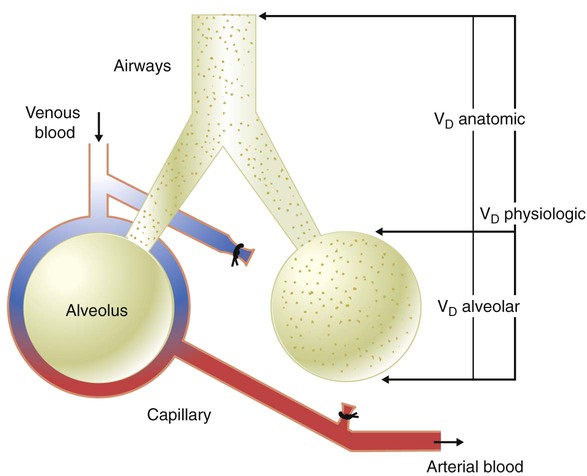
Anatomic Dead Space
The common estimation of VD based on body weight goes back to a study published in 1955.24 More recent research has shown poor agreement between an individual patient’s measured dead space and dead space estimated by this and other “rule of thumb” equations.25 Dead space to tidal volume ratio (VD/VT) can be more accurately estimated for mechanically ventilated adult patients using more data available at the bedside26:
Alveolar Dead Space
In addition to the ventilation wasted on the conducting airways, some alveoli may not participate in gas exchange. These alveoli are ventilated but not perfused with mixed venous blood. Without perfusion, gas exchange cannot occur. Any gas that ventilates unperfused alveoli is also wasted (dead space effect). Some alveoli have ventilation out of proportion to their perfusion (high  ratios; see Chapter 11). These alveoli also contribute to the inefficiency of ventilation because ventilation in excess of what is needed to arterialize the blood in an alveolus is wasted.
Physiologic Dead Space
The sum of anatomic and alveolar dead space is called physiologic dead space (VDphy):

The total volume of wasted ventilation, or physiologic dead space, equals the sum of the conducting airways and the alveoli that are ventilated but not perfused (Figure 10-20).
Physiologic dead space is measured clinically by using a modified form of the Bohr equation.
Dead Space/Tidal Volume Ratio
In clinical practice, VDphy is often expressed as a ratio to VT. This ratio (VD/VT) provides an index of the wasted ventilation (anatomic plus alveolar dead space) per breath. Measurement of the VD/VT ratio requires measurement (or estimation) of the arterial CO2 (PaCO2) and the mixed expired CO2 (PĒCO2). PaCO2 is usually measured by obtaining an arterial blood gas specimen but can be estimated from an end-tidal gas sample (PETCO2). PĒCO2 may be collected in a sampling bag or balloon or estimated by means of capnography (see Chapter 18). The ratio is calculated using a modified form of the Bohr equation, which assumes that there is no CO2 in inspired gas:
where PaCO2 is arterial CO2 tension and is the average CO2 tension in exhaled gas.
Clinical Significance
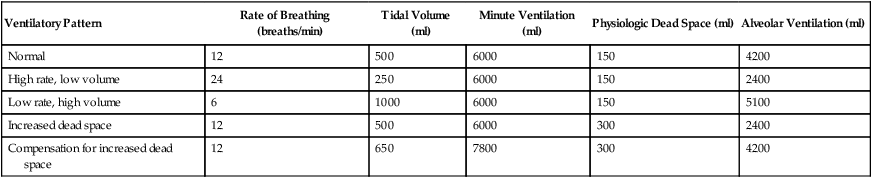
Table 10-5 lists the effects of changes in the parameters that determine alveolar ventilation ( ). In healthy individuals,
  changes with breathing rate and VT because dead space is relatively fixed. High respiratory rate and low VT result in a high proportion of wasted ventilation per minute (low
  ). Generally, the most efficient breathing pattern is slow, deep breathing.
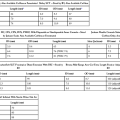
TABLE 10-5
| Ventilatory Pattern | Rate of Breathing (breaths/min) | Tidal Volume (ml) | Minute Ventilation (ml) | Physiologic Dead Space (ml) | Alveolar Ventilation (ml) |
| Normal | 12 | 500 | 6000 | 150 | 4200 |
| High rate, low volume | 24 | 250 | 6000 | 150 | 2400 |
| Low rate, high volume | 6 | 1000 | 6000 | 150 | 5100 |
| Increased dead space | 12 | 500 | 6000 | 300 | 2400 |
| Compensation for increased dead space | 12 | 650 | 7800 | 300 | 4200 |
 Problem
 ) has remained the same as before. Arterial blood gas analysis reveals a PaCO2 of 72 mm Hg with a pH of 7.20. Why has the PaCO2 increased even though the
  remained constant?
 and alveolar ventilation (
 ) were as follows:
 of 4800 ml/min was responsible for maintaining a PaCO2 of 40 mm Hg. When respiratory rate increased to 24 breaths/min and
  remained at 7200 ml/min, VT must have decreased:
 subsequently decreased:
 (from 4800 ml/min to 2400 ml/min) explains the increase in PaCO2 from 40 mm Hg to 72 mm Hg. PaCO2 is inversely proportional to
  . Because
  was reduced by half, PaCO2 should have doubled. This approximates the data actually observed. Normally, increased CO2 tension in the blood resulting in acidemia causes an increase in
  . This patient, although tachypneic, is hypoventilating.
 , unless compensation occurs. An increased breathing rate by itself worsens the problem. Effective compensation for increased VDphy requires an increased VT. Elevating VT increases the elastic work of breathing, however; this increases O2 consumption by the respiratory muscles. In some patients, these increased demands cannot be met. In such cases,
  may be inadequate to meet body needs, and CO2 is not removed as rapidly as it is produced. CO2 retention causes respiratory acidosis, often requiring mechanical support of ventilation.
 ) and
) and  determines the PCO2 in the lungs and arterial blood. This balance also plays a key role in determining the pH of arterial blood. The partial pressure of CO2 in the alveoli and blood is directly proportional to its production (
 ) and inversely proportional to its rate of removal by alveolar ventilation (
 ):
):
 is CO2 production (ml/min),
  is alveolar ventilation (ml/min), PB is barometric pressure, PH2O is the water vapor tension in the alveoli, and PaCO2 is arterial CO2 tension.
 decreases,
  exceeds the rate at which the lungs are removing it. The PaCO2 increases to greater than its normal value of 40 mm Hg, and the arterial pH level decreases. Ventilation that does not meet metabolic needs (resulting in respiratory acidosis) is termed hypoventilation. Hypoventilation is indicated by the presence of an elevated PaCO2 and a pH level below the normal range (7.35 to 7.45).
 from exercise. The PaCO2 remains in the normal range of 35 to 45 mm Hg, and the pH level remains near 7.4. The increase in ventilation that occurs with increased metabolic rates is termed hyperpnea.