[level-membership-for-surgery-category]Chapter 16
Vascular Laboratory
Arterial Duplex Scanning
Patrick A. Stone, Stephen M. Hass
Based on a chapter in the seventh edition by Paul A. Armstrong and Dennis F. Bandyk
Duplex ultrasound (DUS) is an integral component of diagnostic testing for the evaluation and management of arterial disease. This technology, which combines the acquisition of blood flow (pulsed Doppler spectral analysis) and anatomic (B-mode and color Doppler imaging) information, was developed under the guidance of D. Eugene Strandness, Jr., at the University of Washington in the 1970s.1 The initial clinical application of arterial duplex scanning assessed the extracranial carotid artery bifurcation for the presence and extent of atherosclerotic plaque and developed velocity criteria to estimate internal carotid artery (ICA) stenosis on the basis of correlations with angiographic measurements.2 Commercial duplex scanners became available by the 1980s, and the clinical use of DUS rapidly expanded into peripheral arterial, visceral arterial, and peripheral venous applications. The development of real-time, color-encoded Doppler imaging was an important technologic advance that simplified patient testing, enhanced diagnostic accuracy, and led to additional clinical applications in the areas of screening for arterial disease, intraoperative assessment, and surveillance after arterial intervention.
Modern DUS systems provide high-resolution B-mode ultrasound imaging of tissue and vessel anatomy, including three-dimensional vessel reconstruction and evaluation of atherosclerotic plaque morphology. Detailed assessment of blood flow characteristics can be made in real time by one of several techniques—color Doppler imaging, power Doppler imaging, B-flow imaging, or pulsed Doppler spectral analysis.
Test interpretation is based on both imaging and Doppler findings, with classification ranging from normal to clinically relevant disease categories. Duplex testing is noninvasive and cost-effective and thus suitable for serial examination because it not only permits the identification of disease but also reveals its natural history, including progression, regression, and response to intervention. In many patients, duplex testing can establish a definitive diagnosis and can allow interventions, such as carotid endarterectomy or peripheral artery angioplasty, to be based solely on the B-mode imaging and velocity spectral changes recorded from diseased arterial segments. In the upper and lower limbs, duplex testing should be performed in conjunction with indirect physiologic testing (measurement of systolic blood pressure, pulse volume plethysmography) to assess arterial hemodynamics. When peripheral arterial disease is identified, DUS can be used to map the site or sites of occlusive or aneurysmal lesions, analogous to contrast-enhanced arteriography. Arterial duplex test interpretation combined with the patient’s clinical history and physical examination is often sufficient to counsel the patient on the advisability of intervention and whether it can be performed by an endovascular or “open” surgical procedure.
The reliability of arterial duplex testing depends on several factors, including the expertise of the examiner (vascular technologist, physician) and the knowledge and experience of the interpreting physician. Testing performed and interpreted in an accredited vascular laboratory has sufficient diagnostic accuracy for clinicians to rely on the final interpretation provided and often avoid performing more invasive, expensive diagnostic testing, such as computed tomography, magnetic resonance imaging, or catheter-based contrast-enhanced angiography, to confirm disease severity.
Instrumentation and Basic Concepts
DUS systems use transducers fabricated from piezoelectric crystals to convert electrical activity to mechanical energy (ultrasound) and vice versa, thereby allowing the same device to transmit and receive ultrasound signals to and from the patient to produce images of tissue anatomy as well as to characterize blood flow. Transducers consist of multiple elements that enable focusing of the ultrasound beam, steering of the beam, and resolution sufficient for detailed tissue imaging at depths of less than 1 cm to more than 20 cm. To perform detailed arterial mapping, DUS instrumentation for carotid and peripheral testing should be equipped with linear array transducers with frequencies ranging from 5 to 12 MHz. For visceral artery or abdominal imaging and transcranial Doppler (TCD) examination, lower frequency transducers are needed because of the higher tissue attenuation; typically, 2.5- or 3.5-MHz curved linear or phased array transducers are appropriate. Newer generation transducers have an ultrawide bandwidth that makes possible harmonic imaging, with its increased resolution and freedom from artifacts, and dynamic frequency tuning for improving image quality at greater tissue depths. Moreover, the development of two-dimensional transducer arrays enables the beam to be focused at a specific depth and steered, which facilitates the use of three-dimensional imaging.
A duplex B-mode, or brightness mode, ultrasound image is displayed as gray-scale pixels reflecting the amplitude and position of returning ultrasound echoes. By processing up to 200 or more separate ultrasound beam signals retrieved from the transducer array, a scan converter organizes both horizontal and vertical pixels to yield a two-dimensional view of the tissue being scanned. Optimal arterial anatomic imaging is achieved when the transducer scan lines (beam) are directed perpendicular to the vessel wall (Fig. 16-1). A 90-degree imaging angle is best used for measuring vessel diameter, identifying intima-media thickening, and assessing atherosclerotic plaque composition. Transmit power and receiver gain should be adjusted to produce a gray-scale image with the best tissue signal-to-noise ratio so that subtle differences can be perceived by the human eye. The examiner can modify image appearance by adjustment of the instrument’s time gain compensation, which is designed to correct for the effects of increasing attenuation with depth. When duplex arterial imaging is performed, the left side of the image should be oriented toward the patient’s head.
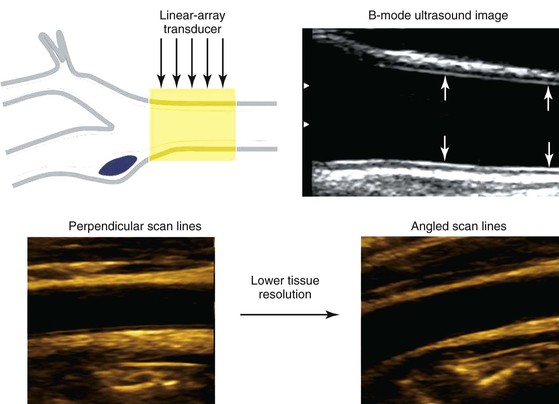
Figure 16-1 Common carotid artery B-mode ultrasound image obtained with transducer scan lines perpendicular to the vessel wall. A normal intima-media stripe is identified (arrows) in the anterior and posterior artery wall. Arterial wall resolution decreases when scan lines are angled relative to the vessel (lower right image).
There are two types of Doppler ultrasound displays. In one form, a color-flow Doppler image shows the flow velocity distribution over a wide area displayed as a color-encoded map superimposed on the gray-scale B-mode tissue image. The second type, often referred to as spectral Doppler, shows the time-varying flow velocity distribution at a selected sample volume. Spectral Doppler provides quantitative information on the peak velocity within the sample volume, whereas color-flow Doppler provides semiquantitative information on the distribution of velocities over an entire region.
To obtain reliable information from spectral Doppler, it is best to use scan line angles (i.e., Doppler angles) of 60 degrees or less relative to the transducer insonation beam and arterial wall (Fig. 16-2). Assignment of the Doppler angle is controlled by the examiner. Because calculation of blood flow velocity is determined by the Doppler equation, which is proportional to the cosine of the Doppler angle, recording velocity spectra at large Doppler angles results in reduced Doppler frequency shift and thereby increases flow velocity error as a result of uncertainty in knowing the true Doppler angle. For example, an error in Doppler angle assignment such as 5 degrees higher than the recommended 60 degrees (i.e., at 65 degrees) will result in a 15% measurement error in flow velocity, whereas an 8% error would result if a 55-degree angle were assigned. The velocity measurement error caused by incorrect or imprecise assignment of the Doppler angle by the examiner is a common duplex testing inaccuracy that can result in overestimation or underestimation of the severity of the stenosis when disease classification is based on peak systolic velocity (PSV) or end-diastolic velocity (EDV) criteria. When pulsed Doppler flow signals are recorded, the instrument sample volume should be sized to encompass less than a third of the flow lumen and should be positioned in the center stream of flow.
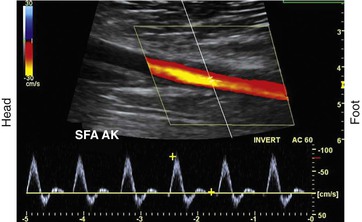
Figure 16-2 Color duplex image with velocity spectra of normal superficial femoral artery (SFA) flow recorded from the above-knee segment (AK) with a 60-degree Doppler beam angle. Note that the pulsed Doppler sample volume is positioned in the center stream of flow, where color-flow pixels indicate the highest flow velocity.
Blood Flow Imaging Techniques
Blood flow detection can be performed with one of three imaging techniques: color Doppler, power Doppler, and B-flow.
Color Doppler Imaging
Color Doppler imaging refers to pixel encoding of blood flow based on a color bar that depicts both flow direction (toward and away from the transducer) and mean velocity (MV) (Fig. 16-3). The examiner adjusts the velocity scale, color priority, and saturation of the color bar as well as instrument color gain to show the appearance of normal, laminar arterial flow as homogeneous regions varying in color-coded pixels during the pulse cycle. To set the color gain correctly, the examiner should increase the gain until a noise speckle appears within the flow region and then reduce it slightly. This technique will optimize the display of weak or lower velocity blood flow signals, such as those adjacent to the artery wall. Excessive color gain causes color-coded flow pixels to bleed into or beyond the artery wall and thus makes the flow lumen appear larger than reality. Interpretation of real-time color Doppler flow is based on the color bar settings (peak MV, baseline, wall filter, and color assignment of flow toward or away from the transducer). In tortuous vessels, blood flow is color-coded according to its direction relative to the transducer scan lines (Fig. 16-4). When blood flow velocity exceeds the mean peak velocity threshold of the color bar, color aliasing occurs because the sampling rate as defined by the pulse repetition frequency is no longer sufficient (the Nyquist limit). With aliasing, blood flow is erroneously encoded as the “wraparound” color shown in the color bar (Fig. 16-5), and the color image display will show flow in the opposite direction. Increasing the pulse repetition frequency and increasing the Doppler angle are two techniques that can be used to reduce the color-flow “aliasing” artifact.
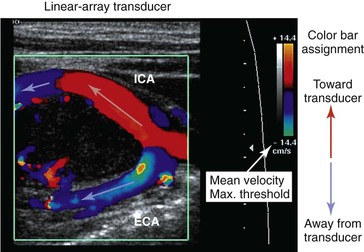
Figure 16-3 Color Doppler imaging of the carotid bifurcation with a tortuous internal carotid artery (ICA) caused by a carotid body tumor. Assignment of the color-encoded flow is based on color bar designation and flow direction relative to the transducer (red toward, blue away) scan lines. Note that in the ICA flow, color changes from red to blue, whereas in the external carotid artery (ECA) flow, color is blue. Aliasing occurs when maximum mean velocity exceeds 14 cm/s.
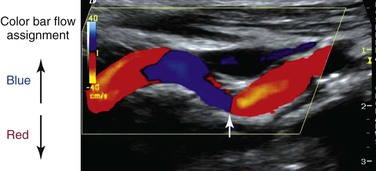
Figure 16-4 Color Doppler image of a tortuous internal carotid artery. The color bar indicates assignment of color-encoded flow based on direction toward or away from the transducer, which accounts for the change in color from red to blue to red in the image. Note that at 90 degrees (arrow), no flow is coded as a black line.
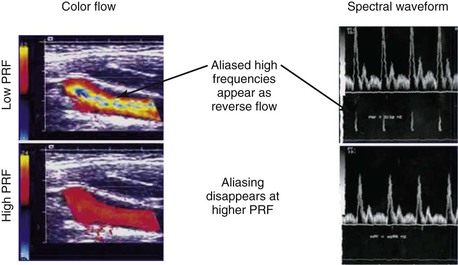
Figure 16-5 Color-flow images and spectral displays of common carotid artery flow at low and high pulse repetition frequency (PRF). Aliasing of color and the velocity spectra occurs with low PRF (upper images). The artifact is removed by increasing PRF (lower images).
Arterial stenosis is recognized by color Doppler imaging as a reduction in the color-encoded flow lumen, imaging of a high-velocity flow region with color bar aliasing, and development of a mosaic flow pattern in the lumen signifying turbulent flow. At the site of a high-grade (>75% diameter reduction) stenosis, real-time color Doppler flow will appear as a whitened, color-desaturated “flow jet” with mosaic color flow extending for several vessel diameters downstream corresponding to post-stenotic turbulence (Fig. 16-6). A tissue bruit may appear as low-velocity flow signals outside the artery lumen and is caused by vibration of the arterial wall. The presence of persistence of color, color bar aliasing, and changes in flow lumen diameter on color Doppler imaging is indicative of abnormal flow patterns produced by stenosis. The examiner should then carefully interrogate this diseased arterial segment with pulsed Doppler spectral analysis to measure changes in flow velocity, which are then used to estimate the severity of the stenosis.
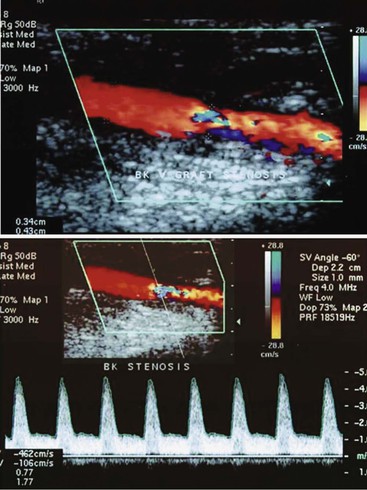
Figure 16-6 Color duplex image and velocity spectra of an arterial vein bypass graft stenosis. Top image, Color aliasing occurs at the stenosis when mean velocity is more than 28 cm/s and extends for several vessel diameters downstream. Bottom image, Velocity spectra recording at the stenosis “flow jet” indicates a peak velocity of 426 cm/s and spectral broadening of highly disturbed turbulent flow.
Power Doppler Imaging
Power Doppler imaging is a technique in which the display of blood flow is based on the amplitude of the backscattered Doppler signal; it increases the sensitivity of flow detection three to five times with respect to color Doppler imaging. This imaging mode is termed “color angio” and is used by the technologist for imaging of small-diameter vessels, detection of slow flow, assessment of residual lumen diameter at a stenosis, and detection of “trickle” flow associated with high-grade stenosis. Flow direction is not evident with the power Doppler imaging option, and the flow signal is less dependent on the Doppler angle.
B-Flow Imaging
B-flow imaging shows blood flow in gray scale; that is, flowing blood and the surrounding structures are depicted in shades of gray. The imaging technique is a visual depiction of flow hemodynamics and should not be confused with color Doppler imaging because no velocity information is provided. B-flow imaging relies on the amplification of weak echoes from moving red blood cells and is most useful during arterial imaging to show boundary layer flow adjacent to the vessel wall and traversing atherosclerotic plaque. B-flow imaging can demonstrate the complex flow patterns seen at bypass graft anastomoses and arteriovenous fistulae and within dialysis access conduits, where color Doppler artifacts can obscure flow patterns.
Pulsed Doppler Spectral Analysis
Pulsed Doppler velocity spectra recorded from a normal artery have a narrow range of velocities throughout the pulse cycle, which indicates that red blood cells are moving at a similar speed and direction in a nondisturbed, or laminar, flow pattern. If the “sample volume” of the pulsed Doppler is too large relative to the diameter of the artery or positioned adjacent to the arterial wall, low-velocity flow signals will be displayed as “broadening” or increased width of the velocity spectra (Fig. 16-7).
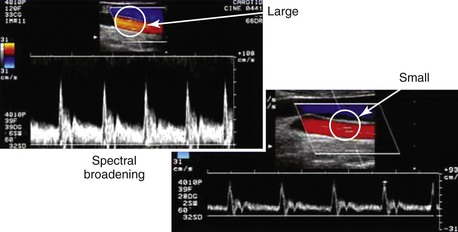
Figure 16-7 Color duplex images of common carotid artery flow. Spectral broadening occurs with a “large” versus a “small” sample volume size as a result of the inclusion of lower blood flow velocities near the arterial wall. This artifact can occur because of incorrect sample volume size or placement and does not indicate flow turbulence.
Spectral broadening in the pulsed Doppler signal can also indicate “disturbed” flow or flow turbulence when it is recorded center-stream at bifurcations, regions of abrupt diameter change, and sites of stenosis. The “normal” appearance of arterial duplex flow varies with the artery being studied (peripheral, carotid, renal, or mesenteric) but should demonstrate rapid flow acceleration in systole, narrow spectral width, and varied diastolic flow corresponding to the vascular resistance of the arterial bed.
The velocity spectrum of a normal peripheral (aorta, iliac, extremity, external carotid) artery is triphasic or multiphasic (see Fig. 16-2) and consists of high outflow resistance with a systolic flow component, early diastolic flow reversal, and late diastolic forward flow. Low-resistance arterial flow, such as in the internal carotid, vertebral, renal, celiac, splenic, and hepatic arteries, is characterized by continuous flow throughout the pulse cycle with only a single (systolic) phasic flow component producing a monophasic pulsed Doppler spectral waveform (Fig. 16-8). Changes in flow resistance of the microcirculation are primarily reflected as an increase or decrease in diastolic flow velocity.
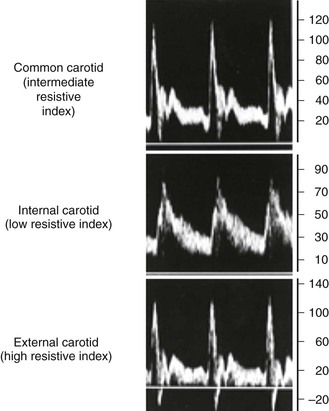
Figure 16-8 Velocity spectra of common carotid, internal carotid, and external carotid artery flow demonstrating differences in flow resistance (i.e., resistive index) between the internal (low resistive index), common (intermediate resistive index), and external (high resistive index) carotid arteries.
Measurements
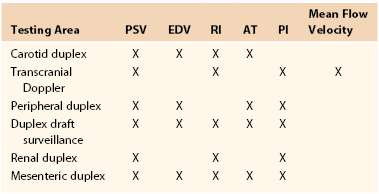
The pulsed Doppler spectral parameters of acceleration time, pulsatility index (PI), resistive index (RI), and maximum spectral velocity measured at peak systole (PSV) and end-diastole (EDV) constitute the primary criteria used for test interpretation (Fig. 16-9 and Table 16-1). The PSV measurement is reproducible and thus the most common velocity spectral parameter used for the interpretation of normal arterial flow and critical limb ischemia and for the grading of arterial stenosis. The EDV measurement is used in conjunction with PSV for evaluating high-grade stenosis (>70% diameter reduction; see Table 16-1).
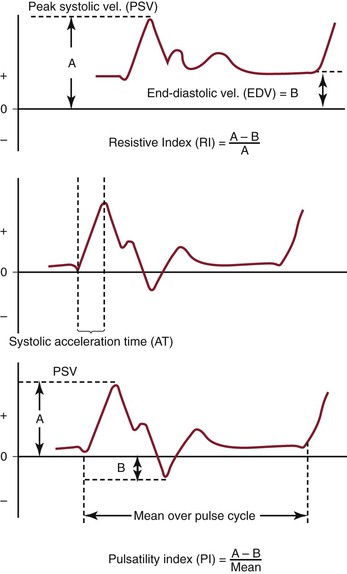
Figure 16-9 Measurement of velocity spectra waveform parameters, including peak systolic velocity (PSV), end-diastolic velocity (EDV), pulsatility index (PI), systolic acceleration time (AT), and resistive index (RI), used for the interpretation of arterial duplex testing.
Table 16-1
Velocity Spectra Waveform Parameters Used for Interpretation of Duplex Tests
AT, Systolic acceleration time; EDV, end-diastolic velocity; PI, pulsatility index; PSV, peak systolic velocity; RI, resistive index.
RI is calculated by subtracting EDV from PSV and then dividing by PSV. It is used clinically to assess the renal and cerebral circulations for abnormal peripheral resistance. Normal values are less than 0.7, and levels higher than 0.85 are associated with increased vascular bed resistance and decreased end-organ perfusion.
PI is calculated by dividing the peak-to-peak velocity spectral shift by the average (mean) velocity. The PI of normal peripheral arteries is greater than 4.0 (femoral artery, >6; popliteal artery, >8). PI values lower than 4 may reflect proximal inflow or occlusive disease, and change in PI or spectral waveform damping is diagnostic of multilevel occlusive disease. Division of distal artery PI by proximal artery PI calculates the “damping factor”; a normal value is 0.9 or higher, and a value of less than 0.9 is diagnostic of occlusive disease.
The systolic acceleration time during systole can also be used to diagnose occlusive disease proximal to the pulsed Doppler recording site. A normal value is less than 133 milliseconds. As systolic acceleration time increases to longer than 200 milliseconds, the spectral waveform develops a rounded upslope configuration, termed tardus-parvus, because of the prolonged time to PSV. Diagnostic accuracy of the systolic acceleration time is influenced by cardiac conditions (cardiomyopathy, aortic valve disease), but downstream occlusive disease has minimal influence on diagnostic sensitivity.
Ultrasound Equation
This is described in Chapter 15. Volume flow (Q; mL/min) can also be measured by electronically extracting the spatial average velocity (Vsa; cm/s) as a function of time, measuring vessel diameter (d; cm), and expanding the sample volume size to encompass the entire flow lumen by the equation
Measurement of arterial volume flow has limited diagnostic accuracy in the classification of occlusive disease because of normal variation in peripheral resistance and the development of collateral flow, but it is clinically useful in the assessment of dialysis access function.
Artifacts and Errors
Artifacts and errors in ultrasound measurement can limit the effectiveness of the evaluation and create inaccurate results. Various artifacts include mirror image artifacts, shadowing from overlying vessel calcification, inaccuracy due to refraction, and aliasing. Most errors can be attributed to the technologist because studies using flow models have found that adjustment of Doppler angle, sample volume placement, and Doppler gain were the most significant sources of error in PSV measurement.
Spectral Doppler aliasing is the most common artifact and, similar to color Doppler aliasing, is recognized by a “characteristic” signal wraparound in the spectral display (see Fig. 16-5). Adjustment of the velocity scale (i.e., pulse repetition frequency) to above the Nyquist limit or a reduction in the baseline level can shift the spectrum downward and eliminate the artifact. Shadowing from overlying calcification impedes adequate visualization of underlying vessel anatomy with B-mode imaging and interferes with accurate velocity measurement. Mirror image artifacts, created when a tissue structure is reproduced at an incorrect location, occur when a strongly reflecting surface is further reflected by other strongly reflecting surfaces.3 Refraction can cause misregistration of the image and the Doppler sample volume and occurs when an ultrasound beam passes through mediums with different propagation speeds. Crosstalk, found only in Doppler evaluation, creates a mirror image where identical spectra appear above and below the baseline. It is usually caused by an excessive receiver gain setting or an incident angle near 90 degrees. Ghosting occurs when low-velocity motion from pulsating vessel walls produces small Doppler shifts that can cause color flashing into the surrounding anatomy; it can be fixed with wall filters.
Variability of diagnostic criteria between laboratories stems from methods for defining the percentage of stenosis, different machines, and differences in technique.3 Factors such as gender and physiologic condition of the patient can also affect the outcomes of DUS evaluations. Studies have found that carotid PSV measurements in women average 10% higher than in men.4 Congestive heart failure, dysrhythmias, and artificial support measures (ventilators, intra-aortic balloon pumps, or pacemakers) can alter cardiac output, which in turn can affect PSV measurements. With regard to technologist error, the largest source is error in accurately aligning the cursor of the sample volume. Even small errors in angle measurement can result in significant errors in velocity measurement and severity of the stenosis.3 Sample volume assumes that flow is parallel to the walls; however, flow is not usually parallel in tortuous vessels or beyond an asymmetrical stenosis, and these situations can make correct sample volume positioning and true velocity readings difficult. Finally, the most accurate measurement of PSV at a stenosis is within the narrowest portion of the stenosis, and reproducible measurements can be best obtained only if the sample volume is placed at or very near this area.
Duplex Velocity Spectral Classification of Arterial Stenosis
A significant or “critical” arterial stenosis is a lesion that is associated with a resting systolic pressure gradient of more than 15 mm Hg and reduces volume flow. In the peripheral arterial circulation, this correlates with a 50% or larger diameter reduction stenosis or greater than 75% reduction in cross-sectional area. Stenosis produces losses in blood energy primarily as a result of losses in inertial energy caused by the development of turbulent flow; such losses are much greater than the friction energy losses predicted by Poiseuille’s law.
By measuring changes in velocity proximal to and across an arterial stenosis, duplex testing can noninvasively estimate its hemodynamic significance and predict reductions in diameter within specified ranges (e.g., 0% to 49% diameter reduction, ≥50%, 50% to 79%, ≥80%). The relationship between the increase in flow velocity and the reduction in diameter by stenosis is nonlinear, especially with stenoses greater than 50% diameter reduction (Fig. 16-10). The DUS characteristics of greater than 50% diameter reduction arterial stenosis include PSV elevated to higher than 125 cm/s, a color Doppler mosaic flow pattern, and pulsed Doppler spectral broadening of highly disturbed flow (i.e., post-stenotic turbulence with simultaneous forward and retrograde velocity spectra during systole).
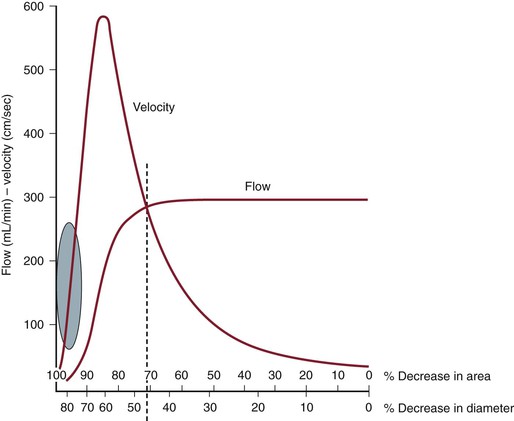
Figure 16-10 Correlation of percentage diameter reduction with increases in blood flow velocity and reduction in volume flow in arteries. Note that a high-grade (>95%) diameter-reducing stenosis causes volume flow to decrease toward zero, whereas the velocity within the stenosis may be minimally elevated.
The ratio of PSV (Vr) across a stenosis is a useful parameter for grading the severity of a stenosis; a Vr value higher than 2 indicates a greater than 50% diameter reduction, and a value higher than 4 correlates with greater than 70% diameter reduction. Typically, a pressure-reducing (peak systolic pressure >20 to 30 mm Hg) and flow-reducing arterial stenosis is associated with a Vr above 3.5, a PSV higher than 250 to 300 cm/s, and an elevation in EDV of 40 cm/s or more. Downstream of a “significant” pressure-reducing arterial stenosis, the spectral waveform should appear damped and monophasic with prolongation of the acceleration time and a decrease in PSV to below normal levels. As stenosis severity increases beyond greater than 90% diameter reduction, volume flow through the stenosis tends toward zero, which can produce PSV at the stenosis in a minimally elevated range (100 to 200 cm/s) and low-velocity (<10 cm/s) trickle flow downstream. The atherosclerotic plaque associated with greater than 50% stenosis is typically irregular and may be calcified, which produces an acoustic shadow on the image and makes measurements of residual artery diameter or reduction in cross-sectional area too inaccurate on transverse imaging to classify the severity of an arterial stenosis. Correlation studies between duplex testing and angiographic measurements have found that PSV and Vr are the best predictors of the severity of stenosis when it is expressed as percentage diameter reduction.
Validation studies comparing duplex interpretation of stenosis severity with angiographic measurements have reported different threshold PSVs for lesions with greater than 50% diameter reduction.5–10 PSV measurement variation is in the ±15% range, similar to other biologic measurements. This variation is related to the type of ultrasound system used and differences in Doppler angle assessment and sample volume positioning by the examiner. This limitation of duplex scanning can be minimized by reporting stenosis (i.e., diameter reduction) within a specified range (e.g., 0% to 49%, 50% to 75%, and 76% to 99%). In each clinical application, it is recommended that the vascular laboratory conduct ongoing quality assurance studies to confirm that the diagnostic accuracy of stenosis interpretation is greater than 80% relative to independent angiographic reports. It is not necessary to evaluate the diagnostic accuracy of individual DUS systems.
Patient Testing
Arterial duplex scanning can be performed as a portable bedside or vascular laboratory examination. Scanning should be conducted on a height-adjustable table or stretcher with the patient in a supine position. The bed and room environment should provide a comfortable, quiet atmosphere for patient examination, a warm room temperature (75° F to 77° F) to avoid vasoconstriction of the extremities, and sufficient space to permit bilateral body access for ultrasound scanning. The typical examination time ranges from 30 to 60 minutes. Patients should refrain from tobacco use for at least 1 hour before the examination, and if abdominal scanning or visceral artery testing is planned, the patient should have fasted for 4 hours and the examination should be performed in the morning to minimize accumulation of intestinal gas. Assessment of visceral artery flow before and after a test meal may be required for the evaluation of patients with symptoms of mesenteric ischemia.
Equipment Safety
DUS scanning is considered to be a safe and noninvasive diagnostic modality, but the potential for adverse bioeffects exists. The acoustic power output of the duplex scanner has the potential to produce tissue injury from both thermal (heating) and mechanical (cavitation) effects. Duplex testing should be conducted with the acoustic output or power setting as low as reasonably achievable (ALARA principle). Tissue temperature increases with exposure to diagnostic ultrasound and bioeffects are related to exposure time, pulse repetition frequency, power output, and sample volume size. The instrument displays a thermal index as a reference to the sonographer to monitor for potential adverse bioeffects. In theory, if the thermal index is 3 or less, the maximum increase in temperature with diagnostic ultrasound should be 3° C. Consensus guidelines on ultrasound exposure indicate that no significant bioeffects occur with increases in temperature of less than 2° C for less than 50 hours’ exposure, and thermal index–related bioeffects are a rare occurrence in clinical practice. Mechanical effects causing acoustic cavitation can be calculated by the mechanical index, which is normally displayed together with the soft tissue index by the instrument. Values for the mechanical index in diagnostic imaging typically range from a maximum of 1.9 to 0.5. Echo cavitations cause soft tissue bubbles or air pockets to expand and contract rhythmically, thereby resulting in resonation, which can theoretically lead to tissue damage. The use of microbubble contrast agents to enhance Doppler signal strength increases tissue bioeffects.
Clinical Applications and Test Interpretation
Carotid Artery
Carotid DUS testing provides a noninvasive method of evaluation of the extracranial carotid and vertebral arteries in patients with suspected cerebrovascular disease.2,5–13 Because the carotid artery is superficially located and can reliably be assessed by duplex scanning, this has become the mainstay of imaging for many vascular surgeons before carotid surgery. Similarly, the vertebral and subclavian arteries are readily accessible to ultrasound imaging, so a wide spectrum of extracranial arterial disorders can be accurately diagnosed, such as the detection of aneurysmal changes and even indications of intracranial and intrathoracic disease (based on waveform analysis). The most common clinical application is for the detection of proximal ICA atherosclerotic plaque and estimation of stenosis severity. The extent of ICA bifurcation diameter reduction predicts the risk for stroke and thus assists clinicians in identifying patients who may benefit from carotid intervention on the basis of landmark clinical trials.5,6,11 Because of a wide variation in reporting by vascular laboratories across the country, consensus criteria were developed to standardize reporting.13 Carotid DUS is also widely used to assess the results of carotid interventions by continued surveillance for recurrent stenosis. TCD serves as a tool for evaluation of the intracranial circulation and collateral circulation during carotid interventions and assessment of spasm after intracranial hemorrhage.
The association of coronary artery disease with increased intima-media thickness of the carotid artery has led some to suggest imaging of the carotid artery in asymptomatic patients as a screen for coronary or generalized atherosclerosis. However, a meta-analysis of 41 randomized controlled trials was unable to show a correlation in reduction of carotid intima-media thickness to a decrease in cardiovascular events. Although such screening is more often performed in Europe, restrictive insurance coverage has limited the utility of this assessment in the United States to clinical trials.14 Further, the use of duplex imaging for carotid disease surveillance was recently reviewed and found not to be cost-effective because only 7% of asymptomatic patients subsequently required carotid surgery.15
In the past decade, a better understanding of plaque morphology has provided further information on plaque echocardiographic morphology. Plaque morphology has been correlated with presenting symptoms16 (i.e., hemispheric, amaurosis fugax, asymptomatic). Furthermore, plaque morphology has been shown to change after neurologic events, with the single longitudinal view–gray scale median (GSM) lowest within 30 days of a neurologic event and increasing to values similar to those of asymptomatic patients within 3 to 6 months.17 The ICAROS (Imaging in Carotid Angioplasty and Risk of Stroke) study demonstrated by multivariable analysis that the GSM was an independent predictor of stroke after carotid stenting, with 7.1% of patients with GSM of less than 25 and 1.5% of patients with GSM of more than 25 suffering a neurologic event in the perioperative period.18
Indications.
Results from two separate guidelines endorsed by the Society for Vascular Surgery support the use of DUS as the initial imaging modality for both asymptomatic and symptomatic patients.1,19 Initial carotid evaluation with DUS is acceptable for patients with a carotid bruit and to observe known asymptomatic stenosis. DUS is also frequently used for screening carotid evaluation in patients with known peripheral arterial disease, coronary artery disease, or abdominal aortic aneurysms. For symptomatic patients, initial carotid evaluation with DUS is appropriate for patients presenting with amaurosis fugax or hemispheric symptoms attributable to carotid territories. Secondary imaging, such as computed tomographic arteriography (CTA) or magnetic resonance arteriography (MRA), is necessary when sonography cannot be obtained, DUS results are equivocal in symptomatic patients, or confirmation of DUS findings is necessary for quality assurance.
Technique.
A linear array transducer (5 to 10 MHz) is sufficient to image the arterial anatomy. Carotid artery imaging in gray scale is performed in transverse and sagittal planes to assess the intima-media thickness (normal, <0.8 mm), to assess for presence of atherosclerotic plaque (intima-media thickness >1.5 mm), and to investigate the site or sites of more advanced plaque stenosis. The examination should include complete DUS imaging of the extracranial common carotid artery (CCA), ICA, and external carotid artery (ECA) as well as assessment of flow in the vertebral and subclavian arteries including bilateral brachial artery systolic pressure measurement. Accurate differentiation of the ICA from the ECA is paramount. The two can be differentiated on the basis of location (the ICA is posterior and lateral to the ECA), Doppler flow resistance (the ICA has low-resistance monophasic spectra, whereas the ECA has higher resistance multiphasic spectra), and the presence of branches (the ECA has branches) (see Fig. 16-8).
Atherosclerotic plaque features, such as homogeneity or heterogeneity, are evaluated in gray scale by B-mode ultrasound imaging. GSM assessment of each plaque can provide additional information. Multiple images can be obtained in transverse views and a single longitudinal view. Two points of reference are used, with 0 designated for black and 255 for white. Excessive calcification can limit GSM assessment by blocking the ultrasound. Multiple points of assessment allow a maximum and minimum GSM, with the difference in measurements determining the heterogeneity of the plaque.
Notation of the carotid bifurcation relative to the angle of the mandible provides clinically important information in determining difficulty of surgical exposure for lesions at or above the angle of the mandible. Color Doppler imaging is useful to interrogate tortuous CCA or ICA segments and to assist in correct assignment of the Doppler angle for measurements of velocity spectra. The CCA is examined as far proximally as possible to detect flow turbulence caused by CCA origin stenosis. Velocity spectra are recorded (≤60-degree Doppler angle) at multiple sites in the CCA, ICA (proximal, mid, distal), and ECA. Color or power Doppler imaging is used to identify regions of maximal stenosis for pulsed Doppler interrogation.
Interpretation
Carotid Plaque Echomorphology.
The location and extent of atherosclerotic plaque, including features such as calcification, lumen irregularity, ulceration (>2-mm surface defect), and pattern of echogenicity (homogeneous versus heterogeneous), are determined by B-mode imaging. The extent of acoustic shadowing secondary to the extent of plaque calcification should be described. Lumen-reducing plaque with large echolucent regions may indicate plaque instability caused by intraplaque hemorrhage or degeneration. The more echogenic the plaque, the higher the GSM score. The GSM can determine B-mode plaque morphology more accurately than a single longitudinal assessment and provide scoring that can be standardized. Gross assessment of the carotid plaque should be categorized as less than 50% or more than 50% on the basis of plaque severity on transverse imaging.
Severity of ICA Stenosis and Velocity Criteria (PSV/EDV Ratio).
A multispecialty panel developed a consensus for estimating the severity of ICA stenosis. Parameters used to determine the degree of stenosis include PSV and EDV measurements, with these values recorded from within the most stenotic ICA segment (Table 16-2).13 Testing data allow designation of ICA disease into categories of normal (no plaque or stenosis), less than 50% stenosis (plaque visualized, mild disease), 50% to 69% stenosis, greater than 70% diameter reduction (high-grade stenosis), and occlusion (no flow detected). The ICA/CCA ratio also assists in determining the severity of a stenosis.
Table 16-2
Consensus Criteria for Interpretation of Carotid Duplex Imaging of Internal Carotid Artery Atherosclerotic Disease11
CCA, Common carotid artery; DR, diameter reduction; EDV, end-diastolic velocity; ICA, internal carotid artery; IMT, intima-media thickness; PSV, peak systolic velocity.
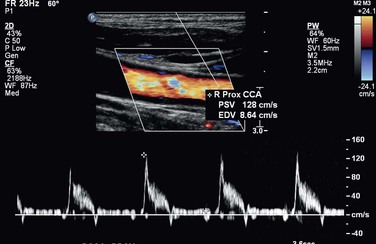
A PSV of 125 cm/s, recorded from a proximal diseased ICA segment, is the threshold for greater than or less than 50% stenosis. Extensive, bulky plaque may be imaged at the carotid bifurcation, but if PSV is in the range of 125 to 150 cm/s and the ICA/CCA ratio is less than 2, the appropriate estimation of ICA stenosis should be based primarily on the PSV value (i.e., hemodynamic classification of disease) (Fig. 16-11). Grading of ICA stenosis of more than 50% is determined by the PSV and EDV values. PSV values ranging from 230 to 280 cm/s are predictive of a greater than 70% stenosis by NASCET (North American Symptomatic Carotid Endarterectomy Trial) measurement criteria.6–8 However, interpretation of greater than 70% stenosis should not be based on the PSV value alone. As stenosis increases beyond 70%, EDV and the ICA/CCA ratio become additional criteria for defining the degree of stenosis, with an EDV higher than 100 cm/s and ICA/CCA ratio above 4 defining a diameter reduction of greater than 70%. An EDV higher than 140 cm/s and an ICA/CCA above 8 are highly predictive (positive predictive value of 90%) of greater than 80% diameter reduction stenosis (Fig. 16-12).20,21
Accuracy.
In a validation study of the consensus criteria by AbuRahma et al,22 a PSV of 125 to 230 cm/s for detection of angiographic stenosis of 50% to 69% had a sensitivity of 93%, specificity of 68%, and overall accuracy of 85%. The consensus criteria for diagnosis of 50% to 69% stenosis can be significantly improved by use of an ICA PSV of 140 to 230 cm/s, with a sensitivity of 94%, specificity of 92%, and overall accuracy of 92%. A PSV of 230 cm/s or more for a stenosis of 70% or greater had a sensitivity of 99%, specificity of 86%, and overall accuracy of 95%. PSV was more accurate than EDV or ratio.22 These results are comparable to those of a meta-analysis of the literature, in which a PSV of 130 cm/s had a sensitivity and a specificity of 98% and 88% in detecting 50% stenosis. A PSV of 200 cm/s or more for detection of a greater than 70% stenosis was 90% sensitive and 94% specific.20
When ultrasound is compared with computed tomography by the NASCET method of measurement for carotid stenosis, B-mode imaging with high resolution can provide impressive similarities to measurements with computed tomography imaging at some centers. A PSV of 370 cm/s to determine a greater than 70% stenosis was found to have a sensitivity, specificity, positive predictive value (PPV), negative predictive value (NPV), and accuracy of 87%, 90%, 82%, 93%, and 93% compared with CTA.23 An EDV of 140 cm/s had an overall accuracy of 90% in detecting a greater than 80% stenosis, and the same accuracy was detected with an ICA/CCA ratio of 6.
Limitations.
Significant tortuosity can result in higher incidence of sampling errors, and recent surgery can limit imaging. A contralateral severe stenosis or occlusion can falsely elevate ipsilateral velocities. Proximal or distal (tandem) lesions can prohibit accurate assessment of extracranial artery stenosis. Overestimation of the degree of stenosis with DUS may be explained by erroneously used angle corrections (i.e., angles >60 degrees). Nearly total occlusions substantially decrease velocities by diminished flow. Severe calcification may prevent accurate interrogation of the entire lesion, potentially missing the greatest point of stenosis.
Severe Stenosis of the Contralateral Carotid Artery
In approximately 25% of patients, the presence of an occluded ICA is associated with increased compensatory collateral flow in the nonobstructed ICA with a resulting increase in PSV and EDV. This can result in overestimation of stenosis when plaque is present.24,25 When bilateral high-grade ICA stenosis or contralateral ICA occlusion is present, multiple diagnostic criteria (PSV, EDV, ICA/CCA ratio) are recommended to interpret greater than 50% or less than 70% diameter reduction ICA stenosis. Abou-Zamzam and colleagues documented that 20% of patients with bilateral severe stenosis greater than 60% were reclassified to less than 60% stenosis in the contralateral, untreated artery after treatment of the ipsilateral carotid disease.24 Likewise, increased PSVs in the ICA have been documented in patients with bilateral vertebral artery occlusive disease or subclavian artery steal syndrome with retrograde vertebral flow.25 The potential change of PSV criteria to higher requirements has been suggested by Fujitani et al.26 Sensitivity and specificity can be enhanced by use of a PSV higher than 140 cm/s and an EDV lower than 155 cm/s for defining a 50% to 79% stenosis and a PSV higher than 140 cm/s and an EDV higher than 155 cm/s for a stenosis of 80% or greater compared with classical Strandness criteria. With use of the Strandness criteria, the accuracy was approximately 70% in detecting a 16% to 79% stenosis. When these criteria were adjusted, the accuracy improved to more than 94% in all degrees of stenosis.
Internal Carotid Artery Occlusion
The diagnosis of ICA occlusion requires several duplex findings to be present.27–29 Imaging should include B-mode plus color and pulsed Doppler as well as power Doppler to confirm absence of flow. Imaging should be adjusted for maximum flow sensitivity and minimum wall filter. The Doppler sample volume should be changed to sample the entire vessel.
Interpretation.
No flow should be detected by color or power Doppler at the diseased carotid bulb and beyond in the distal ICA. Resistance to flow in the ipsilateral CCA should be increased, with flow at or approaching zero in early diastole. Low-resistance flow may be seen in the ECA because of the development of collateral flow. A characteristic flow “thump” may be recorded in the proximal ICA as flow abuts the occlusion.
Intraoperative Carotid Duplex Testing
DUS is a useful modality to assess carotid repairs for technical problems, including arterial clamp injury, shunt trauma, suture line stenosis, and dissection of residual plaque in either the ICA or the CCA. The unpredictable occurrence of these residual lesions (documented in approximately 3% to 5% of procedures) can lead to repair site thrombosis or embolization of platelet thrombus and cause a stroke or transient ischemic attack after carotid surgery.30–32 Recurrent carotid stenosis has been postulated to have its origin in the “abnormal” repair site, with myointimal hyperplasia being more likely to develop in response to residual disturbed flow. Completion angiography, although an excellent method to verify a “technically adequate” repair (no lumen-filling defects, <20% residual stenosis), is currently used selectively because of the availability of DUS in the operating room and the skills and confidence of the vascular surgeon in performing postprocedural duplex testing and interpreting results.
Technique.
A 10- to 15-MHz specialized transducer provides high-resolution tissue imaging because the examination depth is less than 5 cm. The duplex probe is placed in a sterile plastic cover, and with saline used for acoustic coupling, the surgeon slowly scans the carotid repair in multiple sagittal and transverse planes and notes wall, lumen, and color Doppler flow features. The entire endarterectomy region is imaged, with special attention paid to repair site endpoints, transected plaque ends, and sites of vessel clamping. The ICA should be imaged as far distally as possible.
Interpretation.
The finding of wall irregularity or a small (<2 mm) flap in association with undisturbed flow (PSV < 125 cm/s) indicates a minor residual abnormality that is not found to be associated with postoperative stroke or thrombosis. When scanning identifies larger (≥3 mm) flaps, stenosis with a PSV higher than 150 cm/s and turbulent flow spectra, or lumen thrombus, immediate repair of the abnormality is recommended on the basis of clinical outcome data documenting a low (<1%) perioperative incidence of stroke and thrombosis and late (<3%) recurrent stenosis. If repair site imaging is normal and only elevated PSV is found, confirmation of an anatomic abnormality with arteriography is recommended before proceeding with operative revision. In most instances, lesions undergoing revision had both a B-mode and color Doppler abnormality and velocities higher than 200 cm/s.
Limitations.
Routine intraoperative imaging is not universally performed; in addition, no randomized studies evaluating observation of small technical defects and their natural history have been performed. Clamp time as well as status of stenosis of the contralateral carotid artery may influence velocities.
Surveillance after Carotid Intervention
DUS testing is the recommended technique for surveillance after carotid endarterectomy or stenting. Multiple reports have documented a low (<1%/y) stroke rate in patients undergoing routine surveillance to identify high-grade (>70%) recurrent carotid stenosis. The majority of lesions develop without symptoms. Surveillance testing should occur within 30 days to record a new baseline after surgery or stenting. If normal, follow-up examination should occur at 6 to 12 months; if a greater than 50% stenosis is discovered, a repeated evaluation in 6 months is warranted. Continued surveillance at annual intervals has been recommended.19,32
Carotid Endarterectomy with Patch Closure
After carotid endarterectomy with patch angioplasty, velocity criteria used for native carotid artery stenosis appear to overestimate the severity of stenosis. AbuRahma et al33 evaluated patients who had patch closure (8-mm-diameter) of carotid arteries from a prospective randomized trial who also underwent CTA and recommended different velocity criteria. An ICA PSV higher than 155 cm/s was optimal for greater than 30% restenosis with sensitivity, specificity, PPV, NPV, and overall accuracy of 98%, 98%, 98%, 98%, and 98%, respectively. A PSV higher than 213 cm/s was optimal for greater than 50% restenosis with sensitivity, specificity, PPV, NPV, and overall accuracy of 99%, 100%, 100%, 98%, and 99%, respectively. An ICA PSV higher than 274 cm/s was optimal for greater than 70% restenosis with sensitivity, specificity, PPV, NPV, and overall accuracy of 99%, 91%, 99%, 91%, and 98%, respectively. Receiver operating characteristic analysis showed that the PSVs were significantly better than EDVs and ICA/CCA ratios in detecting greater than 30% and greater than 50% restenosis.33
Carotid Stenting
With the emergence of carotid artery stenting as a treatment option for the management of symptomatic and asymptomatic ICA stenosis, duplex testing after intervention is the recommended diagnostic modality to assess stent patency and to screen for in-stent stenosis. Interpretation criteria for 50% diameter reduction stenosis of the stented ICA may differ because of stent-induced reduced wall compliance, which can cause an increase in PSV. The use of both PSV and PSV ratios is recommended when color or power Doppler imaging detects in-stent stenosis. AbuRahma et al34 have reported recommendations for and revisions to standard carotid criteria to account for the changes occurring with carotid stenting, and these revised velocity criteria are as follows.
An ICA PSV of 154 cm/s or more denoted a 30% or greater stenosis, with a sensitivity of 99%, specificity of 89%, and overall accuracy of 96%. An ICA PSV of 224 cm/s or more was optimal for a 50% or greater stenosis with a sensitivity of 99%, specificity of 90%, and overall accuracy of 98%. An ICA PSV of 325 cm/s or more was optimal for an 80% or greater stenosis with a sensitivity of 100%, specificity of 99%, and overall accuracy of 99%. An ICA EDV of 119 cm/s or more had a sensitivity, specificity, and overall accuracy in detecting an 80% or greater stenosis of 99%, 100%, and 99%, respectively. The PSV of the stented artery was a better predictor than the EDV or ICA/CCA ratio for in-stent restenosis.
Surveillance after carotid stenting has documented a 5% incidence of high-grade in-stent stenosis within 2 to 3 years. Most develop without symptoms, and most are treated by balloon angioplasty or restenting.35
Innominate, Common Carotid, and External Carotid Arteries
Ostial carotid or innominate stenosis is uncommon; typically less than 5% of patients undergoing arch angiography are diagnosed with great vessel stenosis. Duplex criteria are based on indirect findings secondary to the intrathoracic location.
Technique.
Imaging techniques are similar to those used for carotid artery imaging.
Interpretation.
Innominate artery stenosis can often be demonstrated with noninvasive imaging by a combination of waveform analysis in both the right vertebral artery and the right CCA. The right CCA may show a squared-off waveform appearance, with systolic spikes and midsystolic deceleration during the cardiac cycles. Retrograde or bidirectional flow in the right vertebral artery may also be present. CCA disease demonstrates abnormal acceleration times and damped waveforms, and a critical proximal CCA stenosis or occlusion can cause retrograde flow from the ECA, providing antegrade flow to the ICA. A PSV lower than 30 cm/s in the ICA is suggestive of a proximal lesion. In addition, a PSV in the proximal CCA higher than 180 cm/s and an EDV higher than 30 cm/s also are relatively specific but poorly sensitive findings for significant stenosis.36
Accuracy.
Few studies have looked specifically at the sensitivity and specificity of detecting proximal intrathoracic lesions. These lesions occur in 4% of patients undergoing carotid DUS, and accuracies above 99% and sensitivity and specificity of 96% and 100%, respectively, have been reported.37 More recently, a study compared computed tomography with duplex velocity criteria in evaluating CCA stenosis greater than 50%. A PSV of 182 cm/s had a sensitivity and specificity of 64% and 88% in detecting a greater than 50% stenosis, whereas an EDV higher than 30 cm/s was inferior, with a sensitivity of 54% and a specificity of 74%.38
Limitations.
Limitations of duplex detection of proximal CCA stenosis include congestive heart failure and cardiac valvular dysfunction as well as concomitant distal ICA stenosis. Because of the inability to directly insonate the vessels of interest, indirect criteria are sparsely reported in the literature, and no convincing universal criteria are currently recommended.
Vertebral Artery
Evaluation of the vertebral arteries is a routine component of cerebrovascular testing, despite the presence of symptomatic disease in only a fraction of patients evaluated. The vertebral artery is located posterior and lateral to the CCA along its course through the cervical vertebral foramen, which produces an acoustic shadow on B-mode and color Doppler imaging (Fig. 16-13). Once it is identified, the vertebral artery can be followed to its origin from the subclavian artery, although diagnostic accuracy in predicting greater than 50% origin stenosis is less than for the proximal ICA. Classification of vertebral artery flow into three categories (normal, abnormal, occluded) has good correlation with angiography.25 Retrograde vertebral artery flow is again indicative of a proximal subclavian or innominate artery stenosis or occlusion. Flow reversal may occur only during diastole (i.e., to-and-fro flow), but after upper extremity exercise, flow reversal throughout the pulse cycle is diagnostic of subclavian steal syndrome. The effect of vertebral steal on basilar artery flow can be assessed by TCD at rest and after arm exercise. The size of vertebral arteries varies, and arterial hypoplasia is not uncommon and can decrease the diagnostic accuracy of occlusion. Damped, low-velocity spectra indicate a proximal stenosis, whereas a high-resistance spectral waveform suggests the presence of a downstream occlusive lesion or arterial dissection.
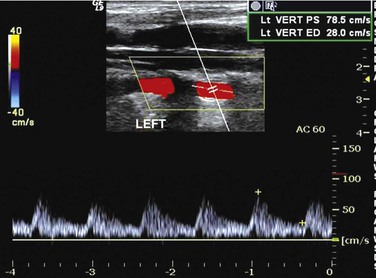
Figure 16-13 Color duplex image of vertebral artery flow.
Intracranial Arteries
TCD was introduced in 1982 by Aaslid and coworkers, who used low-frequency (2-MHz) pulsed Doppler to evaluate intracranial middle cerebral artery (MCA), anterior cerebral artery (ACA), and posterior cerebral artery (PCA) and distal ICA flow through temporal bone or orbit scan windows.39
Indications.
TCD can be used to assess stroke patients for the adequacy of collateral circulation, intracranial stenosis, and arterial spasm. Less common indications include assessment of vasoreactivity; detection of emboli during or after carotid intervention; monitoring of carotid shunt patency; evaluation of the influence of arteriovenous malformations on cerebral flow; and monitoring of flow changes associated with cerebral trauma, hyperperfusion syndrome, or the diagnosis of “brain death.” An increased risk for stroke in young black children with sickle cell disease can also be determined by detecting MV values of the MCA higher than 120 cm/s produced by the anemia or the development of intracranial stenosis. The Stroke Prevention Trial in Sickle Cell Anemia (STOP) demonstrated a stroke reduction benefit of transfusion for anemia on the basis of TCD findings.40
Technique.
For accurate comparison with established standards, vital signs during the examination should include systolic blood pressure higher than 90 mm Hg, heart rate above 60 beats/minute, and SpO2 above 95%. A 1.5- to 5-MHz phased array transducer can image the intracranial arteries through the following windows: transtemporal, suboccipital, and transorbital. Blood flow direction with pulsed Doppler and velocity spectra, including MV, PSV, and RI, should be documented. Identification of arteries is based on color Doppler imaging, flow direction, and vessel depth (Table 16-3). Normal flow direction in the MCA (sample volume depth of 30 to 60 mm) is toward the transducer, whereas flow in the proximal ACA (depth of 60 to 85 mm) is away from it. Basilar artery and PCA flow is imaged through the foramen magnum scan window. Basilar artery (depth of 80 to 110 mm) flow is away from the transducer, with terminal PCA branches and P1 and P2 segments normally demonstrating bidirectional flow toward and away from the transducer. The orbital window is used to evaluate the ophthalmic artery (normal flow toward the transducer) and the ICA within the carotid siphon. Sample volume should be between 6 and 10 mm with maximum gain.
Table 16-3
Guidelines for Normal Transcranial Doppler Study Interpretation
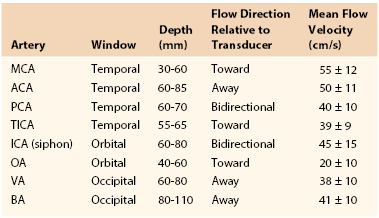
ACA, Anterior cerebral artery; BA, basilar artery; ICA, internal carotid artery; MCA, middle cerebral artery; OA, ophthalmic artery; PCA, posterior cerebral artery; TICA, terminal internal carotid artery; VA, vertebral artery.
Interpretation.
Normal intracranial and basilar artery flow is characterized by a low-resistance spectral waveform, RI of less than 0.7, and PI of less than 4. Interpretation of duplex-recorded velocity spectra (0-degree Doppler angle) is based primarily on MV measurement, with normal values being in the range of 40 to 60 cm/s and similar in each hemisphere (see Table 16-3).41 Detection of emboli is based on recording of a distinctive low-velocity, high-amplitude transient produced as the embolic particle (air, platelet thrombus) passes through the pulsed Doppler sample volume (Fig. 16-14).42–46
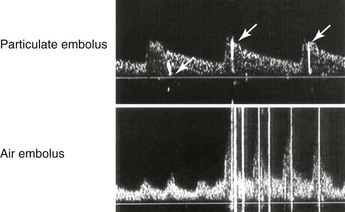
Figure 16-14 Transcranial Doppler signals recorded from the middle cerebral artery demonstrate high-amplitude transients caused by particulate embolus (arrows in the upper image) or air embolus (lower image).
Elevations in mean flow velocity (MV) can indicate either a focal stenosis or a spasm, with the extent of artery involvement used to distinguish the two conditions. Arterial spasm is graded into three categories on the basis of the MV value: mild (80-120 cm/s), moderate (120-180 cm/s), and severe (>180 cm/s). The ratio of MV or PSV to velocity in the distal ICA should be higher than 6.45–47 Hyperperfusion syndrome after carotid intervention typically demonstrates MV in the moderate elevation range, increased in comparison to the contralateral hemisphere, and a spectral waveform with a low (<0.6) RI, which indicates a loss of vasoreactivity.47 To detect intracranial stenosis of greater than 50%, different criteria should be used: MCA mean flow velocity higher than 100 cm/s; systolic to prestenotic ratio of more than 2; and vertebral/basilar artery mean flow velocity higher than 90 cm/s.
Downstream from a high-grade (>70% to 80%) ICA stenosis or occlusion, the MCA and ACA velocity spectra may be normal or abnormal, depending on the functional patency of the circle of Willis. If the anterior or posterior communicating arteries are hypoplastic or absent, the TCD spectra will demonstrate a delayed acceleration time and decreases in MV and pulsatility compared with the contralateral hemisphere. If MV values are normal, the compensatory crossover flow from the contralateral ACA may be demonstrated by MV values higher than 150% of the ipsilateral MCA.
Accuracy.
If rigorous criteria are followed, the sensitivity and specificity of TCD for brain death confirmation, compared with cerebral angiography, are 88% and 100%, respectively.48 Regarding the MCA stenosis criteria of higher 100 cm/s for a greater than 50% stenosis, sensitivity is 77% to 100%, specificity is 93% to 97%, PPV is 73% to 88%, and NPV is 94% to 100%; the overall accuracy is 90%. For a systolic to prestenotic ratio above 2 in detecting an intracranial stenosis greater than 50%, sensitivity is 80%, specificity is 94%, PPV is 76%, and NPV is 95%, with an overall accuracy of 91%. Finally, for a vertebral/basilar mean flow velocity higher than 90 cm/s in detecting an intracranial stenosis greater than 50%, the sensitivity is 69%, specificity is 99%, PPV is 95%, and NPV is 93%, with an overall accuracy of 94%.49,50
Limitations.
Visualization of a poor temporal window is the most common limitation (5% to 30%). Proximal lesions in the extracranial artery can limit the value of intracranial velocities. False-positive findings are due to collateralization of flow in the presence of proximal ICA stenosis.
Temporal Artery
Temporal arteritis is the most common form of systemic vasculitis diagnosed in the adult. The American College of Rheumatology recommends that three of the following criteria be present for the diagnosis to be made: older than 50 years, new localized headache, decreased pulsation or tenderness on palpation, and erythrocyte sedimentation rate above 50 mm/h.51 The first examination with ultrasound in the evaluation of temporal arteries occurred in 1997 by Schmidt et al.52
Technique.
High-frequency probes (5-11 MHz) are generally used in both longitudinal and transverse views, evaluating the temporal artery between the two layers of temporalis fascia.
Interpretation.
Stenosis is defined as a doubling of the PSV within the temporal artery with associated decreasing distal velocities and spectral broadening in the region of stenosis. Temporal artery occlusion is diagnosed when no color flow is detected within the temporal artery; a “halo” sign, which is a hypoechoic ringed region around the vessel secondary to edema, denotes temporal arteritis. In a prospective trial of 55 patients with suspected temporal arteritis, patients treated with corticosteroids demonstrated resolution of the hypoechoic edema by 4 weeks.53
Accuracy.
A meta-analysis in 2010 reported a sensitivity of 68% and a specificity of 91% for DUS evaluation of the temporal artery. Bilateral halo signs were less sensitive at 43% but more specific at 100%.54
Limitations.
Anatomy can limit examinations secondary to early branching of the frontal and parietal rami. Tortuosity and atherosclerosis may produce elevated velocities, and misdiagnosis of an adjacent vein as a halo has also been reported.
Peripheral Arteries
Vascular specialists should be familiar with the spectrum of testing available as well as the information provided in conjunction with other hemodynamic tests. The duplex testing performed in the vascular laboratory is an extension of clinical assessment and is used to verify the presence and extent of disease. Numerous studies have analyzed the role of DUS, computed tomography, or MRA for preoperative assessment in efforts to limit digital subtraction arteriography. In contemporary vascular practices, imaging with contrast-based modalities is generally limited to interventional procedures. This is because less invasive alternative imaging techniques can usually determine whether interventional treatment is possible without the performance of diagnostic arteriography. In patients with peripheral arterial disease, duplex imaging can determine disease location and length of lesions and help guide interventions.
Indications.
DUS evaluation is beneficial for the following: patients with suspected symptomatic, chronic peripheral arterial disease55–60; patients with suspected acute limb ischemia; patients with pedal infection without a palpable pulse; patients with atheroembolic or thromboembolic disease states; and patients who require surveillance after revascularization procedures.
Technique.
The extent of duplex arterial mapping should be individualized to the indication for peripheral arterial testing. Screening for aneurysm and imaging to identify tibial artery calcification are appropriate indications for testing in selected patients. Evaluation of patients with symptoms of claudication or other signs of peripheral arterial disease can localize sites of occlusive disease. Artery scanning proceeds from proximal to distal, with notation of artery diameter, wall morphology, plaque or thrombus accumulation, and velocity spectral waveform; it can include both upper and lower extremities.
Abdominal imaging is optimally performed after fasting to minimize intestinal gas artifact. Lower limb testing should include imaging (3- to 5-MHz phased, curvilinear, or linear array transducer) of the abdominal aorta and iliac arteries for aneurysm and occlusive disease and the common femoral arteries for the presence of normal (i.e., triphasic) velocity spectra. Multiple scan windows are used to image the aorta at the level of the renal arteries, proceeding to the tibial arteries at the ankle. From the inguinal ligament distally, a 5- to 7-MHz linear array transducer is used to map the arterial tree. PSV and EDV should be reported in the arteries evaluated, with ratios of PSV compared with a more proximal segment of designated healthy vessel.
The findings on duplex mapping should be recorded in a schematic of the extremity arterial tree, analogous to an arteriogram, with notation of the site or sites of aneurysm or occlusive disease and measurements of velocity spectra at nondiseased arterial segments (common femoral, superficial femoral, popliteal, and tibial arteries) and at sites of stenosis (Fig. 16-15). Standardized values for arterial diameter and PSV in the lower limb arteries have been reported for healthy subjects under resting conditions (Table 16-4).55–59 Duplex mapping allows classification of atherosclerotic occlusive disease in the aortoiliac, femoral-popliteal, and popliteal-tibial arterial segments based on Trans-Atlantic Inter-Society Consensus (TASC) guidelines for grading of lesions from A through D according to lesion length and morphology.60
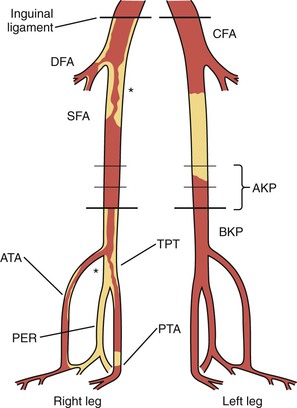
Figure 16-15 Schematic of the lower limb arteries for recording of arterial duplex map findings. Occlusion is denoted by a filled-in lumen and stenosis by an asterisk at the lesion. ATA, Anterior tibial artery; AKP, above-knee popliteal; BKP, below-knee popliteal; CFA, common femoral artery; DFA, deep femoral artery; PER, peroneal artery; PTA, posterior tibial artery; SFA, superficial femoral artery; TPT, tibioperoneal trunk.
Table 16-4
Artery Diameters and Peak Systolic Velocities in Healthy Subjects
| Artery | Diameter (cm)* | Velocity (cm/s)* |
| Infrarenal aorta | 2 ± 0.2 | 55 ± 12 |
| Common iliac | 1.5 ± 0.18 | 70 ± 18 |
| External iliac | 0.8 ± 0.13 | 115 ± 21 |
| Common femoral | 0.8 ± 0.14 | 114 ± 24 |
| Superior femoral | 0.6 ± 11 | 90 ± 14 |
| Popliteal | 0.5 ± 0.1 | 68 ± 14 |
| Tibial arteries | 0.3 ± 0.4 | 55 ± 10 |
* Values are means ± standard deviation.
Interpretation.
Duplex-derived data to estimate severity of stenosis of the lower extremity have not undergone a consensus recommendation process. Velocity-based criteria have been recommended by Cossman et al61 since 1989 (Table 16-5).
Table 16-5
Duplex Classification of Peripheral Artery Occlusive Disease61
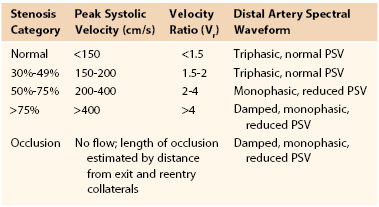
PSV, Peak systolic velocity.
The PSV/EDV ratio should be calculated from an adjacent segment of a nonstenotic artery. Although the PI can aid in grading severity of stenosis, this number is not routinely independently used.
Figure 16-16 depicts the classic progression of deterioration of ankle-brachial index (ABI), decreasing PSV, and decreasing PI.
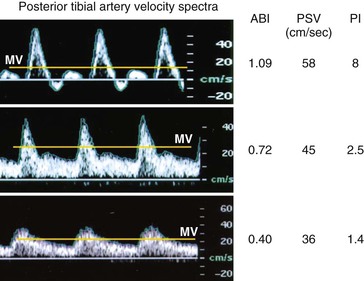
Figure 16-16 Velocity spectra, ankle-brachial index (ABI), and pulsatility index (PI) recorded from the posterior tibial artery of limbs with normal (ABI > 0.9, PI > 4), moderate (ABI = 0.5 to 0.8), and severe (ABI < 0.5, PI < 1.5) limb ischemia. MV, Mean velocity; PSV, peak systolic velocity.
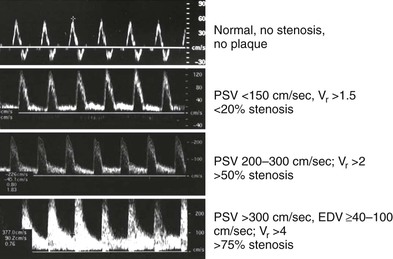
Classification of peripheral arterial stenosis is based on duplex-derived criteria, similar to carotid duplex testing (e.g., PSV, EDV, and PSV ratio across a stenosis identified by color Doppler imaging) (Fig. 16-17; see Table 16-5). A doubling or step-up in PSV to more than 150 cm/s (Vr > 2) indicates 50% or greater diameter reduction stenosis. Duplex criteria for a critical flow-limiting stenosis include loss of the triphasic waveform, spectral broadening with an increase in velocity (PSV > 200 cm/s, EDV > 0 cm/s), and Vr greater than 3 across the stenosis. Higher degrees of stenosis (>75%) are associated with an EDV higher than 100 cm/s and a Vr above 4.62
Accuracy.
A prospective comparison of DUS to contrast-enhanced MRA was performed with 152 patients, with conventional digital subtraction angiography as the “gold standard.” A PSV ratio of more than 2.5 was used to define a significant stenosis. Duplex had sensitivity, specificity, and overall accuracy of 76%, 93%, and 89%, respectively, whereas MRA had a sensitivity of 84%, a specificity of 97%, and an overall accuracy of 94%, with statistically significant improvements in MRA sensitivity (P = .002) and specificity (P = .03).63 Collins et al64 performed a systematic review of the literature comparing the three different imaging modalities. In detecting a greater than 50% stenosis, contrast-enhanced MRA demonstrated a median sensitivity and specificity of 95% and 97%; CTA showed a sensitivity and specificity of 91% and 91%; and DUS showed a sensitivity and specificity of 88% and 96%. For detection of occlusions, contrast-enhanced MRA was more sensitive and specific than CTA or DUS.
Iliac Arteries
The iliac arteries can be evaluated either by direct assessment via interrogation of the iliac artery or by indirect measures of common femoral artery waveform and velocity assessment. Direct assessment requires lower frequency abdominal probes and is limited by body habitus as well as by other factors (e.g., tortuosity, deep vessels) compared with indirect assessment of the femoral arteries.
Interpretation
Direct Imaging Criteria.
Direct imaging criteria for iliac artery stenosis include the following: for greater than 50% stenosis: PSV higher than 200 cm/s or PSV ratio of 2.5 or more; for greater than 75% stenosis: PSV ratio above 5.0 and EDV higher than 40 cm/s.65 PSV of 400 cm/s or more is suggestive of greater than 75% stenosis.65
Indirect Imaging Criteria.
Reduced velocities in the common femoral artery (<45 cm/s) with an associated monophasic waveform pattern are nearly 90% accurate in identifying a proximal iliac artery lesion without direct iliac artery evaluation. In addition, Shaalan et al66 did not find any statistical difference in velocities of the common femoral artery by gender or in the presence of significant ipsilateral superficial femoral artery or contralateral iliac artery disease.
Accuracy.
The accuracy of DUS for detection of iliac artery disease is as follows.
Direct Imaging.
For greater than 50% stenosis (PSV > 200 cm/s): 95% sensitivity, 55% specificity, 68% PPV, 91% NPV, and 75% accuracy; for greater than 75% stenosis (EDV > 40 cm/s): 70% sensitivity, 90% specificity, 64% PPV, 92% NPV, and 86% accuracy; for greater than 75% (with Vr > 5.0): 65% sensitivity, 91% specificity, 65% PPV, 91% NPV, and 86% accuracy.65
Indirect Imaging.
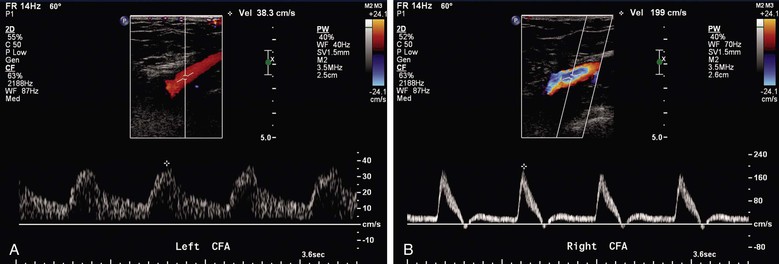
An abnormal common femoral artery waveform contour (monophasic or biphasic) differentiated ipsilateral iliac artery stenosis of less than 50% from stenosis of greater than 50%, with 95% sensitivity, 89% specificity, 89% PPV, 95% NPV, and 92% accuracy. In differentiating between groups with greater than 50% stenosis and occlusion of the ipsilateral iliac artery, the specificity, PPV, and accuracy for PSV lower than 45 cm/s combined with a common femoral artery monophasic waveform are 97%, 92%, and 88%, respectively (Fig. 16-18).
Femoral-Popliteal and Tibial Arteries
Studies, including a prospective blinded comparative study, have shown good agreement in the femoral-popliteal segment between DUS and digital subtraction angiography with use of a Vr of more than 2 for defining a greater than 50% stenosis by DUS. Agreement was better in the supragenicular than in the infragenicular segments.67 In a comparison of the agreement with digital subtraction angiography, specific areas had poor correlation: profunda femoral artery, tibioperoneal trunk, peroneal artery, and crural arteries. In addition, a report has recommended the combined use of a PSV higher than 200 cm/s and a Vr above 2 to predict a greater than 70% femoropopliteal stenosis.68
The sensitivity and specificity of DUS in the femoral-popliteal arteries depend on criteria used to determine the degree of stenosis. With use of a Vr above 2.4 in detecting a greater than 50% stenosis in the femoral artery, the sensitivity, specificity, PPV, and NPV were 81%, 93%, 84%, and 91%.66 A combined Vr above 2.0 and a PSV higher than 200 cm/s was associated with a sensitivity, specificity, PPV, and NPV of 79%, 99%, 99%, and 85% in detecting a greater than 70% stenosis.68
In the tibial arteries, the largest series reporting the accuracy of DUS in detecting 50% stenosis found a sensitivity of 88%, specificity of 75%, PPV of 83%, and NPV of 81% in 1690 infrageniculate segments correlated with conventional angiography69 (see Table 16-5).
Limitations.
For the aortoiliac disease segment, body habitus is the main limitation. For infrainguinal stenosis, the major limitation of accuracy is the presence of a proximal stenosis, which can falsely decrease distal velocities. Consequently, the velocity ratio may more accurately identify focal areas of stenosis. DUS may signify a high-grade stenosis instead of occlusion if a collateral vessel is visualized therefore falsely demonstrating flow adjacent to an occluded vessel. Incomplete vessel imaging may occur as a result of poor patient cooperation or acoustic shadowing caused by plaque calcification. Arterial segments difficult to image include the proximal external iliac artery, internal iliac origin, and tibioperoneal trunk. Calcific changes in the tibial arteries can decrease the accuracy of velocities.
Duplex Surveillance
Bypass Graft and Intervention Surveillance
Vein Grafts
A surveillance program after lower limb vein bypass grafting is recommended, but the extent of testing, including routine duplex testing, remains controversial.70 Current recommendations include a baseline examination within 30 days of surgery, if it is not performed intraoperatively, and subsequent examinations at 6-month intervals, then annually after the first year for vein grafts.19 However, an opposing view by TASC II recommended surveillance with physical examination and ABI only.60 Duplex surveillance has been strongly advocated by the University of South Florida group. The latest recommendations for duplex surveillance of infrainguinal vein grafting reported improved efficacy of duplex surveillance with rigorous imaging for high-risk bypasses.70 When it is conducted appropriately, a graft surveillance program should result in a graft failure rate of less than 3%/y. It can be anticipated with DUS surveillance that approximately 20% of infrainguinal vein bypasses will have either a residual operative stenosis or developing graft stenosis within 1 year of reconstruction.
Technique.
Similar to native infrainguinal arterial examination, B-mode, color-flow, and pulsed Doppler imaging should be performed of the inflow, conduit, and outflow vessels. B-mode imaging can often identify early technical issues (i.e., retained valves or sclerotic vein segments). Pulsed Doppler with waveform analysis should be mapped of the lower limb with PSV, EDV, and Vr recorded. Specifics of the stenosis should also be recorded: diameter of the vein in transverse imaging above and below the stenosis, including length of stenosis in centimeters and anatomic location.
Interpretation.
A combination of ABI, PSV, and Vr has been used to stratify patients into risk of subsequent vein graft failure. A PSV higher than 180 cm/s with associated Vr of 2.0 and no change in ABI correlates well with a 50% stenosis. A critical vein graft stenosis with impending failure has a PSV higher than 300 cm/s, a Vr of more than 3.5, and a decrease in ABI by 0.15 or more. Refer to Table 16-6 for risk stratification of failure.
Table 16-6
Risk Stratification for Vein Graft Occlusion by Duplex Criteria
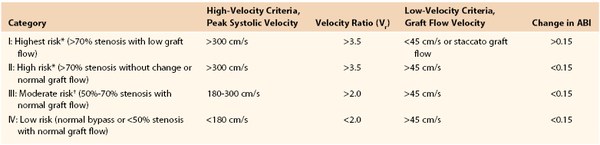
* Likelihood of progression of stenosis or graft thrombosis within 3 to 6 months is 40% to 50%.
† Of early (<3 months) lesions, 20% to 30% regress, 10% to 20% remain stable, and 40% to 50% progress to greater than 70% stenosis.
ABI, Ankle-brachial index.
Vein graft lesions with the duplex-derived velocity spectra of a high-grade stenosis (PSV > 300 cm/s, EDV > 20 cm/s, Vr across the stenosis >3.5) correlate with a greater than 70% diameter reduction stenosis and should be repaired (see Fig. 16-6). In a prospective study, application of these threshold criteria identified all grafts at risk for thrombosis, and only one lesion with high-velocity criteria regressed. Multiple investigators have observed an approximately 25% incidence of graft thrombosis in stenotic bypasses when a policy of no intervention was followed.70–73
The risk for graft thrombosis is predicted by using the combination of high- and low-velocity duplex criteria and decreases in ABI (see Table 16-6). In the highest risk group (category I), the development of a pressure-reducing stenosis produces low flow in the graft, which will result in thrombosis if it is decreased below the “thrombotic threshold velocity.” Prompt repair of category I lesions is recommended, whereas category II lesions can be scheduled for elective repair within 1 to 2 weeks. A category III stenosis (PSV of 180 to 300 cm/s, Vr < 3.5) does not reduce pressure or flow in the resting limb. Serial scans at 4- to 6-week intervals are recommended to determine hemodynamic progression of these lesions. An important feature of a “graft-threatening” stenosis is its propensity to progress in severity, to reduce graft flow, and to form surface thrombus—events that can precipitate thrombosis. By use of serial duplex scans, a category III stenosis that does not progress can be distinguished from a progressive lesion that needs to be repaired. The majority (approximately 80%) of bypass grafts will have no stenosis identified (i.e., category I scan). For these patients, surveillance at 6-month intervals is recommended. In patients with category I scans, a graft flow velocity lower than 40 cm/s indicates a “low-flow” bypass that is at increased risk for thrombosis by the concept of the thrombotic threshold velocity, which is lower in autologous vein than in prosthetic bypasses. Prescribing an anticoagulation regimen of warfarin to maintain the prothrombin time at an international normalized ratio of 1.6 to 2 and antiplatelet therapy (aspirin, 81 mg/day, or clopidogrel bisulfate, 75 mg/day) may reduce the incidence of low-flow vein bypasses.70 Patients who are at high risk for development of vein graft stenosis70 include those with abnormal results on baseline testing (PSV, 180-300 cm/s; Vr, 2-3.5), multisegment venous conduit, repeated bypass grafting, and need for warfarin therapy (Fig. 16-19).
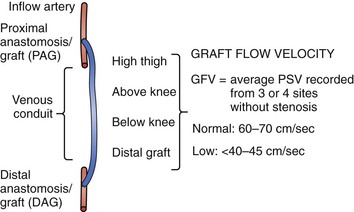
Prosthetic Grafts
Although it is not supported by the TASC II recommendations, Mohler et al,19 in a consensus document, support the surveillance of prosthetic reconstructions at baseline and at 6-month intervals, similar to vein reconstructions. Duplex criteria were recommended by Stone et al71 for patients after femoral-femoral bypass grafting, with a PSV higher than 300 cm/s in the inflow iliac artery and midgraft velocity lower than 60 cm/s predictive of graft failure. When duplex-directed intervention was performed, patency at 5 years (assisted patency) was 88%. Patency appeared to be improved in comparison to most reports in the literature of patency without surveillance.
Duplex surveillance of prosthetic grafts does not appear to detect correctable lesions as in vein bypass grafts. Surveillance appears to serve more as a predictor of graft thrombosis by the detection of midgraft velocities below 45 cm/s. It has been shown that prosthetic grafts with low velocity benefit from warfarin to improve patency, which may justify surveillance. Brumberg et al72 recommended the use of warfarin if the mean graft velocity was below 60 cm/s to reduce the incidence of polytetrafluoroethylene bypass graft thrombosis.
Peripheral Interventions
Current guidelines recommend routine surveillance of peripheral arteries after percutaneous interventions.19 However, the role of duplex examination after percutaneous peripheral interventions has been reported sparsely in the literature. Threshold criteria for repeated angiography included a PSV above 300 cm/s and a Vr of 2, which is commonly predicated on a clinical deterioration, an ABI decrease by 0.15, or an abnormal common femoral artery waveform analysis suggesting inflow disease. DUS after iliac artery interventions may serve a limited role. Back et al73 evaluated 67 patients with a mean follow-up of 1 year, finding a 4% stent thrombosis and only 20% of patients with potentially failing stents.
Similar to iliac artery percutaneous interventions, data are limited to support the routine use of duplex surveillance of femoral-popliteal interventions. Several studies have evaluated DUS in determining recurrent stenosis of the femoral-popliteal segment after catheter-based procedures, with conflicting results.74
Aneurysms
Indications.
Indications for DUS include screening of patients at high risk for aneurysm and evaluation of patients with symptoms potentially attributable to aneurysms.19 Patients with pulsatile masses in the carotid or peripheral artery should be evaluated for the presence of aneurysms.
Technique.
A curved sector transducer with 1- to 5-MHz imaging head should be used to evaluate the aortoiliac segment in transverse and longitudinal planes with B-mode. The suprarenal, infrarenal, bifurcation, and iliac arteries should be imaged perpendicular to their centerline. Diameters in anteroposterior and transverse projections are recorded with assessment of presence of mural thrombus. Color flow is then used to determine the degree of mural thrombus present. Cross-section image should be captured during maximal pulsation with the cardiac cycle to determine calibrated measurement of maximum anterior-posterior and transverse diameter. Carotid and peripheral artery aneurysms can be assessed with higher frequency probes, as described for patients with occlusive disease. Because of mural thrombus, noninvasive imaging, not arteriography, is the modality of choice for screening and surveillance, and computed tomography is considered the gold standard for comparison.
Interpretation.
Maximum aneurysm diameter should be reviewed with confirmation of adventia-adventia measurements perpendicular to the centerline axis. Aneurysm reporting (abdominal aorta, iliac, femoral, popliteal) should include a description of its morphology (saccular versus fusiform) and extent and of the presence of mural thrombus or dissection. During evaluation of peripheral artery aneurysms, multiple sacs should be ascertained as these are frequently seen in patients with femoral pseudoaneurysms.
Accuracy.
Compared with computed tomography, the frequency of a 5-mm discrepancy in measurement varies from 8% to 33%.75,76 Significant discrepancy between ultrasound and computed tomography has been reported in aneurysms between 5.0 and 5.4 cm, with 70 on computed tomography scan demonstrating a measurement of more than 5.5 cm.76 Many authors have recommended computed tomography examination when the aneurysm size exceeds 5.0 cm. Data are limited on the accuracy of ultrasound-based imaging in the carotid and peripheral arteries.
Limitations.
Tortuous anatomy can potentially lead to inaccurate dimensional measurements. As in other regions of the abdomen, the presence of bowel gas and obesity can hamper image quality. Interobservational differences with ultrasound or computed tomography imaging are generally less than 2 mm but can be up to 0.5 cm. Inflammatory aneurysms may also have poorly defined tissue definition, and adventitia-to-adventitia measurements can be obscured.
Abdominal Aortic Aneurysm Stent-Grafts
Technique.
A curved sector transducer with 1- to 5-MHz imaging should be used with B-mode to assess the aneurysm sac size, similar to a native aneurysm examination. Duplex instrumentation should be set up for detection of low flow, and both color and power Doppler imaging are performed to identify attachment site (type I), patent side branch (type II), or stent-graft component separation (type III) endoleaks. Velocity spectra are recorded at sites of flow within the aneurysm sac outside of the stent graft. Flow in patent lumbar or inferior mesenteric artery (IMA) side branches may exhibit to-and-fro velocity spectra or a monophasic waveform indicating flow into the abdominal aortic aneurysm sac from one side branch and out a different side branch. Velocity in type II endoleaks is recorded because low-velocity (<80 cm/s) type II aneurysms are more likely to thrombose.77–79
The use of intravenous ultrasound contrast agents may improve the sensitivity and specificity for detection of an endoleak. The ultrasound beam causes the microbubble agent to resonate at a certain frequency that increases all blood flow signals when harmonic duplex imaging is performed. After intravenous administration, the contrast agent circulates in the blood pool for 10 to 15 minutes, which allows imaging of the abdominal aortic aneurysm sac for flow outside the stent-graft or patent sac side branches.78 Duplex imaging is not reliable for the detection of device migration.
Interpretation.
Maximum aneurysm sac size should be determined and compared with previous examination findings to determine changes in aneurysm size with time after endovascular exclusion. Assessment of the aneurysm sac for flow and categorization of endoleak type should be performed. The risk of limb-related complications has been shown to be potentially increased when PSV within the graft limbs exceeds 300 cm/s.
Accuracy.
Duplex scanning for detection of endoleaks is on the order of 80% to 85%, and it may be more sensitive than contrast-enhanced computed tomography unless delayed imaging is included in the scan protocol.80 Wolf and associates reported a sensitivity of 81% and a specificity of 95% (PPV, 94%; NPV, 90%) for DUS in comparison to the gold standard computed tomography for detection of endoleaks.80 A meta-analysis of DUS and contrast-enhanced ultrasound versus computed tomography to detect endoleaks after endovascular aneurysm repair found a sensitivity of 77% and a specificity of 94% for DUS. Improved results were seen in a smaller sample of 288 patients with a 98% sensitivity and an 88% specificity with the contrast-enhanced duplex scanning.81
Pseudoaneurysms
Duplex scanning is the preferred initial imaging modality to evaluate complications that follow percutaneous access through the femoral, brachial, and radial arteries.82,83 DUS is not only the preferred initial diagnostic modality, but it also provides a duplex-guided option for treatment or surveillance. Point of care service may be used to decrease the frequency and cost of surveillance as previously demonstrated by our group.83 Indications for testing may include pain, pulsatile mass, large hematoma, and bruit or thrill at an arterial access site.84 Hematomas are the most frequently encountered complication of percutaneous access. Other complications that can be assessed by duplex imaging include pseudoaneurysm, arterial thrombosis, and arteriovenous fistula.
Technique.
A 3- to 9-MHz linear array transducer is used in most patients; however, in morbidly obese patients, a curved sector transducer with 1 to 5 MHz may be necessary. B-mode imaging should evaluate pseudoaneurysm size in anteroposterior and transverse dimensions. Maximum diameter and number of aneurysm sacs as well as the dimensions of residual flow within the aneurysm sac should be recorded. The neck diameter, length, and vessel of origin should be assessed. Imaging should also include color flow in longitudinal and transverse imaging planes.
Interpretation.
Hematomas lack flow and cannot be differentiated from a thrombosed pseudoaneurysm. Duplex characteristics of pseudoaneurysms include flow outside the artery, the presence of a neck from the puncture site to the aneurysm sac, and a classic to-and-fro flow pattern in the neck corresponding to blood flow into the aneurysm during systole and sac emptying during diastole (see Fig. 16-19). The proximal native arterial segment often has a low-resistance pattern compared with the more distal segment. This is in contrast to an arteriovenous fistula, which will have arterialization of the draining vein and a low-resistance pattern in the artery proximal to the fistula. On color-flow imaging, there is often perivascular speckling due to vibrating soft tissues from high flow rates.
Accuracy.
Sensitivity and specificity for detection of pseudoaneurysm are high at 95% and 95%.85 A prospective study of 53 patients with suspected groin-related complications compared physical examination with DUS evaluation. All patients underwent operative exploration. The results of these evaluations were compared with the findings at operation. Physical examination was 100% sensitive and 100% specific in the diagnosis of arteriovenous fistula, whereas duplex scan achieved a sensitivity of only 58% and a specificity of 100%. Physical examination was 92% sensitive and 93% specific in the detection of femoral pseudoaneurysm compared with a sensitivity of 83% and a specificity of 100% for duplex scanning.86
Limitations.
Large overlying hematomas can obscure imaging, as can large body habitus. Uncommonly, a branch with adjacent hematoma may be misinterpreted as a pseudoaneurysm. Lymph nodes can also be vascularized and provide a false-positive examination finding; they can usually be differentiated by a radial flow pattern. Branch vessels can be confused with needle tracks or a pseudoaneurysm neck.
Duplex-Guided Thrombin Injection.
This ultrasound-guided examination can be both diagnostic and therapeutic for iatrogenic pseudoaneurysms. With gray-scale imaging, a spinal needle is positioned in the periphery of the aneurysm sac with the tip of the needle verified. Color Doppler should be used to confirm the needle tip is in the aneurysm sac within the flow region before changing to B-mode and injection performed. Injections are done with small aliquots of 0.1 mL of thrombin, and the aneurysm is reimaged in color flow to assess for successful closure. After the injection is completed, Doppler examination of the extremity is performed to assess for successful aneurysm thrombosis and for distal embolization.
Renal Artery
Hypertension and sudden deterioration in renal function are the most common indications for renal duplex scanning of patients for renal artery stenosis. Renal and hilar artery RI is increased in patients with elevated serum creatinine levels and has been associated with renal parenchymal disease. In addition, RI has been shown in large series to be an independent predictor of transplant failure by multivariable analysis.87 Retrospective clinical studies have reported that a duplex-derived renal RI of less than 0.8 is associated with improvement in renal function and hypertension after successful renal intervention.88,89 Unfortunately, duplex accuracy in renal artery evaluation is likely to represent the poorest predictive and reproducible results compared with all other arteries discussed in this chapter.
Indications.
Indications for renal artery DUS evaluation include early-onset hypertension (<35 years of age), acute renal failure with aortic dissection, unknown etiology of azotemia, and unexplained size discrepancy between kidneys (>1.5 cm difference). In addition, patients with malignant or resistive hypertension or worsening chronic hypertension should be considered for renally mediated hypertension.19
Technique.
Duplex scanning of the renal arteries is best performed in the morning after an overnight fast to minimize intestinal gas and to provide optimal conditions for imaging of the visceral aortic segment, its branches, and adjacent veins. The examination begins with the patient in the supine position with the head slightly elevated 20 degrees, which allows the viscera to descend in the abdomen. Through a midline scanning window, 3- to 5-MHz abdominal transducers with focal regions adjusted to the appropriate depth are used to identify the aorta, superior mesenteric artery (SMA), and proximal renal arteries. Allowing patients to raise their arms over the head elevates the ribs and improves transducer access for imaging of the renal arteries. The aorta is scanned from the level of the diaphragm to the origins of the iliac artery. Identification of the celiac artery and SMA arising anteriorly helps in locating the renal artery origins. Transverse color Doppler imaging of the aorta at the level of the SMA will locate the anteriorly positioned left renal vein and the proximal right and left renal arteries arising below the SMA takeoff and slightly posterior to the aorta. The course of the right renal artery is posterior to the inferior vena cava. Use of color or power Doppler helps trace the renal artery course for velocity spectral recording along its length to the extent possible. The examiner should be aware of anatomic variations (duplicate or multiple renal arteries, pelvic and horseshoe kidneys, retroaortic renal vein, aneurysmal dilatation of the aorta or renal or visceral arteries) and the color and power Doppler features of fibromuscular hyperplasia. Care should be taken to record velocity spectra at angles of insonation of less than 60 degrees. When velocity spectra are recorded from the renal parenchyma (interlobar and arcuate arteries, three recording sites), a 0-degree Doppler angle of insonation should be assigned. Kidney length, which correlates with renal mass and function, is measured pole to pole during maximum inspiration by use of a flank approach to optimize visualization of the renal cortex margins. The PSV and EDV should be sampled from the origin and the proximal, mid, and distal renal arteries. The RI is calculated by examining the interlobar or segmental arteries according to the following formula:
Interpretation.
Renal artery stenosis has historically been and continues to be categorized as less than or greater than 60% stenosis. Interpretation is based on the maximum PSV within the most stenotic region of the main renal artery, which typically occurs at the ostium in atherosclerotic disease. Normal renal PSV ranges from 70 to 127 cm/s. Diagnostic criteria for greater than 60% stenosis include a color-flow jet with post-stenotic turbulence and a PSV higher than 180 to 200 cm/s (Table 16-7).90 However the largest series to assess the optimal criteria suggests a higher threshold of PSV of 285 cm/s.91
Table 16-7
Duplex Criteria for Classification of Renal Artery Stenosis90
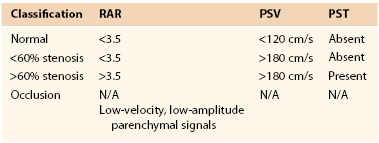
RAR, Renal-aortic velocity ratio; PSV, peak systolic velocity; PST, post-stenotic signal; N/A, not applicable.
A renal-aortic velocity ratio (RAR) above 3.5 has also been used to determine a greater than 60% renal artery stenosis. The recent publication recommending a higher PSV by AbuRahma et al91 recommended an RAR of 3.7 for detection of significant renal artery stenosis. Other duplex parameters that suggest a significant renal artery stenosis include damping of the intrarenal artery signal, acceleration time of more than 100 milliseconds, and pulsus tardus waveform (prolonged systolic acceleration evident in delayed systolic upstroke and rounded systolic peak). The finding of a pulsus tardus waveform is a useful secondary criterion for critical renal artery stenosis.92 The RAR cannot be used for interpretation when the suprarenal aorta is aneurysmal or the PSV is lower than 45 cm/s. In this instance, a PSV higher than 200 cm/s is the criterion for greater than 60% diameter reduction stenosis and has a diagnostic accuracy similar to that with the use of RAR alone. Interpretation of renal artery occlusion requires the absence of renal artery flow, a small (<9 cm) kidney length, and a low (PSV < 20 cm/s) hilar artery flow. The renal RI appears to be the best predictor of transplant failure, with some series using higher than 0.7 and some higher than 0.8 as abnormal levels.
Accuracy.
Renal duplex for grading of atherosclerotic renal artery stenosis (<60%, >60%, occluded) has a sensitivity of 88% to 85% and a specificity of 92%. Overall agreement with angiography is in the range of 80% to 90%.92–95 Accuracy is influenced by the presence of diseased accessory renal arteries but not by concomitant aortoiliac disease or renal insufficiency.
In a recent series comparing the best parameters and classical criteria, AbuRahma et al91 reported a PSV higher than 285 cm/s for detection of a greater than 60% stenosis; the sensitivity, specificity, and overall accuracy were 67%, 91%, and 81%, respectively. In the same series, a PSV higher than 180 cm/s and an RAR of 3.5 had a sensitivity, specificity, and overall accuracy of 72%, 81%, and 78%. Changing to a threshold criterion of a PSV higher than 200 cm/s changed only the specificity to 83%.
The only prospective comparison of DUS, captopril renography, MRA, and CTA in assessing renal artery stenosis found that MRA and CTA were more sensitive and specific than ultrasound or captopril renography (P < .001), with a reported sensitivity and specificity for DUS of 73% and 71% versus 94% and 62% for CTA and 93% and 91% for MRA.95
Limitations.
As with other abdominal vascular examinations, body habitus and bowel gas can compromise imaging quality and therefore examination accuracy. Multiple renal arteries can exist, and missing the main renal artery can provide misleading results. Overall, the percentage of inadequate examinations is approximately 10%, much higher than other imaged territories.
Renal Intervention
Controversy exists about the role of surveillance after renal artery stenting for DUS. Several series continue to use the native renal artery criteria to determine in-stent restenosis, whereas some authorities, such as Fleming et al,96 believe that the velocity criteria should be more appropriately raised. Intraoperative evaluation and surveillance of renal artery bypass grafting can also be challenging for technicians secondary to varying inflow sites (i.e., splenic, hepatic, or aortic artery). With the limited number of bypasses performed today, it is difficult to arrive at a recommendation for this issue.
Interpretation.
Currently, there is consideration for a higher PSV to determine significant in-stent stenosis. A more accurate PSV for determining a significant in-stent restenosis appears to be 250 cm/s.96 After surgical bypass, the anastomosis should be assessed for velocities exceeding 200 cm/s and for damped waveforms in the hilar arteries.97
Accuracy.
The sensitivity, specificity, and accuracy of using a PSV of 180 cm/s to determine a greater than 60% stenosis are 73%, 80%, and 77%, whereas the sensitivity, specificity, and accuracy of using a PSV of 250 cm/s are 59%, 95%, and 83%.96
Transplantation
Approximately 10% of renal transplants will develop renal artery stenosis during follow-up. Most centers therefore employ regular surveillance. Unlike in native renal artery stenosis, in which PSV of the renal artery appears to be the most important predictor of renal artery stenosis, follow-up imaging of the transplant recipient is more involved. Stenosis can occur throughout the length of the renal artery but generally occurs at the anastomosis with the iliac artery.
Technique.
Previous operative notes should be reviewed to document the origin of the transplanted renal artery. A thorough examination should include the aorta and iliac arteries. The renal vein should also be assessed for patency and any evidence of thrombus. Extrarenal evaluation should include PSV and EDV measurements in the iliac and renal (proximal, mid, and distal) arteries. The classic parvus-tardus pattern of intrarenal signal is a loss of the early systolic peak with a prolongation of the acceleration time. In addition, the calculation of the renal RI should be recorded.
Interpretation.
A PSV exceeding 250 cm/s and a PSV ratio compared with distal external iliac artery of more than 1.8 are suggestive of significant disease. An RI exceeding 0.7 has corresponded to transplant failure. A prolongation of the acceleration time of more than 0.10 second has also been associated with proximal renal artery stenosis.
Accuracy.
A PSV higher than 250 cm/s for detection of a greater than 50% stenosis has a sensitivity of 100% and a specificity of 95%.98
Mesenteric Artery
The application of DUS for the diagnosis of chronic mesenteric ischemia is well established, and it is used to screen patients with “abdominal angina,” weight loss, and sitophobia (fear of food) for occlusive visceral artery disease. In the 1980s, the University of Washington vascular laboratory group used duplex scanning to characterize normal and abnormal velocity spectra of the mesenteric and splanchnic circulations, as have multiple groups during the past 3 decades.99–106 Our group has recently reported on the largest series of patients with both visceral artery duplex imaging and conventional digital subtraction angiography to assess duplex imaging and accuracy of detecting both native visceral arterial stenosis and stenosis after stent-supported angioplasty.102,103
Indications.
Patients with abdominal pain with suspected acute or chronic mesenteric ischemia or ischemic colitis should be assessed for a hemodynamically significant visceral lesion. Patients are also often evaluated preoperatively before liver transplantation.
Technique.
A low-frequency 2- to 5-MHz curvilinear phased array transducer with a Doppler angle of 60 degrees or less to maximize consistent measurements is used. The supine position in a fasting patient is typically recommended, but an oblique window may have to be used to profile the visceral vessels. Transverse and sagittal planes are used while the probe is placed just inferior to the xiphoid process. After visualization of the celiac artery, attention is focused on the SMA. The origins of both vessels are best seen in the sagittal view, with the major celiac branches (hepatic, splenic, and left gastric arteries) viewed from a transverse imaging plane where the classic “seagull sign” is best demonstrated. Assessment should be made in both gray scale and color Doppler followed by Doppler analysis with a sample volume of 1.5 mm in the orifice of the proximal region of both celiac artery and SMA. The PSV and EDV as well as post-stenotic turbulence should be recorded.
Interpretation.
Velocity criteria developed by the University of Washington vascular laboratory group are shown in Box 16-1. Grading of stenosis of the visceral arteries should include assessment of the PSV, the EDV, and the mesenteric-aortic ratio. The most accurate of these ultrasound-detected abnormalities is the PSV. Additional findings include direction of flow within the visceral artery (i.e., a reversal of flow in the hepatic artery is highly suggestive of critical stenosis or occlusion of the celiac artery).102,104,106 Occlusion or high-grade stenosis of the celiac artery can result in falsely elevated PSV in the SMA and alter the fasting signal to a low-resistance waveform and vice versa.
If the right hepatic artery arises from the SMA, the fasting SMA spectral waveform is monophasic with an RI similar to that of the celiac artery, but the PSV should be less than 150 cm/s in the absence of stenosis.99,104
Accuracy.
A study by AbuRahma et al102,103 reported the following. For criteria defining a lesion greater than 70% stenosis of the celiac artery, a PSV higher than 320 cm/s had a sensitivity of 80%, a specificity of 89%, and an overall accuracy of 85%. An EDV higher than 100 cm/s had a sensitivity of 58%, a specificity of 91%, and an overall accuracy of 77%. For criteria defining a greater than 70% lesion in the SMA, a PSV higher than 400 cm/s had a sensitivity of 72%, a specificity of 93%, and an overall accuracy of 85%. An EDV higher than 70 cm/s had a sensitivity of 65%, a specificity of 95%, and an overall accuracy of 84%.
Limitations.
Anatomic variants of the mesenteric circulation, present in up to 20% of patients, can contribute to interpretation errors. Body habitus and overlying bowel gas can obstruct view of the vessels and underlying structures, limiting the evaluation.
Mesenteric Revascularization
Duplex testing is best applied before and after surgical revascularization or endovascular treatment of chronic mesenteric ischemia. A normal intraoperative examination finding is predictive of clinical success and a low 30-day thrombosis rate (<4%). The vascular group at the Mayo Clinic recommended intraoperative duplex assessment on the basis of an 8% incidence of abnormal results that led to immediate graft revision; normal results of duplex testing were associated with decreased graft-related complications, including thrombosis and death. Moneta and colleagues published detailed duplex data comparing retrograde and antegrade visceral bypass grafts; they found similar velocities in grafts originating from the aorta but higher inflow PSV in retrograde iliac-to-SMA bypasses.105 Expected duplex findings in SMA bypass grafts, including 6-mm-diameter polytetrafluoroethylene conduits, include PSV in the range of 150 to 200 cm/s and volume flow of 1 to 1.5 L/min.
After mesenteric stenting, both positive (stent expansion) and negative (wall recoil, myointimal hyperplasia, arcuate ligament compression) remodeling occurs with the potential for changes in lumen caliber. The in-stent stenosis that develops in 20% to 40% of patients after SMA or celiac angioplasty is caused by myointimal hyperplasia; it can be detected and the stenosis graded with DUS. Stent fracture cannot be identified.
Interpretation.
A normal visceral stent examination finding is associated with a widely patent color-flow lumen and nondisturbed velocity spectra, whereas an elevation of the PSV to more than 400 cm/s or an EDV higher than 105 cm/s has correlated with a greater than 70% stenosis for both the celiac artery and the SMA. When borderline velocity criteria for stenosis are recorded, testing after a meal should be performed.
Accuracy.
For the celiac artery, a PSV higher than 363 cm/s used for determination of a greater than 70% in-stent stenosis has a sensitivity of 88%, a specificity of 92%, and an overall accuracy of 90%. For the SMA, a PSV higher than 412 cm/s used for determination of a greater than 70% in-stent stenosis has a sensitivity of 100%, a specificity of 95%, and an overall accuracy of 97%. The EDV for both celiac artery and SMA in-stent restenosis was statistically inferior to the PSV.103
Dialysis Access
Currently, more than 500,000 patients with renal disease require hemodialysis in the United States. Access is critical for these patients, and creation and maintenance of a durable, functional access is a complicated, dynamic process. Significant preoperative planning is involved to ensure proper selection of access location, and thorough preoperative evaluation is necessary to determine whether the patient would benefit from a fistula or whether circumstances dictate placement of a prosthetic conduit. Furthermore, preoperative evaluation of the arterial and venous anatomy of both upper extremities allows selection of access placement with information about other potential access procedures that are feasible should the initial access fail.
Whereas the cornerstone of any presurgical workup is a thorough history and physical examination, arterial and venous assessment can be limited, especially in patients who are obese, who have had multiple previous access surgeries, or whose natural anatomy of the superficial veins is unusually deep. Malovrh108 found that physical examination failed to identify suitable vessels for arteriovenous fistula creation in more than half of all patients. DUS evaluation provides an effective and noninvasive modality for all stages of dialysis access creation: preoperative evaluation and planning, intraoperative placement, and postoperative evaluation and surveillance.
Preoperative Evaluation
Technique.
The examination uses an ultrasound duplex imager with pulsed wave and color-flow Doppler capability and Doppler spectral analysis. Curved and phased arrays are used to examine deeper structures, such as arteries and central veins, or during examination of obese patients. Linear arrays are used for more superficial imaging. Transducer frequencies include the C5-2/2.5 MHz, L7-4/4.0 MHz, L12-5/6.0 MHz, P4-2/2.0 MHz, and P4-1/2.0 MHz. High frequencies give better sensitivity to low flow, whereas low frequencies have better penetration.109
The patient is placed supine for brachial artery pressures, with the head turned away from the upper limb being examined. The central veins are assessed with low-frequency transducers, examining the distal innominate veins and the subclavian veins. The infraclavicular segments of the subclavian veins and the axillary veins are easier to image. Doppler findings suggestive of abnormality or stenosis include focal increases in flow velocity with post-stenotic turbulence proximally and a continuous flow pattern distally.110 Superficial veins are then examined. B-mode imaging in transverse orientation allows diameter measurement and visualization of tributary locations. The vein is compressed to ensure no evidence of stenosis, thrombosis, or occlusion. The longitudinal view and addition of color flow can provide additional anatomic and physiologic information as needed. The entire cephalic vein is scanned from the wrist to the confluence with the subclavian vein. The basilic vein is scanned from the wrist to the confluence with the brachial vein. Many laboratories use a tourniquet to aid with vein distention; if a tourniquet is used, a vein diameter of 2.5 mm is generally acceptable, whereas a diameter of more than 3 mm is preferred when no tourniquet is used.110 Arterial mapping is then performed. The subclavian, axillary, brachial, radial, and ulnar arteries are examined for atherosclerosis, tortuosity, or unusual anatomy; normal findings are triphasic waveforms with no significant focal velocity increases. Radial and ulnar artery diameters are measured at the wrist, and brachial diameters are also sometimes recorded. Brachial artery pressures are obtained from both arms for comparison, and discrepancies between sides can indicate inflow stenosis from the proximal arteries.
Interpretation.
The artery and vein diameters are analyzed. Arteries with diameters smaller than 1.5 to 2.0 mm have been associated with increased nonmaturation rates in arteriovenous fistulae.111 Venous diameter should be 2.5 mm or more for creation of an arteriovenous fistula and 4.0 mm or more for placement of a graft.111 Absence of segmental stenosis or occluded segments, continuity with the deep venous system, and contiguous length of nondiseased vein of more than 10 cm have also been predictive of improved outcomes with access creation.112 The presence of large tributaries or multiple branches should also be noted as these could affect maturation rates or ultimate function of the access. Vein wall thickening may indicate prior phlebitis, which along with current thrombus should be noted.
Accuracy.
In detecting relevant stenoses, DUS has a sensitivity and specificity of 90.9% and 100% for the subclavian artery, 93.3% and 100% for upper arm arteries, 88.6% and 98.7% for forearm arteries, and 70% and 100% for arteries of the hand.113 DUS has sensitivity, specificity, PPV, and NPV of 81%, 90%, 90%, and 78% for detection of venous stenosis, thrombosis, and occlusion.114 Sensitivities decrease for more proximal veins; sensitivity for detection of abnormalities is 79% for the subclavian vein, 75% for the innominate vein, and 33% for the superior vena cava.114
Limitations.
Patients with previous access attempts or revisions can present with distorted anatomy, areas of occlusion or thrombosis, and varying amounts of subcutaneous conduit, all of which can impede or confuse typical preoperative mapping procedures. Morbidly obese patients can present with vessels that are difficult to visualize completely. In addition, aberrant anatomy, multiple branches, or significant tortuosity can make single-vessel identification and complete tracing challenging.
Intraoperative Evaluation
Intraoperative assessment can be performed before the operation begins and at the completion of the procedure. Preprocedure evaluation is performed by the surgeon with a portable ultrasound machine capable of evaluation with B-mode and color duplex imaging. It consists of rapid B-mode imaging of the selected vein, verifying the preoperative, vascular laboratory–obtained diameters and ensuring continued patency of the vessel. This may be important if there has been a period between the initial vein mapping and the time of the actual access operation. In addition, superficial veins may dilate with patient sedation or general anesthesia, and veins initially believed to be inadequate may in fact achieve suitable preoperative diameters to allow use. Quick preoperative evaluation also can ensure no unforeseen errors before the skin incision is made. Any concerns by B-mode imaging can be further investigated with color duplex imaging.
The access can also be examined at the completion of the procedure. Typically, evaluation is by clinical assessment of the vein or graft, palpating for a thrill. A continuous wave Doppler examination will demonstrate low-resistance flow in the vein or graft. The surgeon should ensure that perfusion is maintained to the hand. The distal radial or ulnar pulses may be palpable, but normal physiologic shunting that occurs with access formation will likely require examination with continuous wave Doppler. The signals should be identified at the wrist, palm, and base of the digits. It is expected that these signals may be diminished and will be augmented with access occlusion. Duplex scanning of the arteriovenous anastomosis of a fistula and the arterial and venous anastomoses of a graft can identify technical errors, such as stenosis and residual intraluminal flaps or material. When a new arteriovenous fistula is created, the vein should have flows of 200 mL/min or more.110
Postoperative Evaluation
In the United States, reimbursement for DUS examinations will usually be made for indications surrounding abnormal fistula function or clinical signs and symptoms of access insufficiency.115 Findings suggestive of abnormal fistula function include difficult cannulation, thrombus aspiration, elevated venous pressure higher than 200 mm Hg on a 300 mL/min pump, elevated recirculation time of 15% or greater, and low urea reduction rate of less than 60%. Clinical findings of access insufficiency include access collapse, suggesting poor arterial inflow; poorly matured fistulae; loss of thrill; distal limb ischemia; signs of infection; and perigraft mass, aneurysm, or pseudoaneurysm.
Technique.
The instrumentation is similar to that described in the preoperative assessment. The examination should begin with evaluation of the inflow artery in transverse view to delineate the anatomy. The artery is then examined in longitudinal view; the area proximal to the access anastomosis is examined, measuring the PSV and EDV. Duplex images are then obtained at predetermined locations along the fistula or graft: inflow artery proximal to the fistula or graft; inflow artery distal to the fistula or graft; anastomotic sites; puncture sites; proximal, mid, and distal outflow vein or graft; and axillary and subclavian veins.109 Peak systolic velocities and waveforms should be measured in any area where velocity increase or turbulence is noted. Finally, B-mode imaging should be used to evaluate the depth of the access from the skin surface and conduit diameters along various points of the access. Diameter measurement is an important variable in the calculation of flow rates along various portions of the access, as seen by the following equation:

Interpretation.
DUS imaging performed after construction of dialysis access can accurately characterize the hemodynamics by measurement of volume flow and identification of stenosis.116 Testing enables recognition of a low-flow nonmaturing conduit, identifies lesions suitable for remedial intervention, documents adequate volume flow for effective dialysis before the first cannulation, and predicts access patency. The mean volume flow rate of forearm autogenous vein fistulae (800 ± 200 mL/min) is less than that of arm autogenous vein fistulae (1400 ± 400 mL/min) or prosthetic bridge grafts (1200 ± 200 mL/min). For a normally functioning dialysis access, the midconduit PSV is in the range of 200 cm/s and the arterial anastomotic PSV is in the range of 400 cm/s. A focal increase in a threshold PSV higher than 400 cm/s and a PSV ratio above 3 are the criteria for a greater than 50% diameter reduction stenosis. Robbin et al117 demonstrated that flow rates of 500 mL/min or higher are associated with maturity in nearly 90% of fistulae. Duplex-measured volume flow rates of less than 500 mL/min predict poor access function during hemodialysis and failure. A measured volume rate of less than 500 to 800 mL/min can be used as a threshold to recommend contrast-enhanced fistulography to define dialysis access anatomy and to image the central veins for stenosis or occlusion.
Accuracy.
Several studies have investigated the accuracy of duplex scanning to identify hemodynamically significant stenosis that develops in dialysis accesses in hopes of allowing potential interventions to diminish the chance of access failure. Grogan et al118 defined a hemodynamically significant stenosis of 50% or greater in either the arterial inflow or venous outflow using a systolic Vr of more than 2 as well as a systolic Vr of more than 3 and a minimum PSV of 400 cm/s for an anastomotic stenosis, with a sensitivity of 93% and a specificity of 94% confirmed by fistulography. With regard to flow rates and prediction of potential failing accesses, Back et al119 determined that a threshold conduit flow rate of 800 mL/min better discriminated failing and functional fistulae and bridge grafts (accuracy 77%) than a flow rate greater or less than 500 mL/min (accuracy 67%).
Limitations.
DUS measurements in dialysis accesses may be affected by pathologic change that alters flow measurements, such as the presence of a well-collateralized occlusion, low systemic pressure, or central venous stenosis or occlusion, as well as by technician error, such as poor Doppler angle.
Penile Evaluation
Penile DUS is an important imaging modality in the evaluation of erectile dysfunction, which affects as many as 30 million American men.120 Vascular evaluation may be indicated for patients with arteriogenic dysfunction, veno-occlusive disorders, Peyronie’s disease, priapism, and penile trauma.121
Technique.
Ultrasound examination of the penis is conducted with the patient supine or in the lithotomy position. High-frequency (7.5-14 MHz) linear array transducers are typically used. The penis is examined in transverse and longitudinal planes starting at the level of the glans and moving down to the base of the penis.121 Peak systolic velocities of the cavernosal arteries are then recorded, measured at the junction of the proximal third and distal two thirds of the penile shaft. When pharmacologic testing is necessary, prostaglandin E1 (10 to 20 µg) is injected into one of the corpora cavernosa laterally in the distal part of the penis.121 Other vasoactive agents used are papaverine (30 to 60 mg) and trimix (papaverine, phentolamine, and prostaglandin E1). Tumescence and rigidity as well as velocities are recorded in both cavernosal arteries at 5, 10, 15, 20, 25, and 30 minutes after injection. Velocities in the deep dorsal vein are also recorded.121
Interpretation.
Arterial insufficiency is demonstrated in the flaccid penis when the PSV is less than 10 cm/s in the cavernosal artery.122 The average PSV after injection of vasoactive agents in the normal patient has been found to be 30 to 40 cm/s; arterial insufficiency is diagnosed with PSVs lower than 25 cm/s.123 PSVs between 25 and 35 cm/s are equivocal, and secondary criteria for erectile dysfunction in this range include asymmetry of more than 10 cm/s in PSV, increase in the diameter of the cavernosal artery by 75% after intracavernosal injection, focal stenosis in the cavernosal artery, and retrograde flow.123 Acceleration time has also been used to detect cavernous atherosclerosis, with a cutoff point of less than 100 milliseconds indicating the presence of atherosclerotic disease.124 Adequate arterial inflow, short-duration erection, and persistent antegrade flow of 5 cm/s throughout all phases of erection suggest venous leak.125
Accuracy.
A PSV lower than 10 cm/s in the cavernosal artery of a flaccid penis predicts arterial insufficiency with an accuracy of 93%.122 A velocity threshold of 25 cm/s with cavernosal injection of vasoactive agents has a 92% accuracy in diagnosis of arterial insufficiency.123 An acceleration time cutoff point of 100 milliseconds has a sensitivity of 66% and a specificity of 71%.124
Limitations.
Anxiety in patients undergoing penile duplex examination as well as reproducibility of the examination can affect outcomes. Patient response to vasoactive agents or intolerance to agents due to various comorbidities can also limit the scope of duplex examination. PSVs after vasoactive injection that fall between 25 and 35 cm/s are equivocal and rely on evaluation of additional criteria.
Selected Key References
AbuRahma AF, Bandyk DF. Noninvasive vascular diagnosis: a practical guide to therapy. ed 3. Springer: New York; 2013.
Latest comprehensive text on noninvasive vascular testing and its clinical implications..
AbuRahma AF, Srivastava M, Mousa AY, Dearing DD, Hass SM, Campbell JR, Dean S, Stone PA, Keiffer T. Critical analysis of renal duplex ultrasound parameters in detecting significant renal artery stenosis. J Vasc Surg. 2012;56:1052–1060.
Most updated validation of renal duplex ultrasound criteria with largest series to date..
Largest series to validate the carotid consensus criteria..
AbuRahma AF, Stone PA, Srivastava M, Dean LS, Keiffer T, Hass SM, Mousa AY. Mesenteric/celiac duplex ultrasound interpretation criteria revisited. J Vasc Surg. 2012;55:428–436.
Most updated validation of mesenteric duplex ultrasound criteria with largest series to date..
Miele FR. Essentials of ultrasound physics. Miele Enterprises: Forney, Tex; 2008.
An advanced review of the physics and instrumentation relevant to arterial duplex scanning..
Pellerito JS, Polak JF. Introduction to vascular ultrasonography. ed 6. Elsevier Saunders: Philadelphia; 2012.
Zierler RE. Strandness’s duplex scanning in vascular disorders. ed 4. Lippincott Williams & Wilkins: Philadelphia; 2010.
Thorough updated text in the application of duplex ultrasound in vascular disease..
The reference list can be found on the companion Expert Consult website at www.expertconsult.com.
References
1. Brott TG, et al. 2011 ASA/ACCF/AHA/AANN/AANS/ACR/ASNR/CNS/SAIP/SCAI/SIR/SNIS/SVM/SVS guideline on the management of patients with extracranial carotid and vertebral artery disease. Circulation. 2011;124:489–532.
2. Blackshear WM, et al. Carotid artery velocity patterns in normal and stenotic vessels. Stroke. 1980;11:67–71.
3. Johnston KW. Errors and artifacts of carotid ultrasound evaluation. AbuRahma AF, Bandyk DF. Noninvasive vascular diagnosis: a practical guide to therapy,. ed 3. Springer: New York; 2013.
4. Comerota AJ, et al. Gender differences in blood velocities across carotid stenoses. J Vasc Surg. 2004;40:939–944.
5. Executive Committee for the Asymptomatic Carotid Atherosclerosis Study. Endarterectomy for asymptomatic carotid artery stenosis. JAMA. 1995;273:1421–1428.
6. Moneta GL, et al. Correlation of North American Symptomatic Carotid Endarterectomy Trial (NASCET) angiographic definition of 70% to 99% internal carotid artery stenosis with duplex scanning. J Vasc Surg. 1993;17:152–159.
7. Faught WE, et al. Color-flow duplex scanning of carotid arteries: new velocity criteria based on receiver operator characteristic analysis for threshold stenoses used in the symptomatic and asymptomatic carotid trials. J Vasc Surg. 1994;19:818–828.
8. Neale ML, et al. Reappraisal of duplex criteria to assess significant carotid stenosis with special reference to reports from the North American Symptomatic Carotid Endarterectomy Trial and the European Carotid Surgery Trial. J Vasc Surg. 1994;20:642–649.
9. Moneta GL, et al. Screening for asymptomatic internal carotid artery stenosis: duplex criteria for discriminating 60% to 99% stenosis. J Vasc Surg. 1995;21:989–994.
10. Fillinger MF, et al. Carotid duplex criteria for a 60% or greater angiographic stenosis: variation according to equipment. J Vasc Surg. 1996;24:856–864.
11. North American Symptomatic Carotid Endarterectomy Trial Collaborators. Beneficial effect of carotid endarterectomy in symptomatic patients with high-grade carotid stenosis. N Engl J Med. 1991;325:445–453.
12. Barnett HJ, et al. Benefit of carotid endarterectomy in patients with symptomatic moderate or severe stenosis. North American Symptomatic Carotid Endarterectomy Trial Collaborators. N Engl J Med. 1998;339:1415–1425.
13. Grant EG, et al. Carotid artery stenosis: gray-scale and Doppler US diagnosis. Society of Radiologists in Ultrasound consensus conference. Radiology. 2003;229:340–346.
14. Filarde P, et al. Does carotid intima-media thickness regression predict reduction of cardiovascular events? J Am Coll Cardiol. 2010;56:206–220.
15. Cull DL, et al. The value of a carotid duplex surveillance program for stroke prevention. Ann Vasc Surg. 2011;25:887–894.
16. Russell DA, et al. Relationship of carotid plaque echomorphology to presenting symptoms. Eur J Endovasc Surg. 2010;39:134–138.
17. Russell DA, et al. Changes in carotid plaque echomorphology with time since a neurologic event. J Vasc Surg. 2007;45:367–372.
18. Biasi GM, et al. Carotid plaque echolucency increases the risk of stroke in carotid stenting. Circulation. 2004;110:756–762.
19. Mohler ER, et al. ACCF/ACR/AIUM/ASE/ASN/ICAVL/SCAI/SCCT/SIR/SVM/SVS 2012 appropriate use criteria for peripheral vascular ultrasound and physiological testing part 1: arterial ultrasound and physiological testing. J Am Coll Cardiol. 2012;60:242–276.
20. Jahromi AS, et al. Sensitivity and specificity of color duplex ultrasound measurement in the estimation of internal carotid artery stenosis: a systematic review and meta-analysis. J Vasc Surg. 2005;41:962–972.
21. Primozich JC. Extracranial arterial system. Strandness DE. Duplex scanning in vascular disorders,. Lippincott Williams & Wilkins: Philadelphia; 2002:191–231.
22. AbuRahma AF, et al. Critical appraisal of the Carotid Duplex Consensus criteria in the diagnosis of carotid artery stenosis. J Vasc Surg. 2011;53:53–59.
23. Shaalan WE, et al. Reappraisal of velocity criteria for carotid bulb/internal carotid artery stenosis utilizing high-resolution B-mode ultrasound validated with computed tomography angiography. J Vasc Surg. 2008;48:104–113.
24. Abou-Zamzam AM Jr, et al. Is a single preoperative duplex scan sufficient for planning bilateral carotid endarterectomy? J Vasc Surg. 2000;31:282–288.
25. Bendick PJ, et al. Evaluation of the vertebral arteries with duplex sonography. J Vasc Surg. 1986;3:523–530.
26. Fujitani RM, et al. The effect of unilateral internal carotid artery occlusion upon contralateral duplex study: criteria for accurate interpretation. J Vasc Surg. 1992;16:459–468.
27. Nederkoorn PJ, et al. Duplex ultrasound and magnetic resonance angiography compared with digital subtraction angiography in carotid artery stenosis: a systematic review. Stroke. 2003;34:1324–1331.
28. AbuRahma AF, et al. The reliability of color duplex ultrasound in diagnosing total carotid artery occlusion. Am J Surg. 1997;174:185–187.
29. Kirsch JD, et al. Carotid artery occlusion: positive predictive value of duplex sonography compared with arteriography. J Vasc Surg. 1994;19:642–649.
30. Bandyk DF, et al. Intraoperative duplex scanning of arterial reconstructions: fate of repaired and unrepaired defects. J Vasc Surg. 1994;20:426–433.
31. Ascher E, et al. Intraoperative carotid artery duplex scanning in a modern series of 650 consecutive primary endarterectomy procedures. J Vasc Surg. 2004;39:416–420.
32. Roth SM, et al. A rational algorithm for duplex surveillance following carotid endarterectomy. J Vasc Surg. 1999;30:453–460.
33. AbuRahma AF, et al. Proposed duplex velocity criteria for carotid restenosis following carotid endarterectomy with patch closure. J Vasc Surg. 2009;50:286–291.
34. AbuRahma AF, et al. Optimal carotid duplex velocity criteria for defining the severity of carotid in-stent restenosis. J Vasc Surg. 2008;48:589–594.
35. Armstrong PA, et al. Duplex scan surveillance after carotid angioplasty and stenting: a rational definition of stent stenosis. J Vasc Surg. 2007;46:460–466.
36. Verlato F, et al. Diagnosis of high-grade stenosis of innominate artery. Angiology. 1993;44:845–851.
37. McLaren JT, et al. Accuracy of carotid duplex examination to predict proximal and intrathoracic lesions. Am J Surg. 1996;172:149–150.
38. Slovut DP, et al. Detection of common carotid artery stenosis using duplex ultrasonography: a validation study with computed tomographic angiography. J Vasc Surg. 2010;51:65–70.
39. Aaslid R, et al. Noninvasive transcranial Doppler ultrasound recording of flow velocity in basal cerebral arteries. J Neurosurg. 1982;57:769–774.
40. Lee MT, et al. Stroke Prevention Trial in Sickle Cell Anemia (STOP): extended follow-up and final results. Blood. 2006;108:847–852.
41. Kassab MY, et al. Transcranial Doppler: an introduction for primary care physicians. J Am Board Fam Med. 2007;20:67–71.
42. Gaunt ME, et al. Clinical relevance of intraoperative embolization detected by transcranial Doppler ultrasonography during carotid endarterectomy: a prospective study of 100 patients. Br J Surg. 1994;81:1435–1439.
43. Ackerstaff RG, et al. The significance of microemboli detection by means of transcranial Doppler ultrasonography monitoring in carotid endarterectomy. J Vasc Surg. 1995;21:963–969.
44. Arnold M, et al. Continuous intraoperative monitoring of middle cerebral artery blood flow velocities and electroencephalography during carotid endarterectomy: a comparison of the two methods to detect cerebral ischemia. Stroke. 1997;28:1345–1350.
45. Cao P, et al. Transcranial Doppler monitoring during carotid endarterectomy: is it appropriate for selecting patients in need of a shunt? J Vasc Surg. 1997;26:973–980.
47. Hansen C, et al. Prediction of intracerebral hemorrhage after carotid endarterectomy by clinical criteria and intraoperative transcranial Doppler monitoring: results of 233 operations. Eur J Vasc Surg. 1994;8:220–225.
48. Sloan MA, et al. Assessment: transcranial Doppler ultrasonography: report of the Therapeutics and Technology Assessment Subcommittee of the American Academy of Neurology. Neurology. 2004;62:1468–1481.
49. Navarro JC, et al. The accuracy of transcranial Doppler in the diagnosis of middle cerebral artery stenosis. Cerebrovasc Dis. 2007;23:325–330.
50. Zhao L, et al. Velocity criteria for intracranial stenosis revisited: an international multicenter study of transcranial Doppler and digital subtraction angiography. Stroke. 2011;42:3429–3434.
51. Hunder GG, et al. The American College of Rheumatology 1990 criteria for the classification of giant cell arteritis. Arthritis Rheum. 1990;33:1122–1128.
52. Schmidt WA, et al. Color duplex ultrasonography in the diagnosis of the temporal arteritis. N Engl J Med. 1997;337:1336–1342.
53. Karahaliou M, et al. Colour duplex sonography of temporal arteries before decision for biopsy: a prospective study in 55 patients with suspected giant arteritis. Arthritis Res Ther. 2006;8:R116.
54. Arida A, et al. The diagnostic value of ultrasonography-derived edema of the temporal artery wall in giant cell arteritis: a second meta-analysis. BMC Musculoskelet Disord. 2010;11:44.
55. Kohler TR, et al. Duplex scanning for diagnosis of aortoiliac and femoropopliteal disease: a prospective study. Circulation. 1987;76:1074–1080.
56. Cossman DV, et al. Comparison of contrast arteriography to arterial mapping with color-flow duplex imaging in the lower extremities. J Vasc Surg. 1989;10:522–529.
57. Grassbaugh JA, et al. Blinded comparison of preoperative duplex ultrasound scanning and contrast arteriography for planning revascularization at the level of the tibia. J Vasc Surg. 2003;37:1186–1190.
58. Proia RR, et al. Early results of infragenicular revascularization based solely on duplex arteriography. J Vasc Surg. 2001;33:1165–1170.
59. Moneta GL, et al. Accuracy of lower extremity arterial duplex mapping. J Vasc Surg. 1992;15:275–284.
60. Norgren I, et al. Inter-Society consensus for the management of peripheral arterial disease (TASC II). [TASC II Working Group] J Vasc Surg. 2007;45:S5–S67.
61. Cossman DV, et al. Comparison of contrast arteriography to arterial mapping with color-flow duplex imaging in the lower extremities. J Vasc Surg. 1989;10:522–528.
62. Armstrong PA, et al. Duplex scanning for lower extremity arterial disease. AbuRahma AF, Bandyk DF. Noninvasive vascular diagnosis: a practical guide to therapy,. ed 2. Springer: New York; 2007.
63. Leiner T, et al. Peripheral arterial disease: comparison of color duplex and US and contrast enhanced MR angiography for diagnosis. Radiology. 2005;235:699–708.
64. Collins R, et al. Duplex ultrasound, magnetic resonance angiography, and computed tomography angiography for the diagnosis and assessment of symptomatic, lower limb peripheral disease: systematic review. BMJ. 2007;334:1257.
65. de Smet AA, et al. Duplex velocity characteristics of aortoiliac stenoses. J Vasc Surg. 1996;23:628–636.
66. Shaalan WE, et al. Reliability of common femoral artery hemodynamics in assessing the severity of aortoiliac inflow disease. J Vasc Surgery. 2003;37:960–969.
67. Eiberg JP, et al. Duplex ultrasound scanning of peripheral arterial disease in the lower limb. Eur J Vasc Endovasc Surg. 2010;40:507–512.
68. Schlager O, et al. Duplex sonography vs. angiography for assessment of femoropopliteal arterial disease in a “real world setting.”. J Endovasc Ther. 2007;14:452–459.
69. Khan SZ, et al. Utility of duplex ultrasound in detecting and grading de novo femoropopliteal lesions. J Vasc Surg. 2011;54:1067–1073.
70. Tinder CH, et al. Efficacy of duplex ultrasound surveillance after infrainguinal vein bypass may be enhanced by identification of characteristics predictive of graft stenosis development. J Vasc Surg. 2008;48:613.
71. Stone PA, et al. Duplex ultrasound criteria for femoral-femoral bypass revision. J Vasc Surg. 2006;44:496–502.
72. Brumberg SR, et al. The relative importance of graft surveillance and warfarin therapy in infrainguinal prosthetic bypass failure. J Vasc Surg. 2007;46:1160–1166.
73. Back MR, et al. Utility of duplex surveillance following iliac artery angioplasty and primary stenting. J Endovasc Ther. 2001;8:629–637.
74. Baril DT, et al. Duplex criteria for determination of in-stent stenosis after angioplasty and stenting of the superficial femoral artery. J Vasc Surg. 2009;49:133–139.
75. Chaikof EL, et al. SVS practice guidelines for the care of patients with an abdominal aortic aneurysm: executive summary. J Vasc Surg. 2009;50:880–896.
76. Lederle FA, et al. Variability in measurement of abdominal aortic aneurysms. Abdominal Aortic Detection and Management Veterans Administration Cooperative Study Group. J Vasc Surg. 1995;21:945–952.
77. Arko FR, et al. Intrasac flow velocities predict sealing of type II endoleaks after endovascular abdominal aortic aneurysm repair. J Vasc Surg. 2003;37:8–15.
78. Bendick PJ, et al. Efficacy of ultrasound scan contrast agents in the noninvasive follow-up of aortic stent grafts. J Vasc Surg. 2003;37:381–385.
79. Blom AS, et al. Duplex ultrasound imaging to detect limb stenosis or kinking of endovascular device. J Vasc Surg. 2012;55:1577–1580.
80. Wolf RA, et al. Duplex ultrasound scanning vs. computed tomographic angiography for postoperative evaluation of endovascular abdominal aortic aneurysm repair. J Vasc Surg. 2000;32:1142–1148.
81. Mirza TA, et al. Duplex ultrasound and contrast-enhanced ultrasound vs. computed tomography for the detection of endoleak after EVAR: systematic review and bivariate meta-analysis. Eur J Vasc Endovasc Surg. 2010;39:418–428.
82. Paulson EK, et al. Color Doppler sonography of groin complications following femoral artery catheterization. AJR Am J Roentgenol. 1995;165:439–444.
83. Stone PA, et al. Reducing duplex examinations in patients with iatrogenic pseudoaneurysms. J Vasc Surg. 2006;43:1211–1215.
84. Toursarkissian B, et al. Spontaneous closure of selected iatrogenic pseudoaneurysms and arteriovenous fistulae. J Vasc Surg. 1997;25:803–809.
85. Helvie MA. The distinction between femoral artery pseudoaneurysms and other causes of groin masses. AJR Am J Roentgenol. 1988;150:1177–1180.
86. Kent KC, et al. Accuracy of clinical examination in the evaluation of femoral false aneurysm and arteriovenous fistula. Cardiovasc Surg. 1993;1:504–507.
87. Barba J, et al. Immediate renal Doppler ultrasonography findings (<24 h) and its association with graft survival. World J Urol. 2011;29:547–553.
88. Radermacher J, et al. Resistive index and improvement of renal function after correction of renal artery stenosis [abstract]. J Am Soc Nephrol. 1996;7:1554.
89. Radermacher J, et al. Use of Doppler ultrasonography to predict the outcome of therapy for renal-artery stenosis. N Engl J Med. 2001;344:410–417.
90. Neumyer MM, et al. Duplex evaluation of the renal arteries. AbuRahma AF, Bandyk DF. Noninvasive vascular diagnosis: a practical guide to therapy,. ed 3. Springer: New York; 2013:591.
91. AbuRahma AF, et al. Critical analysis of renal duplex ultrasound parameters in detecting significant renal artery stenosis. J Vasc Surg. 2012;56:1052–1060.
92. McLeary MS, et al. Tardus-parvus Doppler signals in the renal arteries: a sign of pediatric thoracoabdominal aortic coarctations. Am J Radiol. 1996;167:521–523.
94. Schwerk WB, et al. Renal artery stenosis: grading with image-directed Doppler US evaluation of renal resistive index. Radiology. 1994;190:785–790.
95. Eklof H, et al. A prospective comparison of duplex ultrasonography, captopril renography, MRA and CTA in assessing renal artery stenosis. Acta Radiol. 2006;47:764–774.
96. Fleming SH, et al. Accuracy of duplex sonography scans after renal artery stenting. J Vasc Surg. 2010;52:953–957.
97. Hudspeth DA, et al. Renal duplex sonography after treatment of renovascular disease. J Vasc Surg. 1993;18:381–390.
98. Baxter GM, et al. Colour Doppler ultrasound in renal transplant stenosis: which Doppler index? Clin Radiol. 1995;50:618–622.
99. Bowersox JC, et al. Duplex ultrasonography in the diagnosis of celiac and mesenteric artery occlusive disease. J Vasc Surg. 1991;14:780–790.
100. Moneta GL, et al. Duplex ultrasound criteria for diagnosis of splanchnic artery stenosis or occlusion. J Vasc Surg. 1991;14:511–520.
101. Zwolak RM, et al. Mesenteric and celiac duplex scanning: a validation study. J Vasc Surg. 1998;27:1078–1088.
102. AbuRahma AF, et al. Mesenteric/celiac duplex ultrasound interpretation criteria revisited. J Vasc Surg. 2012;55:428–436.
103. AbuRahma AF, et al. Duplex velocity criteria for native celiac/superior mesenteric artery stenosis vs. in-stent stenosis. J Vasc Surg. 2012;55:730–738.
104. LaBombard FE, et al. Hepatic artery duplex as an adjunct in the evaluation of chronic mesenteric ischemia. J Vasc Tech. 1992;16:7–11.
105. Moneta GL, et al. Mesenteric duplex scanning: a blinded prospective study. J Vasc Surg. 1993;17:79–86.
106. Perko MJ, et al. Importance of diastolic velocities in the detection of celiac and mesenteric artery disease by duplex ultrasound. J Vasc Surg. 1997;26:288–293.
107. Liem TK, et al. Duplex scan characteristics of bypass grafts to mesenteric arteries. J Vasc Surg. 2007;45:922–927.
108. Malovrh M. Native arteriovenous fistula: preoperative evaluation. Am J Kidney Dis. 2002;39:1218–1225.
109. Teodorescu V, et al. Duplex ultrasound evaluation of hemodialysis access: a detailed protocol. Int J Nephrol. 2012;2012:508956.
110. Zierler RE. Strandness’s duplex scanning in vascular disorders,. ed 4. Lippincott Williams & Wilkins: Philadelphia; 2010.
111. Silva MB, et al. A strategy for increasing use of autogenous hemodialysis access procedures: impact of preoperative noninvasive evaluation. J Vasc Surg. 1998;27:302–307.
112. Wiese P, et al. Colour Doppler ultrasound in dialysis access. Nephrol Dial Transplant. 2004;19:1956–1963.
113. Wittenberg G, et al. Value of color-coded duplex ultrasound in evaluating arm blood vessels—arteries and hemodialysis shunts. Ultraschall Med. 1998;19:22–27.
114. Nack TL, et al. Comparison of duplex ultrasound and contrast venography for evaluation of upper extremity venous disease. J Vasc Technol. 1992;16:69–73.
115. Centers for Medicare and Medicaid Services: Empire Medical Local Coverage Determination, August 2010.
116. Back MR, et al. Current status of surveillance of hemodialysis access grafts. Ann Vasc Surg. 2001;15:491–502.
117. Robbin ML, et al. Hemodialysis arteriovenous fistula maturity: US evaluation. Radiology. 2002;225:59–64.
118. Grogan J, et al. Frequency of critical stenosis in primary arteriovenous fistulae before hemodialysis access: should duplex ultrasound surveillance be the standard of care? J Vasc Surg. 2005;41:1000–1006.
119. Back MR, et al. Expected flow parameters within hemodialysis access and selection for remedial intervention of non-maturing conduits. Vasc Endovasc Surg. 2008;42:150–158.
120. NIH Consensus Conference. Impotence. NIH consensus development panel on impotence. JAMA. 1993;270:83–90.
121. Golijanin D, et al. Doppler evaluation of erectile dysfunction—part 1. Int J Impot Res. 2007;19:37–42.
122. Roy C, et al. Duplex Doppler sonography of the flaccid penis: potential role in the evaluation of impotence. J Clin Ultrasound. 2000;28:290–294.
123. Golijanin D, et al. Doppler evaluation of erectile dysfunction—part 2. Int J Impot Res. 2007;19:43–48.
124. Speel TG, et al. Penile duplex pharmacoultrasonography revisited: revalidation of the parameters of the cavernous arterial response. J Urol. 2003;169:216–220.
125. Paushter DM. Role of duplex sonography in the evaluation of sexual impotence. J Clin Ultrasound. 2000;28:290–294.
[/level-membership-for-surgery-category][not-level-membership-for-surgery-category]C
[/not-level-membership-for-surgery-category]
