Various targets in the abdomen (hepatobiliary system, spleen, pancreas, gastrointestinal tract, and peritoneum)
(CONSULTANT-LEVEL EXAMINATION)
GLYKERIA PETROCHEILOU, JOHN POULARAS, EMMANUEL DOUZINAS, ARIEL L. SHILOH, HEIDI LEE FRANKEL, MICHAEL BLAIVAS and DIMITRIOS KARAKITSOS
Overview
Abdominal ultrasound can be used to obtain images of the hepatobiliary, urogenital, and pelvic structures. The approach to the urogenital system, point-of-care pelvic ultrasound, focused assessment with sonography for trauma, and other subjects are discussed in Chapters 42 to 46. In this chapter, examination of various abdominal targets such as the hepatobiliary system, spleen, pancreas, gastrointestinal (GI) tract, and peritoneum is featured as part of the holistic approach (HOLA) ultrasound protocol that was introduced in Chapter 1.
Technical details of abdominal ultrasound examination
Standard ultrasound examination is performed with curvilinear transducers (3.5 to 5 MHz), but phased-array or microconvex transducers can be of assistance. High-frequency transducers may be used to visualize the GI tract. It is helpful to apply HOLA scanning (Chapter 1) techniques (Figure 41-1). A detailed description of the technique suggested for abdominal scanning is illustrated in Figures 41 E-1 to 41 E-6. In brief, by sweeping the transducer from the epigastrium to the right posterior axillary line along a mainly sagittal approach, various structures are examined consecutively: the pancreas and left liver lobe anterior to the inferior vena cava (IVC), the right liver lobe (right hypochondrium), and the main portal triad (main portal vein [PV], common bile duct [CBD], and hepatic artery [HA]; the PV is posterior). The gallbladder (GB), liver, right kidney, and Morison pouch are also visualized. Oblique subcostal views allow visualization of both hepatic lobes and the hepatic veins (right, middle, left) converging toward the IVC. Intercostal, subcostal, and flank views complete the survey of the hepatobiliary system, pancreas, and spleen. The spleen is best visualized via a left posterolateral intercostal approach. Midabdominal and alternative (flank) views are used to visualize major vascular structures. The small intestine can be examined systematically in parallel overlapping lanes, although a cross-sectional examination of the colon is usually performed to identify its major segments. Bowel loops are best visualized if intraperitoneal fluid is present (see Figures 41 E-1 to 41 E-6).
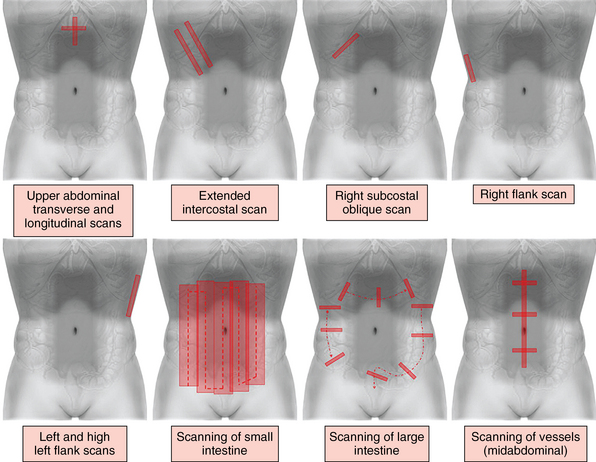
Figure 41-1 Standard and supplemental abdominal scanning planes (refer also to Figures 41 E-1 to 41 E-6).
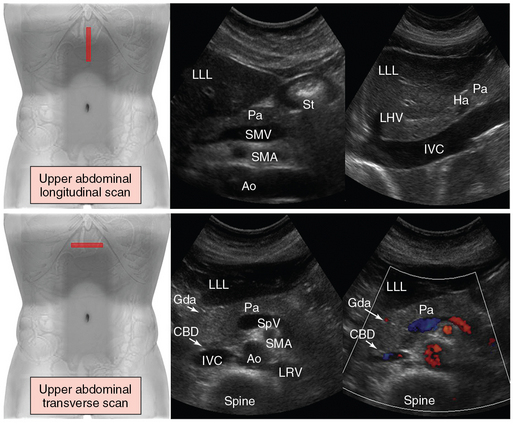
Figure 41 E-1 (Top) Upper abdominal scan. Longitudinal views of the structures that are visualized from anterior to posterior are presented: left liver lobe, pancreas, and midabdominal vessels. The aorta and superior mesenteric artery (arising from the aortic anterior wall) are visualized toward the midline (left). By sweeping the transducer slightly to the right, the inferior vena cava is visualized (right). (Bottom) Transverse views. The transducer is angled inferiorly by using the left liver lobe as an acoustic window to image the pancreas and midabdominal vessels. The aorta and splenic vein crossing over the superior mesenteric artery are used as landmarks to identify the pancreas. The gastroduodenal artery and common bile duct assist in outlining the lateral margin of the head of the pancreas. Ao, Aorta; CBD, common bile duct; Gda, gastroduodenal artery; Ha, hepatic artery; IVC, inferior vena cava; LHV, left hepatic vein; LLL, left liver lobe; LRV, left renal vein; Pa, pancreas; SMA, superior mesenteric artery; SMV, superior mesenteric vein; SpV, splenic vein; St, stomach (gastric antrum).
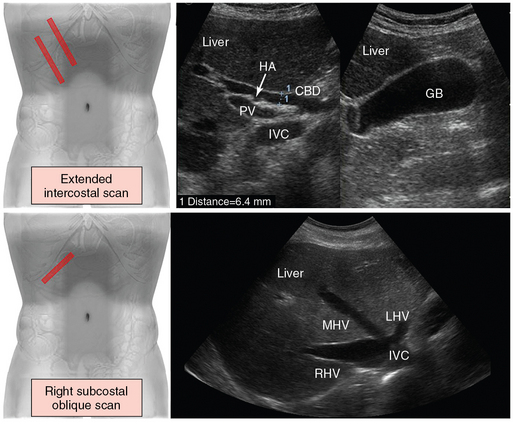
Figure 41 E-2 (Top) Extended intercostal scan. The transducer is oriented longitudinally and lateral to the midline in an intercostal space or below the costal arch. In the porta hepatis, the common bile duct (CBD) is depicted between the portal vein (PV) and the hepatic artery (HA). Including the inferior vena cava (IVC), the three tubular structures (CBD, PV, HA) are described as the “parallel channel sign” (left). Scanning can be advanced in the same direction along the costal arch to define the gallbladder (GB) in longitudinal section (right). (Bottom) Right subcostal oblique scan. The transducer is placed below the right costal arch in a slightly cephalad angulation. The hepatic veins (LHV, Left hepatic vein, MHV, middle hepatic vein, RHV, right hepatic vein) are depicted as they empty into the IVC just beneath the right side of the diaphragm.
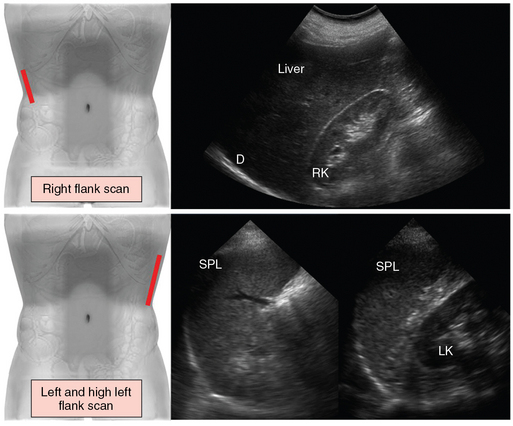
Figure 41 E-3 (Top) Right flank scan. The transducer is placed lateral to the midaxillary line to evaluate the pleural angle distal to the diaphragm (D), the right kidney (RK), the right liver lobe, and the hepatorenal space (Morison pouch). (Bottom) For left and high left flank (intercostal) scans, the transducer is placed in an intercostal space cranial to the left flank and angled cephalad to demonstrate the spleen (SPL) in longitudinal section. The length and thickness of the spleen are measured at the level of the splenic hilum (left). By sweeping the transducer caudally from the high flank scan, the left kidney (LK) appears in longitudinal section posterior to the spleen, and the splenorenal space can be evaluated (right).
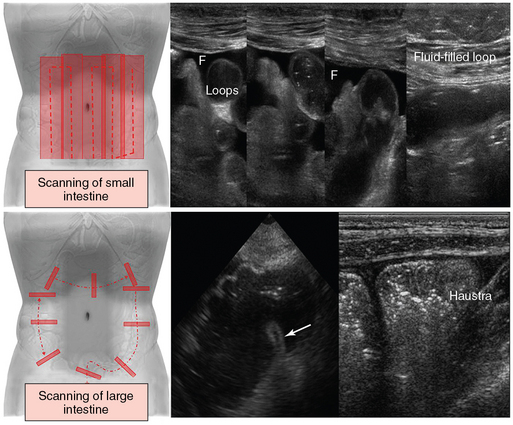
Figure 41 E-4 (Top) The small intestine can be examined systematically by using parallel overlapping lanes. Small intestinal loops are best visualized if intraperitoneal fluid (F) is present. (Bottom) Cross-sectional examination of the colon is usually performed to identify major colonic segments (left), such as the cecum and ileocecal valve (arrow), whereas scanning of the ascending colon in a longitudinal plane is used to visualize its typical haustration (right).
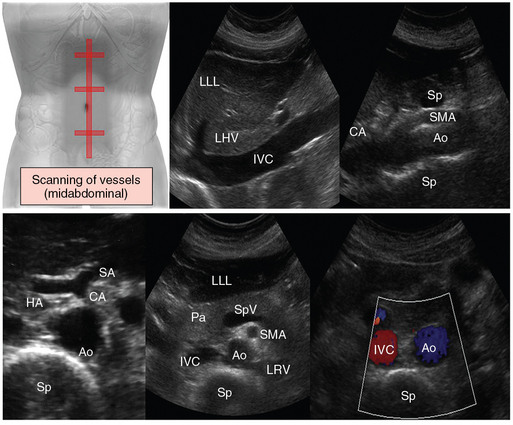
Figure 41 E-5 Standard scanning of abdominal vessels (midabdominal plane). On transverse (top) and longitudinal views (bottom) along the midline of the abdomen, the aorta, inferior vena cava, celiac axis, and superior mesenteric vessels are visualized anterior to the spine. Ao, Aorta; CA, celiac artery; HA, hepatic artery; IVC, inferior vena cava; LHV, left hepatic vein; LLL, left liver lobe; LRV, left renal vein; Pa, pancreas; SMA, superior mesenteric artery; SA, splenic artery; Sp, spine; SpV, splenic vein.
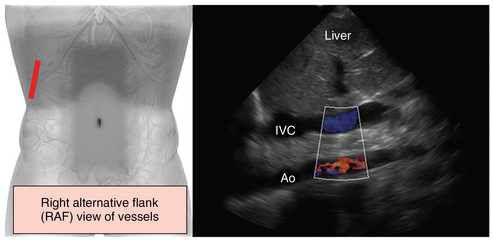
Figure 41 E-6 Alternative (flank) scanning of abdominal vessels. If midabdominal scanning is not feasible (e.g., trauma, aerocolia, surgery), major abdominal vessels can be depicted by alternative right flank views in supine patients in the intensive care unit. This view requires various adjustments of the transducer (rotating and tilting) and the scanning plane, which depends on positioning of the patient, to visualize major abdominal vessels such as the inferior vena cava (IVC) and the aorta (Ao) (the right alternative flank [RAF] view is suggested by Dr. Karakitsos; however, further analysis is beyond the scope of this chapter).
For imaging of the GI tract, graded compression is applied to displace interfering bowel loops with gas and feces, decrease the distance from the ROI, and assess the rigidity of the underlying structures. The stomach is scanned in longitudinal and transverse sections (subxiphoid approach), whereas a lateral transsplenic view best depicts the fundus. The distal part of the esophagus is visualized in the epigastrium by tilting the transducer cranially and using the left liver lobe as an acoustic window. Visualization of the gastric tube is a useful guide. The duodenum surrounds the head of the pancreas, and its third part may be visible between the superior mesenteric artery and aorta. The small intestine cannot be evaluated over its entire length but is scanned in a general sweep by making vertical, parallel, and overlapping lanes. After identification of the cecum, the colon is usually scanned in transverse sections by carefully following along the ascending, transverse, and descending segments to the distal sigmoid into the pelvis. Finally, the rectum can be visualized through a distended urinary bladder. Normal bowel wall consists of five concentric layers (distal to the esophagus), and its thickness is practically unchanged from the stomach to the colon (2 to 4 mm). Distinguishing features of the small intestine include intense peristalsis and valvulae conniventes (mucosal folds are best visible with a fluid-filled lumen). Key features of the large intestine include a fixed position and haustra, which give the colon, especially the ascending and transverse parts, a segmented-like appearance. The “3, 6, 9 rule” refers to the maximal normal intestinal diameter (small intestine ≤3 cm, colon ≤6 cm, cecum ≤9 cm) and aids in identifying intestinal dilatation and distinguishing the small from the large intestine. Doppler provides information on the main mesenteric vessels and GI tract vascularity in general.
Disorders
Hepatobiliary system, pancreas, spleen
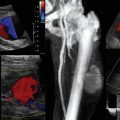
The presence of hepatic portal venous gas (HPVG) as a manifestation of pyelophlebitis (suppurative thrombophlebitis of the PV) may indicate a surgical emergency in ICU patients who are in shock (Figure 41-2). Gastrointestinal mucosal damage (e.g., ischemic bowel, arterial and venous mesenteric occlusion, perforated peptic ulcer), intraabdominal sepsis (e.g., cholecystitis, abscesses, diverticulitis), and ileus are possible causes. B-mode allows early diagnosis of HPVG by identifying hyperechoic foci moving with blood flow in the PV, whereas Doppler depicts sharp bidirectional spikes (an artifact appreciated audibly as a crackle). In smaller intraparenchymal portal branches, punctiform hyperechoic foci disseminated within the liver parenchyma may be depicted. If sufficient, these foci may display a linear branching pattern in either lobe. In supine ICU patients, gas bubbles accumulate in the rather anteriorly positioned left PV. HPVG should be distinguished from gas in the biliary tree and from other causes of hyperechoic foci, which are usually located randomly in the liver parenchyma (see Figure 41-2).1
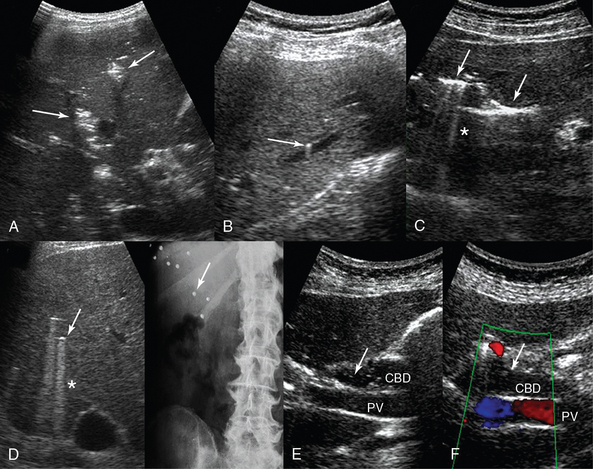
Figure 41-2 A, Transverse intercostal liver view: hepatic venous portal gas is demonstrated as patchy, highly reflective areas in the right liver lobe (arrows). B, Longitudinal left liver lobe view: aerobilia depicted as hyperechoic foci (arrow) adjacent to a branch of the portal vein. C, transverse left liver lobe view: aerobilia depicted as branching echogenic lines (arrows) in the liver parenchyma with associated reverberation artifacts (*). D, Sonographic visualization of randomly located hyperechoic foci (arrow) with comet-tail (*) artifacts produced by bullets embedded in the liver parenchyma (arrow, radiography). E and F, Aerobilia: visualization of moving hyperechoic foci (arrows) within the common bile duct. CBD, Common bile duct; PV, portal vein.
Aerobilia, or pneumobilia, is commonly iatrogenic (e.g., after endoscopic retrograde cholangiopancreatography) or physiologic (incompetent sphincter of Oddi secondary to advanced age or drugs, bilioenteric bypass), but it could reflect pathologies such as a spontaneous biliary-enteric fistula secondary to gallstone ileus, perforating duodenal ulcer, neoplasia, trauma, or infections such as cholangitis or emphysematous cholecystitis. In contrast to HPVG, which usually extends peripherally, aerobilia is often located centrally in larger bile ducts (see Figure 41-2).
In the case of hepatomegaly, additional sonographic findings suggestive of the cause may be present. Hepatomegaly with dilated hepatic veins, IVC, and right heart chambers might indicate right-sided heart failure. A “starry-sky” liver appearance (hypoechoic parenchyma accentuating the portal venule walls) has been identified in patients with acute hepatitis, toxic shock syndrome, and fasting liver (Figure 41 E-7).2 Cirrhosis initially causes hepatomegaly, but over time the liver becomes shrunken with an irregular surface and echogenic coarse or nodular parenchymal appearance (Figure 41-3). Evidence of portal hypertension (PH) includes a PV diameter greater than 13 mm, splenic and superior mesenteric vein diameter greater than 10 mm, and variation in PV diameter of less than 20% with respiration. PV blood flow gradually becomes monophasic (without respiratory variation), biphasic (to and fro), and ultimately hepatofugal (away from the liver). The HAs become enlarged and tortuous with increased flow. Portosystemic venous collaterals are highly diagnostic of PH (e.g., hepatofugal flow in a paraumbilical vein dilated >2 mm is 100% specific). Secondary signs of PH are splenomegaly and ascites (see Figure 41-3). A transjugular intrahepatic portosystemic shunt is used to treat complications of PH. Its function is monitored with Doppler ultrasound since stent stenosis or relapse of PV flow toward the liver indicate shunt malfunction.
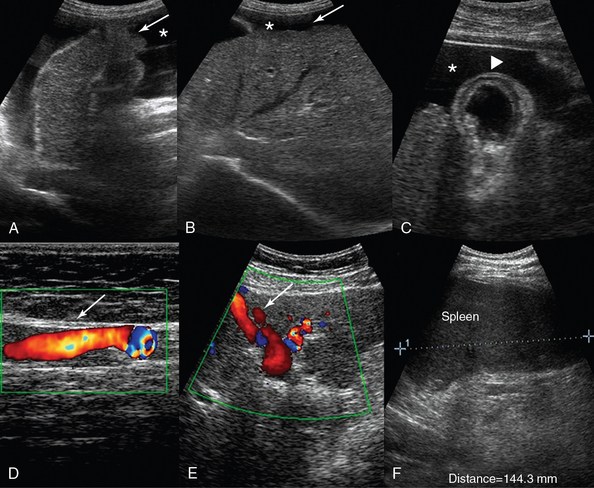
Figure 41-3 Liver cirrhosis. A, Anechoic ascites (*) outlining the irregular surface of the left liver lobe (arrow). B, Contracted right liver lobe with an irregular (coarsening) echotexture. C, Ascites (*) facilitates visualization of a nodular liver contour and a thickened gallbladder wall (arrowhead). A paraumbilical vein (arrow) larger than 2 cm is depicted traversing the anterior abdominal wall (D) and the falciform ligament (E). F, Splenomegaly (length, 14.4 cm).
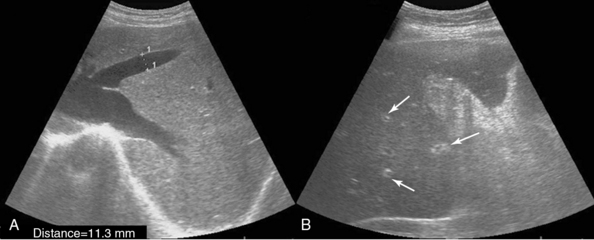
Figure 41 E-7 A, Right subcostal oblique views depicting hepatomegaly and dilated hepatic veins in a patient with right-sided heart failure. B, “Starry-sky” pattern of the liver parenchyma, which is characterized by diminished parenchymal echogenicity accentuating the portal venule walls (arrows) in a patient with acute hepatitis.
Focal hepatic lesions (occasionally associated with hepatomegaly) are easily detected, and hepatic abscesses should be kept in mind in the ICU (Figure 41-4). An ill-defined, heterogeneous lesion, typically showing no central perfusion on Doppler, is usually encountered. Echogenic gas bubbles may be present. Travel history, serologic tests, and physical examination help in diagnosing an amebic abscess or other specific infections. Metastatic and intrinsic hepatic tumors may be incidental findings; however, since variable echo patterns are encountered depending on lesion histology, patients should be referred to imaging specialists (see Figure 41-4). Hepatic vein thrombosis (Budd-Chiari syndrome) is manifested as an acute onset of abdominal pain, ascites, and hepatomegaly. In the acute phase the liver is enlarged and tender with a heterogeneous mottled echo pattern. The hepatic veins may appear isoechoic to adjacent parenchyma as a result of an intraluminal echogenic thrombus, and Doppler demonstrates abnormal (absent) flow. Acute PV thrombosis is associated with sepsis, trauma, hypercoagulable states, neoplasms, and acute dehydration. The PV appears dilated, but an acute thrombus may be relatively anechoic and therefore be overlooked unless Doppler is used. Finally, liver transplant scanning can detect abnormalities in the HA or PV (e.g., thrombosis, stenosis) and CBD complications (e.g., leaks, strictures, necrosis, stones).3
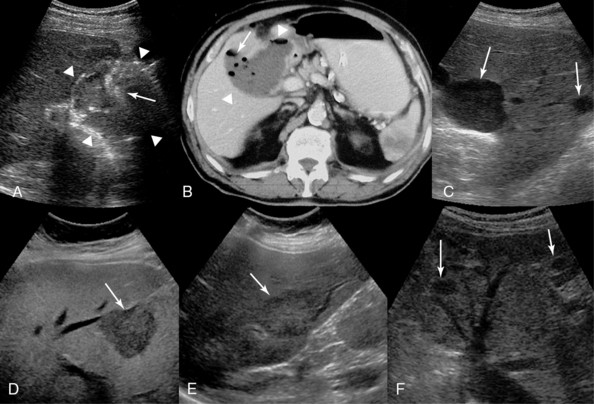
Figure 41-4 Subhepatic abscess (arrowheads). Sonographic visualization of hyperechoic foci (arrow) reflecting gas bubbles (A) and computed tomography (B) confirm the presence of air (arrow) within the abscess. C, Sharply defined margins, no internal echoes, and increased “through transmission” are demonstrated in these simple cysts in the right liver lobe (arrows). D, Hepatocellular carcinoma depicted as a hypoechoic mass (arrow). Colon cancer (E) and retroperitoneal sarcoma (F) metastases (arrows) are depicted as hypoechoic masses in the liver parenchyma. (D, Courtesy Dr. K. Shanbhogue.)
In the ICU, cholestasis is attributed mainly to sepsis, impairment of venous return, trauma, ischemic hepatitis (shock liver), or drugs. Ultrasound is used to screen for both size and continuity of the intrahepatic and extrahepatic bile ducts to exclude obstruction (e.g., choledocholithiasis, blocked biliary stent). A dilated CBD appears as an enlarged, anechoic tubular structure in the main portal triad, anterior to and following the course of the main PV. A CBD larger than 1.1 cm in diameter is suggestive of obstruction. Dilated intrahepatic bile ducts with associated PV branches are shown as anechoic “tramlines” coursing through the hepatic parenchyma (Figure 41 E-8). Acute cholangitis, a complication of choledocholithiasis, is a possible cause of fever in the ICU. However, given the low sensitivity of ultrasound for depicting stones in bile ducts (approximately 50%), normal findings on examination should not exclude it from the differential diagnosis.
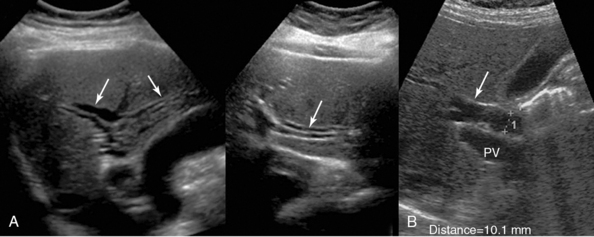
Figure 41 E-8 A, Dilated intrahepatic ducts (arrows) appearing as irregular anechoic tubules coursing through the liver parenchyma. If depicted parallel to the adjacent portal branches, a “double-barrel gun” or “tramline” appearance is evident. B, Marginally dilated (10.1 mm) common bile duct (arrow). PV, Portal vein.
Acute acalculous cholecystitis (AAC) is not rare in the ICU (Figure 41-5). Prolonged fasting, total parenteral nutrition, mechanical ventilation, trauma, burns, sepsis, drugs (opiates, sedatives, vasopressors), multiple transfusions, and shock are probable contributing factors leading to bile stasis, GB ischemia, and ultimately acute inflammation in the absence of gallstones. Left untreated, AAC may progress rapidly to GB gangrene, perforation, and empyema (incidence of approximately 40%), which are associated with high mortality. Prompt diagnosis and intervention are crucial. Although high clinical suspicion remains important in diagnosing AAC, the comorbid conditions and status of patients do not facilitate evaluation based solely on clinical criteria. Imaging tests used are ultrasound, CT, and hepatobiliary iminodiacetic acid cholescintigraphy. Ultrasound findings include the sonographic Murphy sign (maximal tenderness elicited by transducer pressure over the GB), thickened GB wall (>3.5 mm), distended GB or sometimes hydrops (which refers to distention with clear fluid), sludge (slightly hyperechoic material, echogenic dots—microlithiasis), intramural striations, and pericholecystic fluid (halo) or subserosal edema. However, GB wall thickening becomes illusory when contiguous to isoechoic hepatic parenchyma with superimposed edema, whereas “GB hepatization” (the GB looks isoechoic to liver because of massive sludge) makes recognition of the GB difficult (see Figure 41-5). Furthermore, the Murphy sign, which is crucial for sonographic diagnosis, may be absent in patients in the ICU as a result of analgesia and sedation. A thickened GB wall may be also encountered in patients with hypoproteinemia, hepatitis, heart failure, and ascites, whereas sludge and hydrops may simply indicate a prolonged lack of bile turnover. Repeated ultrasound monitoring may be of value, whereas guided percutaneous cholecystostomy establishes the diagnosis and results in stabilization of septic patients (thus cholecystectomy can be performed electively).4–11
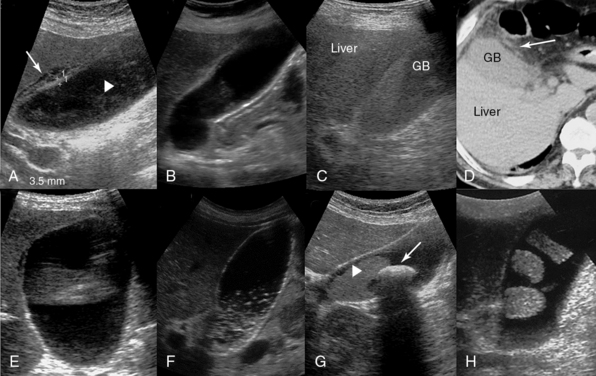
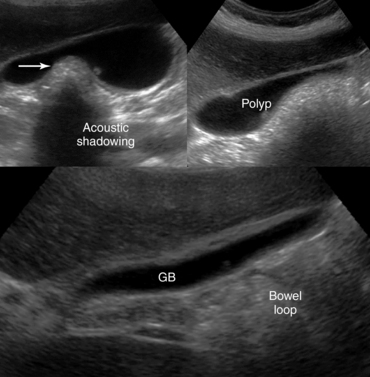
Figure 41-5 A, Longitudinal image of the gallbladder (GB) demonstrating marginal anterior wall thickening with associated edema separating the layers of the wall (arrow) and intraluminal sludge (arrowhead) in a patient with acute calculous cholecystitis. B, Anterior GB wall thickening and intraluminal sludge in a patient with acute acalculous cholecystitis (AAC) (a diagnosis of AAC requires a high level of clinical suspicion and presumably additional testing). C, Massive sludge within the GB that appears isoechoic relative to the liver parenchyma (GB hepatization). D, Computed tomography scan demonstrating GB hepatization (arrow = pericholecystic inflammatory changes). E, Dilated GB (11 × 6 cm) filled with clear fluid (hydrops). F, Biliary sludge demonstrated as a dependent layer of nonshadowing midlevel echoes (pseudolithiasis). G, Large solitary GB stone (arrow) with prominent acoustic shadowing and dense sludge (arrowhead). H, GB stones attached to its wall in a bizarre manner (incidental finding).
GB stones are identified sonographically as mobile hyperechoic structures with posterior acoustic shadowing (see Figure 41-5). Stones may cause acute cholecystitis, which has an appearance similar to that of ACC. Complications of acute cholecystitis, such as GB empyema, result in increased morbidity and mortality and thus necessitate prompt intervention. However, GB empyema cannot be reliably differentiated from uncomplicated AAC because echogenic material consistent with pus within the distended GB is indistinguishable from sludge. Sonographic findings suggestive of gangrenous cholecystitis include floating intraluminal membranes (representing sloughed mucosa) and echogenic foci within the GB wall or lumen secondary to gas. Acute GB perforation with free intraperitoneal bile leading to peritonitis is rare. Usually, subacute perforation occurs and results in pericholecystic abscess formation within the GB fossa, liver, or peritoneal cavity that appears as a complex fluid collection with inflammatory changes in adjacent fat (Figure 41 E-9). Emphysematous cholecystitis is a rare complication associated mainly with gas-forming bacteria in elderly patients with diabetes. The diagnosis is suggested by bright air reflections in the GB wall with ring-down artifacts and moving gas echoes within the GB lumen.11
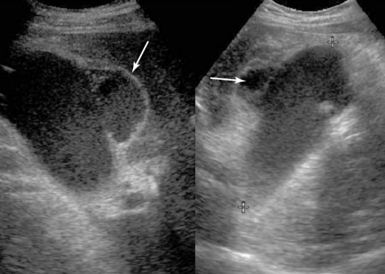
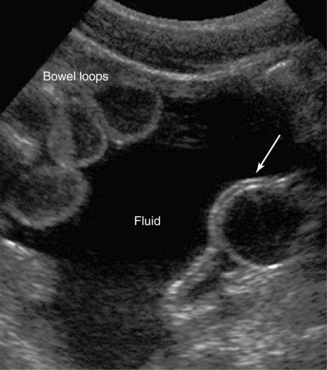
Figure 41 E-9 Subacute gallbladder perforation (arrows), a well-known complication of cholecystitis. (Courtesy Dr. K. Shanbhogue.)
Pancreatic pathology is usually evaluated with CT. In the case of acute pancreatitis, contrast-enhanced CT (CECT) is indicated for diagnosis, initial staging, and follow-up. Ultrasound is an alternative monitoring tool for identifying complications (e.g., fluid collection, abscess, pseudocyst, pseudoaneurysm, portal or splenic venous thrombosis, development of abdominal compartment syndrome) or for guiding interventional procedures (Figure 41 E-10, Video 41-1). A pseudocyst appears as a well-defined, smooth-walled anechoic mass often with multiple loculations and internal septations. Internal debris and fluid-fluid levels indicate hemorrhage or infection. Dilated biliary and pancreatic ducts suddenly terminating in a hypoechoic mass at the head of the pancreas are characteristic of a tumor (Figure 41 E-11). The diaphragmatic splenic surface is commonly detected sonographically in the ICU before a left thoracentesis is performed. In the case of splenomegaly, interrogation of the parenchymal echotexture does not usually indicate an underlying cause. A splenic abscess displays variable ultrasound appearances depending on the stage of infection (similar to all abdominal abscesses). Ultrasound may guide percutaneous aspiration for diagnosis and catheter placement. In an ICU patient with shock, “delayed” splenic rupture following blunt abdominal trauma (Figure 41 E-12), spontaneous splenic rupture (e.g., metastasis, hematologic disorders, infarction, infections), and rupture of a splenic artery pseudoaneurysm are possible causes of hemoperitoneum. The spleen may regenerate after splenectomy (Figure 41 E-13).
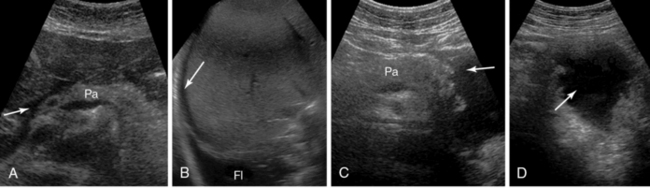
Figure 41 E-10 Pancreatitis. Fluid is depicted in the peripancreatic (A, arrow), perihepatic (B, arrow), and subpleural spaces (Fl). C and D, Depiction of a pseudocyst (arrow) at the tail of the pancreas (Pa).
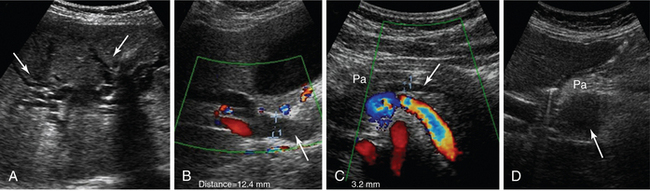
Figure 41 E-11 Pancreatic adenocarcinoma. Dilated intrahepatic ducts (A, arrows), common bile duct (B, arrow), and pancreatic duct (C, arrow). D, Depiction of a hypoechoic mass (arrow) at the head of the pancreas (Pa).
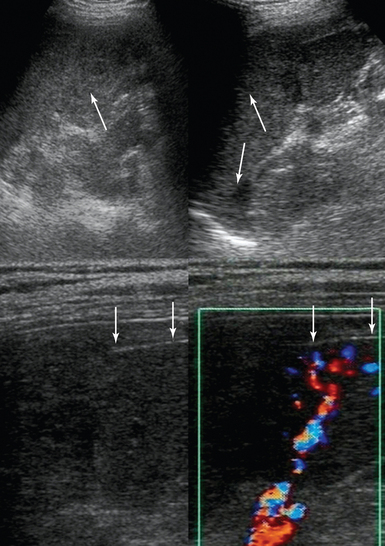
Figure 41 E-12 Splenic rupture caused by blunt abdominal trauma. (Top) Heterogeneous echotexture of the splenic parenchyma (arrows). (Bottom) Rupture of the splenic capsule depicted with a high-frequency transducer (arrows).
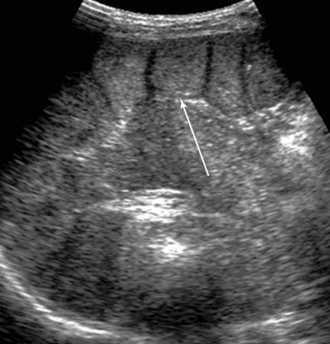
Figure 41 E-13 Incidental detection of a fully regenerated (arrow) orthotopic spleen (15 years after splenectomy).
Solid organ injury is best visualized with CECT. Ultrasound may be used for diagnosis and follow-up examinations, especially in unstable patients who cannot be transferred. Acute liver or spleen lacerations appear as fragmented hyperechoic or hypoechoic areas. A diffuse hyperechoic pattern with hypoechoic areas may be observed in patients with liver contusion (Figure 41 E-14). Contained intraparenchymal hemorrhage, initially isoechoic or slightly hyperechoic with indistinct margins, may form a well-defined, hypoechoic hematoma or dissolve over time. Subcapsular hematoma appears as a crescent-shaped, hypoechoic (occasionally isoechoic) stripe surrounding the organ. Recently, contrast-enhanced sonography was found to enhance visualization of liver and spleen injuries.
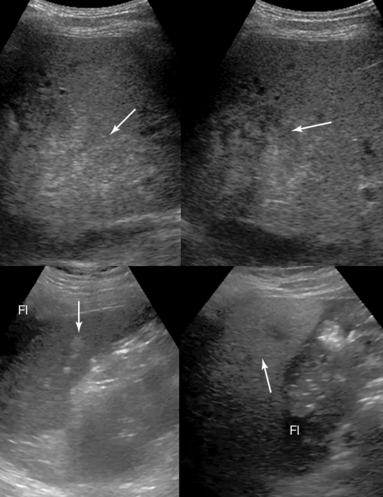
Figure 41 E-14 (Top) Liver contusion following blunt abdominal trauma. A diffuse hyperechoic pattern (arrow) with associated hypoechoic areas (first day, left) can be visualized; the hyperechoic pattern appears to be slightly abated, whereas the hypoechoic regions (arrow) appear rather enhanced in follow-up examinations (fourth day, right). (Bottom) Splenic laceration following blunt abdominal trauma. Perisplenic fluid (Fl) and hypoechoic (arrow) areas of the splenic parenchyma (left) can be visualized. The heterogeneous splenic parenchyma (arrow) with perisplenic fluid (Fl) is seen delineating adjacent bowel loops (right).
Gastrointestinal tract and peritoneum
Ultrasound can be used to assess correct positioning of a feeding tube by visualizing a tubular structure with strong acoustic shadow. Acute gastric dilatation (e.g., acute abdomen) or gastric stasis (e.g., peptic ulcer) appears as a large fluid collection with multiple echoic particles and sometimes air or fluid levels (Figure 41-6). Ultrasound facilitates dynamic evaluation of the intestinal wall and surrounding environment by demonstrating peristalsis, which when suggestive of an acute abdomen is a strong argument against emergency surgery, and wall thickening, which often involves a large portion of the intestine even with focal disorders.
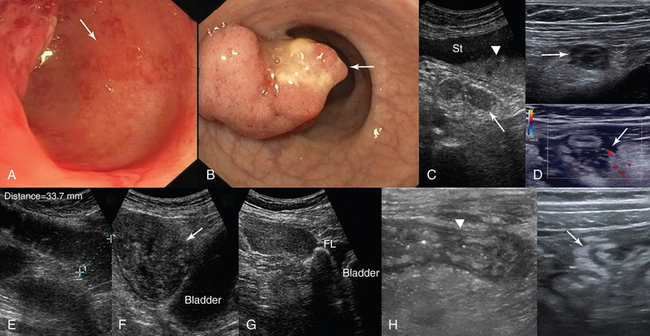
Figure 41-6 Endoscopic views of the colon. A, Areas of patchy erythema (arrow) reflecting early mucosal changes associated with ischemic colitis. B, Depiction of a polypoid adenocarcinoma. C, Sonographic view of an acutely dilated stomach (St) with a fluid-fluid level (arrowhead); the third part of the duodenum (arrow) appears normal. D, Appendicitis. On a transverse B-mode image the inflamed appendix appears as a noncompressible sausage-like structure that is surrounded by hyperechoic fat as a result of inflammation (top); on a transverse color mode scan the inflamed appendix appears as a compressible thickened structure with increased vascularity of the surrounding tissues, and a periappendiceal fluid collection is evident (arrow). The findings are consistent with rupture (bottom). E, Obstructive ileus. F, Dilated (>3 cm) small intestinal loops secondary to a large intestinal tumor (arrow). G, Peritoneal metastases secondary to ovarian cancer: depiction of a solid tumor (arrow) causing lumpy thickening of the peritoneal surface (Fl, ascites). H, Thickened bowel wall (arrowhead) and hyperechoic adjacent mesenteric fat with ill-defined borders in a patient with Crohn disease.
Acute mesenteric ischemia is caused by arterial or venous occlusion (or both) or low-outflow states. Mesenteric embolism or thrombosis is best appreciated with CECT. Doppler and contrast-enhanced ultrasound contribute greatly by detecting stenosis or occlusion of the celiac trunk and superior and inferior mesenteric arteries (e.g., significant stenosis of the celiac trunk is present with a peak Doppler systolic velocity >1.5 m/sec) and microperfusion intestinal wall defects. The role of endoscopy in identifying early signs of ischemic colitis cannot be overstated (see Figure 41-6). Ultrasound findings of bowel ischemia (right side involvement more common with several causes) include massively distended bowel loops, abolition of peristalsis, wall thickening (thickened hypoechoic wall of 5 to 7 mm as a result of venous causes but a thin wall of 1 to 2 mm as a result of arterial causes), no bowel wall perfusion, disappearance of wall stratification, and in late stages, intramural gas (hyperechoic foci within the bowel wall), portal venous gas, and peritoneal effusion.12,13
In the case of intestinal dilatation, ultrasound contributes to distinguishing obstructive from paralytic ileus. Findings suggestive of intestinal obstruction include dilated fluid-filled loops (“3, 6, 9 rule”), increased peristalsis of distended segments (ineffective contractions may cause to-and-fro fluid movements), and collapsed loops distal to the obstruction (see Figure 41-6). A small amount of intraperitoneal fluid is frequently present. Analysis of the dilated loops may help in determining the level of obstruction, and sometimes the cause is also identified (e.g., neoplasm, hernia, Crohn disease, intussusception, bezoar, or gallstone; see Figure 41-6). Prolonged obstruction causes intestinal paralysis, although loops distal to the obstruction appear contracted. In contrast, in paralytic ileus the entire intestine is congested, no empty bowel segments are visualized, fluid-filled levels may be present within dilated loops, and decreased or absent peristalsis is evident during real-time scanning.14 In pseudomembranous colitis, a potentially life-threatening complication of antibiotic therapy, marked thickening of the colonic wall (frequently manifested as pancolitis), lumen collapse, pericolic fat changes, and hemorrhagic ascites may be observed. Neutropenic enterocolitis in immunosuppressed patients is characterized by ileal and to a variable extent right-sided colonic involvement. Bowel wall thickening, alteration of adjacent mesenteric fat, and ascites may be present.
Primary GI tract lesions (e.g., colon or gastric cancer, acute colonic diverticulitis) and surgical emergencies (e.g., appendicitis) can be identified with ultrasound. Further analysis is beyond the scope of this chapter; however, it should be emphasized that the role of endoscopy in diagnosing GI tract lesions is invaluable (see Figure 41-6). In shock states, sonographic detection of fluid sequestration within the bowel, which can reach several liters, may indicate hypovolemic mechanisms secondary to digestive disorders. The presence, amount, and rate of accumulation (through serial examinations) of intraperitoneal fluid can be detected sonographically. Free fluid flows, under the effect of gravity, to the most dependent peritoneal recesses (e.g., in supine patients to the hepatorenal recess and pelvic cul-de-sac) and outlines them as anechoic stripes with sharp edges. Loculated fluid collections resemble space-occupying lesions that displace bowel and adjacent organs. Transudative ascites, urine, and bile are anechoic, whereas hemorrhage, pus, malignant ascites, and spilled GI contents may include echogenic particles, layering debris, or septations. Ultrasound-guided paracentesis may facilitate the diagnosis (especially by ruling out bacterial peritonitis and distinguishing a pus collection from postoperative sterile blood) or provide symptomatic relief of tense ascites. Perforation of the GI tract may occur suddenly and be severe enough to produce shock; moreover, physical examination in sedated ICU patients is often unrevealing. Ultrasound may detect pneumoperitoneum (free intraperitoneal air) during scanning of the right intercostal area as hyperechoic foci or echogenic lines on the ventral surface of the liver with posterior reverberations that should be discriminated from gas echoes in the lumen of the GI tract (e.g., hepatodiaphragmatic interposition of the colon) or lung. Because intraperitoneal abscesses are usually formed in dependent recesses, pelvic scanning is crucial. Abscesses containing gas may be mistaken for gas-filled bowel and be overlooked.14
Metastatic implants (originating from the ovaries, pancreas, or GI tract) are the most common peritoneal tumors and appear as hypoechoic solid masses of varying size on the peritoneal surfaces (see Figure 41-6). Ascites is usually present, often with echogenic debris and septations. Retroperitoneal adenopathy is associated with lymphoma or metastatic cancer (testicular, renal, pelvic, GI tract, melanoma) or infection (e.g., human immunodeficiency virus–positive patients). Retroperitoneal fluid collections include hemorrhage (e.g., rupture of an abdominal aneurysm), infection, urinoma, and pancreatic fluid. Retroperitoneal masses or adenopathy and hypercoagulable states may cause abdominal venous (iliac veins, IVC) thrombosis (Videos 41-2 and 41-3). However, IVC thrombosis usually appears as a sequela of deep venous thrombosis of the lower limbs. Under certain circumstances, IVC thrombi, especially in patients in whom anticoagulation is contraindicated, may be treated by placing IVC filters.
IMAGING CASE: GALLBLADDER PERFORATION AND ABSCESS FORMATION
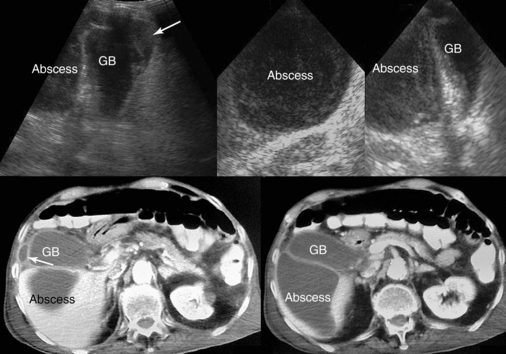
Figure 41-9
A septic 72-year-old female patient with pneumonia was admitted to the ICU because of respiratory failure. She was intubated and mechanically ventilated. Antibiotic therapy and supportive measures resulted in gradual clinical improvement. Nevertheless, after approximately 1 week she experienced another septic episode. General chest ultrasound was inconclusive. However, a lesion adjacent to the GB suggestive of perforation (arrow) and another one suggestive of abscess formation were detected by abdominal ultrasound scanning (confirmed by CT). The patient was treated surgically.
Pearls and highlights
• Depiction of blurred images because of various factors may disappoint new users of abdominal ultrasound in the ICU; however, image quality could be improved by making scanning adjustments. Because a single examination may be inconclusive, performance of serial examinations (monitoring) is usually warranted.
• The presence of HPVG or aerobilia should not be interpreted lightly because they may correspond to serious underlying pathology.
• Ultrasound is valuable in detecting GB abnormalities; however, diagnosis of GB disorders such as AAC requires a high level of clinical suspicion and presumably additional testing.
• Solid organ injury is best visualized with CECT, although ultrasound is still useful for diagnosis and monitoring purposes in the ICU.
• Ultrasound depicts gastric dilatation, bowel obstruction (paralytic vs. obstructive ileus) and ischemia, intraperitoneal fluid, or pneumoperitoneum, thereby aiding in the interpretation of gut failure syndrome.
References
1. Pan, HB, Huang, JS, Yang, TL, Liang, HL. Hepatic portal venous gas in ultrasonogram—benign or noxious. Ultrasound Med Biol. 2007; 33:1179–1183.
2. Han, MK, Hyzy, R. Advances in critical care management of hepatic failure and insufficiency. Crit Care Med. 2006; 34:S225–S231.
3. Feltracco, P, Barbieri, S, Galligioni, H, et al. Intensive care management of liver transplanted patients. World J Hepatol. 2011; 3:61–71.
4. Huffman, JL, Schenker, S, Acute acalculous cholecystitis: a review. Clin Gastroenterol.Hepato. 2010; 8:15–22.
5. Boland, GW, Slater, G, Lu, DS, et al. Prevalence and significance of gallbladder abnormalities seen on sonography in intensive care unit patients. AJR Am J Roentgenol. 2000; 174:973–977.
6. Molenat, F, Boussuges, A, Valantin, V, et al, Gallbladder abnormalities in medical ICU patients: an ultrasonographic study. Intensive Care Me. 1996; 22:356–358.
7. Kalliafas, S, Ziegler, DW, Flancbaum, L, et al, Acute acalculous cholecystitis: incidence, risk factors, diagnosis, and outcome. Am Sur. 1998; 64:471–475.
8. Cornwell, EE, Rodriguez, A, Mirvis, SE, et al. Acute acalculous cholecystitis in critically injured patients. Ann Surg. 1989; 219:52–55.
9. Rubens, DJ. Hepatobiliary imaging and its pitfalls. Radiol Clin North Am. 2004; 42:257–278.
10. Manat, G, Mahul, P, Prevot, N, De Filippis, JP. Contribution of ultrasonography to the diagnosis of acute acalculous cholecystitis in intensive care unit patients. Intensive Care Med. 2000; 26:1658–1663.
11. Theodoro, D. Hepatobiliary. In: Ma OJ, Mateer J, Blaivas M, eds. Emergency ultrasound. ed 2. New York: McGraw-Hill; 2008:169–192.
12. Danse, EM, Van Beers, BE, Materne, R, Small bowel wall changes in acute mesenteric ischemia: sonographic findings. Ultrasound Med Bio. 2000; 26:A128.
13. Danse, E. Ischemic colitis. In: Maconi G, Bianchi Porro G, eds. Ultrasound of the gastrointestinal tract. Medical radiology—diagnostic imaging and radiation oncology (Series). Berlin: Springer Verlag; 2007:55–58.
14. Kuzmich, S, Howlett, DC, Andi, A, et al. Transabdominal sonography in assessment of the bowel in adults. AJR Am J Roentgenol. 2009; 192:197–212.