Understanding and Using Information about Cancer Genomes

Published on 09/04/2015 by admin

Filed under Hematology, Oncology and Palliative Medicine

Last modified 09/04/2015

Print this page

rate 1 star rate 2 star rate 3 star rate 4 star rate 5 star
Your rating: none, Average: 0 (0 votes)

This article have been viewed 3195 times

Figure 24-1 Schematic illustrations of the types of genome aberrations found in human cancers. 18

Table 24-1

Cancer Gene Census Summary

Aberration Type Number of Aberrations Examples of Prominent Affected Genes
Amplification 16 ERBB2, EGFR, MYCN, MDM2, CCND1
Frameshift mutation 100 APC, RB1, ATM, MLH1, NF1
Germline mutation 76 BRCA1/2, TP53, ERCC2, RB1, VHL
Missense mutation 141 ARID1A, ATM, PIK3CA, IDH1, KRAS
Nonsense mutation 92 CDKN2A, FANCA, PTCH, PTEN
Other mutation 26 BRAF, PDGFRA, PIK3R1, SOCS1
Splicing mutation 63 GATA3, MEN1, MSH2, TSC1
Translocation 326 ABL1, ALK, BCL2, TMPRSS2, MYC

For more details see http://www.sanger.ac.uk/genetics/CGP/Census.

One important observation from many genomic studies is the existence of recurrent molecular features that allow cancers that occur in specific anatomic regions to be organized into subtypes. The subtypes likely arise in distinct cell types within each tissue and are different diseases that differ in clinical outcome and/or response to therapy. Early genomic studies relied on expression patterns for cancer subtype definition, but current strategies use multiple data types (e.g., genome copy number, mutation, and expression) for subtype definition. Interestingly, epithelial and mesenchymal subtypes appear to be present in tumors that are of epithelial origin. The mesenchymal-like cancers tend to be more rapidly proliferating and motile and associated with reduced survival duration. Some tumor types show remarkably high transcriptional similarity, for example, in triple-negative breast cancer and high-grade serous ovarian cancers. 6 Many genomic aberrations also appear in multiple tumor subtypes. Some of the most common aberrations observed in multiple tumor types include amplifications of MYC and EGFR, deletion of CDKN2A and PTEN, and mutation of TP53 and PIK3CA. For a more comprehensive assessment, Kim and colleagues summarize recurrent genome copy number aberrations in 8000 cancers. 20 Efforts are now under way to combine data types (e.g., expression, genome copy number, and mutations) to increase the number of subtypes in order to increase the precision with which patients can be stratified according to outcome and/or therapeutic response. 21 Of course, this divides cancers into increasingly smaller subpopulations, so very large numbers of samples are needed to establish subtype differences in treatment response or overall outcome.

Table 24-2

Candidate Cancer Hallmark–Associated Aberrant Genes

Cancer Hallmark Aberrant Gene
Resisting cell death BCL2, BAX, FAS
Genome instability and mutation TP53, BRCA1/2, MLH1
Inducing angiogenesis CCK2R
Activating invasion and metastasis ADAMTSL4, ADAMTS3
Tumor-promoting inflammation IL32
Enabling replicative immortality TERT
Avoiding immune destruction HLA loci, TAP1/2, B2M
Evading growth suppressors RB1, CCND1, CDKN2A
Sustaining proliferative signaling KRAS, ERBB2, MYC
Deregulating cellular energetics PIK3CA, PTEN
The number of aberrations that are present in an individual tumor can be remarkably high. The somatic mutation rate in human cancers varies between cancer types from about 0.1 to 10 mutations per megabase, 22,23 but individual tumors may carry as few as a hundred to more than a million somatic aberrations. High genomic instability occurs because of loss of telomere function during progression in the absence of telomerase, 24,25 diminished DNA repair capacity resulting from genomic and epigenomic deregulation of DNA repair pathways, 26 increased damage resulting from oncogene-induced oxidative stress, 27 and toxic environmental exposures. 28,29 In some cases, the exact DNA sequence change in a mutation reflects the type of agent that causes the cancer—for example, mutations in sun-related cancers show CC to TT mutations caused by UV-induced cytosine dimers, whereas smoking-induced cancers in the lung are characterized by G→T transversions caused by the polycyclic aromatic hydrocarbons in tobacco smoke. 30,31 Ultimately, the functions and/or expression levels of hundreds to thousands of genes may be altered in an individual tumor. An unknown number of these will be drivers. Among these, some will have a strong, possibly dominant influence on an individual tumor, whereas others may have a more modest or near-negligible impact. So far, most attention in the field has focused on the strong drivers. However, it seems likely that the ensemble of aberrations will have to be taken into account in explaining the overall behavior of an individual tumor, which is addressed in a later section.
The same drivers of genome instability that enable tumor development also operate during tumor progression. As a result, individual tumors become increasingly heterogeneous as distinct clonal populations within the tumor evolve in diverse microenvironments, producing highly branched lineages. For example, events that enable metastasis may occur late during the genetic evolution, 32 whereas mutation of TP53, a key player in genome stability, can be an early event. 33 These instabilities and the resultant intratumor heterogeneity in an individual tumor are likely responsible for the rapid evolution of therapeutic resistance. This heterogeneity complicates clinical decision making because the importance of a low-frequency but actionable aberration remains unclear. One possible way forward is to focus treatment on aberrations that occur early during tumor development. The order in which aberrations occur can be inferred by examining a tissue at various stages of disease progression 34 by serial sampling of clinical tissue from individual patients, 18 by computational methods that examine mutation frequency, 3537 or in some cases by analysis of the interactions between mutations and copy-number abnormalities. 33

Functional Assessment of Cancer Genomes

Transforming cancer genomic data into interpretable knowledge consists of finding the parts and learning how they work together to enable aspects of cancer pathophysiology. Hypothesis-driven research has gone quite far in this process, but full understanding will require systematic analysis, both computational and experimental, of the aberrations that occur within a tumor genome.

Computational Approaches

Computational strategies to identify candidate driver aberrations begin with the cataloging of all aberrations and then move to the selection of high-priority candidate drivers.

Cataloging Approaches

Identification of genes that enable aspects of cancer pathophysiology (driver genes) is complicated by the high genomic heterogeneity within and between tumors. Nearly all cancer genomes analyzed to date appear to have at least one driving oncogenic point mutation, and the vast majority show copy number changes over both large chromosomal segments and smaller, more targeted regions of the genome. The evidence for structural rearrangements being a primary cause in most tumor types is less clear, but diseases including many leukemias, lymphomas, sarcomas, and prostate cancers all incontrovertibly show that rearrangements can be critical (http://atlasgeneticsoncology.org). Changes to chromatin state also are partly responsible for many cancers. 3840 Over the past 20 years a number of technologies (predominantly microarray based) have been successfully used to catalog cancer genome aberrations, but nearly all efforts now depend on nucleic acid sequencing technology (Mardis, chapter on “The Technology of Analyzing Nucleic Acids”).
Point mutations are identified by aligning DNA sequences obtained from cancer samples to normal genomes using tools such as BWA. 41 The requirement for the normal genome sequence is paramount because of private single-nucleotide polymorphisms (SNPs) that occur about once every 100,000 base pairs, 42 a rate that is about 10 times higher than the mutation rate in most epithelial tumors and 100 times higher than the rate of mutations in childhood cancers such as neuroblastoma. 3,6,22 Read depth and read quality are critical factors in determining how well mutations can be called within each patient’s cancer genome. Read quality is the error rate per thousand base pairs of sequence. High quality is usually defined as having fewer than 1 error per 1000 bases of sequence. Read depth (the number of times a position in the genome has been sequenced) for high-quality bases then governs both the false-positive rate caused by sequencing errors and misidentifying private variants as mutations and false negatives caused by not generating sufficient data to observe mutations reliably. The greater the depth, the more confident mutation calls will be. Typically, 30× coverage of the normal genome and 40× to 80× coverage of the tumor produces high-quality results. Increasing read depth is needed for analysis of samples in which the tumor fraction is low because the presence of normal DNA reads dilutes the aberrant reads. Mutation detection is further complicated by intratumor heterogeneity that causes some aberrations to be present in only a small fraction of the tumor cells. Many groups find value in exome sequencing—that is, targeting the small fraction of the genome that is coding, at even deeper levels (for example, 150×). Verifying the sensitivity of mutation calling remains difficult because there are no good true mutation standards.
Detection of insertions and deletions (indels) remains challenging. In principle, the same sequence coverage necessary to find point mutations can be used to identify indels. Unfortunately, the algorithmic methods for indel identification are much more computationally intense. 43 No good estimates exist on how well indel detection software works because of the lack of gold standards against which to measure algorithm performance. In general, indel detection is even more difficult than evaluating the substitution mutations.
Copy number and structural aberrations are identified using a combination of microarray and sequencing approaches. Microarrays and whole-genome shotgun sequencing are capable of identifying changes in DNA copy number that are as small as 1000 base pairs in length. This resolution is sufficiently good that nearly all gene-level aberrations can be detected. Microarray approaches look for differential signal gains from the hybridization, whereas DNA sequences detect changes in read depth. Direct sequencing of genomic DNA represents the most direct way to identify the breakpoints for structural rearrangements, but the methodology is challenging, requiring a high-coverage, high-quality DNA sequence. Often, structural rearrangements cannot be detected with the standard technologies because the sequencing approaches used cannot span the length of repetitive sequences in the human genome. Once a whole-genome shotgun sequence is generated, methods such as BreakDancer 44 and Delly 45 can be used to find the chromosome junctions. Other structural aberration detection technologies are emerging, so it is likely that we will be able to identify the majority of structural breakpoints in the near future.
Detection of promoter methylation is usually accomplished using microarray technologies. Microarrays that can measure methylation at more than 485,000 sites are now commonly used by groups such as TCGA. 7 In principle, DNA sequencing can be used for this purpose, but this is currently economically impractical, with costs 10 to 50 times greater than for microarray approaches. In addition, sequencing approaches currently require unreasonably large quantities of tumor DNA.
RNAseq is now the standard for measuring gene expression. RNA is depleted of ribosomal RNA (rRNA) by either polyA+ selection or any number of rRNA depletion steps and fragmented before complementary DNA (cDNA) production. Short cDNA fragments are sequenced and mapped to the human genome reference. Algorithms to estimate which transcripts are being produced and their relative abundances 46 are used to interpret the fragment data. One strength of RNAseq analysis is that it does not require that the transcriptome be known, and thus it has enabled the study of noncoding RNAs, including lincRNAs and, with adapted protocols, miRNAs. 47,48 RNAseq methods are still being refined, with improvements in molecular and algorithmic approaches regularly being developed.

Integrating Information

A central challenge in cancer genomics today is in distinguishing the causal components of disease from the effects of the disease, or even more importantly from the random aberrations that occur during progression and are carried along by chance association with driver mutations. Suites of tools have been developed to answer these key questions.
The major focus of efforts such as TCGA and ICGC has been to identify the recurrently mutated genes in specific cancer types. For example, in serous ovarian cancer 95% of all tumors have point mutations in TP53. Statistics are not needed for the average scientist to decide that TP53 is a critical gene. In most cases, however, the process for deciding if a gene is recurrently mutated in a specific tumor type is much more complicated, even after one has identified the mutations. First, not all genes are of the same length; longer genes should have more mutations by chance if mutations are equally likely at each position. Failure to control for gene size often leads to the identification of genes encoding long proteins such as Titin, whose coding sequence is 100 times longer than that of the average human gene. Second, mutations within a tumor type are not evenly split among all possibilities. For example, tumors caused by UV light will show high rates of C→T mutations in general, especially at CC dinucleotides. Further, we now know that mutations are not randomly distributed over the genome. For example, regions of the genome near late replication forks can have mutation rates 10 times higher than the average rate. Without accounting for this, many genes will be identified as showing more mutations than expected by chance when in fact they do not. 49 Identifying driver genes based on patterns of recurrence is partly about understanding the mutagenic processes as a whole and performing appropriate statistical tests to incorporate them. 5,6
Many genes have hotspots where mutations occur preferentially. For example, mutations in the HRAS gene have a bias to alter the 12th amino acid to valine from glycine. When these events occur repeatedly, similar statistics for overall mutation rate can be used, but instead constrained for a specific event. Thus, with far fewer examples, a specific gene mutation can be associated with cancer because of the increased power from decreasing the search space. Similarly, mutations that are clustered in a specific protein domain can be identified. Finally, if a variant has been found in one tumor type—for example, the canonical KRAS mutations found in 50% of melanomas—then when they occur in other tumor types, it is parsimonious to assume that they are oncogenic there as well even if they are rare.
At least a dozen methods have now been developed to identify genes (or sets of genes) that are selected by altering copy number changes. The principles for the detection of these genes are simple even if the implementations differ. First, copy number data are segmented to identify the locations of copy number change points using an algorithm such as CBS. 50 Once segmented, the data are normalized and germline copy number differences compared to the reference are removed. Finally, the data are analyzed to locate the genetic elements that are present in copy number aberrations more likely than expected by chance (e.g., STAC 51 ). Copy number aberrations are thought to follow two distinct distributions: broad events that cover whole (or nearly whole) chromosome arms, and narrow events targeting much smaller regions (often fewer than 10 genes). 52 These software tools provide a list of the genes and chromosome arms that are frequently included in both broad and narrow events across many tumors. Although specific types of tumors have specific biases for (or against) specific genes/chromosome arms, many copy number aberrations are present in a diverse set of tumor types. 20 Methods to identify structural changes in the genome increasingly are based on the application of genome sequencing to both ends of genomic clones or fragments. The ends of each clone are then mapped onto a representation of the normal genome sequence. Structural aberrations are inferred when the paired ends of a clone map too close (signaling a deletion) or too far (signaling an insertion or translocation) along the genome. This approach was initially proposed for analysis of cloned sequences 53 but has become routine with the advent of massively parallel sequencing. 44 Once individual events are identified, standard statistical principles are then used to estimate the likelihood of seeing similar aberrations more frequently than expected by chance.

Organization into Pathways

A major challenge in cancer genomics is to understand how the ensemble of driver aberrations in an individual tumor influences its clinical and biological behavior. The remarkable genomic heterogeneity that exists in individual tumors can be managed to some extent by mapping aberrations onto pathways that influence the development of cancer hallmarks. The goal of these approaches is to reduce a dauntingly large number of functional genomic aberrations by mapping these onto a manageably small number of important pathways. Several approaches have been developed to organize omic information in ways that enable identification of pathways. We discuss gene-set enrichment approaches, pathway enrichment methods, and newer approaches that extend the repertoire of tools for pathway identification.
One of the most popular approaches is to use statistical tests on gene sets to implicate pathways that are deregulated by changes in the expression of that and related genes. A score is used to measure the degree to which each gene aberration is associated with the disease process, and then an enrichment analysis is performed using a large database of gene sets. For example, genes can be scored based on their length-normalized mutation frequency in a cohort, or assessed with more sophisticated analyses such as MutSig 54 or OncoDriveFM 55 to gauge how likely mutations in the gene provide a selective advantage to tumor cells. Once an appropriate score is applied to rank the genes, statistical tests can be used to identify enriched pathways. One approach is to threshold the list of genes to obtain those that are ranked toward the top of the list. These top-ranked genes then can be overlapped with each candidate pathway and a Fisher’s exact or Hypergeometric test used to assess the statistical significance of the overlap to determine if it is higher than chance expectation. Overlap methods are implemented in web servers such as the DAVID 56 resource.
Gene Set Enrichment Analysis 57 (GSEA) compares the entire distribution of scores against a random background using a Kolmogorov-Smirnov–inspired test. Implicated pathways contain significantly more gene members with extreme (either high or low) scores. Gene set–based approaches are used frequently to test for enriched sets of genes, revealing important biological themes. However, the approach makes no use of known interactions between the tested genes. Thus, it is possible for a small but still significant subnetwork of genes to have significantly high scores and go undetected by these set-based approaches. In addition, all genes in a set are treated uniformly. However, some genes in the network may control many other genes while others are specialized effectors performing a specific cellular task in a limited set of conditions. Such genes may be weighted differently in the enrichment analysis to improve the sensitivity of the approach. Methods that incorporate notions of the local network organization of the scored genes can incorporate such intuitions and are discussed next.
“Master Regulator” algorithms attempt to identify genes residing at the logical “top” of predictive pathways whose manipulation would be expected to change the expression of downstream genes. 58 Signaling Pathway Impact Analysis (SPIA), 59 MARINa, 60 and GeneRank 61 are examples of algorithms in this class. The principle behind these algorithms can be likened to identifying authoritative pages on the Internet. A web page is considered authoritative if many other authoritative pages reference the page. The definition is necessarily recursive, forcing the algorithms to propagate information through the network to determine a solution. For master regulators, the links in the network are reversed so that the methods home in on genes that control many other control genes, again in an iterative fashion. The approach has been used to propose master regulators for B-cell lymphoma. 60
Another strategy is to search through large background networks for smaller subnetworks with a concentrated number of altered genes. Such subnetworks could represent pathways where disruptions in any of several gene members could interfere with the functioning of the pathway. These approaches make use of networks derived from high-throughput studies such as the collections of protein-protein interactions in BioGRID, 63 HPRD, 64 iREF, 65 and STRING 66 to identify novel pathways involved in tumorigenesis. These high-throughput sources can be used either alone or together with curated and directed signaling pathways found in resources like Reactome 67 and NCI’s Protein Interaction Database. 68 Integrating somatic alterations and protein-protein interactions has the potential to provide a powerful means for cutting down false-positive rates present in either dataset because the sources of error are independent. Whether the subnetworks produced from these analyses are physiologically relevant is largely an open question but an area of intense activity.
HotNet 69 is a method for identifying enriched subnetworks, given a set of frequently altered mutations in a cohort. HotNet uses a heat-diffusion approach in which a mutated gene is considered to be a heat “source.” The heat is allowed to dissipate on the background network for a short time interval so that genes neighboring the sources also heat up. Those residing close to multiple sources receive more heat than genes far away as an exponentially decaying function of the distance in the network. The algorithm then uses a hierarchical statistical test to identify significantly hot subnetworks. HotNet has been used to identify Notch-related pathways implicated in ovarian cystadenocarcinoma 3 and chromatin-remodeling pathways in clear-cell kidney carcinoma. 69a These methods are especially well suited to the identification of subtype-specific subnetworks both within and across tumor types.
The Mutually Exclusive Modules (MEMo) algorithm 70 identifies novel networks from perturbation patterns observed across samples. This approach is based on the concept of mutual exclusivity—that is, mutation of a second gene in a cancer-related pathway provides no advantage in fitness beyond that provided by the first. The MEMo algorithm takes advantage of this mutual exclusivity property and builds an exhaustive graph of all approximate mutually exclusive gene pairs. Although the statistical significance of any two genes exhibiting such a mutually exclusive pattern is tenuous even in cohorts of hundreds of samples, the observation of a set of genes that all transitively share this property can be significant if the gene set is large enough (e.g., greater than three). MEMo leverages the significance of groups by exhaustively searching its network for subnetworks representing approximate cliques of sufficient size. Identified subnetworks are considered as candidate novel networks. New approaches in this vein, such as DENDRIX, 71 are also available that include additional statistical associations between genes beyond mutual exclusivity, such as the co-occurrence of mutational events.
The PARADIGM network analysis tool 72,73 uses information from multiple profiling measurements (copy number, mutations, transcription, etc.) to calculate inferred pathway activity levels (IPLs) for more than 1300 curated cell signaling pathways associated with specific recurrent aberrations, cancer types, or cancer subtypes. These data can be further combined into “superpathways” to identify subpathways therein whose activities differ between comparator populations (e.g., between transcriptional subtypes or between populations that differ in drug sensitivity). This approach has the advantage that it takes advantage of community knowledge of pathway architecture but has the disadvantage that the pathways may be inaccurate in some situations. PARADIGM has been used in several analyses, 3,4,6,73 demonstrating the power of inferred activities for identifying important tumor subtypes.
An extension of PARADIGM, PARADIGM-SHIFT 74 (PS), infers the impact of mutational events using network inference. Many mutations in advanced tumors are neutral passenger events resulting from the loss of genome integrity. In this background of a myriad spurious genomic perturbations, it is of interest to identify those that increase tumor fitness or that drive tumorigenesis forward. Several sequence-based methods are available to attack this important problem. However, an additional very important aspect, which has eluded computational analysis until very recently, is to predict whether the driving mutation causes a gain of function (GOF) or loss of function (LOF) to the protein. GOF mutations can lead to therapeutic manipulation because our biomedical tools often fare better at shutting down erroneously activated oncogenes than at introducing functional copies to rescue lost tumor suppressor activity. Pathway-based approaches offer promise in this area because the predicted activity of proteins in the pathway neighborhood can be inspected for signals of GOF and LOF. This is the approach taken by PS. PS predicts the impact of a mutation on the function of a protein by estimating the effects in the protein’s pathway context. It uses two runs of the PARADIGM algorithm 72 —a “Targets-only” and “Regulators-only” run—to make this assessment. In the “Regulators-only” run, PS uses PARADIGM to infer the protein’s activity after leaving connections only to the protein’s upstream connections. In the “Targets-only” run, it estimates the activity of the protein with PARADIGM after leaving only the downstream connections intact. The difference, or “shift” between these two estimates provides an estimate of the loss or gain of function in the protein. PS has been successfully used to predict several known positive controls in glioblastoma multiforme, lung squamous, and breast carcinomas. 74 One critical aspect for these network-based approaches is to select an informative local neighborhood around the protein, which can significantly influence overall accuracy. Thus machine-learning–based approaches such as the one described next could provide important synergies with these mutation-impact approaches.
Network-Induced Classification Kernels (NICK 75 ) use networks to train support-vector machines to predict patient outcomes. Supervised machine learning is a well-established field that has contributed classification approaches for predicting discrete outcomes, and regression-based approaches for predicting continuous-valued outcomes. These methods face the “curse of dimensionality” problem when attempting to use the available large feature spaces (e.g., gene expression vectors) of high-throughput functional genomics to predict outcomes in a relatively small set (e.g., less than a thousand) of samples. Classifiers can suffer problems of robustness, reproducibility, and accuracy and can also misassess the importance of any single feature in the classification task. Only recently have approaches been developed to make use of a priori pathway knowledge for this task. NICK encodes the gene-gene interactions found in a network into the formulation of a support-vector machine classifier. The resulting method rewards selection of features that are adjacent in the network, thus resulting in solutions that are more robust, while maintaining classification accuracy. Methods such as NICK promise to stabilize solutions determined when the same task, such as predicting recurrence of disease, is applied to different datasets because the use of the same network should steer the solutions toward being comparable.
In summary, pathway- and network-based approaches represent a highly active area of current research in the analysis of cancer genomics datasets. New methods are still sorely needed to use the results of these approaches in a worthwhile effort to translate the findings to patient treatment. For example, the networks identified by these approaches could provide important insights into “Achilles’ heel” attack points for cancer cells. We therefore need methods that can predict how a tumor might respond to a drug by simulating manipulations on such networks. An important antecedent to this, of course, is to prove that the networks capture enough of the salient features of a patient’s tumor for it to be used as an “avatar” for in silico testing.

Experimental Approaches

The computational approaches just described attempt to predict functional genes based on their frequency, association with behavior, activation of pathways, and so forth. However, such approaches are limited by the number of samples available for computational assessment, the high heterogeneity within and between human tumors, and our imperfect understanding of the regulatory mechanisms that govern normal and malignant cell behavior. Thus, they serve to generate hypotheses that guide experimental validation in laboratory models.

Tumor Intrinsic Assessments

A wide range of in vitro and in vivo experimental systems are now available for functional assessment of the effects of genomic aberrations that occur in tumors and their impacts on therapeutic response. Given the extremely large number of aberrant genes and networks now being discovered, this summary focuses on methods that are sufficiently high throughput to allow “first pass” assessment of function. In general, these strategies assess the impact of manipulating cancer genes or networks on aspects of growth or immortalization and less frequently other aspects of cancer biology such as differentiation, angiogenesis, senescence, motility, and DNA repair activity. Biological systems now in widespread use for this purpose include well-characterized collections of immortalized cancer cell lines grown in two- or three-dimensional cultures, 73,76,77 cell lines such as IL-3–dependent, Ba/F3 hematopoietic cells that proliferate and survive in the absence of IL-3 when transfected with a constitutively active oncogene, 78,79 tumor xenograft collections, 80,81 genetically engineered murine models of cancer, 82,83 and mice subjected to transposon-mediated gene alteration leading to tumor formation. 84
One powerful strategy for the manipulation of gene function introduces inhibitory RNA (RNAi) oligonucleotides into model organisms 8587 to downregulate candidate genes or activated cancer regulatory networks. These RNAi precursors include short hairpin RNA (shRNA) oligonucleotides that are delivered through viral or bacterial vectors 87,88 and double-stranded RNA molecules, 20 to 25 base pairs in length, called small interfering RNAs (siRNAs) 85,89 that are transfected directly into target cells. Two general strategies are now commonly used to test the impact of RNAis in model organisms. One is to introduce libraries of RNAis that have been individually “barcoded” with unique nucleic acid sequences that can be identified by hybridization to oligonucleotide microarrays 89,90 or by massively parallel DNA sequencing. 91 The loss (selected against) or gain (selected for) of specific RNAis during growth is taken as evidence of the importance of the selected RNAis during growth. This approach has the advantage of enabling genome-wide screens at low cost but has the disadvantage of assessing only aspects of gene manipulation that affect aspects of cell growth. Another approach is to test the impact of siRNAs that target individual genes in cells grown in microwells 92 or on cell spot microarrays. 93 The biological responses can be assessed by measuring changes in cancer-related properties relative to a control using assays that estimate cell number, or by using high-content imaging of cancer phenotypes such as DNA repair activity, differentiation, senescence, and motility after immunofluorescent staining for molecular surrogates for these phenotypes 9496 and dynamic responses measured using time-lapse imaging. 97 These approaches have been useful in assessing the activity of specific pathways, 89 identifying genomic vulnerabilities that might be attacked therapeutically with single agents, 92 and developing strategies to combine therapeutic agents. 98,99
Manipulation of gene function by transfection of cDNA libraries into nonmalignant cells also has been used to identify genes that enable the development of malignant phenotypes such as immortalization or colony-forming potential. 100 Another approach to cancer gene identification takes advantage of the tumorigenic integration of transposons into specific genes in murine model systems. The genomic locations in which transposons integrate are mapped by DNA sequencing approaches. Recurrent sites of integration identify genes that may contribute to tumor formation when activated or inactivated. 84,101
Information about gene network function also can be inferred from measurements of responses of well-characterized cancer models to treatment with therapeutic agents that target specific genes or networks. Treatment with compounds in large collections of well-characterized cancer cell lines, for example, enables links to be established between specific aberrant genes or networks and biological responses using machine learning or pathway-based correlative strategies. The NCI’s Discovery Therapeutic Program pioneered the use of cell lines to link omic features to response by measuring molecular features and responses to more than 100,000 compounds in a collection of about 60 cancer cell lines. 102 However, the NCI60 panel is of limited power in detecting subtype-specific responses because of the relatively sparse representation of specific cancer subtypes in the collection. This has led to the development of large collections of cell lines that represent the diversity within individual tumor types. 73,76 The Cancer Cell Line Encyclopedia (CCLE) and Sanger Cancer Cell Line (SCCL) projects have taken this approach to a higher level by assessing associations between responses to compounds in collections of approximately 800 cancer cell lines. 77,103 Several studies support the utility of in vitro testing in cell line panels. For example, in vitro model systems accurately show that (1) lung cancers with EGFR mutations respond to gefitinib, 104 (2) breast cancers with HER2/ERBB2 amplification respond to trastuzumab and/or lapatinib, 76,105 and (3) tumors with mutated or amplified BCR-ABL respond to imatinib mesylate. 106 Panels of xenografts also are now being developed for this purpose. 107

Interaction with the Microenvironment

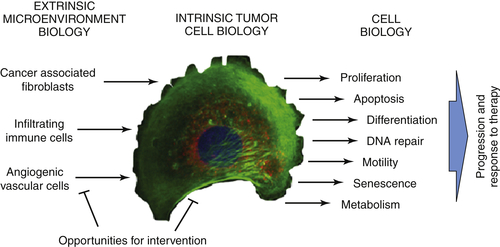
Much of cancer genomics research focuses on the tumor-intrinsic effects generated by aberrations in the tumors as discussed earlier. However, it is now apparent that the cancer-inducing functions of these aberrations are modified by signals from the microenvironments in which the cancer cells reside. Early research by Bissell and colleagues demonstrated that some extracellular microenvironments can counter the cancer-associated phenotypes generated by genomic aberrations 108 ; Folkman and colleagues demonstrated the key role that angiogenesis plays in cancer progression. 109 Since then an explosion of research has illuminated many ways in which the microenvironment can affect aspects of cancer progression. These studies of the tumor-microenvironment interaction have been reviewed recently by Coussens and Hanahan. 110 They suggest that three general classes of cells from the microenvironment modulate cancer behavior in important ways: angiogenic vascular cells (AVCs), infiltrating immune cells (IICs), and cancer-associated fibroblastic cells (CAFs) as illustrated in Figure 24-2 . They further suggest that the effects of these microenvironments influence aspects of cancer cell behavior including proliferation, growth, cell death, replicative immortality, inducing angiogenesis, energy metabolism, invasion, and metastasis. It is also apparent that the microenvironment influences responses to therapeutic agents—for example, by rendering cancer cells dormant so that they do not respond to cell-cycle active agents or by activating signaling therapy pathways. A challenge for the future will be to determine how diverse microenvironments experienced by metastatic cells influence the biological behavior of these cells—especially their responses to therapeutic interventions. Several model systems are now being developed to facilitate the study of the microenvironment on cancers. These include three-dimensional matrigel cultures, 111,112 two-dimensional systems engineered to carry many different proteins and growth factors from diverse microenvironments, 113,114 xenografts engineered to mirror important aspects of the human stroma, 115 and genetically engineered mice that model specific tumor intrinsic and extrinsic properties. 116

Clinical Applications

Diagnosis and Detection
The manner in which normal tissue changes to malignant at the omic level is now being documented for a variety of cancers by international efforts. These efforts will provide the basis for improved precision in cancer diagnosis and will show that most tumor types can be divided into subtypes that vary in outcome and often in response to therapy. For example, breast cancer tumors have been treated according to estrogen receptor status and according to whether HER2 is amplified for more than a decade. The advent of transcriptional profiling enabled breast cancers to be divided into six major transcriptional groups, 117,118 and adding information about genome copy number allows the definition of 10 subtypes. 119 Adding information about recurrent mutations or functional mutations will further subdivide these groups. Some of the associations with outcome are so strong that changes in cancer management practices have resulted. For example, several commercial assays that measure expression levels of multiple genes are now marketed that predict therapeutic benefit in breast cancer patients. 120122 Since then, potentially useful diagnostic signatures have been developed for many cancer types including leukemia 123,124 and colorectal, 125 pancreatic, 126 and lung cancer. 127 More recently, expression levels of noncoding RNAs have been proven prognostic in cancers of the colon, 128 lung, 129 and bladder. 130 In some cases, these signatures are cancer type specific and as a result can be used to classify cancers of unknown origin. 131,132 Although most of these diagnostic signatures focus on molecular events that arise in the cancer, some reflect molecular features of the environments in which the tumors reside—for example, molecular signatures that originate in invading immune cells that influence tumor outcome. 133,134
image
Figure 24-2 Interactions between tumor intrinsic and extrinsic features that influence cancer cell behavior and clinical outcome. Cell image provided by Juha Rantala.
image
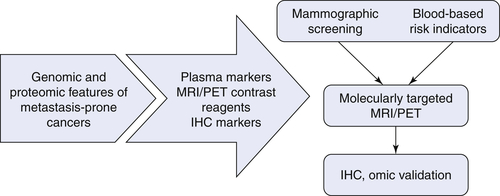
Figure 24-3 Schematic illustration of a genome-based approach to early cancer detection. IHC, Immunohistochemistry; MRI, magnetic resonance imaging; PET, positron emission tomography.
The identification of molecular features that are unique to cancers and associated with poor outcome also provides the basis for the development of assays that may identify cancers at high risk of progressing to metastatic disease at a time before they have metastasized so that they can still be treated successfully. Development of such assays would improve outcomes in patients afflicted with cancers of high metastatic potential and would reduce overtreatment of patients with low propensity for recurrence. These assays likely will be composed of a tiered combination of blood-based, anatomic, or histopathological assays with increasing sensitivity, specificity, and cost as illustrated in Figure 24-3 .
Blood-based assays to date have focused on the detection of cancer-specific proteins and are low cost but also relatively low in sensitivity and specificity. Assays of prostate-specific antigen (PSA) for prostate cancer and CA-125 for ovarian cancer are prototypical, but omic analyses are now revealing a wide range of cancer-specific changes in gene expression and/or splicing that might increase the specificity of these tests. For example, powerful mass spectrometry techniques and computational analyses of genomic changes are revealing increasing numbers of cancer-specific proteins that may be detected in blood. 135,136 In addition, it is now apparent that the ongoing process of tumor cell death leads to the appearance of tumor DNA fragments or microRNAs in peripheral blood or urine. Some of these tumor-derived DNA fragments carry aberrations such as mutations, translocations, and changes in methylation that are unique or very specific to the tumor. As a consequence, sensitive blood-based assays are now being developed to detect the presence of these sequences as an indication of the presence of cancer. Recent examples include an epigenetic marker panel for detecting lung cancer using cell-free serum DNA, 137 analysis of mutations in DNA isolated from plasma and stool of cancer patients, 138,139 detection of translocations as an indication of cancers of the prostate 140 or ovary, 141 and detection of genome copy-number changes as an indication of the presence of metastatic breast cancer. 139
Anatomic cancer detection strategies based on the detection of specific molecular species using positron emission tomography (PET) and magnetic resonance imaging (MRI) are now being developed to enable the detection of cancer-specific genomic features. This requires the development of contrast reagents that make tumors and the aberrant microenvironments they produce visible when the tumors are still small and locally contained. 142 Genome profiling studies are revealing molecular features that are unique to early cancers. A variety of contrast reagents that target these are now being developed. These include reagents for the detection of estrogen receptor 143 and PSA 144 ; a range of nanoparticles carrying affinity molecules that detect cancer-associated proteins 145147 ; and molecular features associated with cancer-associated stroma. 148
Histological assessment of tissue samples taken from cancerous lesions has long been the gold standard for cancer detection and diagnosis. However, routine analyses of tissue sections stained with hematoxylin and eosin (H&E) currently do not provide sufficient information to distinguish between lesions of high and low malignant potential. Genome studies such as those described earlier are increasingly able to define molecular features associated with the most aggressive malignant lesions. This information is fueling the development of multiplex immunohistochemical assays and/or histologically targeted genomic assays that are better able to identify lesions at high risk of progressing. 149,150 These same assays also offer the potential of detecting isolated cancer cells that might be otherwise missed during an assessment of H&E-stained sections.

Therapeutic Targets and Predictive Markers

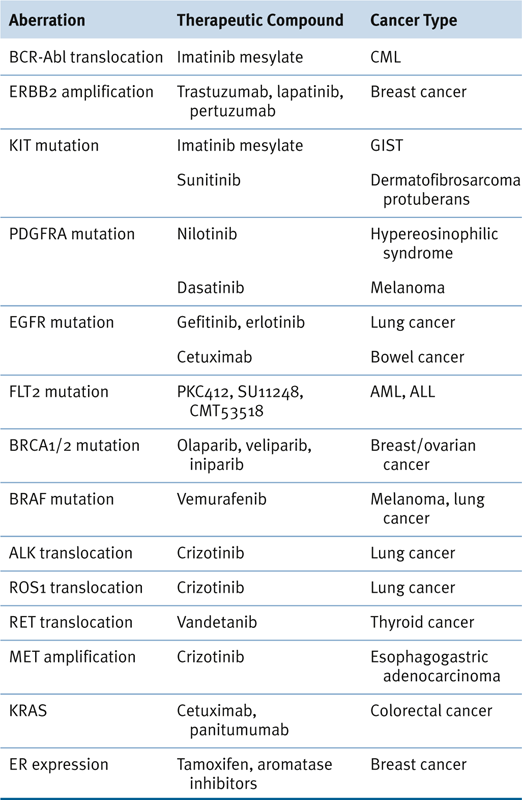
Discovery of strong driver aberrations that can be attacked with therapeutic benefit was an early motivating factor in the development of international genomics efforts. 151 Early discoveries showed that chronic myelogenous leukemias driven by the BCR-Abl tyrosine kinase could be effectively targeted by imatinib mesylate 152 and breast tumors driven by amplification of HER2 could be effectively treated with trastuzumab. 153 Table 24-3 154 summarizes more recent driver genomic aberrations, the cancers in which they occur, and the successful therapeutic agents that attack them. This list will expand continuously as additional therapeutic agents for recurrent genomic aberrations are tested. Additional genes harboring genomic aberrations for which therapies are now being tested include AKT1, PIK3CA, PTEN, MYC, VHL, and HRAS. 151
These studies are stimulating the development of a wealth of new therapeutic agents. Almost 900 small-molecule inhibitors and biological therapeutics are now under development for the treatment of human malignancies. 155 These agents target molecular features ranging from broad-specificity conventional therapeutics to inhibitors that selectively target specific molecular aberrations and deregulated pathways. The general trend in drug development today is moving toward agents that are targeted toward pathways. 156

Table 24-3

Genomic Aberrations, Therapeutic Agents, and Relevant Cancers 154
image

ALL, Acute lymphocytic leukemia; AML, acute myeloid leukemia; CML, chronic myelogenous leukemia; GIST, gastrointestinal stromal tumor.

The traditional path to the clinic for new cancer drugs is to test them in phased trials in the metastatic setting, followed by testing in randomized Phase III registration trials in the adjuvant setting. This approach requires a substantial investment in time, number of patients, and money. The U.S. Food and Drug Administration (FDA) has published draft guidance for using pathological complete response in neoadjuvant treatment for accelerated approval in high-risk breast cancer, which would dramatically accelerate the approval process. 157 Although a step forward, this approach has the weakness that drugs that are effective only in a small population of patients may be discarded because of lack of apparent efficacy. Biomarkers that predict response to therapy would enable identification of these small subpopulations so that they can be targeted early in the clinical trials. As described earlier, this can be accomplished by developing initial insights about subpopulation specificity using preclinical models of aspects of tumor-intrinsic and tumor-extrinsic heterogeneity that influence responses.
It is also becoming clear that specific regulatory pathways can differ among cancer subtypes so that these subtypes respond differently to targeted and nontargeted therapies. It has long been recognized, for example, that estrogen-receptor–positive (ER+) breast cancers will respond well to selective estrogen response modifiers 158 and that a subset of prostate cancers is responsive to inhibitors of androgen receptors. 159 However, it now appears that most anticancer agents will be preferentially active in cancer subtypes defined according to their genomic characteristics. 73 The explanation for this seems to be that the use of molecular pathways that regulate cell behavior (and response to therapy) differs among subtypes. Efforts in the TCGA project and other international genomics efforts are defining subtypes in most anatomically defined cancers that can be considered for stratification of therapeutic response. Full use of this information will require the development of approved molecular assays that can stratify patients according to subtype.

Summary

International efforts are now defining the genomic and epigenomic landscapes of most major tumor types. The first set of cross-tumor (a.k.a. “Pan-Cancer”) studies are now emerging to help delineate core and lineage-specific contributors of the disease. 160 These studies are revealing a few strong driver aberrations in each cancer type and many—sometimes thousands—of aberrations of unknown consequence. Much work remains to determine which of these contribute to the pathophysiology of each cancer type, but it is already clear that these analyses will have a profound effect on the way most cancers are managed. Aspects of cancer management that will benefit include early detection of the most lethal cancers, identification of recurrently aberrant genes and networks for high-priority therapeutic attack, and development of molecular markers that predict response to gene- or network-targeted therapies.
References

1. Bhat K.P. et al. The transcriptional coactivator TAZ regulates mesenchymal differentiation in malignant glioma . Genes Dev . 2011 ; 25 : 2594 2609 .

2. Cancer Genome Atlas Research Network . Comprehensive genomic characterization defines human glioblastoma genes and core pathways . Nature . 2008 ; 455 : 1061 1068 .

3. Cancer Genome Atlas Research Network . Integrated genomic analyses of ovarian carcinoma . Nature . 2011 ; 474 : 609 615 .

4. Cancer Genome Atlas Network . Comprehensive molecular characterization of human colon and rectal cancer . Nature . 2012 ; 487 : 330 337 .

5. Cancer Genome Atlas Research Network . Comprehensive genomic characterization of squamous cell lung cancers . Nature . 2012 ; 489 : 519 525

Buy Membership for Hematology, Oncology and Palliative Medicine Category to continue reading. Learn more here