CHAPTER 90 Ultrasound Evaluation of the Carotid Arteries
Stroke remains the third leading cause of death and is a major cause of morbidity in the United States.1 Most strokes are due to thromboembolic events rather than to ischemia or reduced perfusion. Whereas the heart is the number one source, 20% to 30% of strokes are believed to be secondary to embolus from plaque or thrombus at the carotid bifurcation.2 Carotid endarterectomy has been convincingly shown in several prospective multicentered, randomized, double-blind trials to significantly reduce the risk of stroke and death in patients with stenoses of the internal carotid artery (ICA) of more than 60% to 70% compared with optimized medical therapy.3–6 However, at the time these trials were published in the 1990s, statin therapy was not a part of the standard medical regimen, and double-blind trials comparing carotid endarterectomy with medical management including statin therapy are currently ongoing.
Thus, the identification of patients with ICA stenoses of 60% to 70% is clearly important for patient management, allowing appropriate referral for carotid endarterectomy. Risk factors for disease at the carotid bifurcation include atherosclerosis, hypertension, diabetes mellitus, hyperlipidemia, hypercholesterolemia, obesity, and smoking. Patients with risk factors for carotid plaque, carotid bruits, and symptoms of stroke or transient ischemic attacks are typically referred for evaluation of the carotid arteries, which can be performed with ultrasonography, computed tomographic angiography, magnetic resonance angiography, or conventional angiography. Of these potential screening modalities, carotid ultrasound examination is the most readily available, least invasive, and least expensive. Numerous studies have shown that when it is performed appropriately, ultrasound examination of the carotid arteries is highly accurate for detection of surgical lesions (i.e., ICA stenoses ≥70%),7–10 and additional confirmatory studies such as CT angiography, magnetic resonance angiography, and conventional angiography are usually unnecessary except in complex cases with discordant findings or poor visualization. The precise method of grading stenoses of the ICA changed with the publication of the North American Symptomatic Carotid Endarterectomy Trial (NASCET).3 Before the NASCET, the percentage stenosis of the ICA was typically calculated by comparing the width of the residual lumen with the estimated diameter (outer wall to outer wall) of the ICA at the site of the stenosis (Fig. 90-1A). However, because the outer wall of the ICA can be seen on an angiogram only if it is calcified, angiographic measurements of ICA diameter are only estimates in many cases. Hence, this method has significant interobserver and intraobserver variability as well as poor reproducibility. Thus, when the NASCET was designed, the measurement of percentage ICA stenosis was standardized angiographically by comparing the width of the residual lumen at its narrowest point with the diameter of the lumen of the distal normal ICA (beyond any post-stenotic dilation; Fig. 90-1B) because the vessel lumen can be accurately and reproducibly measured on angiographic images. For a given residual lumen, the percentage stenosis is generally higher with the pre-NASCET method of calculating an ICA stenosis.
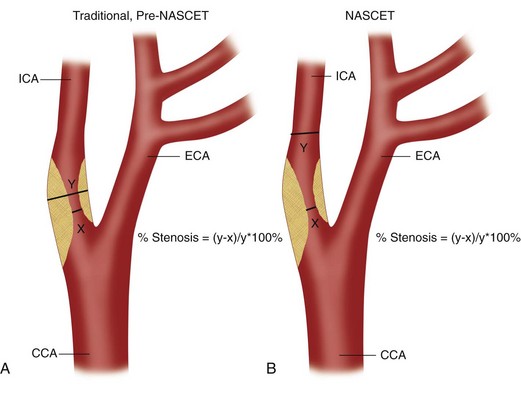
 FIGURE 90-1
TECHNICAL REQUIREMENTS
Technique
Technique Description
The examination begins with evaluation of plaque burden. Plaque echotexture should be characterized as hypoechoic, heterogeneous, or echogenic (Fig. 90-2). The surface contour of the plaque should be described as smooth or irregular (Fig. 90-3), and the percentage reduction of the arterial diameter by the plaque should be estimated.
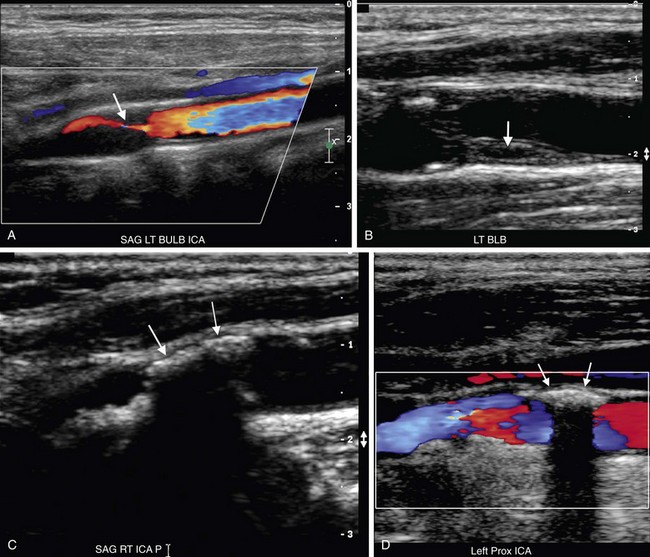
 FIGURE 90-2
 FIGURE 90-3
Optimal evaluation of plaque requires both gray-scale and color or power Doppler imaging in the longitudinal and transverse planes of the entire CCA and ICA as well as the origin of the external carotid artery (ECA). The focal zone should be set at the level of the far wall of the vessel. The use of spatial compounding and harmonic imaging will also improve gray-scale resolution. The gray-scale gain should be adjusted such that plaque and the vessel wall are easily depicted but artifactual echoes are not present within the vessel lumen. If the gain is set too low, plaque will look artifactually hypoechoic. The color gain should be optimized by slowly increasing the gain until color speckles are noted in the surrounding soft tissues. The gain is then decreased until the color pixels are visible only within the vessel lumen. If the gain is set too high, the color pixels will overwrite or “bleed” over plaque, obscuring visualization of the true extent of plaque burden, particularly during systole, and stenoses may be overlooked (Fig. 90-4). If the gain is too low, sensitivity to blood flow will be decreased, and false-positive diagnoses of occlusion or stenosis will be made. The color velocity scale should be adjusted such that color fills the lumen reaching to the vessel wall. Therefore, the color velocity scale may have to be changed slightly as one interrogates the different vessels in the neck. If the scale is set too low, aliasing will occur, making it more difficult to detect flow disturbances at the site of a stenosis. In addition, color motion artifact, which may obscure visualization of the vessel, is more prominent when the velocity scale or pulse repetition frequency is set too low. The wall filter should be set as low as possible without degradation of the image by motion artifact. Angling of the color box will facilitate evaluation of the direction of blood flow, and a straight, small color box will increase sensitivity to flow. If the vessel lumen cannot be visualized because of shadowing from plaque, an approach to the vessel from different angles (including the transverse plane) or use of a curved array transducer may be helpful.
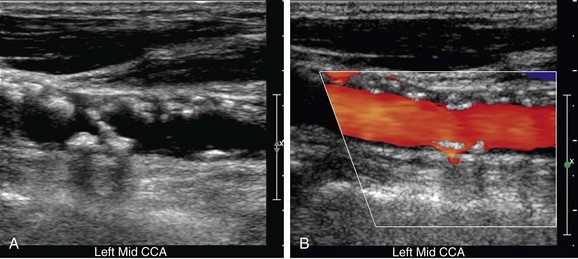
 FIGURE 90-4
Spectral Doppler tracings are obtained from longitudinal images with the sample volume placed centrally within the vessel lumen or at the brightest spot in any area of focal color aliasing. To optimize the spectral Doppler tracing, the velocity scale and baseline should be adjusted such that the tracing fills the velocity spectrum or scale. If the scale is too high, the waveform will be too small to easily measure or analyze. However, if the scale is too low, the tracing will be too large, and wraparound or aliasing of the systolic velocity peak will occur, making it impossible to accurately measure PSV. The angle of spectral Doppler insonation should be kept between 45 and 60 degrees to minimize error in the calculation of velocity from the Doppler frequency shift. If at all possible, the angle should be kept constant on follow-up studies. The angle cursor should be placed parallel to the direction of blood flow in the color jet or vessel lumen rather than parallel to the vessel wall. The direction of blood flow will, in fact, parallel to the vessel wall in most cases, but the jet of blood may travel tangentially or obliquely in relationship to the vessel wall if plaque is irregular or asymmetric (Fig. 90-5). In such cases, the angle correction cursor should be placed parallel to the jet of blood as seen on color Doppler imaging. The sample gate should be kept small, between 1.5 and 2.5 mm in width, and placed in the center of the vessel because PSV will be lower near the vessel wall owing to the geometry of laminar flow and drag from the vessel wall. If the sample gate is too wide, a wider range of velocities will be depicted, and there is the potential risk of falsely creating the appearance of spectral broadening and turbulent flow. Finally, the spectral Doppler gain should be optimized; the gain should be increased until background speckles appear on the spectral tracing and then readjusted downward until the background is homogeneously black. Although incorrect spectral Doppler gain settings rarely cause shifts in PSV of more than 20 cm/sec, such variation in the distal CCA can be important when the PSV in the distal CCA is used as the denominator in calculation of the peak systolic velocity ratio (PSVR). Apparent spectral broadening with “fill in” of the spectral envelope can also be spuriously created if the spectral Doppler gain is set too high.
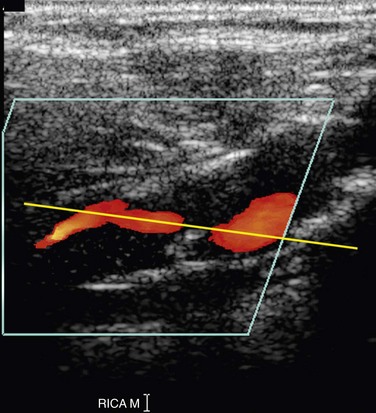
 FIGURE 90-5
Protocol
Normal Findings
The CCA, ICA, and ECA demonstrate distinct characteristic waveform patterns. Whereas all segments of the extracranial carotid arteries normally demonstrate a sharp systolic upstroke and thin spectral envelope, the amount of diastolic flow varies in each vessel, reflecting the oxygen consumption and peripheral vascular resistance of the vascular bed supplied. The ECA, which supplies the muscular bed of the scalp, typically demonstrates completely absent or very low velocity end-diastolic flow. Although the amount of diastolic flow in the ECA may vary from patient to patient, it should be symmetric right to left and less than the diastolic flow in the ICA or CCA (Fig. 90-6). An early diastolic notch followed by a short reversal of flow in early diastole is often seen in the ECA. The ICA, which supplies blood to the brain (high oxygen consumption), has a low-resistance waveform pattern with continuous forward, relatively high velocity diastolic flow (Fig. 90-7). The waveform of the CCA demonstrates an intermediate amount of diastolic flow and often demonstrates a brief reversal of flow in early diastole (Fig. 90-8). The vertebral artery has a waveform pattern similar to that of the ICA, characterized by a sharp systolic upstroke and continuous forward diastolic flow (Fig. 90-9).
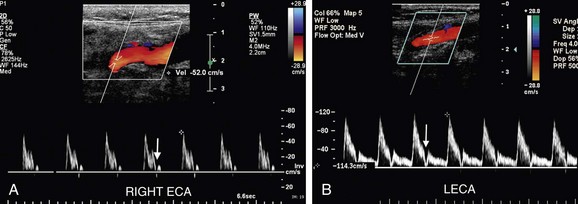
 FIGURE 90-6
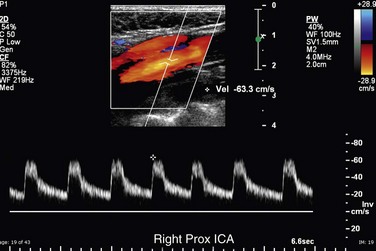
 FIGURE 90-7
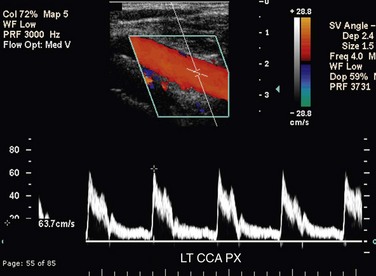
 FIGURE 90-8
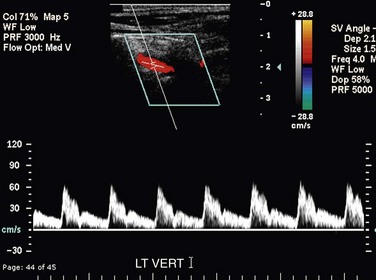
 FIGURE 90-9
Differentiation of the ICA from the ECA is critically important to avoid misinterpretation of a stenosis in the ECA as a more clinically significant ICA stenosis. The best method of identifying the ECA is by visualization of branches arising from the vessel (Fig. 90-10A). The ICA virtually never gives rise to branch vessels in the neck. Temporal tapping over the ophthalmic artery will generate sharp, spike-like deflections in the waveform of the ECA during diastole (Fig. 90-10B). However, on occasion, transmitted pulsations to the ICA will be observed after temporal tapping, although the deflections are typically blunted in comparison to the deflections observed in the ECA.7,8 In general, the ECA is smaller, is more medial, and has a higher resistance waveform pattern than the larger posterolateral ICA. However, location and vessel size are not reliable criteria for differentiation of the ICA from the ECA in all patients.
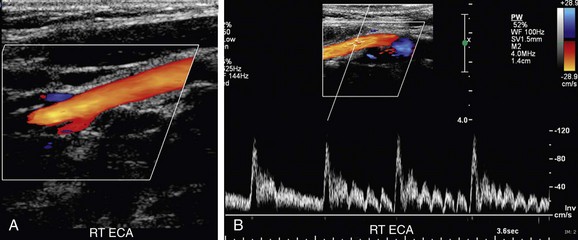
 FIGURE 90-10
Grading Stenoses in the Internal Carotid Artery
Grading of stenosis in the ICA by Doppler velocity criteria is based on the simple precept that flow volume is equal to vessel area multiplied by PSV. Because flow volume is a relative constant, PSV is inversely related to vessel lumen diameter. Therefore, if the vessel diameter decreases, PSV must increase to maintain flow volume. As demonstrated by the Spencer diagram, once the vessel diameter decreases by more than 50%, PSV at the site of the stenosis rises exponentially, and this compensatory increase in PSV maintains flow volume until the stenosis reaches approximately 70%.9 When a stenosis exceeds 70%, flow volume will begin to drop despite continued exponential increase in PSV. Once a stenosis in the ICA becomes greater than approximately 96%, the gradient across the stenosis becomes too high for the pressure generated by the combination of myocardial contractility and vessel elasticity to force blood through the residual lumen, and PSV begins to drop until the vessel occludes and velocity is zero.9
Numerous studies have attempted to correlate Doppler measurements of PSV, PSVR, and EDV criteria with angiographically calculated percentage stenosis. Widely variable results have been reported.10–14 In general, velocity criteria have a higher accuracy and positive predictive value for high-grade stenoses (>70%) and are less reliable for accurate grading of more moderate stenoses (<50%).12,14 Criteria are probably both machine (possibly even transducer) and laboratory specific and therefore should be validated for each laboratory and machine upgrade if possible. Studies have also demonstrated that vascular laboratories cannot reliably differentiate stenoses in the ICA by 10% increments.12,14 Accuracy is best achieved by focusing on whether a stenosis is greater than or less than a specific percentage stenosis. In most institutions, carotid endarterectomy is recommended in patients with ICA stenosis of more than 70%. Hence, most vascular laboratories categorize ICA stenoses as less than 50%, 50% to 69%, 70% to 96%, and more than 96%.
A meta-analysis published by Grant and colleagues12 found that accuracy varied little over a wide range of threshold values for PSV and PSVR, although the sensitivity and specificity were inversely proportional. Hence, the authors recommend that if the Doppler examination is to be used as a screening test, lower thresholds with higher sensitivity should be used. However, if the Doppler examination is intended as a diagnostic test without anticipating confirmation by some angiographic imaging modality, then specificity should be emphasized and higher thresholds are recommended.12
In 2002, the Society of Radiologists in Ultrasound (SRU) convened a multidisciplinary panel of experts, including both radiologists and vascular surgeons, to develop a consensus for grading of ICA stenoses by Doppler ultrasonography. The published recommendations of this consensus conference are as follows13:
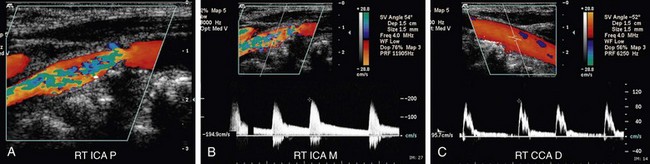
 FIGURE 90-11
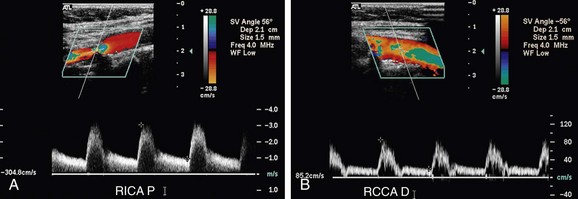
 FIGURE 90-12
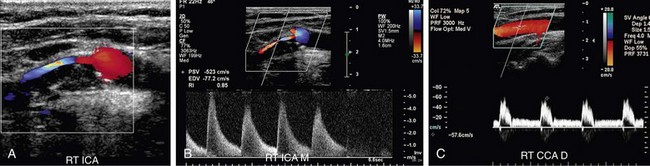
 FIGURE 90-13
Once an ICA stenosis becomes greater than an approximately 96% diameter reduction, PSV velocity begins to drop (Fig. 90-14) until the vessel occludes and the velocity reaches zero.9 Hence, the panel also recommended that the estimation of diameter reduction by plaque on gray-scale and color Doppler imaging be correlated with the velocity-based estimate of percentage stenosis.13
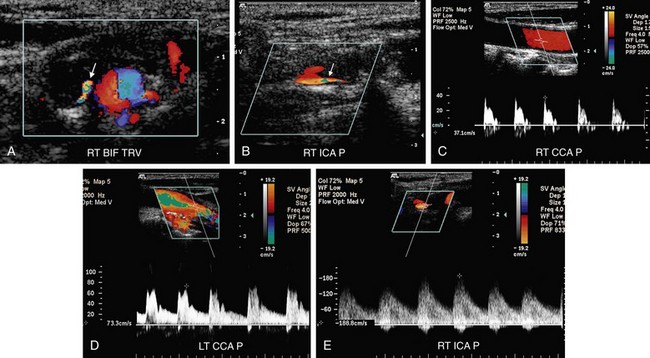
 FIGURE 90-14
Pitfalls: Technique
Incorrect Choice of Doppler Angle
An incorrect Doppler angle or a Doppler angle that is too high will introduce error into the calculation of PSV. An angle above 60 degrees will result in a falsely elevated PSV (Fig. 90-15). The correct Doppler angle should be calculated in reference to a vector parallel to the vessel lumen or direction of blood flow, which will not necessarily be parallel to the vessel wall in the case of extensive, irregular plaque (see Fig. 90-5).
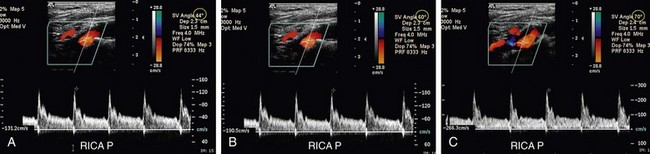
 FIGURE 90-15
Incorrect Gain
If the color gain is set too high, the color will bleed over the vessel wall, obscuring plaque and stenosis (see Fig. 90-4). If the color gain is set too low, the color will not reach the vessel wall and will falsely create the appearance of hypoechoic plaque. If the gray-scale gain is set too low, plaque will appear falsely hypoechoic. Incorrect spectral Doppler gain can also cause slight increase or decrease in measurement of PSV (see earlier).
Pitfalls: Pathology
Tortuous Carotid Artery
When the carotid arteries are tortuous, most commonly in elderly patients, PSV can be elevated without an underlying stenosis (Fig. 90-16). This is due in part to a true increase in PSV as the blood accelerates around the curves but is also likely due to difficulty in assigning a correct Doppler angle along the curved vessel, which results in an overestimation of PSV due to incorrect Doppler angle. Hence, the sonographer should use caution before diagnosing a carotid stenosis solely on the basis of elevation of PSV in a tortuous vessel without evidence of plaque or vessel narrowing. A true stenosis should cause post-stenotic turbulence in addition to an increase in PSV.
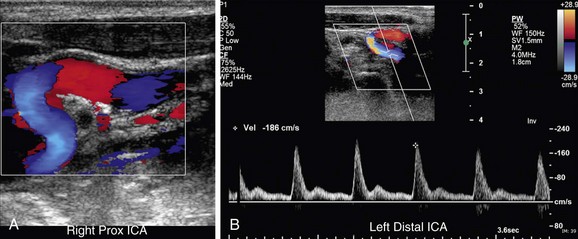
 FIGURE 90-16
Heart Rate
Heart rate affects both PSV and EDV. PSV will be relatively elevated and EDV will be artificially low in patients with bradycardia. Conversely, in patients with fast heart rates, PSV will be relatively low because of decrease in stroke volume. However, because velocity normally decreases during diastole, EDV will be artificially elevated in patients with tachycardia because of shortening of diastole. Common causes of tachycardia include stress, medications, and thyrotoxicosis. Ventricular conduction defects, medications (including common cardiac drugs such as afterload reducers like propranolol), and hypothyroidism may result in brachycardia. Hence, measurement of PSV and grading of ICA stenoses in patients with cardiac arrhythmias may be problematic. For example, PSV will be increased in the beat after a compensatory pause as a result of relative bradycardia and decreased during a premature ventricular contraction as a result of relative tachycardia (Fig. 90-17). Recommended general guidelines for measurement of PSV in patients with cardiac arrhythmias include the following:
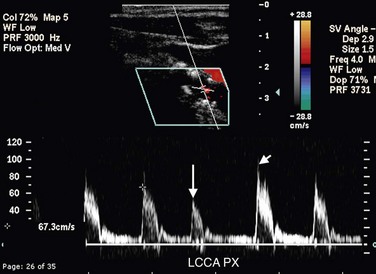
 FIGURE 90-17
Long-Segment or Synchronous Involvement
Coexistent disease in the carotid arteries will also make PSV Doppler criteria less reliable. Synchronous disease in the CCA, or tandem lesions, will result in a decrease in PSV for a given percentage stenosis in the ICA. Hence, the entire CCA and ICA must be evaluated, not just the carotid bifurcation. Most ICA stenoses are less than 2 cm in length. However, if a stenosis is unusually long (>2 cm), PSV often drops (possibly because of increased in-flow resistance), although diastolic velocity may remain high (Fig. 90-18). Prior radiation therapy, carotid dissection, arteritis, or fibromuscular dysplasia should be considered when a long-segment stenosis is noted, although diffuse atherosclerosis may also be the cause.
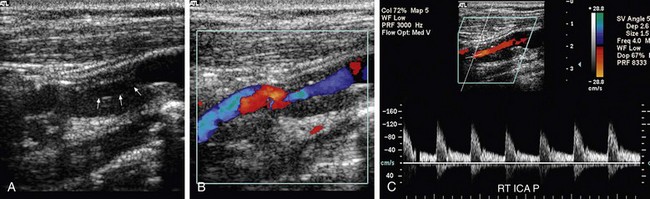
 FIGURE 90-18
Contralateral Carotid Disease
A high-grade carotid stenosis or occlusion will increase PSV in the contralateral side, especially at the site of a stenosis. Hence, if the PSV seems more elevated than one would expect given the amount of visualized plaque and if the vessel is not tortuous, one should be suspicious of contralateral disease (Fig. 90-19). The degree of increase in velocity is unpredictable and may differ in the CCA and ICA in a given patient. Hence, the use of PSVR may not adequately compensate.15,16
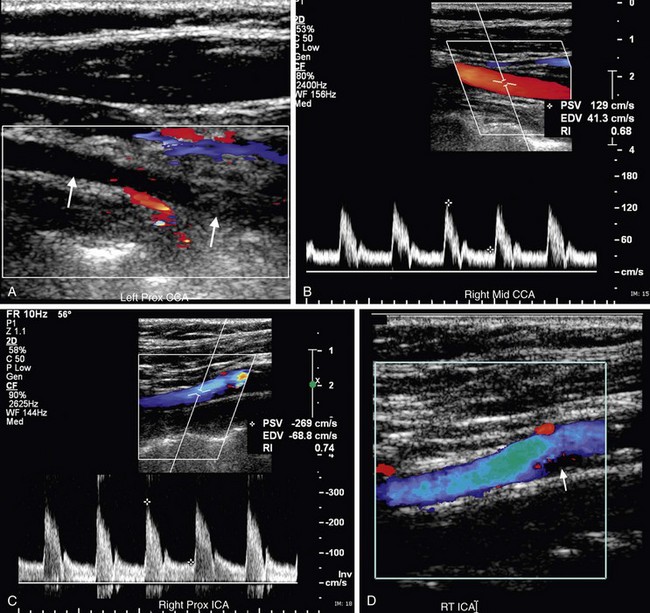
 FIGURE 90-19
ULTRASOUND ASSESSMENT OF PLAQUE
Ultrasound evaluation of plaque requires gray-scale and color Doppler imaging in both longitudinal and transverse planes. Such images can be used to estimate percentage diameter reduction by plaque and correlated with PSV measurements. In addition, the echotexture and surface contour of the plaque should be assessed. Plaque should be characterized as hypoechoic or echogenic (see Fig. 90-2) with either a smooth or irregular surface (see Fig. 90-3). Prospective studies have shown that hypoechoic, irregular plaque is associated with an increased risk of neurologic events and increased rate of plaque progression.17,18
Whereas echogenic plaque is readily depicted on gray-scale imaging, hypoechoic plaque may not be visible. However, on color Doppler imaging, hypoechoic plaque is readily observed as a signal void (Fig. 90-20). Similarly, surface irregularities are often best seen when outlined by color Doppler flow (Fig. 90-21). Although a pit deeper than 2 mm in a plaque raises concern for ulceration (Fig. 90-22), Doppler ultrasonography is not highly accurate in identifying plaque ulceration. Indentations or divots in plaque identified on color Doppler imaging can, in fact, be endothelialized and therefore not be true ulcers. The same limitation is true for angiography, and plaque ulceration remains primarily a histologic diagnosis. Color Doppler imaging, although necessary for the depiction of hypoechoic plaque, does not eliminate the need for gray-scale evaluation as color blooming, particularly during systole, may overwrite and obscure plaque, thereby causing an underestimation of plaque burden (see Fig. 90-4). Gain settings are important also on gray-scale imaging. If the gain is set too low, plaque will appear falsely hypoechoic, raising unnecessary concern. The percentage diameter reduction is usually best depicted on longitudinal images. However, if the plaque is irregular or eccentric, if there are numerous foci of plaque, or if the vessel lumen is tortuous, transverse images can be extremely helpful, ensuring that the longitudinal image is truly midline and not too lateral or off axis. If the longitudinal image is obtained over an eccentric focus of plaque or too close to the vessel wall, the degree of stenosis will be overestimated. If the vessel lumen is obscured by shadowing from calcified, echogenic plaque, imaging from different planes (i.e., anteriorly or posteriorly), power Doppler imaging, or use of a lower frequency transducer may help visualize the vessel lumen. On occasion, transverse images will eliminate or avoid shadowing from plaque. If the shadowing from plaque obscures the vessel lumen for less than 1 cm, standard PSV criteria can still be used to estimate percentage stenosis because the high-velocity jet caused by a stenosis will persist for approximately 1 cm. However, if more than 1 cm of the vessel length is obscured by shadowing from plaque, the maximal focal elevation of PSV in the post-stenotic jet may be missed, and therefore the use of Doppler velocity criteria to assess carotid stenosis is limited. In such cases, follow-up with CT angiography, magnetic resonance angiography, or conventional angiography is appropriate.
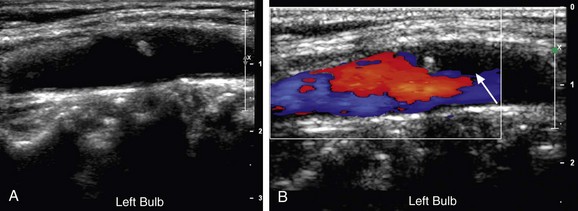
 FIGURE 90-20
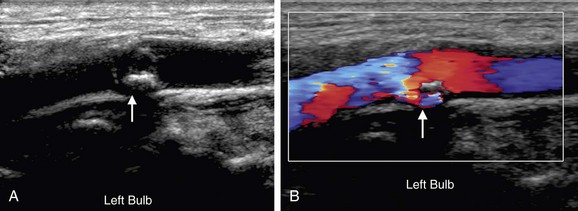
 FIGURE 90-21
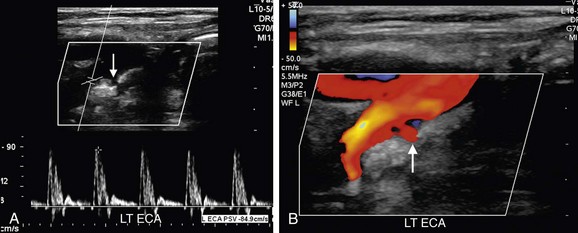
 FIGURE 90-22
The length of the stenosis should also be considered. Most ICA stenoses are relatively short. If a long-segment stenosis is observed, PSV will be less than expected, although diastolic velocity will remain high (see Fig. 90-18). The relative decrease in PSV is likely due to in-flow resistance. Causes of long-segment stenosis include radiation therapy, carotid dissection, and arteritis (including fibromuscular dysplasia).
Thickening of the wall of the CCA, termed fibrointimal thickening, has recently been described as a risk factor for cardiovascular disease (Fig. 90-23).19,20 Normal wall thickness is likely to be related to race and gender. Measurements should be obtained from the far wall of the CCA or ICA on a magnified image. However, there are technical limitations to accurate measurement and reproducibility of such a thin structure as the vessel wall, and further research in this area continues.
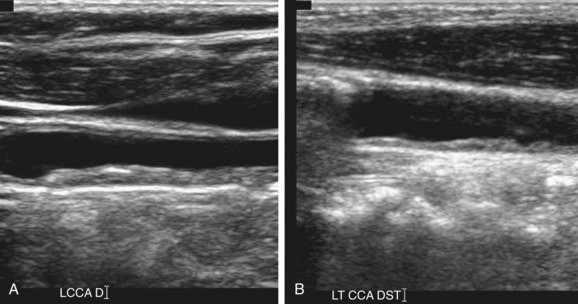
 FIGURE 90-23
WAVEFORM ANALYSIS OF THE CAROTID ARTERIES
Abnormalities of the Systolic Peak
Parvus Tardus Waveform
A parvus (diminished) tardus (delayed) waveform occurs distal to a severe proximal stenosis.21,22 The parvus tardus waveform is characterized by decreased PSV and a delayed, more horizontal systolic upstroke with rounding or blunting of the systolic peak. The parvus tardus waveform phenomenon becomes more pronounced the more distal to the stenosis that the vessel is sampled. Hence, it is important to sample the ICA as distally as possible. In addition, the pattern of distribution of the parvus tardus waveform within the vessels in the neck helps pinpoint the location of the proximal stenosis. For example, if only the left CCA, ECA, and ICA have a parvus tardus waveform and if a sharp systolic upstroke is present in the right CCA, right ICA, and both vertebral arteries, the stenosis is likely to be at the level of the origin of the left CCA from the aortic arch. However, involvement of the bilateral CCAs, ICAs, and vertebral arteries is most likely indicative of a stenosis at the level of the aortic valve (Fig. 90-24).23
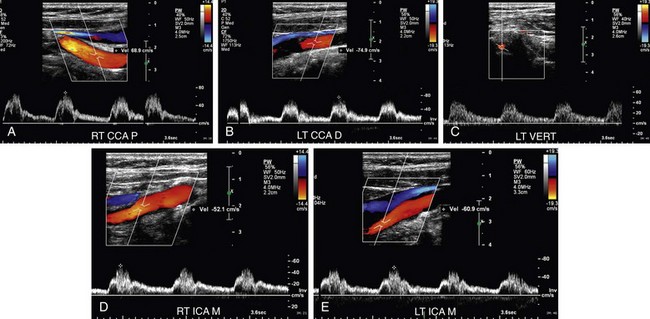
 FIGURE 90-24
Pulsus Bisferiens Waveform
Rarely, two systolic peaks of similar velocity with an interposed midsystolic retraction or deceleration may be observed (Fig. 90-25). This has been termed pulsus bisferiens (Latin, “beat twice”). Whereas this has been described in the literature as most commonly associated with aortic regurgitation (particularly if it coexists with aortic stenosis) and hypertrophic cardiomyopathy,24 it may more likely be a result of changes in compliance of the vessel wall. In our experience, a bifid systolic peak may be seen in healthy, athletic young individuals or in elderly patients without known underlying heart disease.
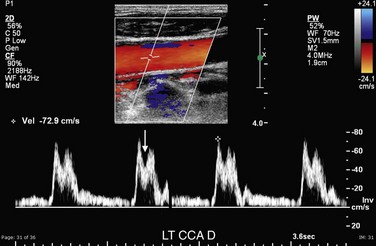
 FIGURE 90-25
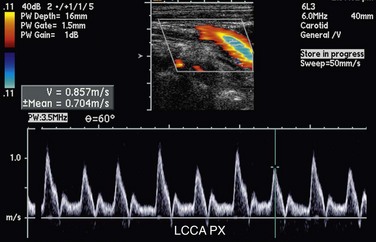
 FIGURE 90-26
Abnormalities of Diastolic Flow
The normal ECA demonstrates a characteristic high-resistance waveform pattern with little or no diastolic flow and an early diastolic notch. Although the amount of diastolic flow may vary from individual to individual, the diastolic flow pattern should be symmetric right to left in the same individual. When the ipsilateral ICA is occluded, “internalization” of the ECA may occur, and a lower resistance waveform pattern with increased diastolic flow and asymmetric to the contralateral ECA may be observed (Fig. 90-27).22,26 This phenomenon is incompletely understood but probably reflects the development of low-resistance collateral pathways. Occlusion of the ipsilateral CCA may sometimes result in a similar waveform pattern in the ECA but with reversed flow if the ICA is reconstituted at the level of the carotid bulb by retrograde flow from the ECA (Fig. 90-28). In such cases, the ECA and ICA waveforms may also demonstrate a delay in systolic upstroke.
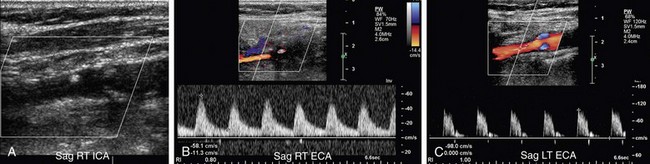
 FIGURE 90-27
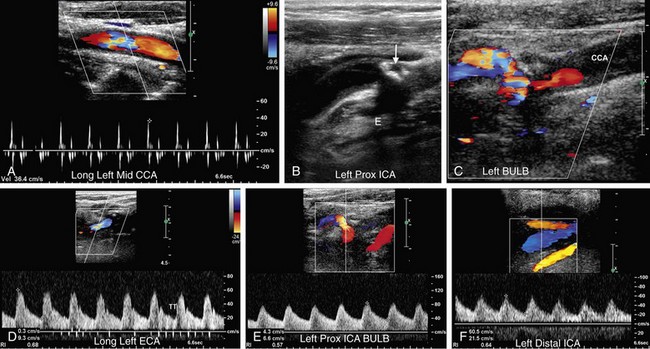
 FIGURE 90-28
A high-resistance waveform pattern with diminished, absent, or reversed diastolic flow is an abnormal finding in the CCA or ICA suggestive of increased peripheral vascular resistance or a distal vascular occlusion or high-grade stenosis. When PSV is significantly reduced, this appearance has been described as a “knocking” waveform pattern.22 A unilateral knocking waveform pattern in the CCA is most commonly observed proximal to a distal high-grade stenosis or occlusion of the ICA or intracerebral vasculature (Figs. 90-28 and 90-29). The reversal of diastolic flow and decrease in PSV become more pronounced the closer to the obstructing lesion that the vessel is sampled. On occasion, a unilateral knocking waveform can be seen in the setting of distal vasospasm, arteritis, or carotid dissection. However, in the case of a carotid dissection, the sampled vessel will typically appear quite narrow over a long segment, and the echogenic dissection flap may also be seen on gray-scale images (see later). Bilateral high-resistance waveform patterns in the ICAs may indicate increased intracranial pressure, diffuse intracerebral vasospasm, or arteritis (Fig. 90-30).
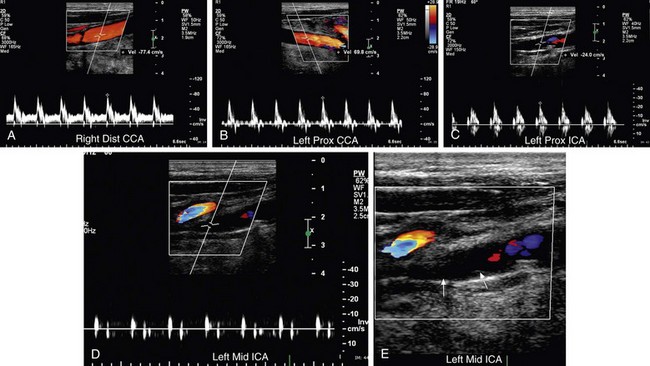
 FIGURE 90-29
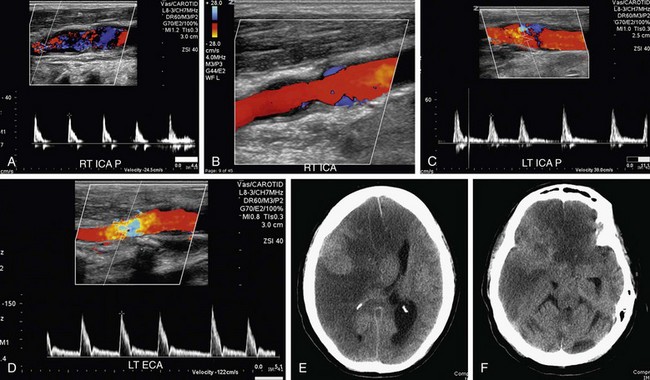
 FIGURE 90-30
When a high-resistance waveform pattern is noted in the proximal CCAs bilaterally and PSV is increased, aortic regurgitation is the usual cause. The precise diastolic flow pattern depends on the severity of the aortic regurgitation: diastolic flow may be reversed only in early diastole and associated with normal end-diastolic flow; early reversal of diastolic flow may be noted with absent end-diastolic flow; or in severe cases, reversed flow may be seen throughout diastole (Fig. 90-31).22 This waveform pattern is the Doppler equivalent of the water-hammer pulse detected on physical examination in patients with severe aortic regurgitation. Typically, only moderate to severe aortic regurgitation will disturb the common carotid arterial waveform. The change in diastolic flow pattern and increase in PSV are more pronounced the more proximally one samples the CCA. The waveform pattern in the ICA or even distal CCA will normalize, depending on the severity of the aortic regurgitation. This is a bilateral phenomenon.
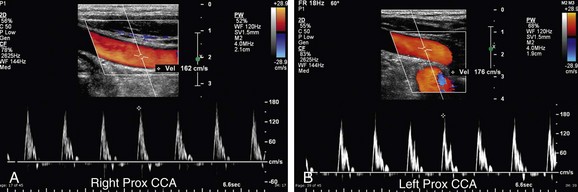
 FIGURE 90-31
Abnormal Waveform Patterns Involving the Entire Cardiac Cycle
Carotid Dissection
In patients with carotid dissection, an echogenic intraluminal flap may be observed on longitudinal or transverse gray-scale images (Fig. 90-32A,B). Flow in both the true and false lumens may be detected on Doppler imaging, albeit with different velocities and waveform patterns (Fig. 90-32C). The spectral Doppler waveform pattern is highly variable, probably related to the length of the dissection, diameter of the lumen, fenestration of the dissection flap, coexisting involvement of aortic dissection, and whether the true or false lumen is sampled (Fig. 90-32D,E). The waveform may be irregular with low-velocity spikes and flutters, making it difficult to distinguish systole from diastole. If the false lumen is thrombosed or if only intramural hematoma is present, gray-scale and color flow imaging will simply reveal a long, smoothly marginated stenosis. The thickening of the arterial wall is typically hypoechoic and may spiral or smoothly taper the distal arterial lumen (Fig. 90-33).27 A long-segment tapering intraluminal hematoma may create an extremely narrowed lumen with a string sign on color Doppler imaging. In such cases, the waveform may be indistinguishable from a carotid stenosis; the clues to dissection are the length and smoothness of the stenosis, absence of coexistent plaque, and clinical setting. A high-resistance pulsatile but dampened waveform with little or no diastolic flow may be noted proximally in such cases.27–29
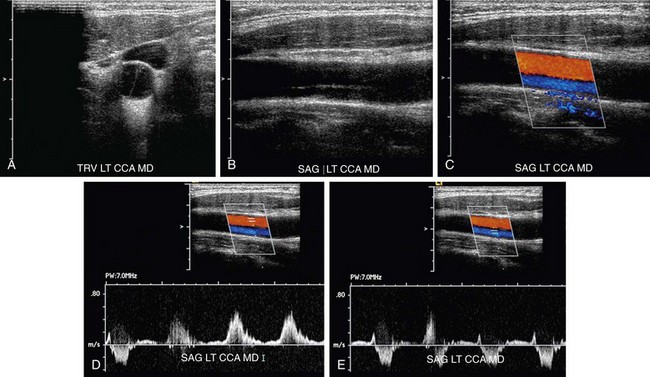
 FIGURE 90-32
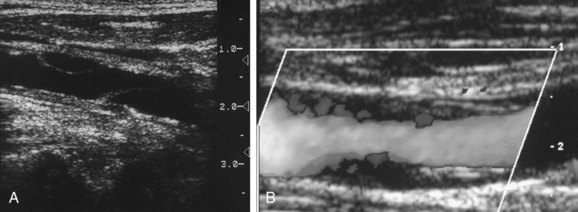
 FIGURE 90-33
Carotid Pseudoaneurysm
Pseudoaneurysms arising from the carotid arteries occur most commonly in the CCAs as a result of inadvertent needle sticks during attempts to place an internal jugular central line. However, pseudoaneurysms may also occur in the setting of other forms of penetrating trauma (including drug abuse), blunt trauma, infection, cystic medial necrosis, invasion of the carotid artery by malignant neoplasm, and after carotid endarterectomy. On gray-scale and color Doppler imaging, pseudoaneurysms are easily recognized as an outpouching from the carotid artery. The degree of color fill-in will depend on the amount of intraluminal thrombus (Fig. 90-34A,B). Spectral Doppler interrogation will reveal a “to-and-fro” pattern within the neck, if it is narrow, with flow toward the pseudoaneurysm in systole and back toward the carotid artery during diastole (Fig. 90-34C). If the neck is wide, the waveform will be randomly irregular and turbulent.
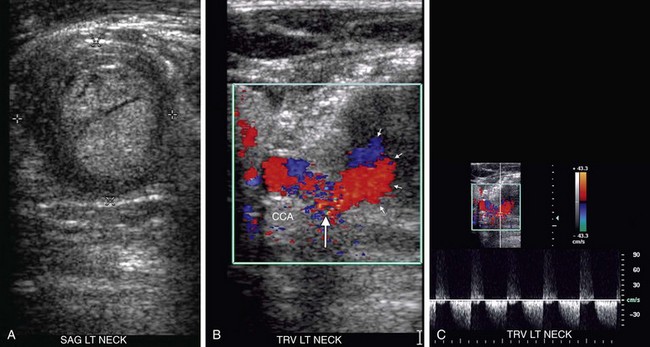
 FIGURE 90-34
Arteriovenous Fistula
Arteriovenous fistulas involving the carotid arteries typically occur secondary to trauma or malignant invasion. Color Doppler interrogation may demonstrate the connection between the artery and the vein (Fig. 90-35A,B). Color aliasing due to high-velocity flow within the arteriovenous fistula may be observed, and a color bruit due to tissue reverberation secondary to the high-velocity flow may be seen in the surrounding soft tissues. Spectral Doppler interrogation will reveal a low-resistance waveform pattern characterized by an increase in both peak systolic and end-diastolic flow in the feeding artery. However, the carotid artery distal to the arteriovenous fistula will have a normal waveform pattern. Pulsatile high-velocity flow will be observed in the draining vein (Fig. 90-35C).
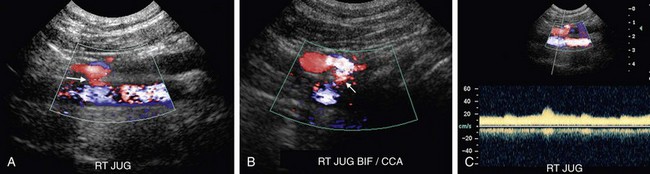
 FIGURE 90-35
Intra-aortic Balloon Pump
Placement of an intra-aortic balloon pump results in a characteristic waveform in the carotid arteries with “double systolic peaks.” Inflation of the balloon during early diastole causes a second peak of forward flow, increasing flow to the coronary arteries—an intended effect of the balloon pump. Deflation of the balloon at the end of diastole results in a short flow reversal (Fig. 90-36). The intra-aortic balloon pump may be set at different ratios. If it is set at a 1 : 1 ratio, the pump is activated during every cardiac cycle. When the pump is set at a 1 : 2 ratio, the balloon pump is triggered to inflate only every second cardiac cycle. Whereas placement of an intra-aortic balloon pump results in an increase of total volume of forward blood flow during systole, PSV is normally decreased. Therefore, carotid stenoses cannot be graded by only using absolute PSV criteria in patients with intra-aortic balloon pumps, and more reliance must be placed on the color Doppler and gray-scale images.
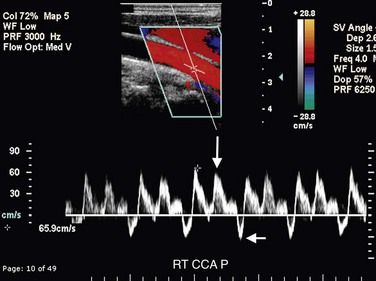
 FIGURE 90-36
THE VERTEBRAL ARTERY
In most patients, only the midportion of the vertebral artery in the neck can be directly examined with Doppler ultrasound. However, the presence of distal or proximal disease can occasionally be deduced by analysis of the spectral waveform of the vertebral artery.30 The normal vertebral artery waveform is symmetric right to left and similar to the waveform of the ICA with a sharp systolic upstroke and continuous forward diastolic flow (see Fig. 90-9).
Asymmetrically increased PSV in a vertebral artery may indicate a proximal stenosis. However, the vertebral arteries are often asymmetric in size, and hence an increase in PSV in one vertebral artery may be simply due to compensatory flow. Increased flow in the vertebral artery may also be noted in the setting of an ipsilateral ICA occlusion. Proximal stenosis of the vertebral artery may also cause a unilateral tardus parvus waveform in the upper to mid vertebral artery. Bilateral tardus parvus waveforms in the vertebral arteries associated with tardus parvus waveforms in the carotid arteries suggest aortic stenosis. A high-resistance waveform pattern with low PSV and absent diastolic flow may indicate a distal stenosis or occlusion of the basilar artery or increased intracranial pressure.30
Subclavian Steal Syndrome
Patients with subclavian steal due to a proximal stenosis in the subclavian artery may present with vertigo, syncope, headaches, transient ischemic attacks, visual disturbances, and hearing loss. However, patients may be completely asymptomatic.31 In patients with complete subclavian steal, reversed flow will be noted in the vertebral artery on Doppler interrogation (Fig. 90-37A). Doppler interrogation of the ipsilateral subclavian artery will demonstrate increased PSV medially and a tardus parvus waveform distally in the axillary and brachial arteries (Fig. 90-37B,C). A “pre-steal” waveform characterized by a sharp midsystolic retraction or deceleration has been described by Kliewer and associates32 (Fig. 90-38). The depth of the midsystolic retraction depends on the severity of the proximal subclavian stenosis. However, all pre-steal waveforms will demonstrate two systolic peaks. The first is narrow with a sharp upstroke and sharply pointed peak. The second systolic peak is usually of lower velocity and broader as well as rounder in contour. With deeper midsystolic retractions, it may be more difficult to differentiate the second peak from diastole. Provocative maneuvers, such as exercising the hand or inflating a blood pressure cuff above systolic arterial pressure until the hand is mildly symptomatic (usually 3 to 5 minutes), then releasing the cuff and immediately re-evaluating the vertebral artery waveform, can convert a pre-steal waveform into a complete steal or deepen the midsystolic retraction (Fig. 90-39).32 Grant and colleagues33 have described a similar waveform pattern in the right common carotid and internal carotid arteries in patients with high-grade stenoses of the innominate artery.
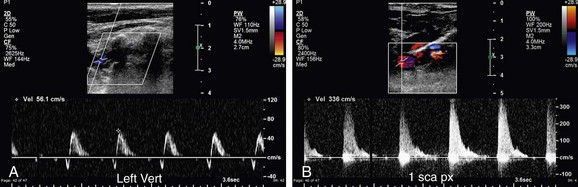
 FIGURE 90-37
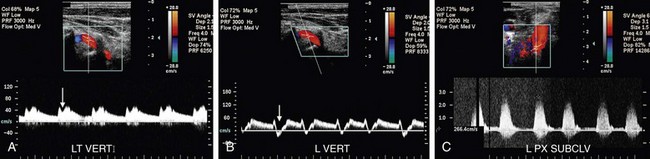
 FIGURE 90-38
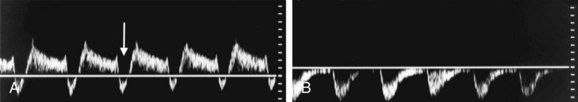
 FIGURE 90-39
CONCLUSION
Doppler interrogation of the carotid arteries is a highly accurate, readily accessible, inexpensive, and noninvasive method of diagnosis of high-grade (>70%) stenosis of the ICA. With careful attention to technique, longitudinal color and power Doppler images provide morphologic information similar to an angiogram unless the image is degraded by shadowing from calcified plaque. Gray-scale and color Doppler images are important for identification of hypoechoic or irregular plaque, which is believed to progress more rapidly and to pose an increased risk of thromboembolic events. Spectral Doppler interrogation provides not only PSV measurements to used grade stenoses of the ICA but also physiologic information that can provide clues to more proximal or distal cardiovascular disease, which in complex cases may be multifactorial (Fig. 90-40). To avoid pitfalls in the estimation of ICA stenoses, PSV criteria should always be correlated with the gray-scale images and analysis of the spectral waveforms. Similarly, an increase in the PSV of the vertebral artery may indicate a proximal stenosis, and changes in the waveform pattern of the vertebral artery may indicate proximal or distal cardiovascular disease, such as a subclavian steal.
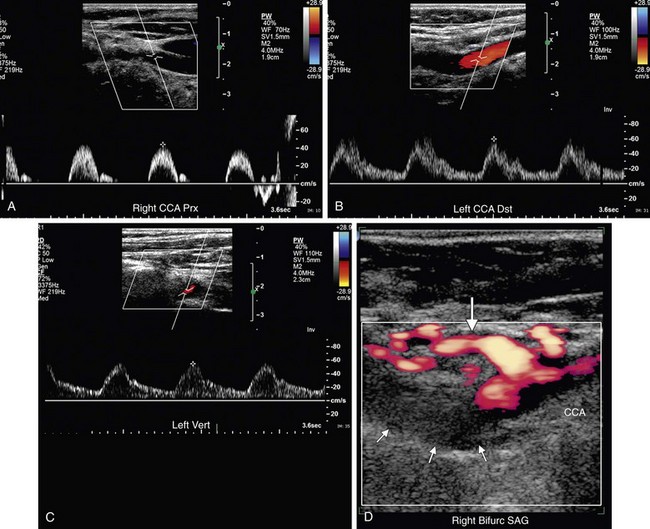
 FIGURE 90-40
KEY POINTS
 Carotid ultrasound examination is highly accurate for detection of stenoses of the ICA of more than 70%.
 The Society of Radiologists in Ultrasound consensus conference13 has proposed that a PSV of more than 230 cm/sec and an ICA/CCA PSV ratio above 4.0 are highly accurate criteria for diagnosis of ICA stenoses of more than 70%.


Bluth EI. Evaluation and characterization of carotid plaque. Semin Ultrasound CT MR. 1997;18:57-65.
Grant EG, Benson CB, Moneta GL, et al. Carotid artery stenosis: gray-scale and Doppler US diagnosis—Society of Radiologists in Ultrasound Consensus Conference. Radiology. 2003;229:340-346.
Horrow MM, Stassi J. Sonography of the vertebral arteries: a window to disease of the proximal great vessels. AJR Am J Roentgenol. 2001;177:53-59.
Polak JF. Carotid ultrasound. Radiol Clin North Am. 2001;39:569-589.
Robbin ML, Lockhart ME. Carotid artery ultrasound interpretation using a pattern recognition approach. Ultrasound Clin. 2006;1:111-131.
Rohren EM, Kliewer MA, Carroll BA, Hertzberg BS. A spectrum of Doppler waveforms in the carotid and vertebral arteries. AJR Am J Roentgenol. 2003;181:1695-1704.
Scoutt LM, Lin FL, Kliewer M. Waveform analysis of the carotid arteries. Ultrasound Clin. 2006;1:133-159.
Zwiebel WJ, Pellerito JS. Tricky and interesting carotid cases. Ultrasound Q. 2005;21:113-122.
Zwiebel WJ, Pellerito JS. Uncommon but important carotid pathology. Ultrasound Q. 2005;21:131-140.
1 American Heart Association. Heart Disease and Stroke Statistics—2005 Update. Dallas, TX: American Heart Association; 2005.
2 Timsit SG, Sacco RL, Mohr JP, et al. Early clinical differentiation of cerebral infarction from severe atherosclerotic stenosis and cardioembolism. Stroke. 1992;23:486-491.
3 North American Symptomatic Carotid Endarterectomy Trial Collaborators. Beneficial effect of carotid endarterectomy in symptomatic patients with high grade stenosis. N Engl J Med. 1991;325:445-453.
4 Barnett H, Taylor D, Eliasaw M, et al. Benefit of carotid endarterectomy in patients with symptomatic moderate or severe stenosis. N Engl J Med. 1998;339:1415-1425.
5 Executive Committee for Asymptomatic Carotid Atherosclerosis Study. Endarterectomy for asymptomatic carotid artery stenosis. JAMA. 1995;273:1421-1428.
6 European Carotid Surgery Trialists’ Collaborative Group. MRC European Carotid Surgery Trial: interim results for symptomatic patients with severe (70-99%) or with mild (0-29%) carotid stenosis. Lancet. 1991;337:1235-1243.
7 Kliewer MA, Freed KS, Hertzberg BS, et al. Temporal artery tap: usefulness and limitations in carotid sonography. Radiology. 1996;201:481-484.
8 Budorick NE, Rojratanakiat W, O’Boyel MK, et al. Digital tapping of the superficial temporal artery: significance on carotid duplex sonography. J Ultrasound Med. 1996;15:459-464.
9 Spencer MP, Reid JM. Quantitation of carotid stenosis with continuous wave (CW) Doppler ultrasound. Stroke. 1979;10:326-330.
10 Moneta GL, Edwards JM, Chitwood RW, et al. Correlation of North American Symptomatic Carotid Endarterectomy Trial (NASCET) angiographic definition of 70% to 99% internal carotid artery stenosis with duplex scanning. J Vasc Surg. 1993;17:152-157.
11 Carpenter JP, Lexa FJ, Davis JT. Determination of duplex Doppler ultrasound criteria appropriate to the North American Symptomatic Carotid Endarterectomy Trial. Stroke. 1996;27:695-699.
12 Grant EG, Duerinckx AJ, El Saden S, et al. Doppler sonographic parameters for grading of carotid stenosis: is there an optimum method for their selection? AJR Am J Roentgenol. 1999;172:1123-1129.
13 Grant EG, Benson CB, Moneta GL, et al. Carotid artery stenosis: gray-scale and Doppler US diagnosis—Society of Radiologists in Ultrasound Consensus Conference. Radiology. 2003;229:340-346.
14 Sabeti S, Schillinger M, Mlekusch W, et al. Quantification of internal carotid artery stenosis with duplex US: comparative analysis of different flow velocity criteria. Radiology. 2004;232:431-439.
15 AbuRahma AF, Richmond BK, Robinson PA, et al. Effect of contralateral severe stenosis or carotid occlusion on duplex criteria of ipsilateral stenoses: comparative study of various duplex parameters. J Vasc Surg. 1995;22:751-762.
16 Busuttil SJ, Franklin DJ, Youkey JR, Elmore JR. Carotid duplex overestimation of stenosis due to severe contralateral disease. Am J Surg. 1996;172:144-148.
17 Polak JF, Shemanski L, O’Leary DH, et al. Hypoechoic plaque at US of the carotid artery: an independent risk factor for incident stroke in adults aged 65 years or older. Cardiovascular Healthy Study. Radiology. 1998;208:649-654.
18 Bluth EI. Evaluation and characterization of carotid plaque. Semin Ultrasound CT MR. 1997;18:57-65.
19 O’Leary DH, Polak JF, Kronmal RA, et al. Carotid artery intima and media thickness as a risk factor for myocardial infarction and stroke in older adults. Cardiovascular Health Study Collaborative Research Group. N Engl J Med. 1999;340:14-22.
20 O’Leary DH, Polak JF. Intima-media thickness: a tool for atherosclerosis imaging and event prediction. Am J Cardiol. 2002;90:18L-21L.
21 Kotval PS. Doppler waveform parvus and tardus: a sign of proximal flow obstruction. J Ultrasound Med. 1989;8:435-440.
22 Rohren EM, Kliewer MA, Carroll BA, Hertzberg BS. A spectrum of Doppler waveforms in the carotid and vertebral Arteries. AJR Am J Roentgenol. 2003;181:1695-1704.
23 O’Boyle MK, Vibhakar N, Chung J, et al. Duplex sonography of the carotid arteries in patients with isolated aortic stenosis: imaging findings and relation to severity of stenosis. AJR Am J Roentgenol. 1996;166:197-202.
24 Kallman CE, Gosink BB, Gardner DJ. Carotid duplex sonography: bisferious pulse contour in patients with aortic valvular disease. AJR Am J Roentgenol. 1991;157:403-407.
25 Cohn KE, Sandler H, Hancock EW. Mechanisms of pulsus alternans. Circulation. 1967;36:372-380.
26 AbuRahma AF, Pollack JA, Robinson PA, Mullins D. The reliability of color duplex ultrasound in diagnosing total carotid artery occlusion. Am J Surg. 1997;174:185-187.
27 Khaw KT, Griffiths PD. Non-invasive imaging of the cervical carotid and vertebral arteries. Imaging. 2001;13:376-390.
28 Gardner DJ, Gosink BB, Kallman CE. Internal carotid artery dissections: duplex US imaging. J Ultrasound Med. 1991;10:607-614.
29 Hennerici M, Steinke W, Rautonberg W. High-resistance Doppler flow pattern in extracranial carotid dissection. Arch Neurol. 1989;46:670-672.
30 Horrow MM, Stassi J. Sonography of the vertebral arteries: a window to disease of the proximal great vessels. AJR Am J Roentgenol. 2001;177:53-59.
31 Gosselin G, Walker PM. Subclavian steal syndrome: existence, clinical features, diagnosis and management. Semin Vasc Surg. 1996;9:93-97.
32 Kliewer MA, Hertzberg BS, Kim DH, et al. Vertebral artery Doppler waveform changes indicating subclavian steal physiology. AJR Am J Roentgenol. 2000;174:815-819.
33 Grant EG, Elsaden S, Modrazo B, et al. Innominate artery occlusive disease: sonographic findings. AJR Am J Roentgenol. 2006;186:394-400.
