Transthoracic echocardiography: An overview
Overview
The first reported use of ultrasound to assess cardiac function was almost 60 years ago.1 Technologic advances have now placed echocardiography as the intensivist’s only option for bedside visualization of cardiac anatomy and function in real time.
Although echocardiography began as the domain of the specialist cardiologist, a number of factors have contributed to increasing interest and training among critical care physicians. These include, a move away from invasive hemodynamic monitoring (such as the pulmonary artery catheter); increasing clinical and research echocardiography experience in the critically ill; availability of smaller, less expensive, better-quality ultrasound machines; as well as greater access to education and training in clinical ultrasound.2
Technical aspects
Equipment
Echocardiography typically uses phased-array transducers. The latter have a small footprint and consist of multiple miniature ultrasonic elements capable of being pulsed independently. Elements are activated with phase differences to generate a high-frequency (high-resolution) beam that can be focused and steered electronically. The tissue to be imaged is interrogated by sweeping the transducer around, something like using a searchlight. The resultant image is reconstructed from multiple beams and is represented by an expanding field of view that is also typical of a curvilinear transducer (see Chapter 1).
Radiologic and cardiologic laboratories tend to be well equipped with state-of-the-art echocardiography machines. These are well suited to comprehensive examination performed by experienced technicians in nonemergent circumstances.3 The critical care environment, on the other hand, lends itself to the application of compact, robust equipment. Image quality is balanced against the desirability of a small physical profile when attempting to access critically ill patients during concurrent resuscitation. Compact devices capable of focused echocardiography complement other hemodynamic and physical examination findings.
Knobology
Modern echocardiography machines have a dazzling array of knobs and buttons. Familiarity with your machine’s user interface is essential to manipulate and optimize image quality. The knowledge required to optimize images via the machine’s user interface has become known as knobology (see Chapter 1).
Knobs are generally clustered according to function and are generally grouped into those controlling power, gain, time gain compensation (TGC), dynamic range, depth, zoom/magnification, freeze, calculations, alphanumeric, and save/print functions. Used appropriately, device presets usually minimize the amount of adjustment required by the user.
Image optimization
When optimizing an image, it is generally advisable to adjust variables in the following order:
• Depth: Always start deeper than the area of interest to ensure that deeper structures and pathology may be appreciated.
• Focus: Adjust so that area of highest lateral resolution coincides with area of interest. Modern machines often have multiple focal zones. Beware: activation of more focal zones results in slower frame rates and loss of temporal resolution.
• TGC: Compensates for attenuation of ultrasound passing deeper into tissues. The resultant image should demonstrate a consistent level of ultrasonic intensity. Interchangeable terminology for TGC includes distance gain compensation (DGC) and spatial time compensation (STC).
• Zoom: May be used to magnify point of interest.
• Gain: Optimize to allow visualization of most points of interest. High gain can obscure detail.
• Dynamic range (contrast): High “dynamic range” translates to low “contrast.”
Biological signals
Echocardiographic images must be accompanied with an electrocardiographic (ECG) signal on the same time axis. This is mandatory to allow timing of images according to the cardiac cycle (systole/diastole).4 Some echocardiography machines will also allow slaving of respiratory phase data from the ventilator or monitoring equipment. Respiratory phase may also be determined from thoracic electrical bioimpedence (from ECG leads). Incorporation of respiratory phase data allows appreciation and quantification of heart –lung interactions.
Echocardiographic modalities
Two-dimensional echocardiography
Although both motion mode (M-mode) and Doppler modalities historically preceded 2D echocardiography, 2D will be detailed first because of the practicality that M-mode and Doppler modalities are now mostly used with 2D guidance. Cross-sectional ultrasonographic “slices” through the beating heart can be visualized in real time or recorded (as “clips”) for subsequent review and analysis. Nomenclature and image orientation standards in TTE allow for description of images based upon transducer location and orientation to the heart (plane).5
Transducer location
When placed in the suprasternal notch, this is referred to as the suprasternal location. When located near the midline of the body and beneath the lowest ribs, this is referred to as the subcostal location. When located over the apex impulse, this is the apical location. The area bound by the left clavicle (superiorly), sternum, and apical region (inferiorly) is referred to as the parasternal location. By default, apical and parasternal locations are assumed to be left sided. In unusual circumstances, when right-sided imaging is indicated, the right apical and right parasternal locations may be required (Figures 26-1 to 26-4).
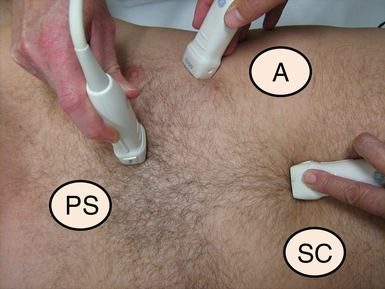
Figure 26-1 Approximate transducer placement for common windows. The patient is supine, which is typical in critical care. The patient’s left side is toward the top of the image. A, Apical position; PS, parasternal position; SC, subcostal position.
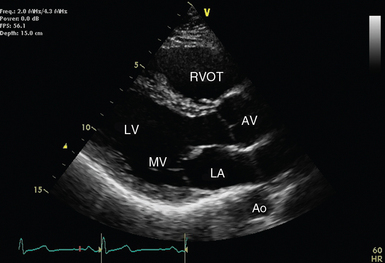
Figure 26-2 Parasternal long-axis view with relevant structures labeled. The left ventricle should appear almost horizontal, and the apex is not displayed. Ao, Descending aorta; AV, aortic valve; LA, left atrium; LV, left ventricle; MV, mitral valve; RVOT, right ventricular outflow tract.
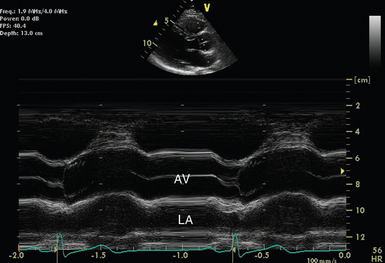
Figure 26-3 M-mode across the aortic valve in the parasternal long-axis view. The aortic valve (AV) is labeled during leaflet apposition in ventricular diastole. LA indicates the left atrium. It can be seen that it is potentially difficult to orientate the M-mode cursor squarely across the structure of interest, and as a result, measurements may not be representative.
Imaging planes
Rather than applying classic anatomic planes (sagittal, transverse, and coronal), 2D echocardiographic planes are based upon cardiac orientation. The long-axis plane transects the heart perpendicular to the ventral body surface and parallel to the long axis of the heart. The short-axis plane is perpendicular to the ventral body surface and long axis of the heart. The plane that transects the heart approximately parallel to the ventral body surface is referred to as the four-chamber plane (see Figures 26-1 to 26-4). With experience, the echocardiographer can imagine 3D cardiac anatomy based upon 2D scans.
M-mode echocardiography
Rather than displaying a 2D representation of the heart, M-mode displays the depth and intensity of ultrasound reflection in a single dimension against time. Using modern equipment, M-mode is acquired by swinging the M-mode cursor across the structure(s) of interest visualized in a 2D image (see Figure 26-3). It offers excellent temporal resolution because of a high pulse rate and may complement 2D images. The major disadvantage arises from the challenge of aligning the M-mode cursor perpendicularly across the structure of interest to take accurate measurements.6
Doppler echocardiography
Doppler echocardiography7 is predominantly used to determine the velocity (speed and direction) of blood flow within the heart and blood vessels. It is based upon the Doppler principle, which states that the frequency of ultrasound is altered by reflection from a moving object, such as red blood cells. The magnitude of frequency change (Doppler shift) is proportional to the speed that the object is moving relative to the probe. The polarity of the shift is dependent on the direction relative to the probe (toward = positive; away = negative). When solved for the velocity (V) of the moving object, the Doppler equation can be represented as:
Pulsed wave doppler
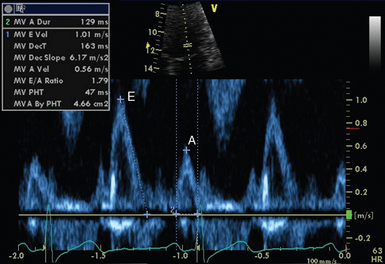
Pulsed wave Doppler (PWD) measures flow velocity at a targeted site (sample volume; Figure 26-5). It achieves this by transmitting ultrasound in pulses and then “listening” for reflected signals returning within the defined time period. A longer delay is expected when the sample volume is placed further from the probe. This technique cannot accurately measure velocities above a certain threshold (Nyquist limit) because of a phenomenon called aliasing. A number of interventions can be applied to prevent aliasing. These include
Continuous wave doppler
Continuous wave Doppler (CWD) continuously sends and receives ultrasound. The resultant data are displayed as a spectral envelope of velocities along the line of the ultrasound beam. The highest velocity along this path defines the outer edge of the tracing and blurs out lower velocity signals. Very high velocities can be measured this way, but the site of origin cannot be localized along the path of the beam. Although corrections may be required for blood viscosity (e.g., anemia with hemoglobin (Hb) <8.0g/dL) or high proximal velocity (e.g., high-output state, serial stenosis), peak velocities may be converted to pressure gradients by application of the simplified Bernoulli equation7:

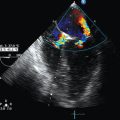
Color flow doppler
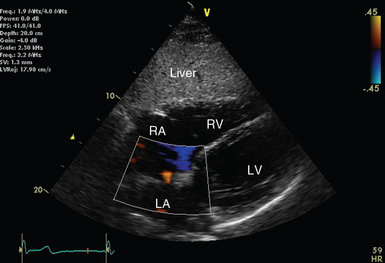
Color flow Doppler (Figure 26-6) superimposes flow velocity estimates from multiple gates or regions of interest upon 2D images. It achieves this with PWD technology and is similarly prone to aliasing.
Tissue doppler
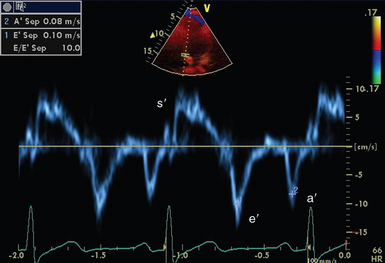
Tissue Doppler (Figure 26-7) is available on many modern ultrasound machines. Cardiac tissue velocities can be determined by application of the Doppler principle. Removal of the ultrasonic filters required for measuring red blood cell velocities, allows analysis of the low-velocity, high-amplitude signal reflected from the myocardium. Analysis can be performed in either pulsed wave or color mode.
Transthoracic echocardiography examination
Critical care echocardiography is often necessarily focused upon answering pertinent, time-sensitive clinical questions. It is frequently used as an adjunct to the physical examination. In this regard, the ICU and emergency department have similar requirements. Indications for focused TTE may include cardiac trauma, cardiac arrest, hypotension/shock, dyspnea/shortness of breath, and chest pain.8 A range of focused hemodynamic protocols exist and are advocated by respective societies and organizations.
Standard transducer positions
In critical care, both comprehensive and focused echocardiographic protocols tend to rely upon three main transducer positions or windows. These are the parasternal, apical, and subcostal positions (see Figure 26-1). The suprasternal view is used less commonly. Data must be interpreted as an integration of available views and clinical information. Reliance of information from a single view should be avoided because it may lead to erroneous conclusions.
The parasternal position.
This is often the starting point for routine echocardiography. The probe is placed in the fourth or fifth intercostal space, about 2 inches to the left of the sternum (see Figure 26-1, parasternal [PS] position). The best windows are usually obtained with the patient on his or her left side. This is not always practical in critical care.
Parasternal long-axis view.
Starting in the parasternal position, the transducer marker should point toward the right shoulder. The resultant view allows 2D (see Figure 26-2) and M-mode evaluation of structures, including the left ventricle, outflow tract, and aortic root. Color Doppler is usually also applied to the aortic and mitral valves. Zoomed views of the aortic and mitral valves may also allow more detailed structural and functional evaluation. The demonstration of fluid on the cardiac side of the descending aorta helps distinguish pericardial from pleural fluid.
Parasternal short-axis views.
• Aortic valve: The normal tricuspid aortic valve looks like a “Mercedes Benz” symbol. This view also potentially visualizes the pulmonic and tricuspid valves. Right ventricular systolic pressure (RVSP) may be estimated by applying the simplified Bernoulli equation to any tricuspid regurgitation that might be present.
• Mitral valve: The valve usually looks like a fish’s mouth. Planimetry and color flow Doppler aid evaluation of structure and function.
• Midpapillary view: Cross-sectional view at the mid–left ventricular level. Like comparable transesophageal views, this may help evaluation left ventricular filling and function as well as investigating coronary vascular territories.
• Apical view: Left ventricular apex. This view is essential to make a complete and comprehensive assessment of left ventricular segmental function (regional wall motion).
• It may be necessary to move the transducer up and/or down an interspace to optimize views throughout the length of the heart. All segments of the left ventricle should be visualized to allow evaluation for nonuniform pathology and regional wall motion abnormalities.
The apical position.
Following from the parasternal position, the transducer is moved over the apex beat (point of maximal impulse). With minor adjustment, including rotation, this position allows acquisition of numerous views including the apical four-chamber, five-chamber, two-chamber, and long-axis (three-chamber) views.
Apical four-chamber view.
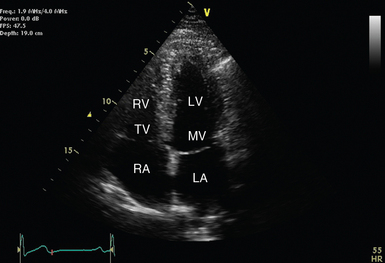
Over the apex beat, the transducer marker is turned to the patient’s left side (see Figure 26-1A). Transducer position should be adjusted to demonstrate the four major chambers of the heart (left atrium, left ventricle, right atrium, and right ventricle). The septum should appear vertical, near the center of the image (see Figure 26-4). The left ventricular apex should also be clearly demonstrated (not tangential or rounded).
• Left ventricular function: Left ventricular volumes, and therefore ejection fraction can be estimated by tracing the ventricular cavity (Simpson’s method). Geometric assumptions are improved if the apical two-chamber view is also measured and results are averaged (biplane method).6
• Right ventricular function: Right ventricular geometry is complex (cresenteric) and difficult to quantify in 2D echocardiography. Qualitatively, the right ventricle should appear approximately two-thirds the size of the left ventricle. Tricuspid annular planar systolic excursion (TAPSE) gives an indication of normal right ventricular systolic function.
• Atrial anatomy: Left and right atrial size can be measured just before atrioventricular valve opening.
• Valvular function: Tricuspid and mitral valves.
• Diastolic function: Mitral valve inflow interrogation by spectral (see Figure 26-5) and color Doppler forms the cornerstone of evaluation of left ventricular diastolic function.9 Evaluation can be supplemented by tissue Doppler imaging (see Figure 26-7) of the mitral valve annulus, which holds prognostic significance in a range of cardiac pathology, including septic shock.10 Pulmonary venous flows may also be acquired from the apical position.
Apical five-chamber view.
From the apical four-chamber view, the transducer is angled with the echocardiographer’s hand moving closer to the patient. This usually brings more anterior structures, including the left ventricular outflow, aortic valve, and proximal aorta, into view. This allows Doppler interrogation of the aortic valve and both stenosis and regurgitation can usually be graded.7 Dynamic outflow tract obstruction may also generate a characteristic pattern. When paired with left ventricular outflow tract diameter (best measured from zoomed parasternal long-axis view), stroke volume and cardiac output can be estimated.
The subcostal position.
The transducer is placed under the xiphoid process and angled up toward the heart (see Figure 26-1, subcostal [SC]). For best imaging, the patient is examined supine. Use of pillows to flex the head and neck or hips relieves anterior abdominal wall muscle tension. Increasing the depth of the image is usually also required.
Subcostal long axis.
Starting with the transducer marker to the patient’s left, the former is manipulated until an image resembling the apical four-chamber view is achieved. From this position, the ultrasound beam must traverse the liver before reaching the right then left ventricle. The alignment of the ultrasound beam roughly perpendicular to the interatrial septum also makes this view useful for applying color flow Doppler to assess for atrial septal defects or patent foramen ovale (see Figure 26-6).
Suprasternal position.
The suprasternal window is not routinely performed in critical care echocardiography. The probe is placed in the suprasternal notch and tilted down toward the heart (see Chapter 1). Access to this area of a mechanically ventilated patient can be challenging but is potentially made easier by removing the pillow, tilting the patient’s chin up and to the left.
Indications
Evidence-based practice defends the application of TTE in a wide range of clinical scenarios. The strength of evidence supporting the use of TTE in a range of scenarios (indications) has recently been reviewed by the American College of Cardiology Foundation (ACCF), in partnership with the American Society of Echocardiography (ASE) and key specialty and subspecialty societies.11 Indications were derived from common applications or anticipated uses; these were then arbitrarily classified into appropriate, unclear, or inappropriate indications based on the available literature. Indications that relate to acute care are presented in Box 26-1.
The echocardiographic report
The echocardiographic examination is not complete until reported. Recommendations are available for reporting comprehensive adult transthoracic echocardiography, but they are deliberately not prescriptive and allow for differences between laboratories.12 Not all of this information may be available (or relevant) at the time of performing a critical care echocardiography. Box 26-2 offers a range of suggestions for components of the echocardiographic report.
Pearls and highlights
• The move away from invasive hemodynamic monitoring, as well as increased availability of smaller, less expensive ultrasound machines has propelled echocardiography into mainstream critical care.
• Immediate bedside availability and a detailed appreciation of critical illness, including relevant pharmacology and physiology, place the critical care physician in a strong position to acquire and interpret echocardiographic data.
• The acquisition of timely, accurate echocardiographic data mandates an understanding of pertinent technical aspects, including basic ultrasound physics, transducer handling, and image optimization, as well as 3D cardiac anatomy.
References
1. Edler, I, Hertz, CH, The use of ultrasonic reflectoscope for the continuous recording of the movements of heart walls. 1954. Clin Physiol Funct Imaging 2004;24(3):118–136.
2. Vieillard-Baron, A, Slama, M, Cholley, B, et al, Echocardiography in the intensive care unit: from evolution to revolution. Intensive Care Med. 2008;34(2):243–249.
3. Seward, JB, Douglas, PS, Erbel, R, et al, Hand-carried cardiac ultrasound (HCU) device: recommendations regarding new technology. A report from the Echocardiography Task Force on New Technology of the Nomenclature and Standards Committee of the American Society of Echocardiography. J Am Soc Echocardiogr. 2002;15(4):369–373.
4. Bendjelid, K, Glas, KE, Shanewise, JS, ECG monitoring is essential for echocardiographic analysis. Anesth Analg 2005;100(1):294–295. [author reply 295-296].
5. Henry, WL, DeMaria, A, Gramiak, R, et al, Report of the American Society of Echocardiography Committee on Nomenclature and Standards in Two-dimensional Echocardiography. Circulation 1980;62(2):212–217.
6. Lang, RM, Bierig, M, Devereux, RB, et al, Recommendations for chamber quantification: a report from the American Society of Echocardiography’s Guidelines and Standards Committee and the Chamber Quantification Writing Group, developed in conjunction with the European Association of Echocardiography, a branch of the European Society of Cardiology. J Am Soc Echocardiogr. 2005;18(12):1440–1463.
7. Quinones, MA, Otto, CM, Stoddard, M, et al, Recommendations for quantification of Doppler echocardiography: a report from the Doppler Quantification Task Force of the Nomenclature and Standards Committee of the American Society of Echocardiography. J Am Soc Echocardiogr. 2002;15(2):167–184.
8. Labovitz, AJ, Noble, VE, Bierig, M, et al, Focused cardiac ultrasound in the emergent setting: a consensus statement of the American Society of Echocardiography and American College of Emergency Physicians. J Am Soc Echocardiogr. 2010;23(12):1225–1230.
9. Nagueh, SF, Appleton, CP, Gillebert, TC, et al, Recommendations for the evaluation of left ventricular diastolic function by echocardiography. J Am Soc Echocardiogr 2009;22(2):107–133.
10. Sturgess, DJ, Marwick, TH, Joyce, C, et al, Prediction of hospital outcome in septic shock: a prospective comparison of tissue Doppler and cardiac biomarkers. Critical Care. 2010;14(2):R44.
11. American College of Cardiology Foundation Appropriate Use Criteria Task Force, American Society of Echocardiography, American Heart Association, Douglas, PS, et al, ACCF/ASE/AHA/ASNC/HFSA/HRS/SCAI/SCCM/SCCT/SCMR 2011 Appropriate Use Criteria for EchocardiographyA Report of the American College of Cardiology Foundation Appropriate Use Criteria Task Force, American Society of Echocardiography, American Heart Association, American Society of Nuclear Cardiology, Heart Failure Society of America, Heart Rhythm Society, Society for Cardiovascular Angiography and Interventions, Society of Critical Care Medicine, Society of Cardiovascular Computed Tomography, and Society for Cardiovascular Magnetic Resonance Endorsed by the American College of Chest Physicians. J Am Coll Cardiol 2011;57(9):1126–1166.
12. Gardin, JM, Adams, DB, Douglas, PS, et al, Recommendations for a standardized report for adult transthoracic echocardiography: a report from the American Society of Echocardiography’s Nomenclature and Standards Committee and Task Force for a Standardized Echocardiography Report. J Am Soc Echocardiogr. 2002;15(3):275–290.