Transcranial doppler ultrasound in neurocritical care
Overview
In 1982, Aaslid et al1 authored a paper with the title “Noninvasive transcranial Doppler ultrasound recording of flow velocity in basal cerebral arteries,” describing the successful insonation and blood flow velocity (FV) measurement of the basal cerebral arteries with a range-gated Doppler transducer. These authors located an “ultrasonic window” above the zygomatic arch and 1 to 5 cm anterior to the ear, through which a 2-MHz ultrasonic pulse could be emitted and recorded. The velocity and direction of blood flow were recorded as a spectral display as recorded by the ultrasound transducer. Measurement of FV as well as direction of flow during unilateral common carotid artery (CCA) compression enabled Aaslid et al1 to describe collateral flow as well as “steal” dynamics in real time by using transcranial Doppler (TCD). They noted that compression of the CCA resulted in decreased velocity in the ipsilateral middle cerebral artery (MCA), reversal of flow or “steal” in the ipsilateral terminal internal carotid artery, as well as increase in velocity in both the ipsilateral anterior and posterior cerebral arteries, suggesting a contribution to collateral flow through the circle of Willis.1
Basic principles
TCD technology is based upon the Doppler effect principle, in which the ultrasound transducer emits a frequency, fo, and this frequency is reflected back to the probe as fe. The difference between the emitted and received frequencies, or the Doppler shift, fd, can be calculated as fd = fe − fo (see Chapter 1). Pulsed wave Doppler refers to an ultrasound transducer that emits and receives the reflected ultrasound pulse. By using a pulsed wave Doppler, TCD can be performed at variable depths to follow the course of cerebral blood vessels. The frequency refers to the number of cycles a sound wave goes through per second. A higher frequency is used to insonate more peripheral vessels, and a lower frequency is able to insonate deep cerebral vessels. The sample volume size refers to the width of the area being insonated and is measured in millimeters (e.g., a sample volume size of 2 mm will give a more precisely localized signal compared with a sample volume size of 6 mm). The intensity or power of the ultrasound wave refers to the energy emitted through the tissue being insonated. This energy is absorbed by the tissue and converted mainly to heat. The U.S. Food and Drug Administration (FDA) regulates the amount of energy able to be transmitted by ultrasound equipment to ensure patient safety (ALARA [As Low As Reasonably Achievable] principle). Ultrasound over the eye or under the chin must be used at a lower power because these locations are not covered by bone, thus exposed to greater intensity. Attenuation refers to the decrease in intensity as the ultrasound wave passes through tissue and is higher for muscle and bone and lower for fluid-filled vessels. Based on attenuation, the reflected wave will be weaker for deeper vessels.2
Acoustic windows
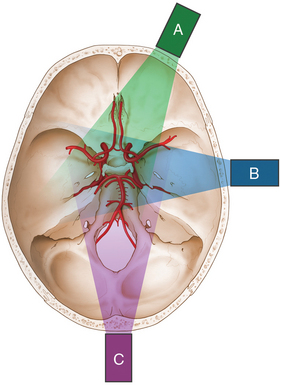
Acoustic windows are naturally occurring areas of cerebral bone thin enough to allow transmission of ultrasound waves. There are three commonly used acoustic windows: transtemporal, transorbital, and transforaminal. Up to 10% of people may not have adequate acoustic windows. The transtemporal window allows insonation of the anterior, middle, and posterior cerebral arteries; the transorbital window is used to insonate the ophthalmic artery as well as the cavernous portion of the internal carotid artery; and the transforaminal window allows insonation of the vertebral and basilar arteries (Figure 2-1).
Transcranial doppler interpretation
Waveform morphology
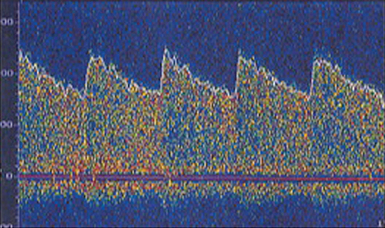
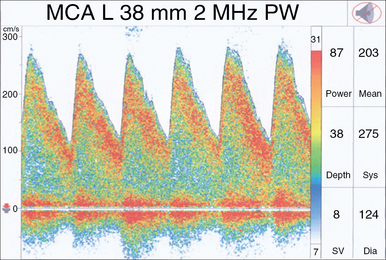
The waveform recorded by TCD reflects both systole and diastole, with systole represented by the upstroke and peak of the wave, and diastole represented by the decelerating downslope of the wave (Figure 2-2). The morphology of the waveform demonstrates valuable information regarding cerebral blood flow, with a normal systolic upstroke being a quick upstroke climaxing into a peak. An upstroke that is slow and dull could be representing a proximal obstruction or focal stenosis when seen in a single vessel or may be an indication of a global low-flow state resulting from cardiac dysfunction when a widespread finding. Hassler et al3 described TCD waveform changes in the setting of intracranial hypertension. As diastolic pressure rises to approach the intracranial pressure (ICP), end-diastolic flow decreases and results in three stages of waveform changes: initially a decrease, followed by cessation, and lastly a reversal of flow (Figure 2-3). This reversal is seen in severe intracranial hypertension near cerebral circulatory arrest (see Chapter 4), when the diastolic pressure rises higher than the ICP and has been coined “diastolic flow obliteration.”3
The pulsatility index
Absolute pulsatility is difficult to assess by Doppler ultrasound because the amplitude of the pulsatile blood flow velocity is dependent on the angle of insonation. Gosling and King4 proposed an angle-independent index, known as the Gosling index of pulsatility (PI), and defined it as the difference of peak systolic and lowest diastolic flow velocities referenced to time-averaged flow velocity ([FVsys − FVdia]/FV).4 A number of earlier studies linked the PI with distal cerebrovascular resistance (CVR), suggesting an increasing index as a reflection of an increasing resistance and vice versa.5,6 However, several settings have been reported where the link between PI and CVR was either weak or in the reverse direction than expected; giving rise to the suspicion that the PI is not a pure measure of downstream resistance.7,8 Czosnyka et al8 studied animal models in which CVR was manipulated in a controlled manner under different physiologic conditions, such as an increase in arterial carbon dioxide (CO2) tension, or a decrease in cerebral perfusion pressure (CPP) in autoregulating animals. Microvascular resistance was quantified as CPP divided by laser Doppler cortical flux. During the hypercapnic challenge, a significant, positive correlation was found between cortical resistance and Doppler flow pulsatility. On the contrary, in all groups in which cerebral perfusion pressure was reduced, a negative correlation between PI and cerebrovascular resistance was shown. These authors concluded that the PI cannot be interpreted simply as an index of CVR. The decrease in CVR when CPP decreases is followed by an increase in pulsatility, likely resulting from combined changes in vascular resistance and compliance of large cerebral arteries. The PI increases when cerebral autoregulatory reserve is compromised by a decrease in CPP; when CPP is stable, changes in PI may reflect changes in CVR.8
More recently, de Riva et al9 hypothesized that the PI is a complex function of various hemodynamic factors and explored the relationship PI-CVR by retrospectively comparing clinical data of two different physiologic situations where PI increases. The first one was intracranial hypertension, represented by ICP plateau waves (where a vasodilatory cascade is implicated); the second group involved patients submitted to a mild hypocapnic challenge, which is known to increase CVR. de Riva et al further sought to compare measured PI in both groups with a mathematical formula, expressing PI as a function of cerebrovascular impedance. Analysis of their model suggested that the PI is determined by the interplay of the value of CPP, pulsatility of arterial blood pressure (ABP), CVR, compliance of the cerebral arterial bed, and heart rate.9
Assessment of intracranial pressure
An accurate, precise and noninvasive alternative for measurement and monitoring of ICP/CPP remains a “holy grail” in neurointensive care. TCD FVs and the PI have been considered as potential surrogate candidates with variable success. Bellner et al10 reported on a cohort of 81 adult severe traumatic brain injury (TBI) and subarachnoid hemorrhage (SAH) patients, showing a strong correlation between PI and ICP (r = 0.938, P < .0001) and a sensitivity and specificity of 0.89 and 0.92, respectively, to detect ICP higher than 20 mm Hg. The excitement from this report has since been moderated in view of more recent studies demonstrating poor correlation between PI-based estimations of ICP and invasive ICP measurements; the large prediction confidence intervals and the poor sensitivity has lead authors to discourage the use of ICP-calculating formulas that are based solely on the PI.11,12 Zweifel et al12 analyzed prospectively collected TCD data from severe TBI patients, finding that if the PI is less than or equal to 1, there is a chance of about 15% that the CPP is less than 60 mm Hg; with the PI less than or equal to 0.8, there is a likelihood of about 10% that CPP is less than 60 mm Hg. On the other hand, if the PI is greater than or equal to 2.2, the probability of low CPP (less than 60 mm Hg) is about 50%, and for PI greater than or equal to 3, the probability increases to 80%.12
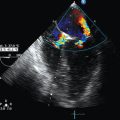
Notwithstanding the above caveats, TCD FVs and PI can still serve as noninvasive screening tests for compromised intracranial compliance and potentially inadequate cerebral perfusion for selected patients. This diagnostic capability can be further enhanced by the application of an advanced TCD technique named transcranial color-coded duplex (Figure 2 E-1), which is analyzed at the end of this chapter. In a clinical and physiologic setting, serial testing and correct interpretation of waveforms and values becomes essential. Recently, Bouzat et al13 showed that FV/PI measurements have prognostic value for secondary neurologic deterioration in patients with mild-to-moderate TBI. Using receiver-operating characteristic analysis, they found the best threshold limits to be 25 cm/sec (sensitivity, 92%; specificity, 76%; area under curve, 0.93) for diastolic cerebral blood flow velocity and 1.25 (sensitivity, 90%; specificity, 91%; area under curve, 0.95) for PI.13 Cerebral blood flow and blood flow velocity, oxygenation, and metabolism changes have been described after decompressive craniectomy (DC).14 TCD-derived variables can be useful in monitoring patients considered for or post-DC; studies have shown a correlation between decreasing ICP postdecompression and trends toward increasing FVs and decreasing PIs.14–17 As noted earlier, individual patient clinical and physiologic characteristics need to be taken into account to make sensible, context-relevant use of TCD measurements in these scenarios.
Figure 2 E-1 Transcranial color-coded duplex views. Depiction of mildly increased pulsatility index (PI) values in the right middle cerebral artery (MCA) of a patient with moderate traumatic brain injury and concomitant brain edema (left). Visualization of the circle of Willis, with depiction of mildly increased PI values in the right MCA of a patient after stroke (right). (Courtesy Dr. J. Poularas.)
Turbulence
Laminar blood flow in a normal vessel proceeds smoothly in layers parallel to the vessel wall, with blood closest to the wall flowing slower than the blood in the center of the lumen. High-flow states or stenosis of the vessel can disrupt this orderly parallel flow and cause turbulence. Turbulence can be visualized on TCD recording as a disorganized bright signal near the baseline and can also be heard as a “musical murmur.” Turbulence on TCD in vessels with moderate stenosis has been demonstrated to be maximally recorded as between 55% to 75% of the vessel lumen in MCA recordings.18
Microemboli monitoring
TCD is able to detect the passage of small emboli, either gaseous or solid, as they traverse the field of detection in real time. The presence and frequency of these microembolic signals (MESs) has been studied extensively in various conditions to predict subsequent embolic stroke risk. The conditions studied include carotid artery stenosis, intracranial stenosis, aortic arch plaques, patent foramen ovale, prosthetic heart valves, myocardial infarction, valvular stenosis, and atrial fibrillation. In 1998, the International Consensus Group on Microembolus Detection published a guideline outlining standardized detection parameters, applications for use, and limitations of microemboli TCD monitoring. The detection of MESs has been correlated with an increased risk of stroke in patients with symptomatic carotid stenosis, acute stroke, and postoperatively after carotid endarterectomy. In addition to MES detection of solid emboli representing clotting and by intravenous injection of agitated saline during TCD monitoring, the presence of MESs can identify a right-to-left cardiac shunt. Although more evidence is needed to determine exact stroke risk based on MESs, the presence and frequency of MESs can be a useful piece of information for the clinician in gauging stroke risk as well as therapeutic response to antithrombotic therapy.19
Transcranial doppler applications
Based on the above principles and interpretation of TCD, there are numerous applications that are clinically relevant and will be discussed further in upcoming chapters. These applications include detection of vasospasm in patients with SAH, screening of children with sickle cell disease for vasculopathy, vessel narrowing/occlusion, identification of collateral flow, arteriovenous malformation dynamics, cavernous carotid fistula and vertebrobasilar insufficiency detection, identification of cerebral circulatory arrest, microemboli monitoring, identification of pulmonary arteriovenous malformation using bubble study, as well as vasomotor reserve determination using techniques such as breathholding or CO2 challenge. We will here focus on acute ischemic stroke evaluation, sickle cell disease, and blood flow autoregulation. A summary of TCD applications is provided in Box 2-1.
Acute ischemic stroke evaluation
TCD can be used in the evaluation of acute ischemic stroke patients to guide therapy through real-time evaluation of vessel patency, stenosis, presence of microembolism, as well as presence of collateral flow patterns. A grading scale based on TCD waveform morphology, the thrombolysis in brain infarction (TIBI) scale, has been established as an accurate real-time measurement system of flow characteristics of occluded and stenotic vessels at the time of infarction as well as during thrombolysis, which has been validated to provide accurate assessment of stroke severity and prediction of vessel recanalization and subsequent clinical course.20 The presence or absence of collateral flow in the setting of acute ischemic infarct can also aid the clinician in therapeutic decisions; TCD can determine the presence and direction of collateral flow, in addition to the site and extent of vascular occlusion and/or stenosis. As discussed in the prior paragraph, the presence of microembolic signals can aid in identifying an embolic source of ischemic stroke and guide management, as in the Clopidogrel and Aspirin for Reduction of Emboli in Symptomatic Carotid Stenosis (CARESS) trial, showing that in patients with symptomatic carotid stenosis of greater than 50%, the combination of clopidogrel and aspirin was more effective than aspirin alone in decreasing asymptomatic embolization as imaged with TCD.21
Sickle cell disease
TCD has been established as an accurate tool in predicting stroke risk in pediatric patients with sickle cell disease. Sickled erythrocytes set off a cascade in which inflammatory mediators are triggered, leading to leukocyte adherence, endothelial dysfunction, and microvascular occlusions. In 1992, Adams et al22 demonstrated the ability of TCD to identify pediatric sickle cell disease patients with high risk of cerebral infarction. In this study, patients with mean FV greater than 170 cm/sec had a significantly higher risk of stroke during the average follow-up of 29 months, despite otherwise similar clinical and hematologic characteristics. Subsequently, the same investigators studied the effect of blood transfusion on prevention of first stroke in pediatric patients with high risk of stroke based on TCD mean FVs of greater than 200 cm/sec, in either the intracranial ICA or MCA (Figure 2-4). These high-risk patients were randomized to receive blood transfusion or standard care without transfusion. The group receiving blood transfusions had a 92% reduction in stroke rate compared with standard care, thus prompting the study to be stopped early (see Chapter 5).22
Cerebral blood flow autoregulation
Blood flow pressure autoregulation refers to a vascular homeostatic mechanism responsible for maintaining stable cerebral blood flow over a range of perfusing pressures. This vascular pressure reactivity is considered a major innate, protective mechanism of the cerebral arteriolar bed and has been shown to be disturbed in various types of acute brain injury and to correlate with secondary neurologic insults. In clinical practice, TCD is commonly used for dynamic and static measurements of autoregulation.23 Measurement of static autoregulation requires an artificial abrupt change in arterial ABP/CPP; commonly used methods include the transient hyperemic response test (THRT), the leg-cuff deflation test, and the use of vasoactive drugs. The potential interference of such a stimulus with measurement is not fully known, and vasoactive drugs may, in addition, influence cerebral metabolism (especially in head-injured patients, in whom the blood-brain barrier is potentially damaged), leading to simultaneous changes in cerebral metabolic rate and pressure reactivity.24 Dynamic autoregulation monitoring refers to real-time continuous correlation of spontaneous fluctuations of cerebral blood flow or surrogates and CPP. In 1996, Czosnyka et al25 reported a new method for the continuous assessment of autoregulatory reserve. This group evaluated spontaneous slow changes in CPP that occur during periods lasting between approximately 20 seconds and 3 minutes, and also the corresponding response of the MCA FV; the correlation coefficient indices between mean flow velocity (FVm) and CPP (Mx) and between systolic flow velocity (FVsys) and CPP (Sx) were calculated and shown to have promising potential for determination of outcome after head injury.25 Several studies have supported a strong relationship between the state of autoregulation and outcome after severe head injury. Recently, the Cambridge group26 demonstrated that different components of FV (mean, peak systolic, and end diastolic) perform differently when used for assessment of autoregulation. The indices using systolic flow velocity consistently demonstrated the strongest association with outcome, followed by indices using mean flow velocity.26 Similar work and findings have been shown in patients with SAH, where disturbance of pressure autoregulation has been associated with the development of delayed cerebral ischemia (DCI).27 Finally, Budohoski et al28 found that disturbed autoregulation in the first 5 days after SAH, as measured by TCD and near-infrared spectroscopy, correlated significantly with development of DCI but not ultrasonographic vasospasm.
Transcranial color-coded duplex (consultant level examination)
Transcranial color-coded duplex (TCCD) is a consultant-level examination that has advantages over the conventional TCD examination by showing the images of the intracranial anatomy and arteries by duplex B-mode while still having the capacity to measure velocities with Doppler. In other words, disparate from TCD technology, TCCD shoots multiple ultrasound beams, exposing a larger brain area at dual emitting frequencies, one for grayscale imaging and another for Doppler imaging; thus this tool can illustrate both arterial position on color flow imaging as well as on B-mode ultrasonography. TCCD tests are accurate, real time, noninvasive (bedside examination), and inexpensive for the study of intracranial circulation and the diagnosis of nonthrombosed aneurysm because of its competence to reveal flow phenomena.29 TCCD can detect presence and severity of intracranial atherosclerosis, which may be the most recurrent source of ischemic stroke. The main limitation of TCCD is the ultrasonic windows that can limit the area of insonation of the cerebral arteries, including their proximal branching, lower spatial resolution, and could obstruct transtemporal insonation.30 TCD- and TCCD-measured velocities are comparable, using zero-angle correction, resulting in more accurate measurement of flow velocities and allowing superior precision in defining intracranial arterial narrowing. TCCD can also more reliably provide information about blood flow in specified intracranial vessel segments as well as allowing a more exhaustive distribution of vessel pathologies. Overall, TCCD can improve both the accuracy and reliability of the conventional TCD studies. In general, TCCD is increasingly being used as an assessment tool to help evaluate occlusive disease on the main segments of intracranial arteries, as well as to serve as a subsequent guide for driving the direction of therapeutic decision-making by providing essential prognostic information of the acute stage of the ischemic stroke. Figure 2-5 shows a 90% left MCA stenosis on intraarterial digital subtraction angiography (DSA) and increased velocities on TCD and TCCD. Follow-up studies showed patent MCA and normal velocity. After successful intracranial stent placement in the left MCA, a follow-up magnetic resonance angiography (MRA) study was performed (Figure 2-7). After loading MRA dicom images onto an advanced ultrasound device, TCCD was performed via left temporal bone window insonation. By coregistration of the two imaging modalities, the MRA and TCCD images could be viewed simultaneously (Figure 2-8). MRA was unable to confirm patency of the target artery after stent placement because artifact masked the view of the left MCA. During incorporation of the TCCD and MRA, the left MCA color flow signal was integrated dimensionally and overlaid on the MRA images. These combined images provided sufficient evidence for patency of the vessel. Velocity measurement did not detect any restenosis. Fusion or combined imaging abrogated the need for a follow-up angiogram. In addition, TCCD and MRA used in combination, may also eliminate the need for intracranial DSA in most patients by providing data about both macrovascular and microvascular impairments. Finally, TCCD can provide superb visualization at baseline and for follow-up after aneurysm coiling (Figure 2-9). MCA patency can be confirmed at bedside. TCCD can also be used in patients with traumatic brain injury for neuromonitoring purposes.
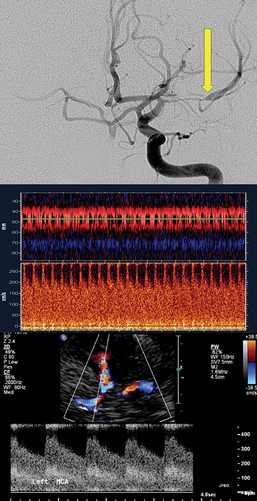
Figure 2-5 Digital subtraction angiography shows critical left middle cerebral artery stenosis (top, arrow), and the corresponding transcranial Doppler signal demonstrates markedly elevated velocity (middle). Transcranial color-coded duplex confirmed the increased velocity (bottom).
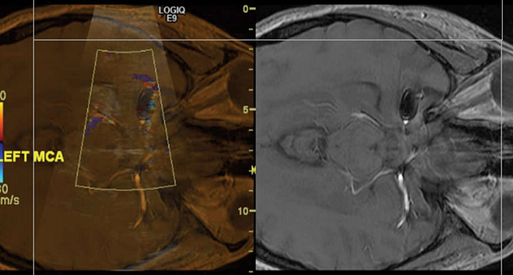
Figure 2-7 Digital subtraction angiography confirms flow in the stent without dissection (left). Transcranial Doppler shortly after stent placement shows marked reduction in flow (right).
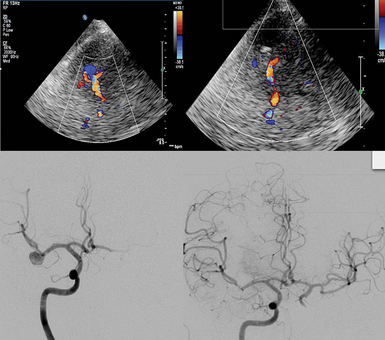
Figure 2-8 Fusion imaging displayed on the same screen: Magnetic resonance angiography and transcranial color-coded duplex showed patency and no restenosis in the M1 or M2 segments of the left middle cerebral artery.
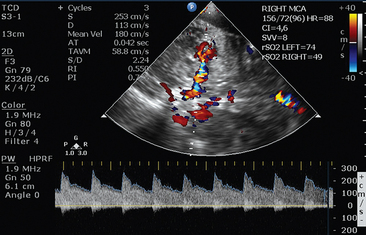

Figure 2-6 (Courtesy Dr. D. Karakitsos.)
Pearls and highlights
• TCD measurements provide information regarding the quality of cerebral blood flow, vascular flow characteristics, pulsatility of flow, resistance, and impedance characteristics of the cerebral circulation.
• Caution should be taken in assuming a linear relationship between Doppler flow velocity and CBF. Cerebral blood flow rate is approximated based on the following equation: CBF ≈ FV × cross-sectional area of the insonated vessel × cosine of the angle of insonation.
• TCD has several important clinical applications, including assessment of patients with acute ischemic stroke, determination of the need for blood transfusion in patients with sickle cell disease, and testing and monitoring of cerebral blood flow autoregulation, among others.
• TCCD has advantages over the conventional TCD examination by showing the images of the intracranial anatomy and arteries by duplex B-mode, while still having the capacity to measure velocities with Doppler.
References
1. Aaslid, R, Markwalder, TM, et al. Noninvasive transcranial Doppler ultrasound recording of flow velocity in basal cerebral arteries. J Neurosurg. 1982; 57(6):769–774.
2. Kremkau, FW, Doppler Ultrasound: principles and instruments. ed 2. Saunders, Philadelphia, 1995:7–52.
3. Hassler, W, Steinmetz, H, Pirschel, J. Transcranial Doppler study of intracranial circulatory arrest. J Neurosurg. 1989; 71(2):195–201.
4. Gosling, RG, King, DH. Arterial assessment by Doppler-shift ultrasound. Proc R Soc Med. 1974; 67(6 Pt 1):447–449.
5. Lindegaard, KF, Grolimund, P, Aaslid, R, et al. Evaluation of cerebral AVM’s using transcranial Doppler ultrasound. J Neurosurg. 1986; 65(3):335–344.
6. Giller, CA, Hodges, K, Batjer, HH. Transcranial Doppler pulsatility in vasodilation and stenosis. J Neurosurg. 1990; 72(6):901–906.
7. Lindegaard, KF. Indices of pulsatility. In: Newell DW, Aaslid R, eds. Transcranial Doppler. New York: Raven; 1992:67–82.
8. Czosnyka, M, Richards, HK, Whitehouse, HE, Pickard, JD, Relationship between transcranial Doppler-determined pulsatility index and cerebrovascular resistance: an experimental study. J Neurosurg. 1996;84(1):79–84.
9. de Riva, N, Budohoski, KP, Smielewski, P, et al, Transcranial Doppler pulsatility index: what it is and what it isn’t. Neurocrit Care. 2012;17(1):58–66.
10. Bellner, J, Romner, B, Reinstrup, P, et al. Transcranial Doppler sonography pulsatility index (PI) reflects intracranial pressure (ICP). Surg Neurol. 2004; 62(1):45–51.
11. Behrens, A, Lenfeldt, N, Ambarki, K, et al, Transcranial Doppler pulsatility index: not an accurate method to assess intracranial pressure. Neurosurgery. 2010;66(6):1050–1057.
12. Zweifel, C, Czosnyka, M, Carrera, E, et al. Reliability of the blood flow velocity pulsatility index for assessment of intracranial and cerebral perfusion pressures in head-injured patients. Neurosurgery. 2012; 71(4):853–881.
13. Bouzat, P, Francony, G, Declety, P, et al. Transcranial Doppler to screen on admission patients with mild to moderate traumatic brain injury. Neurosurgery. 2011; 68(6):1603–1609.
14. Lazaridis, C, Czosnyka, M. Cerebral blood flow, brain tissue oxygen, and metabolic effects of decompressive craniectomy [review]. Neurocrit Care. 2012; 16(3):478–484.
15. Bor-Seng-Shu, E, Hirsch, R, Teixeira, MJ, et al. Cerebral hemodynamic changes gauged by transcranial Doppler ultrasonography in patients with posttraumatic brain swelling treated by surgical decompression. J Neurosurg. 2006; 104(1):93–100.
16. Timofeev, I, Czosnyka, M, Nortje, J, et al. Effect of decompressive craniectomy on intracranial pressure and cerebrospinal compensation following traumatic brain injury. J Neurosurg. 2008; 108(1):66–73.
17. Lazaridis, C, DeSantis, SM, Vandergrift, AW, Krishna, V. Cerebral blood flow velocity changes and the value of the pulsatility index post decompressive craniectomy. J Clin Neurosci. 2012; 19(7):1052–1054.
18. Yang, Y, Grosset, DG, Li, Q, et al, Turbulence and circulating cerebral emboli detectable at Doppler ultrasonography: a differentiation study in a stenotic middle cerebral artery model. Am J Neuroradiol. 2002;23(7):1229–1236.
19. Ringelstein, EB, Droste, DW, Babikian, VL, et al. Consensus on microembolus detection by TCD. International Consensus Group on Microembolus Detection. Stroke. 1998; 29(3):725–729.
20. Tsivgoulis, G, Sharma, VK, Lao, AY, et al. Validation of transcranial Doppler with computed tomography angiography in acute cerebral ischemia. Stroke. 2007; 38(4):1245–1249.
21. Markus, HS, Droste, DW, Kaps, M, et al, Dual antiplatelet therapy with clopidogrel and aspirin in symptomatic carotid stenosis evaluated using doppler embolic signal detection: the Clopidogrel and Aspirin for Reduction of Emboli in Symptomatic Carotid Stenosis (CARESS) trial. Circulation. 2005;111(17):2233–2240.
22. Adams, RJ, McKie, VC, Hsu, L, et al. Prevention of a first stroke by transfusions in children with sickle cell anemia and abnormal results on transcranial Doppler ultrasonography. N Engl J Med. 1998; 339(1):5–11.
23. Tiecks, FP, Lam, AM, Aaslid, R, Newell, DW. Comparison of static and dynamic cerebral autoregulation measurements. Stroke. 1995; 26(6):1014–1019.
24. Czosnyka, M, Smielewski, P, Piechnik, S, et al. Cerebral autoregulation following head injury. J Neurosurg. 2001; 95(5):756–763.
25. Czosnyka, M, Smielewski, P, Kirkpatrick, P, et al. Monitoring of cerebral autoregulation in head-injured patients. Stroke. 1996; 27(10):1829–1834.
26. Budohoski, KP, Reinhard, M, Aries, MJ, et al. Monitoring cerebral autoregulation after head injury. Which component of transcranial Doppler flow velocity is optimal? Neurocrit Care. 2012; 17(2):211–218.
27. Lazaridis, C, Naval, N. Risk factors and medical management of vasospasm after subarachnoid hemorrhage [review]. Neurosurg Clin N Am. 2010; 21(2):353–364.
28. Budohoski, KP, Czosnyka, M, Smielewski, P, et al, Impairment of cerebral autoregulation predicts delayed cerebral ischemia after subarachnoid hemorrhage: a prospective observational study. Strok. 2012; 43:3230–3237.
29. Nedelmann, M, Stolz, E, Gerriets, T, et al. Consensus recommendations for transcranial color-coded duplex sonography for the assessment of intracranial arteries in clinical trials on acute stroke. Stroke. 2009; 40(10):3238–3244.
30. Baumgartner, RW, Mattle, HP, Aaslid, R, Transcranial color-coded duplex sonography, magnetic resonance angiography, and computed tomography angiography: methods, applications, advantages, and limitations. J Clin Ultrasound. 1995;23(2):89–111.