10 Three-Dimensional Conformal Radiotherapy and Intensity-Modulated Radiotherapy
IMRT is becoming a mature technology, and is widely applied to many cancer sites. Many treatment-planning comparison studies have demonstrated the clear dosimetric advantages of IMRT.1–6 Clinical results from the past decade have shown the improvement of local tumor control and reduction of treatment toxicities for prostate cancer, head and neck cancer, and other types of cancer.7–14
Three-Dimensional Conformal Radiotherapy and Intensity-Modulated Radiotherapy Treatment Planning Process
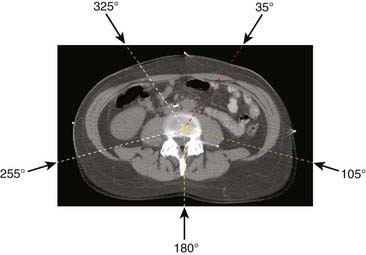
Conventional radiotherapy entails irradiation of the patient from a few beam directions (as the accelerator rotates about the patient), using beam configurations such as that shown in Fig. 10-1, which depicts a five-field isocentric treatment of the prostate. Usually all beams are aimed at a single point denoted as the isocenter that geometrically represents the intersection of the axis of rotation of the linear accelerator gantry head, the collimator assembly, and the treatment couch. Although most often the geometric center of the tumor is purposely positioned at the isocenter, 3D-CRT and IMRT planning do not stringently require that the isocenter be located at the geometric center of the tumor. In many special clinical scenarios (such as in treatment plans for head and neck and breast cancer), the isocenter may be deliberately placed on a specific location, off the geometric center of the tumor. Even though the intervening superficial tissues receive higher radiation doses than does the tumor for each individual beam, the summation of all beams results in a higher dose to the tumor. With conventional radiotherapy, the radiation shape (or aperture) from each beam is manually drawn on the projected two-dimensional (2-D) images, taken from an x-ray machine (referred to as a simulator), which simulates the geometry of a treatment machine (a linear accelerator). With easy access to computed tomography (CT) in modern radiotherapy departments, planning CTs are acquired for most patients undergoing radiotherapy. Sometimes the CT unit, equipped with a flat couch top and alignment laser system, is referred to as a CT simulator. After acquiring a planning CT, the treatment tumor volumes are directly delineated on the CT images, and the radiation portals (or apertures) are designed to conform to the tumor volumes. The difference between conventional radiotherapy and 3D-CRT lies in whether the planning CT is used to define tumor volume and to design treatment portals accordingly. Therefore, 3D-CRT entails more sophisticated shaping of the dose distribution than does conventional radiotherapy because the collimation design (or shaping of fields) and the selection of beam directions are based on 3-D CT images of the patient. These images, projected in a so-called beam’s eye view (BEV) format (described more fully later), permit us to select beam directions with short pathways to the tumor and better avoidance of normal tissues. IMRT goes one step beyond 3D-CRT by enabling variations of the radiation intensity within each beam. This intensity modulation can be achieved via several different approaches, including fabrication of complex physical compensators (often fabricated with computer-controlled milling machines) to be placed in the radiation beam between the radiation source and the patient, but more commonly via the use of a multileaf collimator (MLC) capable of dynamic beam delivery or use of multiple static beams sequentially altered in shape by the MLC. The details of these delivery methods are discussed in the third section of this chapter, “Delivery of Intensity-Modulated Treatment.”
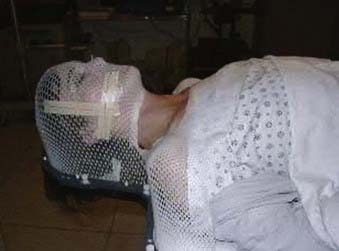
To precisely mimic the patient’s treatment position, simulation first determines a proper posture for the treatment position, including the use of a proper type of immobilization device to facilitate precise reproduction of patient position during simulation, other image acquisition, and multifraction treatment delivery. Often, during the simulation, a patient-specific body mold is fabricated to fix the treatment posture. Fig. 10-2 shows a patient fixed in a head, neck, and shoulder mask on the treatment table. Subsequently, 3-D images are acquired from which the radiation oncologists can delineate target and nearby sensitive structures. Sometimes medical physicists or dosimetrists assist radiation oncologists to contour common sensitive structures, such as the spinal cord, lungs, and liver. The delineation of anatomic volumes is usually done directly on a computer display of transverse CT images using standard computer graphics options such as a mouse, track ball, light pen, and so on. More often, MRI, PET, or PET/CT images are registered with the planning CT to provide better soft tissue contrast (such as in MRI images) and better physiologic information (such as in PET images).
IMRT usually incorporates computerized iteration of radiation beams as opposed to the manual optimization just described. In this process, the computer performs a large number of iterations in less time than a human could perform a few iterations. Further, the computer can modulate the dose intensity within each radiation portal, which is typically divided into multiple pencil beams, each on the order of several square millimeters. The combination of sub-beams of different intensities plus a large number of iterations often enables significantly improved dose distributions with IMRT as opposed to 3D-CRT.15
Patient Setup, Immobilization, and Image Acquisition
The minimization of patient set-up uncertainty is more important in 3D-CRT than in conventional radiotherapy because of the improved conformality of the dose distribution (i.e., quick dose gradient between the boundary of tumor volume and normal tissue). This becomes even more critical in IMRT because IMRT plans often produce even sharper dose gradients at the boundary between the tumor volume and normal tissue.16 Thus, immobilization devices and precise patient positioning procedures must be applied throughout the process of image acquisition, simulation, and treatment. Many different techniques and devices are in use to achieve this, including conventional devices such as vacuum cradles, plaster casts, face masks, and so on. More elaborate devices specific to IMRT are also being introduced such as immobilization devices that attach directly to the treatment couch to ensure that patients are positioned in the same location during each daily treatment. The same “index positioning method” is also used during the CT image acquisition. Stereotactic body frames have also been developed to achieve set-up accuracy approaching that of stereotactic radiosurgery.
PET/CT simulation is similar to the CT simulation except the procedure is carried out on a combined PET/CT scanner; again, a flat tabletop and alignment lasers are necessary for the purpose of radiotherapy treatment planning. Direct PET/CT simulation avoids the additional planning CT acquisition, improves the workflow, and reduces the potential errors during image registration if a PET scan is acquired separately or if a PET/CT scan is acquired in a nontreatment position.17
For some cancer sites (e.g., the prostate), MRI provides much better soft tissue contrast than CT images. MRI simulation can be desirable for reasons similar to the desirability of PET/CT. MRI scanners used in radiology are close scanners, making them inaccessible to the patient once the patient is in the scanner. To set up the patient in a desired treatment position and with a proper immobilization device, an open MRI simulator is preferred. Chen and colleagues18 reported their clinical implementation using a 0.23-tesla (T) open MRI scanner for prostate patients. The MRI scanner consists of two poles, which are each approximately 1 meter in diameter. The separation between the two poles is 47 cm. The MRI scanner table can move in and out along a set of rails mounted on the floor and laterally on an orthogonal set of rails built in the couch. Vertical movement of the table is made by using a composite flat top with hard foam spacers beneath the patient. A set of three triangulation lasers (center and laterals) identical to those used on linear accelerators has been used for patient positioning.
The challenge of directly using MRI for radiotherapy treatment planning is that MRI does not contain the electron density information needed for the dose calculation and image distortion in part because of the inhomogeneities in the main magnetic and gradient fields, and in part because of the differentiation in chemical shift and susceptibility of fat and water. With a low magnetic field of less than 0.5 T, Chen and colleagues18 report that the latter effect is reduced to 1 to 2 pixels. The distortion caused by the inhomogeneity of the magnetic fields increases as the patient size increases. Even with the distortion correction algorithm, residual distortion was reported greater than 2 cm for lateral patient size larger than 40 cm, whereas the distortion for patient lateral size smaller than 38 cm is insignificant dosimetrically.
Delineation of Treatment Volume and Critical Organs
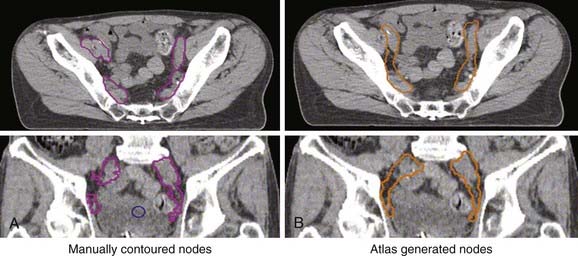
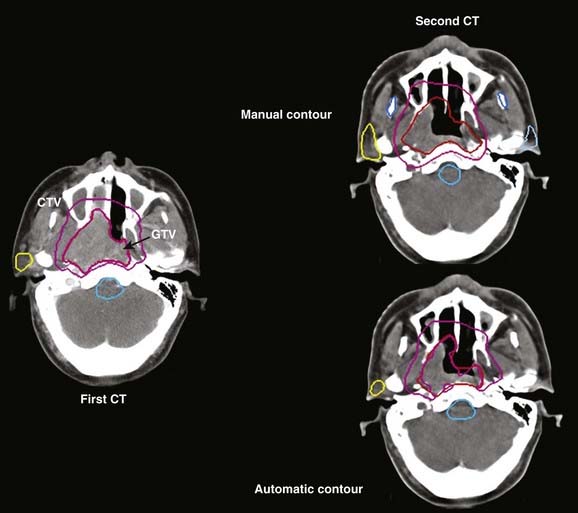
Treatment volumes are defined on the CT images according to International Commission on Radiation Units and Measurements Report 62 nomenclature,19 with the gross target volume (GTV) defined as the visible tumor as seen on CT or other imaging studies; the clinical target volume (CTV) as the visualized tumor plus regions at risk such as microscopic extension of disease, nodal chains, and so on; and the planning target volume (PTV) as a CTV expanded to include setup errors, patient motion, linear accelerator alignment errors, and other uncertainties. For motion tumor volume, internal tumor volume includes magnitude of movement of the tumor. The manual delineation of CTV, PTV, plus adjacent critical organs is time consuming and subject to large variations among observers. The Radiation Therapy Oncology Group and other groups of experts attempted to establish a consensus to minimize these variations.20,21 Many treatment planning systems now incorporate various software tools for performing automatic delineation of tissue structures, but these are of limited utility as current algorithms are only accurate for outlining external body contours and internal contours of very high contrast such as bone, lung, and air cavities. Other commercial programs and research institutions22–26 developed deformable image registration algorithms, permitting the planner to map contours from a template case to a patient case with a similar tumor stage and site but different anatomic characteristics. Fig. 10-3 shows an example of computer-assisted contouring in pelvic lymph nodes. The deformable image registration tools are especially useful when adaptive planning is required for patients with anatomic changes during radiotherapy. Fig. 10-4 shows an example of using deformable image registration to generate contours from an early treatment planning CT (first CT) to the middle-course treatment planning CT (second CT) for a patient with nasopharyngeal cancer while comparing them with manually drawn contours on both CT images.
Selection of Treatment Beams
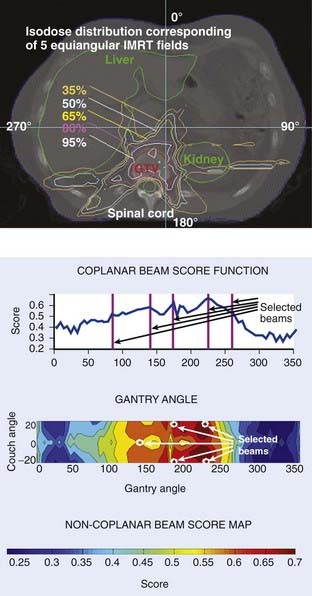
To facilitate selection of beam angles and field shapes based on the relative positions of various anatomic structures, various display schema have been developed for 3D-CRT to represent the PTV and the adjacent critical organs in 3-D perspective on a 2-D computer display monitor. The treatment geometry is usually best visualized in BEV when the anatomy is viewed from the perspective of the radiation source,27,28 as shown in Fig. 10-5. Beam orientations are chosen by observing the patient in BEV from various beam directions and selecting those directions for which the PTV appears to be best separated from the normal tissues. The BEV, however, considers only the geometric property of the patient. The concept has been extended to BEV dosimetrics (BEVDs), in which both anatomy and dosimetric tolerances of the target and involved organs are taken into account for guiding the beam-placement process. BEVD objectively evaluates the goodness of angular space, and it has shown that the incorporation of the BEVD score in IMRT planning can greatly facilitate the selection of beam configuration.29–33 In Fig. 10-6, we show the score functions for an IMRT treatment of a paraspinal tumor obtained with and without BEVD guidance.29
Clinically, selection of beams is based on a combination of experience, standard protocols, and patient-specific anatomy. For example, the relatively small variations from patient to patient in the anatomic relationship between the prostate and its nearby critical structures (most importantly the rectum, bladder, and urethra) enables IMRT prostate treatment plans to follow a more or less standard protocol with regard to beam selection. A treatment planning template can be developed for each specific cancer site.33,34 For brain tumors, on the other hand, beam selection is depends on the patient-specific anatomy and the experience of the individual planner. In general, IMRT fields with large fluctuations in intensity require higher velocities and accelerations of MLC leaves during beam delivery. Selection of optimum beam directions is often more critical when treating PTVs with a complex shape or where there is minimal separation between the PTV and a critical normal structure. Carefully selecting optimum beam directions in IMRT may also reduce the complexity of intensity profiles (i.e., the magnitude of intensity gradients within the field), thus improving delivery accuracy and efficiency. Automation of beam configuration selection is still an active area of research. Unfortunately, at present, none of the available IMRT treatment planning systems can effectively determine optimum beam directions, and thus still rely on the treatment planner’s experience and intuition.
Treatment Planning
Forward Planning
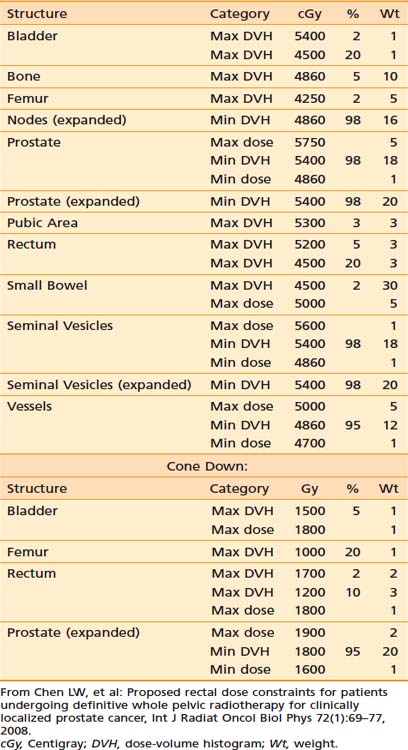
In contrast to IP (discussed in the following section), forward treatment planning involves the planner manually selecting the number of beams, their directions and shapes, inclusion or exclusion of hard or dynamic wedges (wedges modulate beam intensity monotonically along a selected direction), and the relative weightings of each beam shape (the static beam intensities). The computer simply calculates the resultant dose distributions from these beam parameters. In the sense of FP, the dose distribution is predictable by the beam parameters set by the planners. This is fundamentally different than IP in which the human treatment planner specifies the desired dose constraints (ideally, the desired dose shapes or distributions) and the computer calculates the required beam intensities and shapes to best meet the specified dose constraints. The specified dose constraints are a simplified description of dose shapes or distributions because it is not intuitive to depict a desired dose distribution. Table 10-1 provides an example of the desired dose constraints of a concurrent treatment of the pelvic lymph nodes and prostate cancer plus a cone down to the prostate alone.
Table 10-1 An Example of the Desired Dose Constraints of a Concurrent Treatment of the Pelvic Lymph Nodes and Prostate Cancer Plus a Cone Down to the Prostate Alone
The advantage of FP is in its ability to produce a simple plan with a small dose variation inside the tumor volume.35,36 For example, in a treatment plan of a breast, Mayo and colleauges37 compared 3D-CRT plans with wedges to FP-IMRT, IP-IMRT, and a hybrid of open fields and some IP fields. This study reported that the tangent-only IMRT plans, created with an IP method, resulted in the worst dose homogeneity inside the breast, the worst maximum dose outside the target, and 2.3 times more monitor units (MUs) than the FP-IMRT plans. In combining two open tangents with tangent IMRT beams,37 it was found that a plan quality comparable to FP-IMRT could be achieved in significantly less planning time.
Inverse Planning
Principle of Inverse Planning
Inverse treatment planning was first proposed by Brahme in 1988.38 With this process, the user does not directly attempt to optimize or readjust beam shapes and their associated intensities. Instead, after defining the orientation and energies of all beams (but not their intensities or shapes) the planner specifies the desired dose limits (or constraints) for the PTVs and all regions of interest. The computer optimization algorithm first divides each beam into many small “beamlets” (or “rays” or “pencil beams”) and then iteratively alters the intensities of beamlets until the composite 3-D dose distribution best conforms to the specified dose objectives. After the optimal beam intensities and resulting dose distribution have been determined, the computer must then calculate the sequence of MLC leaf motions that will achieve this in the most efficient way. The details of the various steps in this process are described in the following sections.
Cost Function of Inverse Planning
Central to the success of any optimization schema is the specification of an objective or cost function. The cost function is a mathematical definition of the “goodness” of a treatment plan, and the computer optimization algorithm attempts to minimize the cost function as it adjusts the beam weights from one iteration to the next. Objective functions (OFs) can be based on biologic criteria,39,40 but more often are based on dose criteria.41–43 Biologic-based OFs use a calculated radiobiologic response as a measure of the merit of a plan (with calculations based on some model that relates radiation dose plus volume of irradiated tissue to predicted biologic response). The use of biologically weighted OFs is in principle more relevant because treatment outcome is determined by the biologic response. However, a universally accepted biologic model that predicts treatment outcome is yet to be developed. In the meantime, it seems that a clinically sensible and feasible approach is to construct the OF empirically based on the clinical outcome data.44,45
In reality, most popular IP algorithms are still relying on dose-based cost functions for historical reasons. Some commercial planning systems have recently started including the option of biologic model–based IP. The numerical value of a dose-based OF is calculated from some weighted average of the differences between delivered and prescribed doses for every voxel in every tissue defined in the treatment plan (i.e., the PTV plus all normal tissues for which a dose constraint has been specified).41,43,46 The prescription dose to the target, specified tolerance doses to normal tissues, and weighting factors that reflect the importance of each tissue are designated as the constraints.
For the PTV, one of many possible OFs is:
in which Σi represents a summation over all voxels in the PTV and wi equals the weighting (or penalty) factor for the ith voxel.
Usually within a PTV all voxels would have equal weighting factors, but this does not have to be true—a voxel-specific penalty scheme can, in general, significantly improve the final dose distribution because of greatly enlarged solution space.42,47 The calculated dose equals dcal (using the current beam parameters) for the ith voxel. The prescribed dose equals dpres for the ith voxel.
The exact formulation for the objective, however, could take many other algebraic forms. For example, the absolute value of (dcal − dpres)i could be used rather than its square. Or one could include (dcal − dpres)i in the summation only if (dcal − dpres)i is negative; that is, one must assign a penalty only if the calculated dose is less than the prescribed dose. Conversely, when calculating the contribution to the OF for normal tissue, one would usually assign a penalty only if dcal is larger than dpres. The total OF is then the sum of the OFs for each tissue, weighted by the wi values, which will likely differ for each tissue. For example, one would often assign a higher penalty or weighting factor to the spinal cord than to the rectum or bladder, as the former is a more radiosensitive structure with more disastrous consequences if overdosed. Automation of the weighting factors in IP has been reported by Xing and colleagues.48
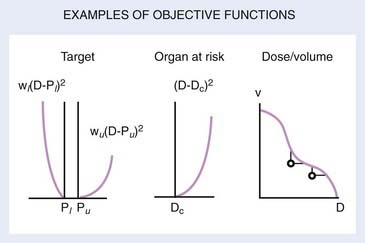
Several OFs are illustrated graphically in Fig. 10-7. For the PTV or target, the graph illustrates the concept of the “allowable inhomogeneity.” That is, if the dose is between a lower limit Pl and an upper limit Pu, no penalty is assessed. Also, a larger weight can be assigned to penalize underdose as opposed to overdose (or vice versa). For normal tissue, a penalty can be applied if the dose exceeds a certain critical value (Dc) or is based on dose-volume considerations, as represented schematically in the rightmost graph of Fig. 10-7.
To specify realistic dose constraints, users need to learn the relationship between the dose constraints and the resulting dose distributions for the specific IP system they are using, plus have some familiarity with basic radiation dosimetric concepts. This learning process is one of trial and error, and is less intuitive than the trial and error planning process involved in 3D-CRT planning. Once the treatment planner has gained this experience, it becomes possible to develop disease-specific templates that can be used as starting-point dose constraints for commonly treated tumor sites such as the prostate,49,50 the nasopharynx,45 and the oropharynx.51 Patient-to-patient anatomic variations obviously limit the use of standard dose constraints, but they can be good starting points.
Generation of Leaf Motion Files
There are many possible sequences of dynamic leaf motions (or equivalently, combinations of multiple static field segments) capable of producing a desired intensity pattern because the problem of leaf sequencing is underdetermined mathematically.15 Depending on the delivery method, algorithms have been developed to minimize the number of segments, the number of total MUs, the leaf travel distance, and the total delivery time.52–57 Here, we describe one basic leaf sequencing method using DMLC (sliding window).
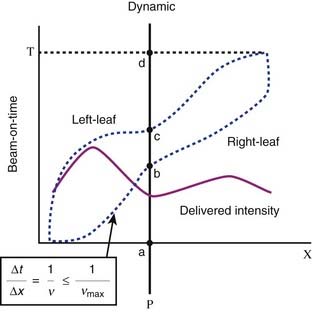
This leaf sequencing method54 divides the 2-D intensity distributions into a number of one-dimensional intensity profiles, with each profile delivered by one pair of leaves. The leaf paths are illustrated in Fig. 10-8, which shows a schematic representation of radiation delivery using the sliding window method. The dotted lines represent the positions of a leaf pair (x-axis) as a function of beam-on time (y-axis). Both leaves start at the extreme left edge of the intended treatment field. As the beam is turned on (a), both leaves move at different speeds from left to right (initially the right leaf moves more rapidly than does the left leaf). The point P begins to receive radiation when the right leaf edge moves past it (b), and continues to receive radiation until the left leaf blocks the beam (c). By controlling the movement of the leaves and therefore the “beam-on-time” duration between b and c, one can deliver any desired intensity to point P, or any other point under this leaf pair. The solid line depicts the total integrated beam intensity to all points underneath the strip of tissue being treated by this leaf pair.
Direct Aperture–Based Optimization
The typical pixel-based or fluence-based (described previously) IP optimization often results in complex IMRT plans, which prolongs the treatment time and dramatically increases the number of MUs by two to five times.58 The latter could lead to increased leakage and scatter radiation through the MLC, and this indirect radiation contribution has been shown to adversely affect the accuracy of treatment delivery.59 More importantly, the increased exposure from complex IMRT plans may also increase the frequency of radiation-induced secondary malignancies. It has been recently reported that the transition from 3D-CRT to IMRT resulted in a larger volume of normal tissue exposed to a low dose of radiation, which was estimated to increase the incidence of secondary cancers at 10 years from 1% to 1.75%.60
To simplify IMRT plans (or avoid overly complex IMRT plans) while improving delivery and radiation efficiency, many researchers have been working on increasing the efficiency of leaf sequencers.55,57,60–63 Some leaf sequencers minimize the total number of segments, whereas others minimize the total required MUs. Other researchers have proposed the use of smoothing filters to eliminate unnecessary noise inside the intensity profiles, either during optimization or prior to leaf sequencing.64,65 With most commercial planning systems, options for controlling the complexity of an IMRT plan are often limited to choosing coarse intensity levels during conversion, selecting a leaf sequencer that can provide an optimal delivery efficiency for the specific delivery method (e.g., sliding window or step-and-shoot methods, discussed further in “Static Versus Dynamic Multileaf Collimator Delivery,” later in this chapter), or using smoothing filters.66–68 However, the effectiveness of these methods in controlling the complexity of an IMRT plan is limited, often resulting in significant deteriorations in plan quality.
Recently proposed direct-aperture optimization (DAO) directly optimizes weights and leaf positions with a predetermined number of MLC shapes permitted for each beam.69–72 DAO is a one-step optimization process that eliminates the step of leaf sequencing in two-step optimization and allows users to have direct control of the complexity of IMRT plans. In an initial study using their in-house software, Shepard and colleagues71 demonstrated the feasibility and advantages of using DAO on a variety of test cases. Compared with traditional two-step optimization, they found that DAO resulted in a significant reduction in both the number of segments and the number of MUs. They were able to create highly conformal IMRT plans with five or fewer apertures per beam angle. The following questions are often asked: Does this significant reduction in the number of variables in optimization lead to deterioration of plan quality? Or, for a specific disease site, how many segments are necessary, and is there a threshold?
Ludlum and Xia73 systematically investigated the tradeoff between plan complexity and plan quality by comparing pixel-based two-step optimization and direct aperture–based one-step optimization. For both prostate and head and neck cancer, IMRT plans of various levels of complexity were generated using each of the optimization methods. For IMRT plans achieving a similar complexity level, as measured by the total treatment time, they reported that direct aperture–based one-step optimization resulted in improved plan quality, compared with pixel-based two-step optimization. Meeting the same plan acceptance criteria of IMRT plans, they concluded that direct aperture–based one-step optimization is an effective method for simplifying IMRT plans, reducing the probability for dosimetric errors and lengthy treatment delivery times.
Inverse Planning With Total-Variation Regularization
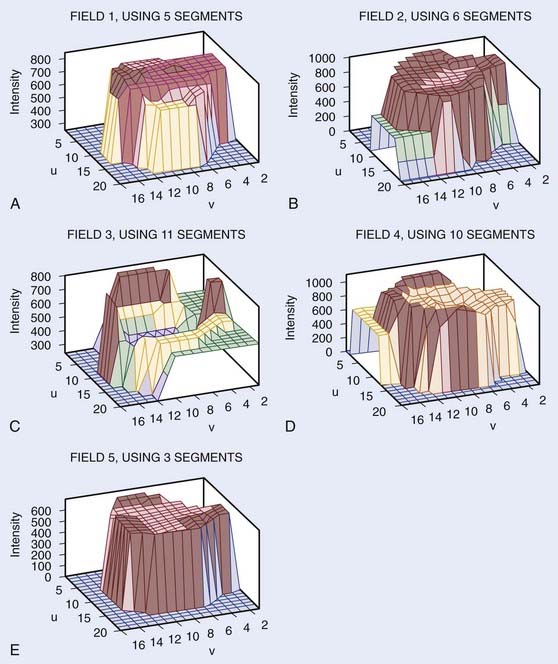
The advantage of the aperture-based optimization planning method is that the planner can control the complexity of a treatment. However, because the delivered dose depends on the nonlinear aperture shapes and the optimization problem becomes nonconvex, random search algorithms, such as simulated annealing or genetic algorithm, are commonly employed. The computation is intensive and requires tuning of multiple algorithm parameters in the searching and cooling schedules. Another disadvantage of segment-based treatment is that the number of segments for each field needs to be determined before the calculation, which reduces the degree of freedom of the decision variable space and compromises the optimality of the final solution. Zhu and Xing74 have recently proposed an efficient total variation regularization (TVR)-based IP algorithm. Instead of directly applying the physical constraints of the apertures, they include a TVR term in the least square optimization to enforce the computed field intensity maps close to the deliverable intensities using a small number of segments. The algorithm is able to optimize the number of segments for each field based on the modulation complexity. The proposed algorithm requires only a simple adaptation of the traditional beamlet-based optimization, and thus has significant potential for improved IMRT. Mathematically, this optimization can be reformulated rigorously as a quadratic programming problem. Fig. 10-9 shows the actual fluence maps (or patterns) obtained using the TVR algorithm for the prostate patient. The resultant plan has different levels of modulation for different fields. It is seen that the TVR greatly reduces the complexity of the intensity map, and the resulting intensity map is close to a piecewise constant function. Fig. 10-10 shows the optimized beamlet intensity of the second field with and without the TVR. The resulting intensity map is close to a piecewise constant function.

Volumetric Intensity-Modulated Arc Therapy and Rapid Arc
A volumetric tomotherapy system that can be delivered with a conventional linear accelerator has been proposed by Yu and colleagues,75 and is often referred to as intensity-modulated arc therapy (IMAT). In this method, 2-D intensity-modulated beams at many equally spaced gantry angles are approximated by a superimposition of multiple shaped radiation fields with uniform intensity. The increments of intensity levels are delivered by individual arcs, with the leaf positions changing with gantry angle to produce the shaped fields. As has been pointed out, there are a large number of possible permutations of decomposition patterns for the 2-D beams, and therefore the design of the most efficient MLC position sequence in arc therapy is a challenging problem. In addition to the multiple rotation approach described previously, volumetric arc therapy can be implemented in a number of forms depending on the specific characteristics of the available hardware and software planning systems.76–78 Arc-based radiotherapy modalities, such as conformal arc, RapidArc volumetric arc therapy, and volumetric intensity-modulated arc therapy (VMAT), have recently become commercially available for clinical use. These techniques are capable of delivering a therapeutic radiation dose to the tumor target while simultaneously moving the MLC leaves and the gantry. Both dose rate and gantry speed can vary in these systems, yielding a greater degree of freedom for generation of conformal dose distribution. For certain types of diseases, arc therapy demonstrated selected advantages over conventional IMRT. In addition to generating excellent dose distributions for deep-seated tumors, an important advantage of arc-based therapy is its fast delivery and reduction of MUs, which may significantly increase the clinical throughput and has the potential to reduce the probability of secondary cancer induced by increased total body dose.
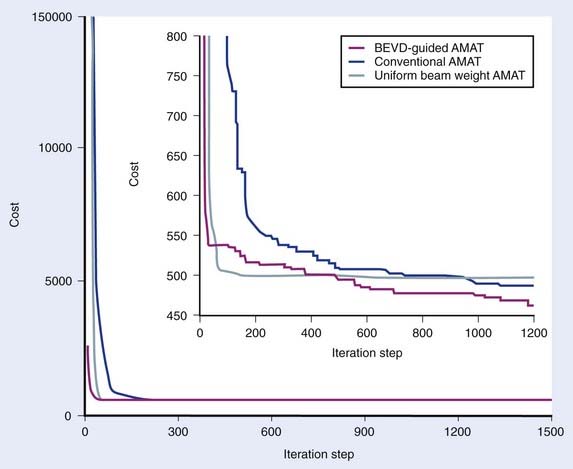
In reality, it is known that, for a given patient, some beam directions are better or worse than others in terms of the dose deliverable to the target volume, and this information can be used as prior knowledge to facilitate the IMAT IP process. Quantitatively, the angular space can be scored by using the so-called BEVD proposed by Pugachev et al.,29–31 which ranks a beam orientation by what the beam could achieve dosimetrically without exceeding the dose constraints of the system. It is conceivable that the optimal weight of a beam in IMAT should correlate with the BEVD ranking. Ma and colleagues have recently proposed an IMAT IP algorithm with incorporation of BEVD information.79 Instead of setting the initial weight of a beam arbitrarily, precomputed BEVD is adopted as the initial weight of the corresponding beam. By initializing the segment weights in an informative way, they showed that the convergence behavior and the final dose distribution of IMAT IP are significantly improved as compared with the conventional approach. Fig. 10-11 plots the OF versus the iteration step for different simulated annealing calculation methods for an IMAT pancreatic treatment. The BEVD-guided optimization significantly improves the computational efficiency and the plan quality.
Delivery of Intensity-Modulated Treatment
Several different techniques have been developed for delivery of IMRT. The first method is the relatively “low-tech” fabrication of custom-designed 3-D physical compensators. These can be fabricated using a computer-controlled milling machine to cut either the compensator itself or a negative mold of the compensator to be filled with Cerrobend or a similar type of material. This approach can be implemented without a significant capital investment as it does not require an MLC. There is, however, additional personnel time required for fabricating the filters and for inserting them into each field during treatment. Physical compensators also harden the beam, generate scattered radiation, and increase skin doses and doses outside the field. Nonetheless, the intuitive and low-tech aspects of this technique make it appealing at some centers, and, with the exception of increased scatter and skin dose, is technically capable of delivering dose distributions comparable to more exotic MLC-based beam-delivery systems.80,81
A technologically different approach to IMRT-beam delivery is tomotherapy, wherein a rotating fan beam that is broad in the transverse direction but narrow in the superior-inferior direction (approximately 0.5-2.0 cm wide in the superior-inferior direction) is intensity-modulated with a bimodal MLC. The bimodal MLC also has multiple leaf pairs, but each leaf pair has only two positions—completely open or completely closed. Two basic tomotherapy systems have been proposed, one being a truly dedicated tomotherapy system that is a hybrid of a spiral CT scanner and a linear accelerator developed at the University of Wisconsin,82 whereas the second is based on axial (couch stepping) CT and uses a custom-designed MLC (the mimic collimator), which can be attached to a conventional linear accelerator.
Characteristics of Multileaf Collimators
The MLC can be installed within the accelerator gantry head either above the upper set of secondary collimator jaws or below the lower set of secondary collimator jaws as a tertiary collimator. In the Elekta linear accelerator, for example, the MLC replaces the upper (Y) jaws (Fig. 10-12), although it is augmented with an additional 3-cm thick Y jaw to reduce the radiation leakage from the MLC. In the Siemens linear accelerator, the MLC completely replaces the lower (X) jaws (Fig. 10-13). In the Varian linear accelerator, the MLC is a tertiary collimator (Fig. 10-14) located below and in addition to the conventional X and Y secondary collimators. Placing the MLC below both sets of secondary collimators (as in the Varian design) places it closer to the patient, which, in principal, improves the geometric penumbra, but at the expense of a physically larger device with less clearance between the MLC and the patient. Placing the MLC above the secondary collimators (as in the Elekta design) produces a poorer geometric penumbra, but also results in a smaller and lighter MLC design with increased physical clearance between the accelerator head and the patient. The Siemens design obviously takes a middle course in this unavoidable tradeoff of geometric penumbra versus MLC size.
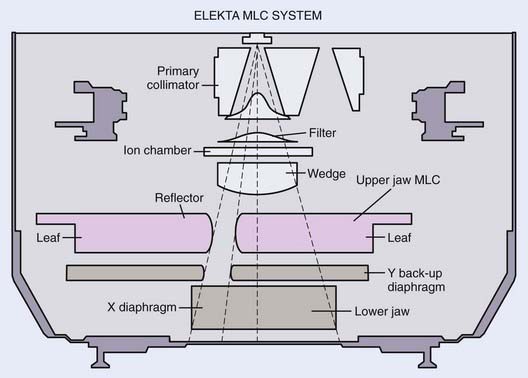
FIGURE 10-12 • A schematic drawing of the Elekta multileaf collimator.
(From Van Vyk J [ed]: The modern technology of radiation oncology, Madison, WI, 1999, Medical Physics Publishing.)
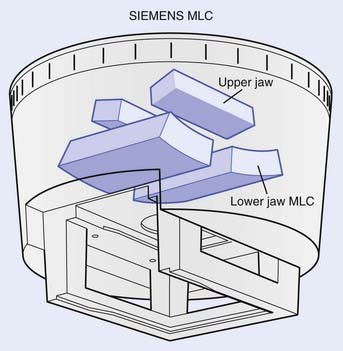
FIGURE 10-13 • A schematic drawing of the Siemens multileaf collimator.
(From Van Vyk J [ed]: The modern technology of radiation oncology, Madison, WI, 1999, Medical Physics Publishing.)
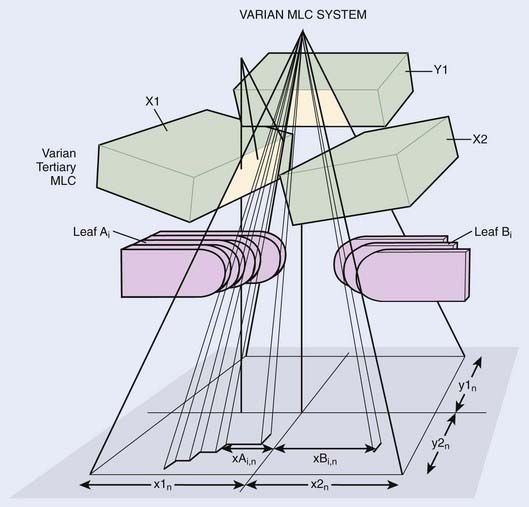
FIGURE 10-14 • A schematic drawing of the Varian multileaf collimator.
(From Van Vyk J [ed]: The modern technology of radiation oncology, Madison, WI, 1999, Medical Physics Publishing.)
Complicating design considerations is the fact that adjacent leaves must be able to slide smoothly across each other with minimal gaps between leaves to reduce radiation leakage and transmission. Most MLC designs accomplish this by cutting tongues and grooves into the sides of the leaves. The side of one leaf has an extended portion called the tongue, while the abutting side of the adjacent leaf has an indented portion called the groove. Two adjacent leaves are coupled together as the tongue of one leaf slides within the groove of the adjacent leaf. Fig. 10-15 shows schematically a “head-on” view of the MLC leaves, showing how adjacent leaves have interlocking tongues and grooves, plus the variations in transmission dose that result. Each leaf has a tongue on one side, and a groove on the opposite side. The manufacture of precise tongues and grooves into extremely small individual leaves is an exacting process that places a lower limit on the size of individual MLC leaves.
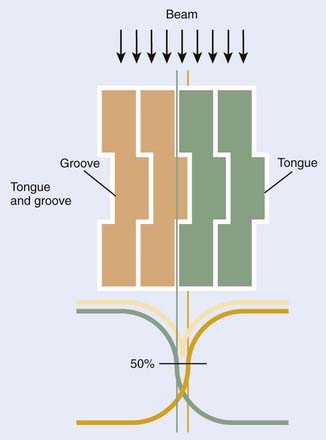
FIGURE 10-15 • Schematic “end-on” view of a multileaf collimator showing the tongue-and-groove design and the approximate resulting beam transmission.
Although this tongue-and-groove design reduces radiation leakage, it also complicates treatment planning dose calculations because the transmission through any leaf depends on whether the beam passes through the tongue, the center, or the groove portion of the leaf. The differences in beam transmission through tongues and grooves is demonstrated in Fig. 10-16, in which we show a sheet of radiographic film (center panel, Fig. 10-16B) that was doubly exposed with two matched MLC shapes, shown in Fig. 10-16A (left) and Fig. 10-16C (right), respectively. The two MLC shapes are complementary to each other, as suggested by Sykes and Williams.83 That is, leaves open in Fig. 10-16A were closed in Fig. 10-16C, and vice versa. In Fig. 10-16B, underdose regions are clearly shown at the match lines where the tongue is exposed to radiation, demonstrating the tongue-and-groove effect. The magnitude of the dose reductions in these match line areas is approximately 17% and 25% for Siemens (MXE) and Varian (CL2300 C/D) linear accelerators, respectively, and similar results have been reported for the Philips (now Elekta) design.83

Another important design consideration is focusing the ends of MLC leaves to match the radiation field beam divergence. This is, of course, a 2-D problem, as the beam diverges in both the direction along MLC leaf motion and in the direction perpendicular to MLC leaf motion (designated as the X and Y directions, respectively). Focusing MLC leaves in the Y direction can be accomplished in the same manner as in a conventional secondary collimator. The width of each MLC leaf is designed to be slightly narrower at the top of the leaf (nearer the radiation source) than at the bottom of the leaf (nearer the patient), as shown in Fig. 10-16. MLCs focused only in the Y direction are called single-focused MLCs.
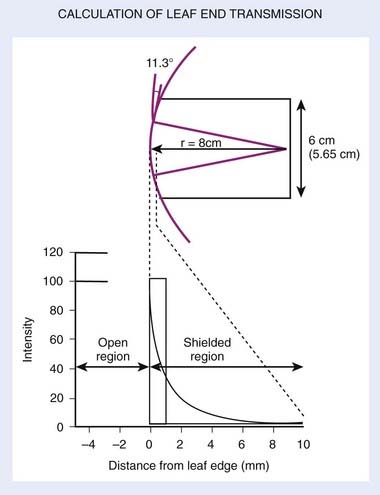
Both the Elekta and Varian MLCs (and a newer model released after 2008 from Siemens) are single-focused, with the leaf motion in a plane perpendicular to the beam direction rather than along a spherical surface, as in the Siemens design. This precludes the possibility of true 2-D focusing, but in the Varian design there is “pseudo” focusing in the X direction by machining the ends of the leaves not as flat surfaces but rather with a slight convex curvature84 (Fig. 10-17). The convex leaf edge maintains a reasonably faithful geometric penumbra over all field sizes, but compromises slightly beam transmission through the leaf ends. As a result, the leakage depends somewhat on field size or leaf position from the beam center. Leakage can be as high as 20% or more53 when opposing leaves abut each other (i.e., zero field size). Also, the coincidence between the radiation and light fields can depend on leaf position when using the rounded-leaf-end design.
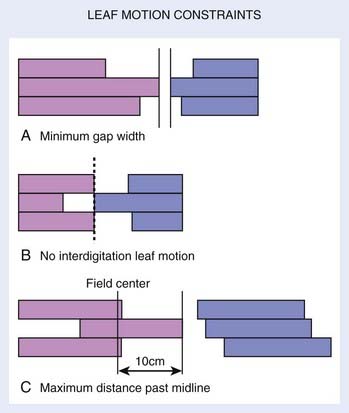
Leaf motion restriction is another factor affecting the delivery, efficiency, and dose accuracy of IMRT. Fig. 10-18 shows three types of leaf motion restrictions, in which all left bank leaves are denoted in gray and right bank leaves in black. Fig. 10-18A shows a design incorporating a minimum gap between opposing leaves (usually incorporated in the design to prevent leaves from hitting each other). Fig. 10-18B shows a design that prohibits interdigitation, which occurs when one (black) leaf end extends beyond the tips of its two neighboring opposing (gray) leaves. Fig. 10-18C shows a design restricting leaf over-travel, either beyond the field center, or beyond the back ends of its neighboring leaves.
Static versus Dynamic Multileaf Collimator Delivery
In SMLC delivery, treatment parameters associated with each segment are recorded and verified through an R/V system. Autosequencing software is often used to automatically deliver each segment with little or no human intervention. The advantages of static, or step-and-shoot, IMRT are that it is conceptually simple, there are no requirements to control the individual leaf speeds (thus simplifying the MLC control system) or delivery dose rate, an interrupted treatment is easy to resume, it is easy to verify an intensity pattern for each field, and fewer MUs are required in comparison with DMLC delivery.85 The disadvantage is that it may require prolonged treatment time, particularly for complex intensity patterns. The overhead time associated with downloading and comparing the parameters of each segment in the R/V system can take a few seconds. For a complex intensity-pattern delivery, this overhead time can be a significant portion of the total treatment time. Furthermore, because of the “discretized” intensity pattern, the achievable dose distribution for very complex clinical cases may be compromised.
In DMLC delivery, the leaves are in continuous motion during radiation delivery, as previously described in “Generation of Leaf Motion Files.” The advantage of DMLC delivery is that it can deliver a smoothly varying intensity profile. The disadvantages are that the delivery mechanism is rather complicated, involving leaf-speed and dose-rate modulation; it requires the precise control of individual leaf speeds; and small errors in the calibration of leaf position could (for very highly modulated fields) result in significant errors in delivered doses. Thus, very careful QA tests are required for dynamic IMRT. Finally, intensity patterns contain regions with zero dose intensity, such as for a cord block, requiring completely closed leaves to cross over this region. But with rounded leaf ends, the leakage through the closing leaf ends can be as much as 20%,53 and some MLCs restrict the minimum leaf gap to several millimeters. In such a situation, one must either split the IMRT treatment field into two separate beam segments, or augment the IMRT treatment with the addition of a Cerrobend block.
Dose Calculation Algorithms
Having said that, we must note that there are still some complications associated with MLC IMRT dose calculations. First, when delivering an IMRT dose, only a portion of the entire field is exposed at any given time. As a result, the total beam-on time (or MUs) required can be two to four times longer than for conventional treatments.58 In general, the more complex the intensity modulation, the more MUs required. This means that factors such as variable-beam transmission through rounded leaf-ends or through tongues and grooves, which are ignorable in conventional dose calculations, must be more accurately accounted for with IMRT. Overall leakage through MLC leaves can also amount to several percent of the total IMRT dose as opposed to less than 1% for conventional treatments. Extremely variable effective field sizes during IMRT beam delivery also complicates calculation of the output factor, as the relationship between collimator scatter factor and phantom scatter factor becomes more complicated than for conventional dose calculations.86
One accurate method of dose calculation developed at Memorial Sloan-Kettering Cancer Center87 entails a one-time Monte Carlo (MC) calculation of pencil beams or dose kernels to describe the transport of photons and electrons in homogeneous and inhomogeneous media. Patient treatment planning then incorporates a convolution of pencil beams. In this dose model, inhomogeneity effects are accounted for by the traditional method of equivalent path length (or similar algorithm) and pencil-beam convolution is used only as a correction factor to account for the variation of intensity relative to a flat, uniform field.87 However, in a highly heterogeneous media such as the lung, the accuracy of this calculation method needs improvement, for which development is in progress. The MC method can provide the most accurate dose calculation, but, because of the lengthy computation time, its routine use awaits faster computer speed. Nevertheless, the MC method is relied on to derive an accurate pencil-beam kernel and the source function (which predicts the incident intensity pattern), with detailed accounting for the finite source size, extra-focal radiation (from the flattening filters, primary and secondary collimators), beam spectrum, and so on.
Quality Assurance for Intensity-Modulated Radiation Therapy Delivery
Mechanical Tests
The geometric accuracy of leaf positions is critically important for both static and dynamic IMRT, much more so than are collimator settings for conventional radiotherapy. For dynamic IMRT, the dose delivered to each strip of tissue is directly related to the gap width of the leaf pair passing over it, and small errors in average gap width can result in significant dose errors. Consider, for example, an MLC field for which the average gap width is intended to be 1 cm, but for which one or the other leaves has a systematic error in position of 1 mm. The resulting gap, and consequently the delivered dose to that strip, would therefore be in error by 10% (i.e., 1 mm/1 cm).84,88 Similarly, for static IMRT a systematic error in leaf position would affect the dose everywhere within the strip of tissue covered by that leaf, and not just at the field edge as it would for conventional static-beam delivery.
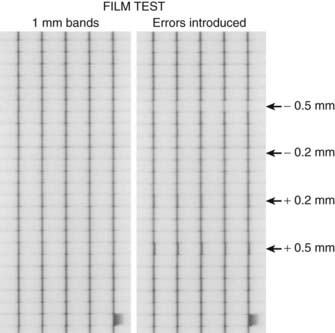
Thus, precise calibration and verification of leaf position is much more important for IMRT than for conventional therapy or for 3D-CRT. Leaf position is also somewhat more important for sliding-window than for step-and-shoot therapy.89,90 Mechanical calibration of the leaf positions can be tested using procedures and software supplied by the manufacturers, although independent physical verification methods such as caliper and micrometer measurements of leaf positions are also recommended.84,91,92 Several MLC test patterns have been designed and used for MLC leaf position QA. One such test pattern, shown in Fig. 10-19, is specifically designed to test for small errors in MLC leaf position. In this case, a leaf motion file is generated that instructs the MLC to deliver five narrow vertical bands of radiation. The leftmost panel shows a film exposure in which the MLC functioned properly, as indicated by the fact that all five dark strips are of equal intensity and thickness (lighter horizontal bands and streaks are the result of normal MLC leakage). In the rightmost panel, however, several individual leaves have been intentionally miscalibrated by −0.5, −0.2, +0.2, and +0.5 mm (top to bottom of film respectively). Note the narrow spots in all five vertical bands for the −0.5- and −0.2-mm errors in calibration, and the broad spots for the +0.5- and +0.2-mm errors. This demonstrates that a simple daily film QA test can detect MLC positioning errors of a fraction of a millimeter. A more elegant and quantitative method was proposed to use the fractional volume effect of a radiation detector or an electronic portal imaging device (EPID) for a routine leaf-position check.93 The approach uses the fact that, when a finite-sized detector is placed under a leaf, the relative output of the detector depends on the relative fractional volume irradiated. A small error in leaf positioning changes the fractional volume irradiated and leads to a deviation of the relative output from the normal reading. For a given MLC and detector system, the relation between the relative output and the leaf displacement can be easily established through experimental measurements and used subsequently as a quantitative means for detecting possible leaf positional errors. Experiments using an ion chamber and an EPID showed that the technique is robust and can detect the positional inaccuracy of approximately 0.1 mm.
Another important consideration for DMLC is the monitoring of the performance of the MLC during treatment. While the beam is on, the Varian MLC control computer, for example, checks all leaf positions every 55 ms, compares them with the planned leaf positions in the DMLC file, and records them in a DMLC “log file.”94–97 If any leaf deviates from its planned position beyond a preset tolerance, the control computer invokes a “beam hold-off,” and radiation delivery is withheld until all leaves are again within tolerance. Deviations that invoke “beam hold-off” should occur infrequently, as the leaf sequencer algorithm incorporates MLC leaf-speed limitations and accelerator dose rates when calculating DMLC files. Our experience has been that leaf deviations greater than 1 mm occur less than 1% of the time. Part of the DMLC control software permits the user to preset a tolerance level of leaf position error invoking a beam hold-off. It is found that 2 mm is a good compromise between ensuring against a true hardware failure (such as a “stuck” leaf) and an unreasonably small tolerance that would result in a large number of unnecessary beam hold-offs.84
MLC leaf position accuracy and field penumbra become more important in IMRT treatment because they can affect dose throughout the entire field, not just at the edge of the field as in conventional treatment.90,94–97 In static IMRT delivery, the IMRT field is essentially a series of abutted static fields. Random and systematic errors in leaf position may cause overlap or underlap in these abutted fields. It is found that leaf positional errors have more significant effects on the complex plans than on the simple IMRT plans.90 Although the effect of random errors in leaf position are usually averaged out over the entire treatment volume, systematic leaf position error may be dosimetrically significant. An example of systematic leaf position errors is the coincidence between light and radiation fields for rounded MLC leaf ends, discussed previously in “Characteristics of Multileaf Collimators.”
Dosimetric Tests
Dosimetric characterization of the MLC, using film, ion chambers, or both, includes measurements of radiation transmission through the leaves and their rounded ends, and the determination of head scatter.56,98 The dosimetric contribution of these factors can amount to as much as 15% for large, highly modulated fields. Periodic dosimetric and geometric verification of intensity-modulated fields must therefore be added to the physics QA program. For example, image patterns of predesigned fields can be used to expose radiographic films on a regular basis by the radiation therapists to provide a quick visual assessment that the MLC is functioning properly. Ion chamber and diode array measurements at different gantry and collimator angles are performed monthly by a physicist to ensure constancy of the MLC output and to track long-term stability. Ion chamber measurements in a solid phantom for patient fields provide a straightforward check on the MU calculations. Film dosimetry, with sufficient spatial resolution for the intensity-modulated patterns, efficiently compares the delivered and the planned dose distributions. It is also used intensively during the testing of new software and new treatment sites for IMRT, as well as for periodic spot checks.
Additional dosimetry tests related to dose linearity plus field symmetry and flatness are required for IMRT, particularly for the step-and-shoot technique. The step-and-shoot IMRT technique often introduces delivery of many small dose segments, sometimes as low as a fraction of one MU. In such situations, the normal internal accelerator feedback dosimetry systems that ensure beam symmetry and flatness may not function properly, and special dosimetry tests need to be performed for this purpose. In particular, dose linearity as a function of MU setting, plus flatness and symmetry need to be checked for very small MU settings.99–103
Patient-Specific Issues
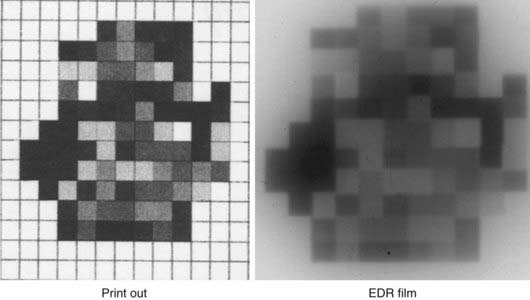
Finally, specific tests should be performed to ensure the accuracy of each patient IMRT treatment field. This includes verification that all field and file names are correct, and that the proper DMLC leaf motion files have been downloaded to the linear accelerator through the R/V system. For dynamic IMRT, both the outer boundary of the treatment field plus the intensity pattern should be verified prior to the first patient treatment. One technique for performing this test is to attach a sheet of radiographic film to the blocking tray of the accelerator, expose it to an entire fraction of a dose, and compare the developed film with the expected intensity pattern. This exposed intensity pattern is the initial beam fluence pattern (i.e., without patient attenuation), and should match that calculated by the treatment planning system. An example of such a test is shown in Fig. 10-20, which demonstrates that a simple visual inspection can easily reveal gross errors in treatment delivery or field identification. More accurate comparisons could of course be done by scanning the film for true optical density and dose.
Computerized Second Check of Intensity-Modulated Radiation Therapy Plans
Verification of IMRT treatment plans is currently a labor-intensive and often institution-dependent process. The use of independent MU and fluence map calculations for additional assurance of IMRT delivery have been reported in the literature.104–106 The computer-based approach has a number of advantages. Instead of using an ionization chamber or radiographic films to actually perform the dosimetric measurements, it attempts to simulate the treatment on a computer and independently calculate the dosimetric quantities, such as the spatial doses or fluence maps. The philosophy here is similar to that used in plan validation in conformal 3D-CRT, in which a manual or simple computer calculation is employed to double-check the MU of a treatment.
A general algorithm developed by the Stanford group105 provides a clear physical picture and allows implementation of the MU calculation at different levels of sophistication to meet the specific requirement of different systems. In the independent fluence map calculation, the program reads in the leaf sequence file generated by the planning system and recalculates the fluence map. The calculation is then compared quantitatively with the intended fluence map from the treatment planning system. The goal of the simulation is to warrant that, assuming that a rigorous independent QA of the MLC system has been performed so that the DMLC can accurately execute the instruction of a leaf sequence file, the execution of the leaf sequence will generate the desired fluence map, should it pass the simulation test. This eliminates the experimental verification for each treatment field and each patient and significantly simplifies the QA procedure.
Plan Evaluation and Improvement
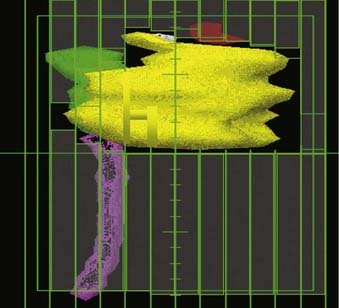
The process of treatment plan evaluation continues to evolve. In particular, knowledge of dose tolerance and the limiting volume that is safe for each organ has been accumulated in the past decade and is still growing. For example, a volume of more than 20 Gy for a healthy lung was found to be associated with increased incidence of pneumonitis.107,108 The mean dose (>26 Gy)109,110 to the parotid glands is associated with the xerostomia. The mean dose to the contralateral lung for patients with mesothelioma should be extremely low (<8 Gy).111 Because of these cumulative organ-specific tolerance doses and volumes, treatment plan evaluation has become more quantitative than qualitative. The tools used for plan evaluation are similar for 3D-CRT and IMRT, although the schema for adjusting plans based on this evaluation is quite different. Evaluation tools include 2-D dose distributions superimposed on CT images, 3-D volumetric or color-wash rendering of dose distributions overlaid on the PTV and critical organs, structure-specific DVHs, structure-specific endpoints, and biologic indices. The structure-specific endpoint can be a defined dose to a specific percentage volume (or specific absolute volume) of an organ, and sometimes simply a mean dose to the organ. The biologic indices can be an equivalent uniform dose (EUD),112,113 a tumor control probability (TCP), or a normal tissue complication probability (NTCP).114–119 In addition, for IMRT plans, inspection of the intensity profiles is often useful for evaluating an individual beam’s contribution to the dose distribution. Inspection of beam intensity distributions can be made using an “observer’s view,” which is similar to a relief map (see Fig. 10-6), or by the projection of “isointensity” lines on a BEV. Although the projection of isointensity lines on a BEV is not intuitive, the inspection can prevent the gross mistake such as unintended tumor volume (in some cases, a tiny dot) accidentally depicted on the planning CT, which a computer would faithfully treat as a part of the tumor volume.
Development and Research Issues
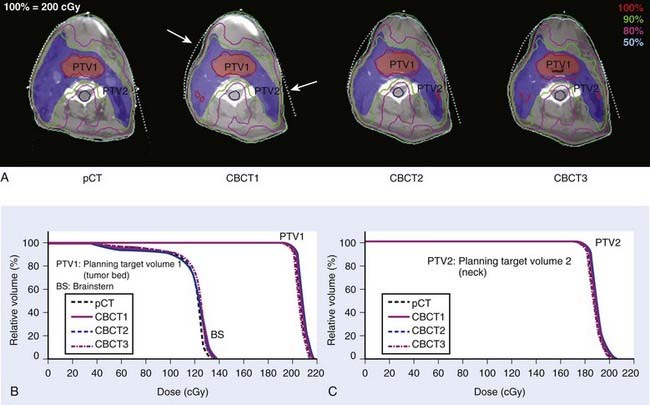
There is significant interest in developing methods to verify the delivery of IMRT beams. These efforts are benefiting greatly from the gradual maturation of the EPID technology, particularly amorphous silicon detectors and onboard volumetric imaging systems.120 The ability to directly verify the intensity pattern of the delivered intensity-modulated beams will greatly enhance confidence in the use of IMRT and lead to wider acceptance of this modality. At present, the electromechanical monitoring of leaf positions during radiation delivery provides similar assurance, albeit indirectly. With the availability of onboard cone beam CT (CBCT), it is now possible to obtain the patient’s on-treatment geometric model. Combined with the MLC log file or EPID-captured delivery segments, this allows us to retrospectively reconstruct the delivered dose distribution to the patient.74,121–124 An example of reconstructed dose distribution is shown in Fig. 10-21 for a head and neck cancer case. In this example, CBCT 1, CBCT 2, and CBCT 3 were taken at 1 day, 15 days, and 30 days, respectively. For illustration purposes, the fluence maps used in this calcualtion were reconstructed using a simple ray-tracing algorithm. The DVH comparison of the four different dose distributions is also presented.
IMRT offers a valuable tool for dose escalation and radiation toxicity reduction, and shows significant potential to improve therapeutic ratio. In reality, however, the efficacy of IMRT can only be fully exploited with an effective means of dealing with the uncertainties in beam targeting. To ensure the delivery of exquisite IMRT dose distribution, image guidance becomes an important issue, as evidenced by the intense research effort in image-guided radiation therapy (IGRT).120 The overarching goal of IGRT is to eliminate or reduce the uncertainties associated with target volume definition and intrafractional and interfractional organ motion. Various novel imaging techniques, such as 4D-CT,125–128 4D-PET,129–131 and 4D-CBCT132–135 are applied to radiotherapy guidance and verification. With integration of these state-of-the-art imaging technologies and time-resolved IMRT (such as respiration-gated IMRT), it is anticipated that we will be able to treat moving targets with much reduced safety margins and with high confidence in the near future.
Adaptive IMRT is an active research area that is currently being pursued at a number of institutions to overcome issues related to setup errors and interfractional anatomy changes.25,136–139 Despite the fact that these uncertainties are inevitable during a course of radiotherapy, up to this point, almost all research efforts have been focused on reducing the adverse effects of organ movement and deformation by attempting to reposition the patient more accurately. Indeed, the conventional approach treats the patient as a rigid dummy and tacitly ignores the multidimensional nature of the beam-targeting problem in radiotherapy. The integration of CBCT in linear accelerators opens a new avenue of volumetric image-guided adaptive therapy, in which the patient’s on-treatment imaging data is used as feedback for adaptive modification of the treatment plan to ensure full dose coverage of the tumor target while sparing the sensitive structures. To realize this new paradigm of radiotherapy, a number of enabling computational tools, such as replanning,137,140 contour propagation,22,23,141 and deformable image registration,* must be developed and their potential benefit must be evaluated.
The use of biologic models of tumor tissue response as criteria for plan optimization has attracted much attention.15,42,112,144–147 In general, biology-based score functions typically consist of some weighted combination of biologic indices such as NTCP114 and TCPs.118,119 These indices condense structure-specific dose-distribution data to yield relative figures of merit for the respective objects of interest. However, both of these indices are based on rather rudimentary models with simplistic assumptions. Importantly, clinical data for validating the models and deriving the model parameters are lacking. Nevertheless, the advent of 3D-CRT and the accrual of patients treated with this modality are beginning to provide clinical outcome data for which DVH data are available. For example, analysis has been performed on clinical complication data of the liver, prostate, and optic pathways7,12,67,148–154 using specific DVH information. Such studies promise to improve the present biologic models and provide better estimates for the model parameters. It is hoped that the iterative process of generating clinical data and refinement and validation of the models will incrementally improve the predictive power of the biologic indices and facilitate the quantitative evaluation of 3-D treatment plans.
The ability of IMRT to deliver nonuniform dose patterns brings to the fore the question of how to “dose paint” or “sculpt,” leading to the suggestion that “biologic” images may be of assistance.* In contrast to the conventional radiologic images that primarily provide anatomic information, biologic images reveal metabolic, functional, physiologic, genotypic, and phenotypic data. Important for radiotherapy, the new and noninvasive imaging methods may yield 3-D radiobiologic information. Studies are urgently needed to identify genotypes and phenotypes that affect radiosensitivity, and to devise methods to image them noninvasively. Incremental to the concepts of GTV, CTV, and PTV, we suggest the concept of “biologic target volume” (BTV) and hypothesize that BTV can be derived from biologic images and that their use may incrementally improve target delineation and dose delivery.89,156
1 Burman C, et al. Planning, delivery, and quality assurance of intensity-modulated radiotherapy using dynamic multileaf collimator: a strategy for large-scale implementation for the treatment of carcinoma of the prostate. Int J Radiat Oncol Biol Phys. 1997;39(4):863-873.
2 Hong L, et al. Intensity-modulated tangential beam irradiation of the intact breast. Int J Radiat Oncol Biol Phys. 1999;44(5):1155-1164.
3 Ling CC, et al. Conformal radiation treatment of prostate cancer using inversely-planned intensity-modulated photon beams produced with dynamic multileaf collimation [see comments]. Int J Radiat Oncol Biol Phys. 1996;35(4):721-730.
4 Posner MD, et al. Dose optimization for the treatment of anaplastic thyroid carcinoma: a comparison of treatment planning techniques. Int J Radiat Oncol Biol Phys. 2000;48(2):475-483.
5 Xia P, et al. Comparison of treatment plans involving intensity-modulated radiotherapy for nasopharyngeal carcinoma. Int J Radiat Oncol Biol Phys. 2000;48(2):329-337.
6 Xia P, et al. Forward or inversely planned segmental multileaf collimator IMRT and sequential tomotherapy to treat multiple dominant intraprostatic lesions of prostate cancer to 90 Gy. Int J Radiat Oncol Biol Phys. 2001;51(1):244-254.
7 Zelefsky MJ, et al. Clinical experience with intensity modulated radiation therapy (IMRT) in prostate cancer. Radiother Oncol. 2000;55(3):241-249.
8 Chao KS, et al. Intensity-modulated radiation therapy in head and neck cancers: the Mallinckrodt experience. Int J Cancer. 2000;90(2):92-103.
9 Lee N, et al. Intensity-modulated radiotherapy in the treatment of nasopharyngeal carcinoma: An update of the UCSF experience. Int J Radiat Oncol Biol Phys. 2002;53:12-22.
10 Sulman EP, et al. IMRT reirradiation of head and neck cancer—disease control and morbidity outcomes. Int J Radiat Oncol Biol Phys. 2009;73(2):399-409.
11 Muscal JA, et al. Changes mimicking new leptomeningeal disease after intensity-modulated radiotherapy for medulloblastoma. Int J Radiat Oncol Biol Phys. 2009;73(1):214-221.
12 Sura S, et al. Intensity-modulated radiation therapy (IMRT) for inoperable non-small cell lung cancer: The Memorial Sloan-Kettering Cancer Center (MSKCC) experience. Radiother Oncol. 2008;87(1):17-23.
13 Miles EF, et al. Intensity-modulated radiotherapy for resected mesothelioma: the Duke experience. Int J Radiat Oncol Biol Phys. 2008;71(4):1143-1150.
14 Salama JK, et al. Concurrent chemotherapy and intensity-modulated radiation therapy for anal canal cancer patients: a multicenter experience. J Clin Oncol. 2007;25(29):4581-4586.
15 Xing L, et al. Physics of intensity modulated radiation therapy. In: Mundt AJ, Roeske. Intensity modulated radiation therapy: a clinical perspective. Hamilton & London: BC Decker Inc; 2005:20-52.
16 Xing L, et al. Dosimetric effects of patient displacement and collimator and gantry angle misalignment on intensity modulated radiation therapy. Radiother Oncol. 2000;56:97-108.
17 Hwang AB, et al. Can positron emission tomography (PET) or PET/computed tomography (CT) acquired in a nontreatment position be accurately registered to a head-and-neck radiotherapy planning CT? Int J Radiat Oncol Biol Phys. 2009;73(2):578-584.
18 Chen L, et al. MRI-based treatment planning for radiotherapy: dosimetric verification for prostate IMRT. Int J Radiat Oncol Biol Phys. 2004;60(2):636-647.
19 International Commission Radiation Unites and Measurements. ICRU 60: prescribing R.a.RPBTR. Washington, D. C.: International Commission on Radiation Units and Measurements; 1999.
20 Myerson RJ, et al. Elective clinical target volumes for conformal therapy in anorectal cancer: A Radiation Therapy Oncology Group consensus panel contouring atlas. Int J Radiat Oncol Biol Phys. 2008;74(3):824-830.
21 Gregoire V, et al. CT-based delineation of lymph node levels and related CTVs in the node-negative neck: DAHANCA, EORTC, GORTEC, NCIC, RTOG consensus guidelines. Radiother Oncol. 2003;69(3):227-236.
22 Chao M, et al. Automated contour mapping with a regional deformable model. Int J Radiat Oncol Biol Phys. 2008;70:5599-5608.
23 Chao M, et al. Automated contour mapping using sparse volume sampling for 4D radiation therapy. Med Phys. 2007;34:4023-4029.
24 Commowick O, et al. Incorporating statistical measures of anatomical variability in atlas-to-subject registration for conformal brain radiotherapy. Med Image Comput Comput Assist Interv Int Conf Med Image Comput Comput Assist Interv. 2005;8(Pt 2):927-934.
25 Kashani R, et al. Objective assessment of deformable image registration in radiotherapy: a multi-institution study. Med Phys. 2008;35(12):5944-5953.
26 Wang H, et al. Implementation and validation of a three-dimensional deformable registration algorithm for targeted prostate cancer radiotherapy. Int J Radiat Oncol Biol Phys. 2005;61(3):725-735.
27 Goitein M, et al. Multidimensional treatment planning. II: beam’s eye view, back projection and projection through CT sections. Int J Radiat Oncol Biol Phys. 1983;9:789-797.
28 McShan DL, Fraass BA, Lichter AS. Full integration of the beam’s eye view concept into computerized treatment planning. Int J Radiat Oncol Biol Phys. 1990;18:1485-1494.
29 Pugachev A, et al. Role of beam orientation optimization in intensity-modulated radiation therapy. Int J Radiat Oncol Biol Phys. 2001;50(2):551-560.
30 Pugachev A, Xing L. Computer assisted beam orientation selection in IMRT. Phys Med Biol. 2001;46:2467-2476.
31 Pugachev A, Xing L. Pseudo beam’s-eye-view as applied to beam orientation selection in intensity-modulated radiation therapy. Int J Radiat Oncol Biol Phys. 2001;51(5):1361-1370.
32 Pugachev A, Xing L. Incorporating prior knowledge into beam orientation optimization. Int J Radiat Oncol Biol Phys. 2002;54:1565-1574.
33 Schreibmann E, Xing L. Dose-volume based ranking of incident beam direction and its utility in facilitating IMRT beam placement. Int J Radiat Oncol Biol Phys. 2005;63(2):584-593.
34 Pickett B, et al. Optimization of the oblique angles in the treatment of prostate cancer during six-field conformal radiotherapy. Med Dosim. 1994;19(4):237-254.
35 Vicini FA, et al. Optimizing breast cancer treatment efficacy with intensity-modulated radiotherapy. Int J Radiat Oncol Biol Phys. 2002;54(5):1336-1344.
36 Kestin LL, et al. Intensity modulation to improve dose uniformity with tangential breast radiotherapy: initial clinical experience. Int J Radiat Oncol Biol Phys. 2000;48(5):1559-1568.
37 Mayo CS, Urie MM, Fitzgerald TJ. Hybrid IMRT plans—concurrently treating conventional and IMRT beams for improved breast irradiation and reduced planning time. Int J Radiat Oncol Biol Phys. 2005;61(3):922-932.
38 Brahme A. Optimization of stationary and moving beam radiation therapy techniques. Radiother Oncol.. 1988;12:129-140.
39 Bortfeld T, et al. Physical vs. biological objectives for treatment plan optimization. Radiother Oncol. 1996;40(2):185-187.
40 Brahme A. Optimized radiation therapy based on radiobiological objectives. Semin Radiat Oncol. 1999;9(1):35-47.
41 Bortfeld T. Optimized planning using physical objectives and constraints. Semin Radiat Oncol. 1999;9(1):20-34.
42 Shou Z, et al. Quantitation of the a priori dosimetric capabilities of spatial points in inverse planning and its significant implication in defining IMRT solution space. Phys Med Biol. 2005;50(7):1469-1482.
43 Xing L, Chen GTY. Iterative algorithms for inverse treatment planning. Phys Med Biol. 1996;41(2):2107-2123.
44 Yang Y, Xing L. Clinical knowledge-based inverse treatment planning. Phys Med Biol. 2004;49(22):5101-5117.
45 Xia P, et al. A study of planning dose constraints for treatment of nasopharyngeal carcinoma using a commercial inverse treatment planning system. Int J Radiat Oncol Biol Phys. 2004;59(3):886-896.
46 Webb S. Intensity-modulated radiation therapy. In: Series in Medical Physics. Bristol and Philadelphia: Institute of Physics Publishing; 2000.
47 Cotrutz C, Xing L. IMRT dose shaping using regionally variable penalty scheme. Med Phys. 2003;30:544-551.
48 Xing L, et al. Optimization of importance factors in inverse planning. Phys Med Biol. 1999;44(10):2525-2536.
49 Chan LW, et al. Proposed rectal dose constraints for patients undergoing definitive whole pelvic radiotherapy for clinically localized prostate cancer. Int J Radiat Oncol Biol. 2008;72(1):69-77.
50 Odrazka K, et al. Comparison of rectal dose-volume constraints for IMRT prostate treatment planning. Phys Med. 2005;21(4):129-135.
51 Hunt MA, et al. Geometric factors influencing dosimetric sparing of the parotid glands using IMRT. Int J Radiat Oncol Biol Phys. 2006;66(1):296-304.
52 Bortfeld TR, et al. X-ray field compensation with multileaf collimators. Int J Radiat Oncol Biol Phys. 1994;28(3):723-730.
53 Galvin JM, Chen XG, Smith RM. Combining multileaf fields to modulate fluence distributions. Int J Radiat Oncol Biol Phys. 1993;27(3):697-705.
54 Spirou SV, Chen-Shou C. Generation of arbitrary intensity profiles by combining the scanning beam with dynamic multileaf collimation. Med Phys. 1996;23(1):1-8.
55 Xia P, Verhey LJ. Multileaf collimator leaf sequencing algorithm for intensity modulated beams with multiple static segments. Med Phys. 1998;25(8):1424-1434.
56 Beavis A, et al. Optimization of the intensity map, in level and resolution, for the delivery of IMRT. Med Phys. 1999;26(6):1087.
57 Crooks SM, et al. Minimizing delivery time and monitor units in static IMRT by leaf-sequencing. Phys Med Biol. 2002;47(17):3105-3116.
58 Galvin JM, et al. Implementing IMRT in clinical practice: a joint document of the American Society for Therapeutic Radiology and Oncology and the American Association of Physicists in Medicine. Int J Radiat Oncol Biol Phys. 2004;58(5):1616-1634.
59 Mohan RA, et al. The impact of fluctuations in intensity patterns on the number of monitor units and the quality and accuracy of intensity modulated radiotherapy. Med Phys. 2000;27(6):1226-1237.
60 Hall EJ, Wuu CS. Radiation-induced second cancers: the impact of 3D-CRT and IMRT. Int J Radiat Oncol Biol Phys.. 2003;56(1):83-88.
61 Kamath S, et al. Leaf sequencing algorithms for segmented multileaf collimation. Phys Med Biol. 2003;48(3):307-324.
62 Langer M, Thai V, Papiez L. Improved leaf sequencing reduces segments or monitor units needed to deliver IMRT using multileaf collimators. Med Phys.. 2001;28(12):2450-2458.
63 Siebers JV, et al. Incorporating multi-leaf collimator leaf sequencing into iterative IMRT optimization. Med Phys. 2002;29(6):952-959.
64 Chui C-S, et al. A simplified intensity modulated radiation therapy technique for the breast. Med Phys. 2002;29(4):522-529.
65 Sun X, Xia P. A new smoothing procedure to reduce delivery segments for static MLC-based IMRT planning. Med Phys. 2004;31(5):1158-1165.
66 Coselmon MM, et al. Improving IMRT delivery efficiency using intensity limits during inverse planning. Med Phys. 2005;32(5):1234-1245.
67 Keller-Reichenbecher MA, et al. Intensity modulation with the “step and shoot” technique using a commercial MLC: a planning study. Multileaf collimator. Int J Radiat Oncol Biol Phys. 1999;45(5):1315-1324.
68 Seco J, Evans PM, Webb S. An optimization algorithm that incorporates IMRT delivery constraints. Phys Med Biol. 2002;47(6):899-915.
69 Bedford JL, Webb S. Constrained segment shapes in direct-aperture optimization for step-and-shoot IMRT. Med Phys. 2006;33(4):944-958.
70 Jiang Z, et al. An examination of the number of required apertures for step-and-shoot IMRT. Phys Med Biol. 2005;50(23):5653-5663.
71 Shepard DM, et al. Direct aperture optimization: a turnkey solution for step-and-shoot IMRT. Med Phys. 2002;29:1007-1018.
72 Van Asselen B, et al. Intensity-modulated radiotherapy of breast cancer using direct aperture optimization. Radiother Oncol.. 2006;79(2):162-169.
73 Ludlum E, Xia P. Comparison of IMRT planning with two-step and one-step optimization: a way to simplify IMRT. Phys Med Biol. 2008;53(3):807-821.
74 Zhu L, et al. Using total-variation regularization for intensity modulated radiation therapy inverse planning with field-specific numbers of segments. Phys Med Biol. 2008;53(23):6653-6672.
75 CX Yu, et al. A method for implementing dynamic photon beam intensity modulation using independent jaws and a multileaf collimator. Phys Med Biol. 1995;40(5):769-787.
76 Crooks SM, et al. Aperture modulated arc therapy. Phys Med Biol. 2003;48(10):1333-1344.
77 Wong E, Chen JZ, Greenland J. Intensity-modulated arc therapy simplified. Int J Radiat Oncol Biol Phys. 2002;53(1):222-235.
78 Otto K. Volumetric modulated arc therapy: IMRT in a single gantry arc. Med Phys. 2008;35(1):310-317.
79 Ma Y, et al: Beam’s-eye-view dosimetrics guided inverse planning for aperture modulated arc therapy, Int J Radiat Oncol Biol Phys (in press).
80 Chang SX, et al. Compensators: an alternative IMRT delivery technique. J Appl Clin Med Phys. 2004;5(3):15-36.
81 Chang SX, et al. A comparison of different intensity modulation treatment techniques for tangential breast irradiation. Int J Radiat Oncol Biol Phys. 1999;45(5):1305-1314.
82 Kapatoes JM, et al. Delivery verification in sequential and helical tomotherapy. Phys Med Biol. 1999;44(7):1815-1841.
83 Sykes JR, Williams PC. An experimental investigation of the tongue and groove effect for the Philips multileaf collimator. Phys Med Biol. 1998;43(10):3157-3165.
84 LoSasso T, Chen-Shou C, Ling CC. Physical and dosimetric aspects of a multileaf collimation system used in the dynamic mode for implementing intensity modulated radiotherapy. Med Phys. 1998;25(10):1919-1927.
85 Chui CS, et al. Delivery of intensity-modulated radiation therapy with a conventional multileaf collimator: comparison of dynamic and segmental methods. Med Phys. 2001;28(12):2441-2449.
86 Wang X, et al. Dosimetric verification of intensity-modulated fields. Med Phys. 1996;23(3):317-327.
87 Chen-Shou C, LoSasso T, Spirou S. Dose calculation for photon beams with intensity modulation generated by dynamic jaw or multileaf collimations. Med Phys. 1994;21(8):1237-1244.
88 LoSasso T, Chen-Shou C, Ling CC. Comprehensive quality assurance for the delivery of intensity modulated radiotherapy with a multileaf collimator used in the dynamic mode. Med Phys. 2001;28(11):2209-2219.
89 Hunt MA, et al. Treatment planning and delivery of intensity-modulated radiation therapy for primary nasopharynx cancer. Int J Radiat Oncol Biol Phys. 2001;49(3):623-632.
90 Mu G, Ludlum E, Xia P. Impact of MLC leaf position errors on simple and complex IMRT plans for head and neck cancer. Phys Med Biol. 2008;53(1):77-88.
91 Bayouth JE, Morrill SM. MLC dosimetric characteristics for small field and IMRT applications. Med Phys. 2003;30(9):2545-2552.
92 Bayouth JE, Wendt D, Morrill SM. MLC quality assurance techniques for IMRT applications. Med Phys. 2003;30(5):743-750.
93 Ma CM, et al. Monitor unit calculation for Monte Carlo treatment planning. Phys Med Biol. 2004;49(9):1671-1687.
94 Zygmanski P, et al. Maximum MLC opening effect in dynamic delivery of IMRT: Leaf-positional analysis. J Appl Clin Med Phys. 2005;6(2):33-43.
95 Stell AM, et al. An extensive log-file analysis of step-and-shoot intensity modulated radiation therapy segment delivery errors. Med Phys. 2004;31(6):1593-1602.
96 Zygmanski P, et al. Dependence of fluence errors in dynamic IMRT on leaf-positional errors varying with time and leaf number. Med Phys. 2003;30(10):2736-2749.
97 Litzenberg DW, Moran JM, Fraass BA. Verification of dynamic and segmental IMRT delivery by dynamic log file analysis. J Appl Clin Med Phys. 2002;3(2):63-72.
98 Yang Y, Xing L. Incorporating leaf transmission and header scatter corrections into MLC leaf sequences for IMRT. Int J Radiat Oncol Biol Phys. 2003;55:1121-1134.
99 Sharpe MB, et al. Monitor unit settings for intensity modulated beams delivered using a step-and-shoot approach. Med Phys. 2000;27(12):2719-2725.
100 Cheng CW, Das IJ, Huq MS. Lateral loss and dose discrepancies of multileaf collimator segments in intensity modulated radiation therapy. Med Phys. 2003;30(11):2959-2968.
101 Cheng CW, Das IJ, Ndlovu AM. Suppression of dark current radiation in step-and-shoot intensity modulated radiation therapy by the initial pulse-forming network. Med Phys. 2002;29(9):1974-1979.
102 Cheng CW, Das IJ. Comparison of beam characteristics in intensity modulated radiation therapy (IMRT) and those under normal treatment condition. Med Phys. 2002;29(2):226-230.
103 Kang SK, et al. Dosimetric characteristics of linear accelerator photon beams with small monitor unit settings. Med Phys. 2008;35(11):5172-5178.
104 Kung J, Chen G. A monitor unit verification calculation in intensity modulated radiotherapy as a dosimetric quality assurance. Med Phys. 2000;27:2226-2230.
105 Beavis A, et al. Slide and shoot: a new method for MLC delivery of IMRT. In: The Use of Computers in Radiation Therapy. Heidelberg, Germany: Springer-Verlag; 2000.
106 Yang Y, et al. Independent dosimetric calculation with inclusion of head scatter and MLC transmission for IMRT. Med Phys. 2003;30:2937-2947.
107 Jin H, et al. Dose-volume thresholds and smoking status for the risk of treatment-related pneumonitis in inoperable non-small cell lung cancer treated with definitive radiotherapy. Radiother Oncol. 2008;91(3):427-432.
108 Yom SS, et al. Initial evaluation of treatment-related pneumonitis in advanced-stage non-small-cell lung cancer patients treated with concurrent chemotherapy and intensity-modulated radiotherapy. Int J Radiat Oncol Biol Phys. 2007;68(1):94-102.
109 Murdoch-Kinch CA, et al. Dose-effect relationships for the submandibular salivary glands and implications for their sparing by intensity modulated radiotherapy. Int J Radiat Oncol Biol Phys. 2008;72(2):373-382.
110 Eisbruch A, et al. Xerostomia and its predictors following parotid-sparing irradiation of head-and-neck cancer. Int J Radiat Oncol Biol Phys. 2001;50(3):695-704.
111 Allen AM, et al. Fatal pneumonitis associated with intensity-modulated radiation therapy for mesothelioma. Int J Radiat Oncol Biol Phys. 2006;65(3):640-645.
112 Niemierko A. Reporting and analyzing dose distributions: a concept of equivalent uniform dose. Med Phys. 1997;24(1):103-110.
113 Park CS, et al. Method to account for dose fractionation in analysis of IMRT plans: modified equivalent uniform dose. Int J Radiat Oncol Biol Phys. 2005;62(3):925-932.
114 Lyman JT. Complication probability as assessed from dose volume histograms. Radiat Res. 1985;8:104-113.
115 Kutcher GJ, et al. Histogram reduction method for calculating complication probabilities for three-dimensional treatment planning evaluations. Int J Radiat Oncol Biol Phys. 1991;21(1):137-146.
116 Burman C, et al. Fitting of normal tissue tolerance data to an analytic function. Int J Radiat Oncol Biol Phys. 1991;21(1):123-135.
117 Kutcher G.J, Burman C. Calculation of complication probability factors for non-uniform normal tissue irradiation: the effective volume method. Int J Radiat Oncol Biol Phys. 1989;16(6):1623-1630.
118 Niemierko A, Goitein M. Implementation of a model for estimating tumor control probability for an inhomogeneously irradiated tumor. Radiother Oncol. 1993;29:140-147.
119 Niemierko A, Goitein M. Modeling of normal tissue response to radiation: the critical volume model. Int J Radiat Oncol Biol Phys. 1993;25(1):135-145.
120 Xing L, et al. Overview of image-guided radiation therapy. Med Dosim. 2006;31(2):91-112.
121 Hoppe BS, et al. Postoperative intensity-modulated radiation therapy for cancers of the paranasal sinuses, nasal cavity, and lacrimal glands: technique, early outcomes, and toxicity. Head Neck. 2008;30(7):925-932.
122 Huang K, et al. Intensity-modulated chemoradiation for treatment of stage III and IV oropharyngeal carcinoma: the University of California–San Francisco experience. Cancer. 2008;113(3):497-507.
123 Lee L, Le Q, Xing L. Retrospective IMRT dose reconstruction based on cone-beam computed tomography and the MLC positional log-file recorded during treatment. Int J Radiat Oncol Biol Phys. 2008;70(2):634-644.
124 Lee L, Mao W, Xing L. The use of EPID-measured leaf sequence files for IMRT dose reconstruction in adaptive radiation therapy. Med Phys. 2008;35(11):5019-5029.
125 Low DA, et al. A method for the reconstruction of four-dimensional synchronized CT scans acquired during free breathing. Med Phys. 2003;30(6):1254-1263.
126 Pan T, et al. 4D-CT imaging of a volume influenced by respiratory motion on multi-slice CT. Med Phys. 2004;31(2):333.
127 Vedam SS, et al. Acquiring a four-dimensional computed tomography dataset using an external respiratory signal. Phys Med Biol. 2003;48(1):45.
128 Li T, et al. Radiation dose reduction in four-dimensional computed tomography. Med Phys. 2005;32(12):3650-3660.
129 Li T, et al. Model-based image reconstruction for four-dimensional PET. Med Phys. 2006;33:1288-1298.
130 Thorndyke B, Koong A, Xing L. Reducing respiratory motion artifacts in radionuclide imaging through retrospective stacking: a simulation study. Linear Algebra Appl. 2008;428:1325-1344.
131 Thorndyke B, et al. Reducing respiratory motion artifacts in positron emission tomography through retrospective stacking. Med Phys. 2006;33(7):2632-2641.
132 Sonke JJ, et al. Respiratory correlated cone beam CT. Med Phys. 2005;32(4):1176-1186.
133 Li T, Xing L. Optimizing 4D cone-beam CT acquisition protocol for external beam radiotherapy. Int J Radiat Oncol Biol Phys. 2007;67(4):1211-1219.
134 Li T, et al. Four-dimensional cone-beam CT using an on-board imager. Med Phys. 2006;33:3825-3833.
135 Li T, Koong A, Xing L. Enhanced 4D cone-beam computed tomography using an on-board imager. Med Phys. 2007;34:3688-3695.
136 Yan D, et al. Adaptive modification of treatment planning to minimize the deleterious effects of treatment setup errors. Int J Radiat Oncol Biol Phys. 1997;38(1):197-206.
137 De la Zerda A, Armbruster B, Xing L. Formulating adaptive radiation therapy (ART) treatment planning into a closed-loop control framework. Phys Med Biol. 2007;52(14):4137-4153.
138 Hansen EK, et al. Repeat CT imaging and replanning during the course of IMRT for head-and-neck cancer. Int J Radiat Oncol Biol Phys. 2006;64(2):355-362.
139 Hansen EK, et al. Image-guided radiotherapy using megavoltage cone-beam computed tomography for treatment of paraspinous tumors in the presence of orthopedic hardware. Int J Radiat Oncol Biol Phys. 2006;66(2):323-326.
140 Ludlum E, et al. An algorithm for shifting MLC shapes to adjust for daily prostate movement during concurrent treatment with pelvic lymph nodes. Med Phys. 2007;34(12):4750-4756.
141 Chao M, et al. Towards adaptive radiation therapy: image-based tumor shrinkage modeling in head and neck cancer. Int J Radiat Oncol Biol Phys. 2008;70:5599-5608.
142 Li T, et al. Motion correction for improved target localization with on-board cone-beam computed tomography. Phys Med Biol. 2006;51(2):253-267.
143 Xing L, Siebers J, Keall P. Computational challenges for image-guided radiation therapy: framework and current research. Semin Radiat Oncol. 2007;17(4):245-257.
144 Chen Z, et al. The influence of scatter on the design of optimized intensity modulations. Med Phys. 1995;22(11 Pt 1):1727-1733.
145 Niemierko A, Urie M, Goitein M. Optimization of 3D radiation therapy with both physical and biological end points and constraints. Int J Radiat Oncol Biol Phys. 1992;23(1):99-108.
146 Yang Y, Xing L. Towards biologically conformal radiation therapy (BCRT): selective IMRT dose escalation under the guidance of spatial biology distribution. Med Phys. 2005;32:1473-1484.
147 Yang Y, Xing L. Optimization of radiation dose-time-fractionation scheme with consideration of tumor specific biology. Med Phys. 2005;32:3666-3677.
148 Levegrun S, et al. Fitting tumor control probability models to biopsy outcome after three-dimensional conformal radiation therapy of prostate cancer: pitfalls in deducing radiobiologic parameters for tumors from clinical data. Int J Radiat Oncol Biol Phys. 2001;51(4):1064-1080.
149 Levegrun S, et al. Analysis of biopsy outcome after three-dimensional conformal radiation therapy of prostate cancer using dose-distribution variables and tumor control probability models. Int J Radiat Oncol Biol Phys. 2000;47(5):1245-1260.
150 Skwarchuk MW, et al. Late rectal toxicity after conformal radiotherapy of prostate cancer (I): multivariate analysis and dose-response. Int J Radiat Oncol Biol Phys. 2000;47(1):103-113.
151 Jackson A, et al. Analysis of clinical complication data for radiation hepatitis using a parallel architecture model. Int J Radiat Oncol Biol Phys. 1995;31(4):883-891.
152 Mohan R, Wang X, Jackson A. Optimization of 3-D conformal radiation treatment plans. Front Radiat Ther Oncol. 1996;29:86-103.
153 Wang XH, et al. Optimization of intensity-modulated 3D conformal treatment plans based on biological indices. Radiother Oncol. 1995;37(2):140-152.
154 Martel MK, Sandler HM, et al. Dose-volume complication analysis for visual pathway structures on patients with advanced paranasal sinus tumors. Int J Radiat Oncol Biol Phys. 1993;38:273-284.
155 Chang J, et al. Relative profile and dose verification of intensity-modulated radiation therapy. Int J Radiat Oncol Biol Phys. 2000;47(1):231-240.
156 Ling CC, et al. Towards multidimensional radiotherapy (MD-CRT): biological imaging and biological conformality. Int J Radiat Oncol Biol Phys. 2000;47:551-560.
157 Mah D, et al. Technical aspects of the deep inspiration breath-hold technique in the treatment of thoracic cancer. Int J Radiat Oncol Biol Phys. 2000;48(4):1175-1185.
158 Xing L, et al. Inverse planning for functional image-guided IMRT. Phys Med Biol. 2002;47(10):3567-3578.