Chapter 44  The Cincinnati Knee Rating System
INTRODUCTION
The assessment of outcome following the treatment of knee injuries and disorders has received tremendous attention in the sports medicine literature. Over 40 knee rating instruments have been published since the mid 1980s; however, only a few have undergone rigorous testing of the psychometric properties of reliability, validity, and responsiveness.26,39,56 Historically, early scoring scales and systems designed to rate the outcome of anterior cruciate ligament (ACL) reconstruction were introduced into the medical community without undergoing an assessment of these properties.15,19,32,34,40,63,66 With no consensus regarding which variables to include in the measurement of patient outcome, it is not surprising that studies that compared the results of ACL reconstruction using different rating systems showed distinct differences in results and conclusions.1,6,7,22,55,57
In order to provide a comprehensive analysis of the knee condition and its impact on activity and function after ACL reconstruction (and other surgical procedures), clinical investigators have suggested that rating systems measure a variety of symptoms, sports and daily activity functions, patient satisfaction, and objective physical findings.1,57,65 Only two such systems are currently available that have established reliability, validity, and responsiveness: the Cincinnati Knee Rating System (CKRS)4,43 and the International Knee Documentation Committee (IKDC) system.23,24 Each of these rating systems measures pain, swelling, giving-way, functions of sports and daily activities, sports activity levels, patient perception of the knee condition, range of knee motion, joint effusion, tibiofemoral and patellofemoral crepitus, knee ligament subluxations, compartment narrowing on radiographs, and lower limb symmetry during single-leg hop tests.
The authors agree with Zarins65 that although the subjective assessment of symptoms and functional limitations is important, the final outcome of a specific treatment must also take into account objective measures that are appropriate for the diagnosis or injury under study. The determination of patient outcome according to subjective questionnaire-based data only59 does not provide a complete understanding of the ability of the treatment protocol to restore normal knee function. Indeed, knee rating scales exists in which a patient may be rated as “excellent” even though an ACL reconstruction failed to restore normal or nearly normal knee stability, which is one of the major goals of the procedure.63 It is well known for this injury that in the short-term, patients may function well, but over time, the knee joint deteriorates and functional limitations increase to frequently affect daily activities.2,5,9,52 In addition, investigators should use instruments sensitive to the condition under study. Generic health or quality of life questionnaires have limited usefulness in studies comprising patients with a specific diagnosis and, therefore, should be used in addition to disease-specific rating systems. This chapter describes the rationale and methodology for the major components of the CKRS. The IKDC system is discussed in detail in Chapter 45, The International Knee Documentations Committee (IKOC) Rating System.
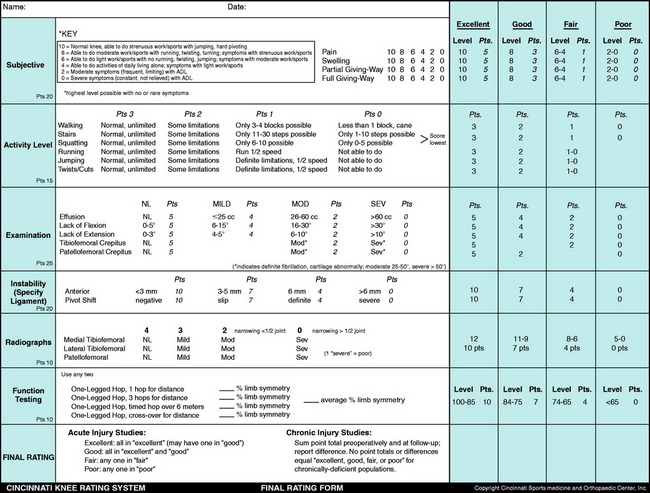
The CKRS was first published over 20 years ago in concert with the largest ACL natural history study conducted during that time period.52 In the early 1980s, the dilemma of the appropriate treatment for complete ACL ruptures stemmed in part from limited knowledge of the functional limitations caused by the injury and the lack of a rigorous rating system that graded symptoms and limitations according to the specific type of activity during which they occurred. Over the ensuing decade, additional scales and modifications were developed in order for the CKRS to provide a comprehensive assessment of the knee condition.4,43,44,51 An overall rating scheme was devised to provide a final rating, which is available in either a numerical or a categorical manner, as is discussed later. The major components of the CKRS are shown in Table 44-1. This system is one of the most commonly used instruments in the orthopaedic literature to measure the results of ACL reconstruction and has been considered a “gold standard” in the development and content and criterion validity analyses of other knee rating scales.21,23,25,36 The CKRS was initially designed and validated in athletically active populations; however, it is also useful for patients who have undergone other operative procedures such as articular cartilage restorative procedures, meniscus repairs or transplants, osteotomies, or patellofemoral procedures.
REVIEW OF ANALYSES USED TO MEASURE PSYCHOMETRIC PROPERTIES OF OUTCOME INSTRUMENTS
Reliability is the extent to which scores on an instrument are reproducible and is measured either between subjects (test-retest) or between observers (interobserver). Patients complete questionnaires at separate time periods; a minimum 1-week interval was recommended by Deyo and coworkers12 to elapse between questionnaire administration. Reliability is measured with product-moment correlations and intraclass correlation coefficients (ICCs). ICC is the most commonly used statistic in modern studies and is calculated by
Correlations between test-retest data should be greater than 0.70, which is considered the standard for adequate reliability for questionnaires.54 The use of ICC rather than the more common Pearson correlation coefficient was suggested by Deyo and coworkers12 and Lin31 to provide a more sensitive assessment of variability within data. The problem that can occur with the Pearson correlation coefficient is that duplicate measurements may be systematically different yet correlate highly and, as a result, be falsely interpreted. For example, if every patient scored exactly 5 points lower on a scale on the second administration, the test-retest correlation would be a perfect 1.0, despite the fact that every patient had a lower score. The ICC handles this problem because it not only assesses the strength of the correlation but also determines whether the slope and intercept in the regression line of test-retest data vary from those expected with duplicate results. In our example, the ICC would correspondingly be reduced to demonstrate the systematic difference between the test-retest data.
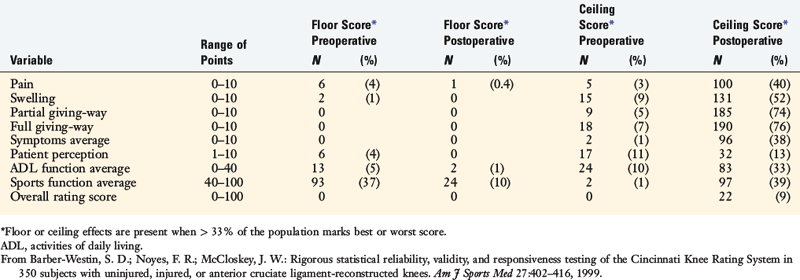
Several measures have been described to determine the validity of an instrument, including content, construct, item-discriminant, convergent, and criterion. In general, validity is the psychometric criterion in which an instrument is tested to determine its ability to actually measure what it claims to measure.27 Content validity is the extent to which a question or instrument represents the area of interest and has been described in various manners. Face validity, one example of content validity, is determined by consulting both patients and experienced medical professionals regarding the development of a scale’s questions and their relevance to the diagnosis under study.16 For instance, for ACL reconstruction investigations, a questionnaire with good face validity would be believed by patients, surgeons, and therapists to measure the common problems caused by this injury, such as pain and instability. This represents a subjective analysis that is not statistically analyzed. Another method to determine content validity is to calculate floor (worst result) and ceiling (best result) effects.37,62 Scales in which the majority of patients score either the highest level or the lowest level do not allow for an assessment of deterioration or improvement over time. Floor and ceiling effects are present when greater than 30% of the population marks either the best possible or the worst possible scores on a scale.28
Construct validity is the extent to which a measure corresponds to expected theoretical concepts or hypotheses regarding the diagnosis. An instrument will accurately differentiate patients whose outcome is expected to vary with regard to certain characteristics known to the disease process.14,61 Researchers develop hypotheses based on prior research and clinical experience in which the questionnaire scores are expected to be significantly different between selected patient groups. The hypotheses are confirmed using the F and T-test at the level of P < .01. In addition, construct validity is determined by conducting Pearson product-moment correlation coefficients between scale items and either previously validated instruments or physician and patient assessments. A moderately strong coefficient is proved at R > 0.60.
Item-discriminant (or –divergent) validity is present when variables hypothesized to be dissimilar (such as patient age and anteroposterior knee [AP] displacements) are indeed found to be statistically unrelated.14,38 Pearson correlations are performed to detect statistical dissimilarities, proven at R = 0.28 or less. In the opposite manner, convergent validity is present when variables believed to be similar within the questionnaire are indeed found to be statistically similar.
Internal consistency is determined by a coefficient α greater than 0.60.28 The underlying concept of this measure is that the consistency with which a patient answers from one question to the next can be used to provide an estimate of reliability for the total test score.41 A high coefficient α indicates that the items in a questionnaire are consistently measured or are homogeneous with regard to the measurement of the underlying diagnosis or attribute.30
Responsiveness, or the ability of an instrument to detect clinically important change, is determined by calculating standardized response means (SRM) and effect sizes (ES) of the selected instrument categories. The magnitude of the SRM (mean change in score from preoperative to follow-up/SD of change in score)18 and the ES (mean change in score from preoperative to follow-up/SD of preoperative score)29 are interpreted using the Cohen standard of greater than 0.20 for small effects, greater than 0.50 for moderate effects, and greater than 0.80 for large effects.10 This analysis provides a more precise indication of the change in results over time from those obtained by the standard student T-test. An instrument’s sensitivity simply denotes its ability to measure any change, which by definition does not necessarily indicate one that is clinically meaningful.27
COMPONENTS OF THE CKRS
Rating of Symptoms
Pain, swelling, partial giving-way, and full giving-way are the major knee symptoms assessed in ACL investigations. Authors have proposed a variety of methods for the measurement of symptoms, from a binary system (“yes” or “no”19,34), to visual analog scales,17,21,39 to a severity rating (such as mild, moderate, severe) which can be done either alone32 or in combination with activities (such as “slight after strenuous sports”66).15,32,56,66
In 1983, Noyes and associates52 proposed that the assessment of knee symptoms should be scored according to the activity during which they occurred: strenuous sports, recreational sports, or walking. This rationale provided an understanding of the impact of a chronically deficient ACL-deficient knee, because 30% of 103 patients reported pain with walking alone, 47% with recreational sports, and 69% with strenuous sports in the authors’ natural history study.
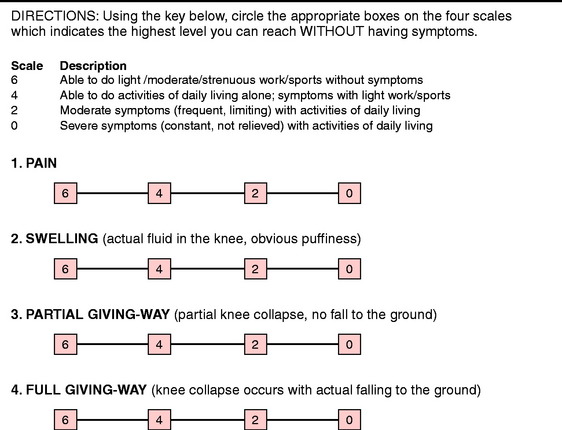
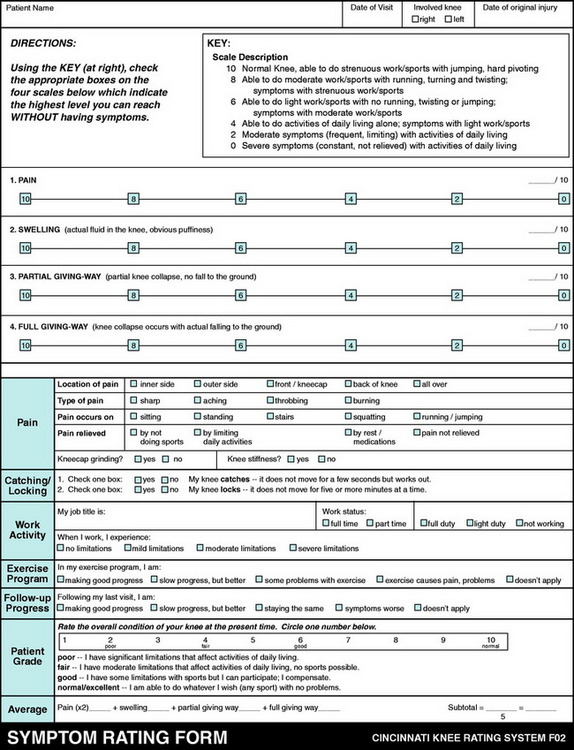
The assessment of symptoms was later refined and the scale increased to a six-level gradient shown in Figure 44-1.43,44,50 Points are awarded for the highest activity level in which the patient is able to participate without incurring the symptom (Appendix A). If the symptom is present with activities of daily living, it is rated as either moderate (frequent, limiting) or severe (constant, not relieved). Definitions are provided for terms that might otherwise be ambiguous to patients, such as “moderate” sports (running, turning, twisting) and “strenuous” sports (jumping, hard pivoting).
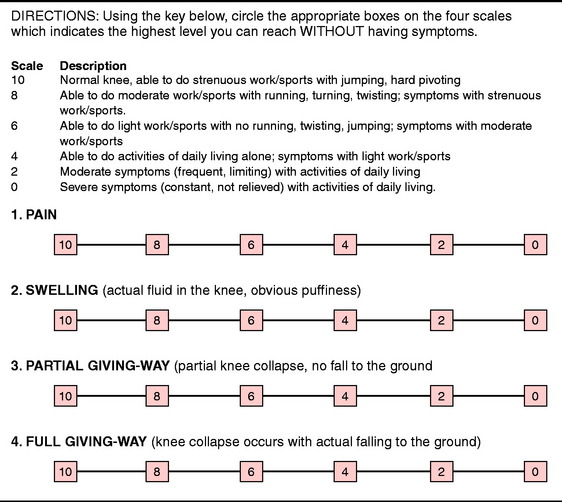
FIGURE 44-1 Symptom Rating Scale.
(From Barber-Westin, S. D.; Noyes, F. R.; McCloskey, J. W.: Rigorous statistical reliability, validity, and responsiveness testing of the Cincinnati Knee Rating System in 350 subjects with uninjured, injured, or anterior cruciate ligament-reconstructed knees. Am J Sports Med 27:402–416, 1999.)
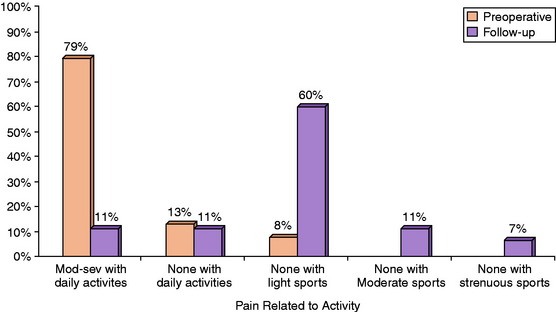
When reporting symptoms before and after surgery, a distribution of the percentage of patients in each of the six levels should be shown (along with a mean and SD) for both time periods. An example is shown in Figure 44-2 for a group of patients who received a meniscus transplant.48 The data were also expressed in the body of the text as “the mean preoperative Cincinnati Knee Rating Scale pain score of 2.5 points (range, 0–6 points) improved to a mean of 5.8 points (range, 0–10 points) at follow-up (P < .0001). Before the meniscus allograft, thirty patients (79%) had moderate to severe pain with daily activities but at follow-up, only four patients (11%) had pain with daily activities.”48
One problem may occur in the rating of symptoms when patients have not attempted to return to strenuous sports activities. In these situations, a potential bias may occur if the patient or clinician attempts to project the correct symptom level based on a hypothetical answer. For instance, if a patient returned to bicycling or swimming and had no pain with those activities, then the pain score awarded would be a level 6 (see Fig. 44-1). However, if the patient is asked whether she or he believes pain would occur with level 8 activities (running, twisting, turning) and she or he responds that it probably would not occur, a bias would occur if this score was assigned without further verification that this was indeed true. This is often the case with the symptom of giving-way, because patients frequently return asymptomatically to level 6 or 8 activities postoperatively, but state that they participated a few times at level 10 activities (jumping, hard pivoting) without problems. Points are awarded only with a reasonable basis for the assessment and not speculated by the patient as to the level that may be possible.
Second, the clinician may use the modified symptom rating scale that was first introduced in an investigation of patients with varus osseous malalignment and ACL deficiency who were treated with multiple operative procedures.45 This modified scale consists of a four-level gradient. The levels of 0, 2, and 4 are the same as the original scale shown in Figure 44-1. The fourth and highest level (level 6) indicates that some type of sports participation is possible without the symptom (Fig. 44-3). This modified scale is intended for studies in which the majority of patients do not return to moderate or strenuous athletics indicated in levels 8 and 10. The reliability of this modified scale was previously shown to be adequate for patients and normal subjects.4 However, clinicians should be aware that the modified scales might have reduced sensitivity, especially if the results of a study that used the modified scale are compared with another study that used the original scale. This pertains only to the individual symptom results. The effect of the modified scale on the overall rating score, described later in this chapter, is small and has only a negligible impact when comparing the data of the overall scores between different populations.
Even though there is always the potential for a bias to exist regarding the scoring of subjective symptoms, the CKRS format allows for an accurate assessment of the activity levels the patients returned to on a routine basis. The scale was designed to not award points if a patient participates at a high activity level but has symptoms, thereby fulfilling the criteria of the “knee abuser.”52
Rating of Patient Perception of the Knee Condition
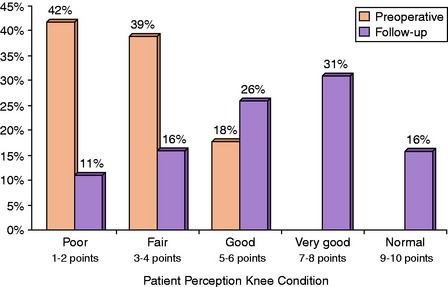
Modern knee rating systems incorporate some form of patient satisfaction, or rating of the patient’s perception of the knee condition, into the assessment of clinical outcome.4,23 In the CKRS, patients are asked to rate the overall condition of the knee by circling a number on a scale from 1 to 10 (Fig. 44-4). Four descriptors are provided to assist the patient in understanding the meaning of the numerical scale. Under the number 2 is the term “poor,” defined as “I have significant limitations that affect activities of daily living,” whereas under the number 10 are the terms “normal/excellent,” defined as “I am able to do whatever I wish (any sport) with no problems” (see Appendix A). For data reporting purposes, a distribution of responses is shown in a five-level gradient. Responses under numbers 1 and 2 are termed “poor”; those under numbers 3 and 4, “fair”; those under numbers 5 and 6, “good”; those under numbers 7 and 8, “very good”; and those under numbers 9 and 10, “normal.”

FIGURE 44-4 Patient Perception of the Knee Condition.
(From Barber-Westin, S. D.; Noyes, F. R.; McCloskey, J. W.: Rigorous statistical reliability, validity, and responsiveness testing of the Cincinnati Knee Rating System in 350 subjects with uninjured, injured, or anterior cruciate ligament-reconstructed knees. Am J Sports Med 27:402–416, 1999.)
An example is shown in Figure 44-5 for a group of patients who received a meniscus transplant.48 The data were also expressed in the body of the text as “the mean preoperative patient perception score of 3.2 points (range, 1–6 points) improved to a mean of 6.2 points (range, 1–9 points) at follow-up (P = .0001). Two patients rated the knee condition as the same, and two as worse.”
Rating of Sports and Daily Function and Activities
In the sports medicine literature, the accurate assessment of sports activity levels and participation is crucial in the determination of the result of an operation or treatment of any knee problem. This is true for many situations. For instance, if a competitive athlete chooses an ACL reconstruction after an acute rupture in order to be able to return to a high activity level, the outcome instrument must be able to precisely define the level of sports participation before and after surgery. Or, if a sedentary individual with moderate arthrosis and giving-way symptoms chooses ACL reconstruction to reduce limitations with daily activities and adopt a more active lifestyle, the instrument must be able to detect a more subtle change (increase) in activity. An instrument must also be able to detect the knee abuser or the patient who returns to athletics and experiences symptoms that may be harmful to the knee joint over the long term.52 These individuals should be sorted from others who returned to athletics without problems. Thus, the accurate assessment of sports participation must span many levels of ability, intensity, and frequency of participation; be able to sort populations according to changes in athletic levels or lifestyle; and identify patients who experience symptoms during athletic activities.
Critical Points RATING OF SPORTS AND DAILY FUNCTION AND ACTIVITIES
Biases, Potential Sources of Error Detected in Other Rating Systems
The CKRS Sports Activity Scale was first introduced in 1989 after an analysis of existing scales at that time period detected multiple biases and potential sources of error in reporting outcome of ACL reconstruction.44 The problems identified included (1) the failure to precisely define sports activity levels according to specific sport and intensity of participation, (2) the failure to sort populations according to overall intensity of athletic participation before and after treatment, (3) the failure to detect and sort from the population patients who return to sports and experience significant symptoms, (4) the combination of work and sports activities into the same scale, and (5) the failure to detect alterations in athletics due to changes in lifestyle and non–knee-related factors.
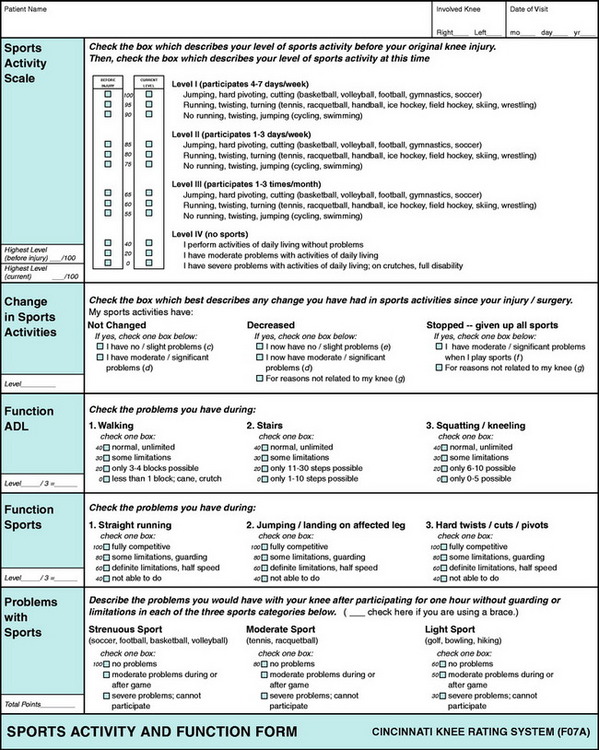
The goal in the development of the Sports Activity Scale was to distinguish among categories of athletic activities in a manner that allowed investigators to apply the rating in a uniform manner to any type of athletic activity. Two criteria were selected to determine this rating. First, the frequency of participation was determined using a four-level gradient that assigned patients to a subgroup depending upon the number of days in a week (or month) of sports participation (Fig. 44-6; see also Appendix A). Second, the knee functions that occurred during various sports activities were determined and sorted into three subgroups. The first subgroup consisted of sports that involved the most difficult knee motions: jumping, hard pivoting, and cutting. The second subgroup included sports that involved running, twisting, and turning. The third subgroup consisted of sports that did not involve running, twisting, or jumping (e.g., swimming and cycling).
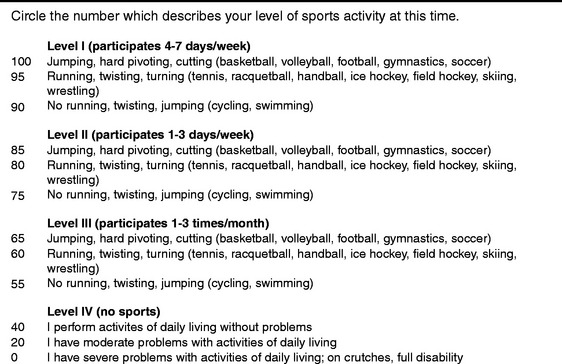
FIGURE 44-6 Sports Activity Scale.
(From Barber-Westin, S. D.; Noyes, F. R.; McCloskey, J. W.: Rigorous statistical reliability, validity, and responsiveness testing of the Cincinnati Knee Rating System in 350 subjects with uninjured, injured, or anterior cruciate ligament-reconstructed knees. Am J Sports Med 27:402–416, 1999.)
The reporting of the patient responses to the Sports Activity Scale may be shown as a distribution according to either frequency or intensity of activities. An example is shown in Table 44-2 from a study on posterior cruciate ligament (PCL) reconstruction.46 An average score should not be calculated from this scale, because the data are categorical in nature.
TABLE 44-2 Example of Sports Activity Levels before and after Posterior Cruciate Ligament Reconstruction
| Type of Sport | Preoperative* | Follow-up* |
|---|---|---|
| Jumping, hard pivoting, cutting | 0 | 2 |
| Running, twisting, turning | 1 | 2 |
| Swimming, bicycling | 7 | 11 |
| None | 11 | 4 |
| Change in Sports Activities | ||
| Increased level, no symptoms | 8 | |
| Same level, no symptoms | 4 | |
| Decreased level, no symptoms | 1 | |
| Playing with symptoms | 2 | |
| No sports, knee-related reasons | 3 | |
| No sports, non–knee-related reasons | 1 |
From Noyes, F. R.; Barber-Westin, S.: Posterior cruciate ligament replacement with a two-strand quadriceps tendon–patellar bone autograft and a tibial inlay technique. J Bone Joint Surg Am 87:1241–1252, 2005.
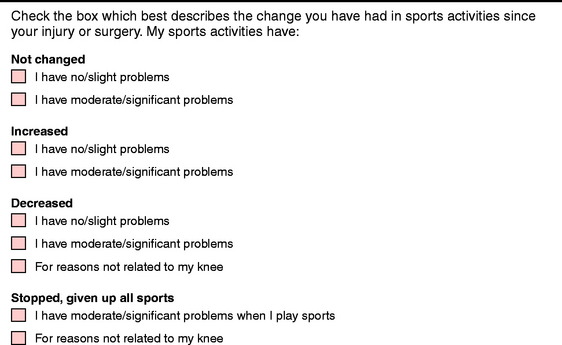
A second component of the assessment of sports activities is the change that occurs in activity levels between treatment periods, the most common being that which occurs between the preoperative and the most recent follow-up evaluations (Fig. 44-7). The format is designed to determine changes in sports activities due to either knee-related or non–knee-related reasons and to detect knee abusers. The data from this analysis are usually displayed in publications in the same table as the Sports Activity Level data (see Table 44-2).
The third component of the assessment of sports activities is the rating of six individual functions that place varying loads on the knee joint (Fig. 44-8). Functions of sports are analyzed separately from those of daily activities to assess limitations in all patients, not just those participating in athletics. Even in cases in which the knee joint is markedly affected, patients are able to indicate the problems encountered with these types of activities. Each function is determined using a four-level gradient whose terminology was selected to decrease the subjective component inherent in this type of analysis. The data obtained for each of the six functions is reported individually using means, SDs, and the distribution of responses in each of the four levels.
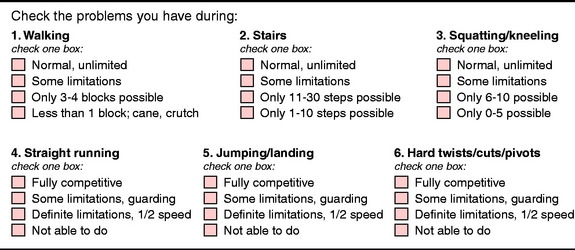
FIGURE 44-8 Activities of Daily Living and Sports Function Scales.
(From Barber-Westin, S. D.; Noyes, F. R.; McCloskey, J. W.: Rigorous statistical reliability, validity, and responsiveness testing of the Cincinnati Knee Rating System in 350 subjects with uninjured, injured, or anterior cruciate ligament-reconstructed knees. Am J Sports Med 27:402–416, 1999.)
Rating of Occupational Activities
Little attention has been given in the sports medicine literature on the effect of ACL reconstruction on work activities. The results of knee operations and treatment programs should be determined by assessing both occupational and sports activities, especially if patients are not involved in athletics because of lack of interest, time, ability, or other factors. In these cases, the ability of an operation or treatment program to successfully return patients to their occupation is a primary determinant of the program’s effectiveness. This determination can only be made with a rating scale for work activities, which is separate from that of sports activities. Scales that combine work and sports into one activity rating do not allow for this analysis to be performed.63
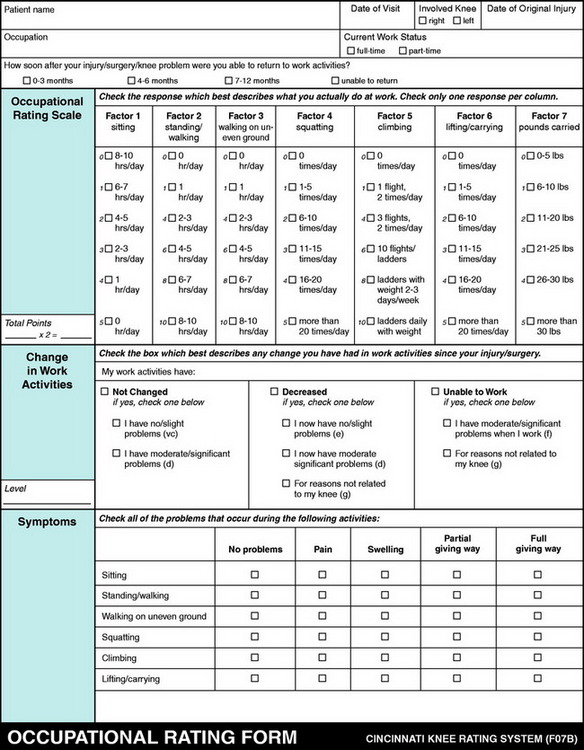
A study was conducted on published occupational rating systems in which several bias and potential sources of error were detected when reporting outcomes of treatment programs.51 One problem was the lack of a scale that sufficiently evaluated the amount of stress placed on the knee at work or whether the knee condition was limiting work activities. Ambiguous terminology, such as light, moderate, and heavy, was frequently encountered to describe occupations. No published scale incorporated a method to detect a change in work status due to factors not related to the knee condition. Based on this study, an Occupational Rating Scale (Fig. 44-9) was created that was composed of seven factors that place varying amounts of load on the lower extremity (see Appendix A). Each factor was graded according to intensity, frequency, and duration of the task required on a daily basis. The factors chosen were commonly used to assess the condition of the knee joint in workers’ compensation evaluations. This scale was found to be more effective and valid in assessing demands of occupations on the lower extremities than scales that used job titles or arbitrary numerical scales.51
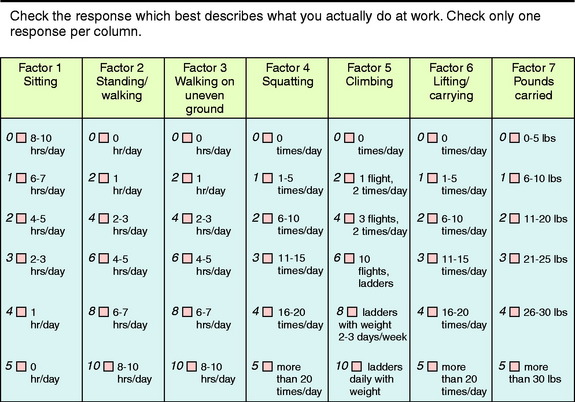
FIGURE 44-9 Occupational Rating Scale.
(From Barber-Westin, S. D.; Noyes, F. R.; McCloskey, J. W.: Rigorous statistical reliability, validity, and responsiveness testing of the Cincinnati Knee Rating System in 350 subjects with uninjured, injured, or anterior cruciate ligament-reconstructed knees. Am J Sports Med 27:402–416, 1999.)
The second major component in the assessment of work activities is the change that occurs in these activities between treatment periods, the most common occurring between preoperative and most recent follow-up evaluations. The format and terminology are the same as those used in the assessment of the change in sports activities between treatment periods, previously described in Figure 44-7. Importantly, the determination is made if changes in work activities are due to knee-related or non–knee-related reasons and if the patient is experiencing symptoms in her or his occupation.
The reliability of the Occupational Rating Scale was demonstrated to be adequate in patients with ACL ruptures, chronic patellofemoral disorders, degenerative meniscal tears, and degenerative knee joint arthritis.4 This scale is useful in the clinic to rate and categorize the occupational status of workers’ compensation patients and in the development of disability ratings. In addition, the Occupational Rating Scale has been used to assess the effect of insurance plans (private vs. workers’ compensation) on the outcome of ACL reconstruction.47,64
Patient History
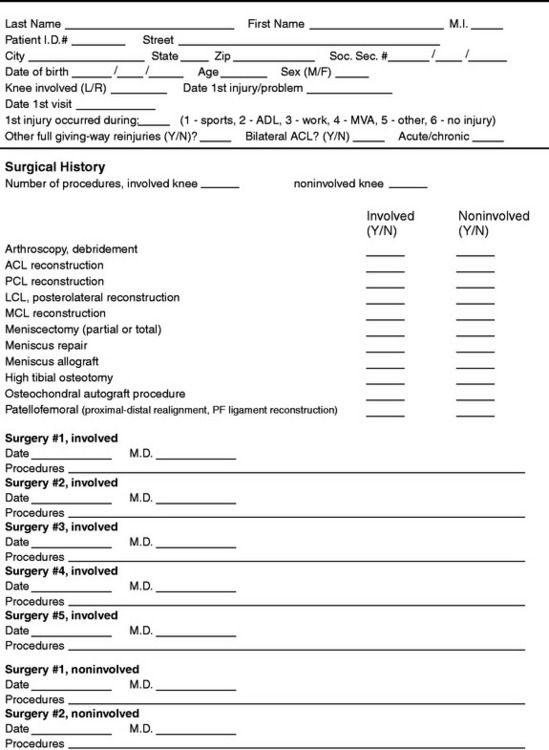
For research purposes, a specific data collection format was developed to ensure that accurate and consistent information is obtained for the patient history (Fig. 44-10). For instance, the coding of major reinjuries and prior surgical procedures to the involved knee is necessary to determine whether the patient meets the established criteria for a particular study. For example, an acute prospective study would include only those patients who have sustained one major injury to the knee and no prior surgical intervention. In such an investigation, patients who had additional injuries or previous surgical procedures to the involved knee would be excluded. In addition, the condition of the noninvolved knee must be taken into consideration. Patients who have problems with the noninvolved knee are sorted into a separate subgroup to determine whether this factor affects the treatment outcome.
Knee Examination
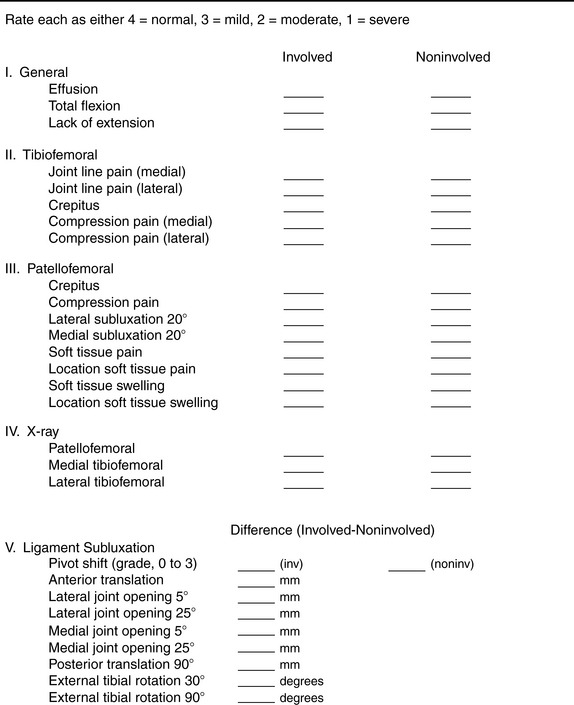
The knee examination portion of the physical evaluation is designed to document all parameters of the knee condition (Fig. 44-11). The contents are divided into five sections. The general examination section includes joint effusion and range of motion. Joint effusion is rated as normal, mild (<25 ml of fluid), moderate (26–60 ml of fluid), or severe (>60 ml of fluid). Knee flexion and extension are measured with a goniometer; the heel-height method is also used to determine differences in extension between knees.
The radiographic section assesses the three knee compartments as either normal (no joint space narrowing), mild, moderate (narrowing < 50% of the total joint space) or severe (narrowing > 50% of the total joint space) using standing 45° posteroanterior and 30° axial patellofemoral radiographs. Studies in which lower limb malalignment exists also require standing radiographs of the hip-knee-ankle to document the weight-bearing line and mechanical axis.13
The ligament subluxation section documents the results of the pivot shift test (scale, 0–3) and other knee ligament subluxation tests (see Fig. 44-11). The pivot shift test is recorded on a scale of 0 to 3, with a grade of 0 indicating no pivot shift; grade 1, a slip or glide; grade 2, a jerk with gross subluxation or clunk; and grade 3, gross subluxation with impingement of the posterior aspect of the lateral side of the tibial plateau against the femoral condyle. The posterior drawer test (palpation of the medial tibiofemoral step-off) is done at 90° of flexion, and the difference in posterior tibial translation between the reconstructed knee and the contralateral knee is recorded. The clinical tests for lateral and medial joint opening are based on the varus and valgus stress tests performed at 0° and 30° of flexion. The examiner estimates the amount (in millimeters) of joint opening from the initial closed contact position of each tibiofemoral compartment to the maximal opened position, comparing the injured with the opposite normal knee. The tibiofemoral rotation test is used to detect posterior tibial subluxations in a qualitative manner at 30° and 90° of knee flexion.49
Objective Testing
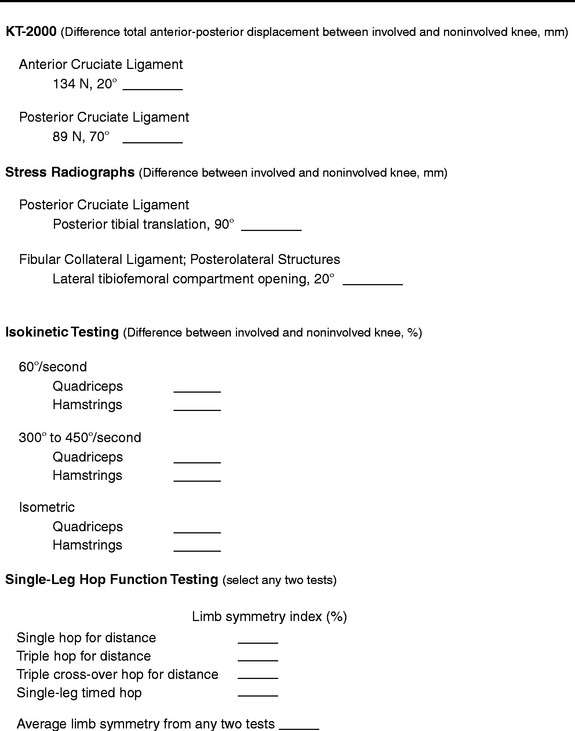
Objective testing of the lower extremity is performed to determine ligamentous, muscular, and limb symmetry deficits (Fig. 44-12). The KT-2000 knee arthrometer test is performed at 20° of flexion at 134 N for ACL investigations. Total AP displacement is measured because this is more accurate than attempting to set a neutral point between anterior and posterior tibial displacement. The difference in the measurements between the reconstructed and the contralateral knee is recorded. Any knee that has an ACL or PCL rupture on the contralateral knee is excluded from KT-2000 testing. The manual maximum arthrometer examination is not used because the magnitude of the force applied is highly variable and not defined or measured. This problem results in inconsistent results between examiners and studies.
Posterior stress radiographs are done with an 89-N force applied to the proximal tibia in knees with PCL ruptures.20 A lateral radiograph is taken of each knee at 90° of flexion. The limb is placed in neutral rotation with the tibia unconstrained and the quadriceps relaxed. The difference in posterior tibial displacement between the reconstructed knee and the contralateral knee is recorded. More than 8 mm of increase in posterior tibial translation on stress testing indicates a complete PCL rupture. The knee arthrometer is the device most frequently used by investigators to measure posterior tibial translation after PCL replacement. However, this device underestimates the true amount of residual posterior translation in PCL-injured and reconstructed knees and, in the authors’ opinion, is unreliable for determining the results of PCL surgical procedures at high flexion angles.20,33,60 Lateral stress radiographs are performed in knees with deficiency of the posterolateral structures. Both knees are radiographed at 20° flexion, neutral tibial rotation, and 67 N varus force and a comparison is made of the millimeters of lateral tibiofemoral compartment opening.
Muscular weakness or imbalances are assessed with isokinetic testing at either slow (60°/sec) or fast (300°/sec) speeds or in an isometric mode for patients with patellofemoral pain or symptomatic crepitus. Single-legged function hop tests are performed as previously described.3,42 Patients perform any two of the hop tests shown in Figure 44-12 to determine functional limitations after ACL reconstruction and to continue the functional progression for return to sports activities.
Operative Procedures and Articular Cartilage Rating
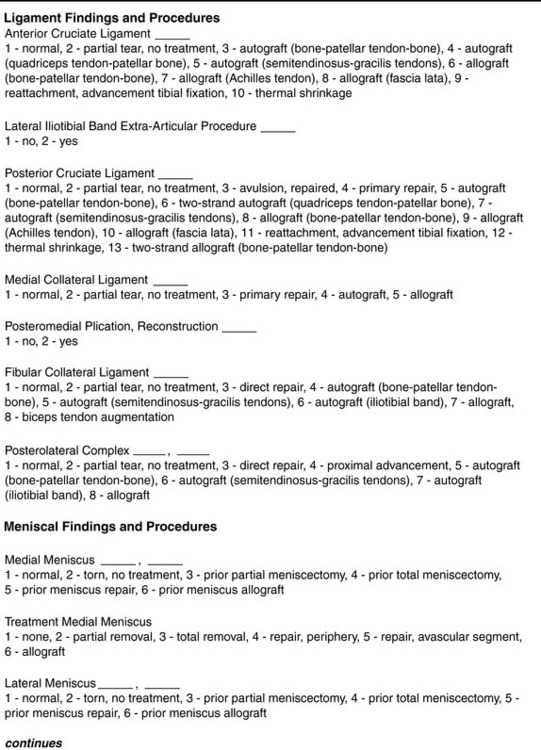
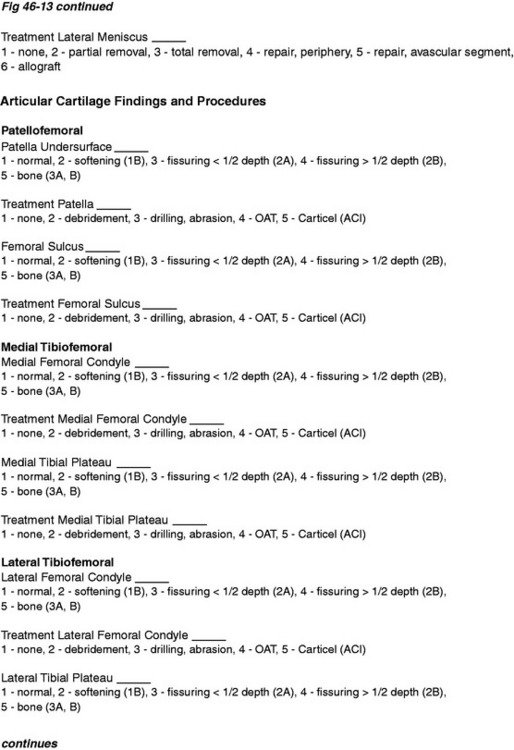
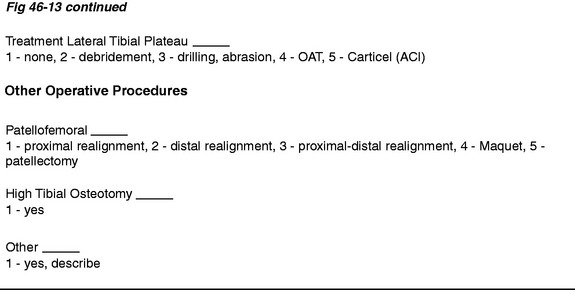
Documentation of the operative procedures performed and the condition of all ligamentous structures, menisci, and articular cartilage in the patellofemoral and tibiofemoral compartments is essential (Fig. 44-13). The operative procedures or findings may be used as final exclusionary or inclusionary criteria as determined by the study protocol.
A classification system for the rating of articular cartilage has been described previously.53 This system separates the description of the surface appearance of the cartilage from the extent or depth of the defect. Three surface grades are rated (1) closed chondromalacia (surface intact), (2) open lesions of fibrillation and fragmentation (surface disrupted) and (3) bone exposed. Subtypes (a) and (b) then make a distinction regarding the depth of the lesion as described. The location and millimeters of surface involvement are recorded. Chapter 47, Articular Cartilage Rating Systems, further details this and other articular cartilage rating systems. In addition, treatment of articular surfaces such as débridement, drilling, abrasion arthroplasty, and shaving is also documented along with the condition of the articular cartilage.
Documentation of Postoperative Complications
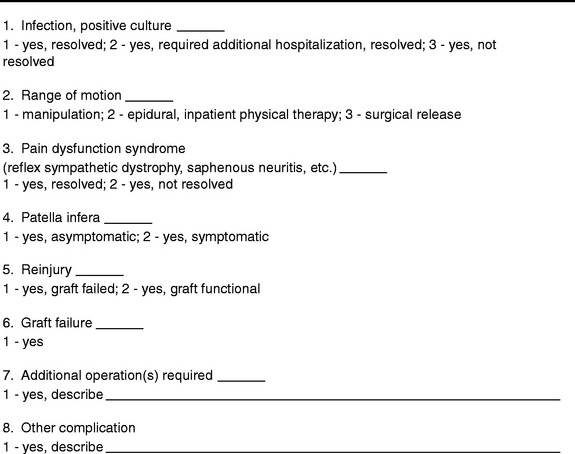
Complications from surgical procedures or rehabilitation programs are documented on a prospective basis (Fig. 44-14). In addition, senior researchers or surgeons who did not participate in the care of the patient conduct a chart review to ensure complete and accurate reporting of complications and results of treatment.
Overall Rating Assessment
An overall rating assessment is performed based on the ratings from 20 factors including symptoms, functional limitations, knee examination, stability, radiographs, and function testing (Appendix B). In patients in whom the ACL reconstruction is done for an acute injury (within 12 wk of the original injury), the analysis of the overall rating is performed in a manner different from that for patients with chronic injuries, who often have compounding problems such as articular cartilage damage, prior meniscal loss, loss of secondary restraints, and associated ligamentous instabilities.
Patients with acute knee injuries are expected to have more favorable results, especially in the symptom and functional limitations analyses, and therefore, a categorical analysis is used (along with a point scale) to determine the outcome of these patients. With this method, patients receive an overall rating grade of “excellent,” “good,” “fair,” or “poor” from the 20 factors shown in Appendix B. To receive a rating of “excellent,” all but 1 score must be in that category, with the remaining score in the “good” category. A “good” result is given when all scores are in the “excellent” or “good” categories and none are in the “fair” or “poor” categories. A “fair” result is assigned when any 1 score is “fair,” and a “poor” result when any 1 score is “poor.” In short, a knee can be only as good as the worst rating in any 1 of the 20 categories. This rationale was developed to solve the problem incurred with other systems that only use point scores to determine results and then arbitrarily assign categories for a certain number of points (such as “excellent” for 91–100 points, “good” for 81–90 points, and so on). In these systems, an ACL reconstruction that failed according to knee arthrometer testing could still receive an “excellent” or “good” rating if all other parameters score high numbers. Using this rationale, the CKRS is one of the strictest in terms of reporting results for acute knee injury studies.
RELIABILITY, VALIDITY, AND RESPONSIVENESS TESTING: AUTHORS’ STUDY
Reliability testing of the scales and overall rating score of the CKRS was conducted on two groups of individuals.4 The first group comprised 50 patients who had a variety of chronic knee injuries and disorders, including meniscal tears, knee ligament tears, patellofemoral complaints, and degenerative joint disease. The second group consisted of 50 volunteers who had no current knee pathology and no history of prior knee operations. The questionnaires were given to these 100 individuals by an interviewer who was available to explain the instructions if required, but a formal interview was not accomplished. The questionnaires were completed an average of 7 days (range, 4–13 days) after the baseline evaluation.
The 13 scales all demonstrated adequate test-retest reliability (Table 44-3; R > 0.70). In the normal population, the ICCs ranged from 0.71 (jumping) to 1.0 (walking, full giving-way). In the patient population, the ICCs ranged from 0.75 (squatting/kneeling) to 0.98 (Sports Activity Scale).
TABLE 44-3 Reliability of Cincinnati Knee Rating System Variables Using Intraclass Correlation Coefficients
| Variable | Uninjured Subjects (N = 50) | Patients (N = 50) |
|---|---|---|
| Pain | 0.83 | 0.84 |
| Swelling | 0.83 | 0.83 |
| Partial giving-way | 0.88 | 0.87 |
| Full giving-way | 1.0 | 0.87 |
| Walking | 1.0 | 0.88 |
| Stair-climbing | 0.78 | 0.68 |
| Squatting/kneeling | 0.87 | 0.75 |
| Running | 0.88 | 0.86 |
| Jumping | 0.71 | 0.89 |
| Twisting/turning | 0.88 | 0.85 |
| Patient perception of knee | 0.91 | 0.88 |
| condition | ||
| Sports Activity Scale | 0.98 | 0.98 |
| Occupational Rating Scale | 0.87 | 0.97 |
Intraclass correlation coefficient > 0.70 required for adequate reliability.
From Barber-Westin, S. D.; Noyes, F. R.; McCloskey, J. W.: Rigorous statistical reliability, validity, and responsiveness testing of the Cincinnati Knee Rating System in 350 subjects with uninjured, injured, or anterior cruciate ligament-reconstructed knees. Am J Sports Med 27:402–416, 1999.
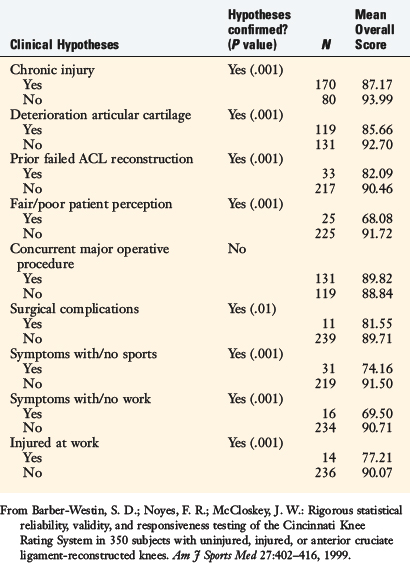
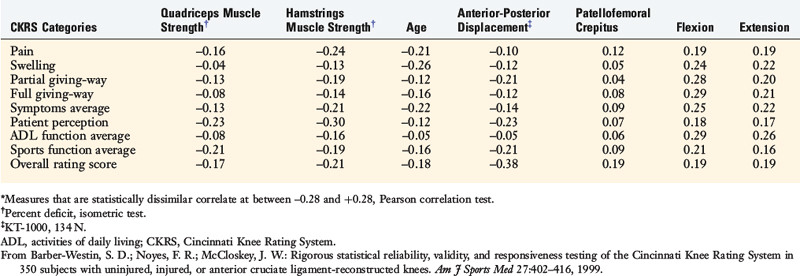
In the analysis of content validity, the CKRS overall rating score had no floor or ceiling effects preoperatively in the 250 patients (Table 44-4). At follow-up, no floor scores were found, and limited ceiling effects were calculated (22 patients, 9%). Good construct validity was demonstrated, as eight of the nine clinical hypotheses were confirmed using the overall rating score (Table 44-5). Item-discriminant validity was found for 59 of the 63 (94%) comparisons between the CKRS categories and the other variables shown in Table 44-6.
TABLE 44-6 Item-Discriminant Validity: Correlations between Cincinnati Knee Rating System Categories and Dissimilar Items*
The CKRS was highly responsive to detecting changes from the preoperative to the follow-up evaluations. Seven of the eight categories showed large effects ranging from 1.07 to 2.48, and the remaining category (Activities of Daily Living average score) showed a moderate effect of 0.72 (Table 44-7).
ASSESSMENT OF THE CKRS BY INDEPENDENT INSTITUTIONS
Marx and colleagues35 conducted reliability, validity, and responsiveness testing of the CKRS Symptom Rating Scale and the Sports and Daily Activity functional scales in 42 patients with a wide variety of knee disorders. These investigators found that these components had adequate reliability (ICC, >0.80), face and content validity, and responsiveness (standardized response mean, 0.8). The authors found that the Lysholm scale, the American Academy of Orthopaedic Surgeons sports knee-rating scale, and the Activities of Daily Living Scale of the Knee Outcome Survey also had adequate reliability, validity, and responsiveness.
Risberg and coworkers55 assessed the responsiveness of the Symptom Rating and the Sports and Daily Activity functional scales in 109 patients after ACL reconstruction. The patients completed the questionnaires 3, 6, 12, and 24 months postoperatively. The authors reported that the CKRS was highly sensitive to detecting significant changes over time in contrast to the Lysholm, IKDC, and visual analog scales, which were found not to be effective in detecting such changes.
Demirdjian and associates11 evaluated scores for the CKRS and the Lysholm questionnaire from 418 normal subjects aged 13 to 25 years. For this study, the CKRS components analyzed were the scores for pain, swelling, partial giving-way, full giving-way, walking, stair-climbing, running, jumping/twisting, and the overall activity score, which summed to a possible 100 points. The mean and SD for the overall score of the CKRS was 99.10 ± 3.77 for males and 97.82 ± 4.97 for females. The mean overall score for the Lysholm scale was 99.10 ± 2.73 for males and 97.16 ± 5.26 for females. The 95% confidence intervals for the CKRS were 98.63 to 99.57 for males and 97.05 to 98.58 for females.
Borsa and colleagues7 evaluated 29 patients with an ACL-deficient knee to determine whether performance-based measures or patient-reported measures of function were more effective in estimating disability. Patients completed the CKRS Sports Activity Scale, Symptom Rating Scale, Patient Perception of the Knee Condition questions, and Sports Activity Function questions. Patients also completed the Lysholm questionnaire and were taken through proprioception, balance, single-leg hop, and isokinetic strength testing. Stepwise regression analysis demonstrated that the CKRS score was the most effective estimate of disability (R2 = 0.56). The addition of the Lysholm score into the model only increased R2 to 0.58 and the addition of the hop test index score only slightly improved the adjusted R2 to 0.60. The authors concluded that the inclusion of the Lysholm score and hop index did not significantly improve the ability to estimate disability induced by ACL deficiency.
Sgaglione and coworkers57 used four separate knee rating outcome instruments to determine the outcome of 65 patients who underwent ACL reconstruction. The patients were evaluated a mean of 35 months (range, 24–58 mo) postoperatively. The CKRS in its entirety was used in this investigation. The results demonstrated that the CKRS individual scaled scores were lower than the Hospital for Special Surgery (HSS) and Lysholm questionnaire scores. The investigators concluded that the CKRS defined most precisely the outcome of ACL reconstruction in athletically active patients. The conclusion was related to the fact that the CKRS incorporated physical findings and avoided combining raw scores into categorical score data (e.g., excellent = 90–100 points). According to the investigators, the Lysholm and HSS scores tended to inflate the outcome of the operation.
Anderson and associates1 evaluated 70 patients a minimum of 5 years after ACL reconstruction with the HSS, Feagin and Blake, CKRS, Lysholm, and Zarins rating scales. The authors reported that the CKRS had a large number of measurements that reflected high precision in the analysis of subjective symptoms, subjective function, and objective examination. Substantial differences were noted among the results of the six scales evaluated. The conclusion was reached that future rating scales should provide a balance between subjective symptoms, subjective function, and objective findings.
MODIFIED CKRS SCALES
The authors express concern and caution regarding the use of so-called modified CKRS scales. Whereas some authors who implement these scales in their investigations8,58 provide the actual portion of the CKRS used along with the modifications, the reasons for changing the original scales are usually not provided. The interpretation of data is difficult and cannot be compared with studies that use unedited CKRS scales. In the authors’ opinion, modified CKRS scales should not be used because they do not represent the instruments developed, which have undergone rigorous statistical testing, and may not provide the data that were intended by the authors of the CKRS.
1 Anderson A.F., Federspiel C.F., Snyder R.B. Evaluation of knee ligament rating systems. Am J Knee Surg. 1993;6:67-73.
2 Andersson C., Odensten M., Gillquist J. Knee function after surgical or nonsurgical treatment of acute rupture of the anterior cruciate ligament: a randomized study with a long-term follow-up period. Clin Orthop Relat Res. 1991;264:255-263.
3 Barber S.D., Noyes F.R., Mangine R.E., et al. Quantitative assessment of functional limitations in normal and anterior cruciate ligament-deficient knees. Clin Orthop. 1990;255:204-214.
4 Barber-Westin S.D., Noyes F.R., McCloskey J.W. Rigorous statistical reliability, validity, and responsiveness testing of the Cincinnati Knee Rating System in 350 subjects with uninjured, injured, or anterior cruciate ligament-reconstructed knees. Am J Sports Med. 1999;27:402-416.
5 Barrack R.L., Bruckner J.D., Kniesl J., et al. The outcome of nonoperatively treated complete tears of the anterior cruciate ligament in active young patients. Clin Orthop Relat Res. 1990;259:192-199.
6 Bollen S., Seedhom B.B. A comparison of the Lysholm and Cincinnati knee scoring questionnaires. Am J Sports Med. 1991;19:189-190.
7 Borsa P.A., Lephart S.M., Irrgang J.J. Comparison of performance-based and patient-reported measures of function in anterior-cruciate-ligament–deficient individuals. J Orthop Sports Phys Ther. 1998;28:392-399.
8 Borsa P.A., Lephart S.M., Irrgang J.J. Sport-specificity of knee scoring systems to assess disability in anterior cruciate ligament–deficient athletes. J Sport Rehabil. 1998;7:44-60.
9 Buss D.D., Min R., Skyhar M., et al. Nonoperative treatment of acute anterior cruciate ligament injuries in a selected group of patients. Am J Sports Med. 1995;23:160-165.
10 Cohen J. Statistical Power Analysis for the Behavioral Sciences. New York: Academic, 1977. 19–74
11 Demirdjian A.M., Petrie S.G., Guanche C.A., Thomas K.A. The outcomes of two knee scoring questionnaires in a normal population. Am J Sports Med. 1998;26:46-51.
12 Deyo R.A., Diehr P., Patrick D.L. Reproducibility and responsiveness of health status measures. Statistics and strategies for evaluation. Control Clin Trials. 1991;12(4 suppl):142S-158S.
13 Dugdale T.W., Noyes F.R., Styer D. Preoperative planning for high tibial osteotomy: the effect of lateral tibiofemoral separation and tibiofemoral length. Clin Orthop Relat Res. 1992;274:248-264.
14 Engelberg R., Martin D.P., Agel J., et al. Musculoskeletal function assessment instrument: criterion and construct validity. J Orthop Res. 1996;14:182-192.
15 Feagin J., Blake W.P. Postoperative evaluation and result recording in the anterior cruciate ligament reconstructed knee. Clin Orthop Relat Res. 1983;172:143-147.
16 Feinstein A.R. Clinical Epidemiology: The Architecture of Clinical Research. Philadelphia: W. B. Saunders, 1985.
17 Flandry F., Hunt J.P., Terry G.C., Hughston J.C. Analysis of subjective knee complaints using visual analog scales. Am J Sports Med. 1991;19:112-118.
18 Guyatt G., Walter S., Norman G. Measuring change over time: assessing the usefulness of evaluative instruments. J Chronic Dis. 1987;40:171-178.
19 Hanley S.T., Warren R.F. Arthroscopic meniscectomy in the anterior cruciate ligament–deficient knee. Arthroscopy. 1987;3:59-65.
20 Hewett T.E., Noyes F.R., Lee M.D. Diagnosis of complete and partial posterior cruciate ligament ruptures. Stress radiography compared with KT-1000 arthrometer and posterior drawer testing. Am J Sports Med. 1997;25:648-655.
21 Hoher J., Munster A., Klein J., et al. Validation and application of a subjective knee questionnaire. Knee Surg Sports Traumatol Arthrosc. 1995;3:26-33.
22 Hrubesch R., Rangger C., Reichkendler M., et al. Comparison of score evaluations and instrumented measurement after anterior cruciate ligament reconstruction. Am J Sports Med. 2000;28:850-856.
23 Irrgang J.J., Anderson A.F., Boland A.L., et al. Development and validation of the International Knee Documentation Committee subjective knee form. Am J Sports Med. 2001;29:600-613.
24 Irrgang J.J., Anderson A.F., Boland A.L., et al. Responsiveness of the International Knee Documentation Committee subjective knee form. Am J Sports Med. 2006;34:1567-1573.
25 Irrgang J.J., Ho H., Harner C.D., Fu H.F. Use of the International Knee Documentation Committee guidelines to assess outcome following anterior cruciate ligament reconstruction. Knee Surg Sports Traumatol Arthrosc. 1998;6:107-114.
26 Irrgang J.J., Snyder-Mackler L., Wainner R.S., et al. Development of a patient-reported measure of function of the knee. J Bone Joint Surg Am. 1998;80:1132-1145.
27 Johanson N.A., Liang M.H., Daltroy L., et al. American Academy of Orthopaedic Surgeons lower limb outcomes assessment instruments. Reliability, validity, and sensitivity to change. J Bone Joint Surg Am. 2004;86:902-909.
28 Kane R.L. Outcomes measures. In: Kane R.L., editor. Understanding Health Care Outcomes Research. Gaithersburg, MD: Aspen; 1997:17-18.
29 Kazis L.E., Anderson J.J., Meenan R.F. Effect sizes for interpreting changes in health status. Med Care. 1989;27(3 suppl):S178-S189.
30 Kirshner B., Guyatt G. A methodological framework for assessing health indices. J Chronic Dis. 1985;38:27-36.
31 Lin L.I. A concordance correlation coefficient to evaluate reproducibility. Biometrics. 1989;45:255-268.
32 Lysholm J., Gillquist J. Evaluation of knee ligament surgery results with special emphasis on use of a scoring scale. Am J Sports Med. 1982;10:150-154.
33 Margheritini F., Mancini L., Mauro C.S., Mariani P.P. Stress radiography for quantifying posterior cruciate ligament deficiency. Arthroscopy. 2003;19:706-711.
34 Marshall J.L., et al. Knee ligament injuries. A standardized evaluation method. Clin Orthop Relat Res. 1977;123:115-129.
35 Marx R.G., Jones E.C., Allen A.A., et al. Reliability, validity, and responsiveness of four knee outcome scales for athletic patients. J Bone Joint Surg Am. 2001;83:1459-1469.
36 Marx R.G., Stump T.J., Jones E.C., et al. Development and evaluation of an activity rating scale for disorders of the knee. Am J Sports Med. 2001;29:213-218.
37 McHorney C.A. Methodological and psychometric issues in health status assessment across populations and applications. In: Rothman B., editor. Advances in Medical Sociology. Greenwich, CT: JAI, 1994.
38 McHorney C.A., Ware J.E., Rachel J.F., Sherbourne C.D. The MOS 36-item short-form health survey (SF-36): III. Tests of data quality, scaling assumptions, and reliability across diverse patient groups. Med Care. 1994;32:40-66.
39 Mohtadi N. Development and validation of the Quality of Life outcome measure (questionnaire) for chronic anterior cruciate ligament deficiency. Am J Sports Med. 1998;26:350-359.
40 Muller W., Biedert R., Hefti F., et al. OAK knee evaluation. A new way to assess knee ligament injuries. Clin Orthop Relat Res. 1988;232:37-50.
41 Nitko J.S. Educational Tests and Measurement: An Introduction. New York: Harcourt Brace Jovanovich, 1983.
42 Noyes F.R., Barber S.D., Mangine R.E. Abnormal lower limb symmetry determined by function hop tests after anterior cruciate ligament rupture. Am J Sports Med. 1991;19:513-518.
43 Noyes F.R., Barber S.D., Mangine R.E. Bone–patellar ligament–bone and fascia lata allografts for reconstruction of the anterior cruciate ligament. J Bone Joint Surg Am. 1990;72:1125-1136.
44 Noyes F.R., Barber S.D., Mooar L.A. A rationale for assessing sports activity levels and limitations in knee disorders. Clin Orthop. 1989;246:238-249.
45 Noyes F.R., Barber S.D., Simon R. High tibial osteotomy and ligament reconstruction in varus angulated, anterior cruciate ligament–deficient knees. A two- to seven-year follow-up study. Am J Sports Med. 1993;21:2-12.
46 Noyes F.R., Barber-Westin S. Posterior cruciate ligament replacement with a two-strand quadriceps tendon–patellar bone autograft and a tibial inlay technique. J Bone Joint Surg Am. 2005;87:1241-1252.
47 Noyes F.R., Barber-Westin S.D. A comparison of results of arthroscopic-assisted anterior cruciate ligament reconstruction between workers’ compensation and noncompensation patients. Arthroscopy. 1997;13:474-484.
48 Noyes F.R., Barber-Westin S.D., Rankin M. Meniscal transplantation in symptomatic patients less than fifty years old. J Bone Joint Surg Am. 2004;86:1392-1404.
49 Noyes F.R., Cummings J.F., Grood E.S., et al. The diagnosis of knee motion limits, subluxations, and ligament injury. Am J Sports Med. 1991;19:163-171.
50 Noyes F.R., McGinniss G.H., Mooar L.A. Functional disability in the anterior cruciate insufficient knee syndrome. Review of knee rating systems and projected risk factors in determining treatment. Sports Med. 1984;1:278-302.
51 Noyes F.R., Mooar L.A., Barber S.D. The assessment of work-related activities and limitations in knee disorders. Am J Sports Med. 1991;19:178-188.
52 Noyes F.R., Mooar P.A., Matthews D.S., Butler D.L. The symptomatic anterior cruciate–deficient knee. Part I: the long-term functional disability in athletically active individuals. J Bone Joint Surg Am. 1983;65:154-162.
53 Noyes F.R., Stabler C.L. A system for grading articular cartilage lesions at arthroscopy. Am J Sports Med. 1989;17:505-513.
54 Nunnally J.C. Psychometric Theory. New York: McGraw-Hill, 1978. 225–255
55 Risberg M.A., Holm I., Steen H., Beynnon B.D. Sensitivity to changes over time for the IKDC form, the Lysholm score, and the Cincinnati Knee Score. A prospective study of 120 ACL reconstructed patients with a 2-year follow-up. Knee Surg Sports Traumatol Arthrosc. 1999;7:152-159.
56 Roos E.M., Roos H.P., Lohmander L.S., et al. Knee Injury and Osteoarthritis Outcome Score (KOOS)—development of a self-administered outcome measure. J Orthop Sports Phys Ther. 1998;28:88-96.
57 Sgaglione N.A., Del Pizzo W., Fox J.M., Friedman M.J. Critical analysis of knee ligament rating systems. Am J Sports Med. 1995;23:660-667.
58 Shelbourne K.D., Nitz P. Accelerated rehabilitation after anterior cruciate ligament reconstruction. Am J Sports Med. 1990;18:292-299.
59 Spindler K.P., Warren T.A., Callison J.C.Jr., et al. Clinical outcome at a minimum of five years after reconstruction of the anterior cruciate ligament. J Bone Joint Surg Am. 2005;87:1673-1679.
60 Staubli H.U., Noesberger B., Jakob R.P. Stress radiography of the knee. Cruciate ligament function studied in 138 patients. Acta Orthop Scand Suppl. 1992;249:1-27.
61 Streiner D.L., Norman G.R., editors. Health Measurement Scales. New York: Oxford University Press, 2001.
62 Stucki G., Liang M.H., Fossel A.H., Katz J.N. Relative responsiveness of condition-specific and generic health status measures in degenerative lumbar spinal stenosis. J Clin Epidemiol. 1995;48:1369-1378.
63 Tegner Y., Lysholm J. Rating systems in the evaluation of knee ligament injuries. Clin Orthop Relat Res. 1985;198:43-49.
64 Wexler G., Bach B.R.Jr., Bush-Joseph C.A., et al. Outcomes of anterior cruciate ligament reconstruction in patients with workers’ compensation claims. Arthroscopy. 2000;16:49-58.
65 Zarins B. Are validated questionnaires valid? J Bone Joint Surg Am. 2005;87:1671-1672.
66 Zarins B., Rowe C.R. Combined anterior cruciate–ligament reconstruction using semitendinosus tendon and iliotibial tract. J Bone Joint Surg. 1986;68:160-177.


