Chapter 4 Knee Ligament Function and Failure
LIGAMENT FIBER LENGTH-TENSION PROPERTIES
In the early writings of Fick in 1911,23 the description of ligaments having fibers grouped into bands was presented, along with the concepts that not all fibers of a ligament would be tense at one time and knee flexion angle played an important role in which fibers were under tension and which were slack. Since then, numerous publications have appeared that demonstrate how ligament fiber tension and function depend on the initial length and attachment site and on the specific joint position of both flexion-extension and tibial rotation.28,31,32,72 These concepts are important because they form the basis for the placement of knee ligament grafts and provide insight into the concepts of single- and double-bundle anterior cruciate ligament (ACL) and posterior cruciate ligament (PCL) reconstruction. In addition, the ligament fiber length-tension properties form the basis for the tensioning rules regarding knee flexion and load applied for ligament grafts at surgery. Major disagreement still exists among investigators on these points, as is discussed in this chapter.
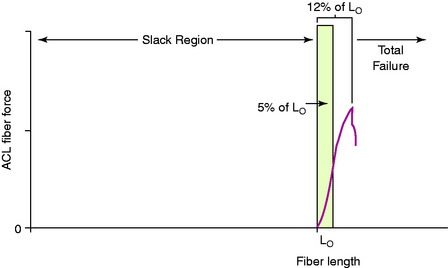
It is first important to understand the length-tension behavior of individual ligament fibers. The viscoelastic properties of ligament fibers allow them to initially undergo elongation under load in resisting joint displacements. The tension developed in the ligament fibers depends on its tibiofemoral attachment site, initial length, initial joint position, and subsequent joint displacement. In Figure 4-1, a force-versus-length curve is shown for human ACL fibers. The “Lo” point describes the initial loading of the ligament fiber; when the ligament bone attachment distance of the fiber is less than Lo, the fiber is slack. The fiber functions only when the distance between the fiber attachment sites reaches the length of the fiber to imitate loading. The fiber functions only within a narrow elongation or strain, which has been estimated at strains of 5% or less.19 Failure of the individual fiber begins in the upper range estimated at the 8% level of strain.
Collagen fibers are not highly elastic and demonstrate failure at relatively low levels of elongation or strain. Because ligament fibers function only within a small range of lengths and the fiber lengths vary with knee rotations and translations, these fiber length patterns can be measured under in vitro conditions. Beynnon and coworkers5–7 measured fiber length patterns in vivo, described further in Chapter 12, Scientific Basis of Rehabilitation after ACL Autogenous Reconstruction.
HOW LIGAMENT FIBER MICROGEOMETRY DETERMINES LIGAMENT FUNCTION AND FAILURE
The three-dimensional microgeometry of ligament fibers is only partially understood on a macroscopic and ultrastructural level. From a macroscopic level, Figures 4-2 to 4-5 show the concepts of how ligament fibers determine functional properties and the mechanisms of ligament failure. Figure 4-2 shows a stress-strain curve for a typical collagen fiber. The initial toe region involves straightening of the collagen fibers, followed by a linear region. At the end of the linear region, failure of individual collagen fibers occurs, which progresses to final failure of the whole structure. Note that the total fiber strain to failure is only 8% in this illustration. Figure 4-3 shows the effect on the structural properties of a ligament on increasing the cross-sectional area. There is an increase in stiffness and ultimate force to failure. Figure 4-4 shows the effect of different lengths of a collagen structure under load, both having the same cross-sectional area. In the illustration, there is a 50% decrease in stiffness in the ligament that is twice as long. This effect has been noted in ACL semitendinosus-gracilis tendon (STG) reconstructions where aperture fixation of the graft directly at the tunnel site may improve mechanical properties of the graft in addition to decreasing graft-bone tunnel motion. Figure 4-5 shows the effect of fiber microgeometry on structural properties. The finger-trap illustration shows a major decrease in stiffness and ultimate strength because the collagen fibers are not loaded in a symmetrical manner.
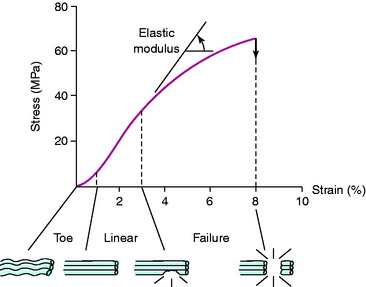
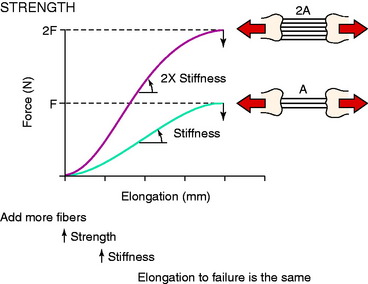
FIGURE 4-3 The effects of increasing tissue cross-sectional area on the shape of the load-deformation curve.
(From Butler, D. L.; Grood, E. S.; Noyes, F. R.; Zernicke, R. F.: Biomechanics of ligaments and tendons. In Hutton, R. [ed.]: Exercise and Sports Science Review, Vol. 6. Philadelphia: Franklin Institute Press, 1978; pp. 125–182.)
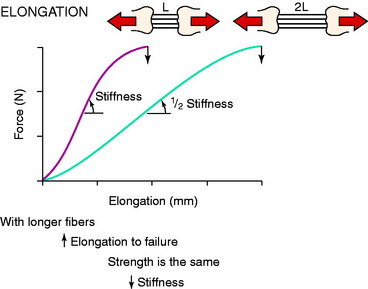
FIGURE 4-4 The influence of original length of tissue fibers on the shape of the load-deformation curve.
(From Butler, D. L.; Grood, E. S.; Noyes, F. R.; Zernicke, R. F.: Biomechanics of ligaments and tendons. In Hutton, R. [ed.]: Exercise and Sports Science Review, Vol. 6. Philadelphia: Franklin Institute Press, 1978; pp. 125–182.)
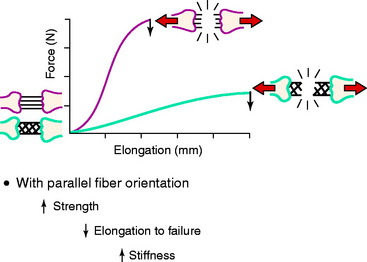
The arrangement of ligament fibers in a parallel manner such as the medial collateral ligament (MCL), fibular collateral ligament (FCL), or a tendon provides a structure with a high maximum load to failure because the majority of the fibers are loaded in a symmetrical manner and share the loading profile. The structure will fail at a relatively small displacement, as is true for the MCL and FCL, which are discussed in Chapter 2, Lateral, Posterior, and Cruciate Knee Anatomy. Alternatively, the capsular structures are designed to provide a low stiffness, allowing elongation or compliance, which is built into the microgeometry similar to that shown in the illustration of the finger-trap in Figure 4-5. Certain portions of the capsule may have an arrangement in which some fibers exist in a more parallel array, such as the posterior oblique ligament of the posteromedial capsule. Failure of capsular structures can be difficult to detect because a microtearing process occurs throughout the entire capsule. The capsule may appear slack and elongated without an obvious failure or the capsule may be avulsed off of its femoral or tibial attachment and the failure site identified and repaired at surgery. Prior to ultimate failure of the capsule, the microfailure process produces a residual elongation or slackening that, in chronic knee injuries, may require plication procedures to restore tension and function. An example is plication of posteromedial or posterolateral capsular structures so that they will function in full extension and resist knee hyperextension. The length-tension behavior and failure pattern of the ACL and PCL are also dissimilar, with different fiber regions brought into the loading based on the position of the knee.
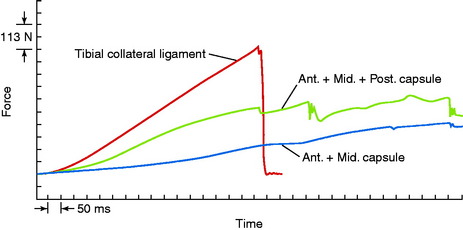
An example of the force elongation properties of the MCL and medial capsular structures is shown in Figure 4-6. This example is from a rhesus primate knee in which the medial structures were loaded in uniaxial tension. The high failure load of the MCL in comparison with the capsular structures is shown. The capsule undergoes a failure process that is somewhat continuous because different portions of the less stiff capsule are brought into the loading sequence and fail, without an abrupt failure.
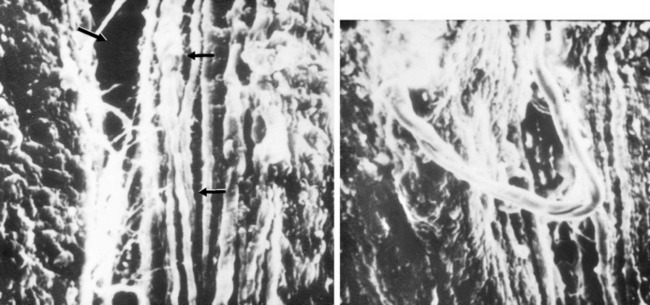
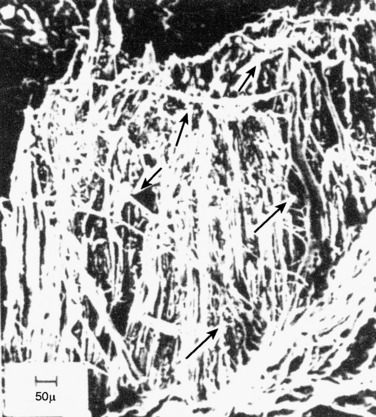
An example of a scanning electron microscopic analysis of failure of the ACL ligament is shown in Figure 4-7. In this series of experiments, the ACL of a rhesus primate knee was loaded to one half of its expected failure load. Scanning electron microscopic examination showed that some portions of the fiber bundles had separated and had lost some of their normal wavy attachment. This is not an artifact, because normal ACL fibers will show a wavy appearance. In certain portions of the ACL, there is complete failure of individual fibers that were brought into the loading sequence owing to their fiber length at the knee position selected for the loading test. In Figure 4-8, failure of a major fiber bundle is shown with failure of the individual fibers at different places within the fiber. Note that failure of a small vessel has also occurred at the site of fiber failure, which is unusual given the expected elongation that vessels undergo prior to ultimate failure.
IMPORTANCE OF FEMORAL ATTACHMENT ON LIGAMENT LENGTH-TENSION PATTERNS
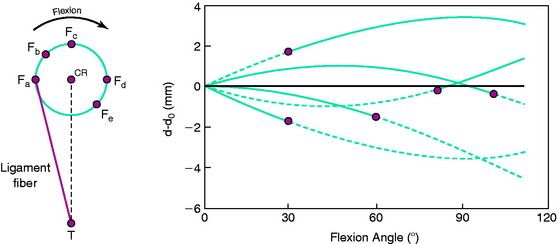
The effect of the femoral attachment described by Grood and associates28 is illustrated in Figure 4-9. In this model, the tibial attachment is assumed to be stationary, and flexion of the knee occurs about a fixed center of rotation (CR). The location of the CR is at the average rotation center of the human knee joint. A fiber that attaches anterior to the CR, such as fiber Fa, will lengthen with knee flexion up to 90° as it rises up to the top of the circle and thereafter shortens with knee flexion. The opposite effect is shown by fiber Fd, which shortens with knee flexion and, at 90° of flexion, would start to lengthen. The length patterns of the fibers are shown in the accompanying graph. This shows the complex length pattern of cruciate ligament fibers and is in marked contrast to more simplified descriptions that the ACL anteromedial fibers lengthen with knee flexion and the posterolateral fibers lengthen with knee extension, which is a gross oversimplification. The circle model is still only an approximation because the knee does not have a fixed CR, which provides an additional complexity in the analysis of ACL and PCL fiber function to be described.
Contour plots are used to simplify the description of ligament length changes; a typical contour map is shown in Figure 4-10.32 A single contour line expresses all of the attachments that would produce the same maximum fiber strain. The region bounded by the contour line with the smallest strain (2% elongation) provides the most isometric femoral attachments. Note in Figure 4-10 that the tibiofemoral separation distance increases dramatically anterior to the contour line, and correspondingly, the length decreases posterior to the line with knee flexion. It should be noted that the concept of ligament isometricity is a misnomer because it is not expected that a ligament shows this behavior with a set minimal strain or elongation during knee flexion, as already discussed. A ligament functions with fibers of different lengths and their loading, which depends on attachment site characteristics. The disadvantage of the contour map is that the length of the individual native ligament fibers is not represented, and therefore, it is unknown at what point the ligament fibers in any region are tense or slack. The contour map is most useful to show the length changes that would occur for ligament grafts placed at certain positions within the ACL and PCL attachment sites at the maximum elongation or strain of the graft. In addition, note the knee position at which the graft is tensioned to not produce excessive graft elongation, which would either overconstrain the joint or result in graft failure.
A number of studies show that there is an approximate region in the ACL or PCL at which one region lengthens with knee flexion, another region shortens, and fibers between these two regions undergo less elongation.8,28–30,32,61,72 However, there is a major discrepancy in the investigations regarding where the regions are located within the cruciate ligaments. The authors’ data and those of others72 have concluded that the line for the ACL is primarily oriented in a proximal-to-distal direction and that fibers anterior to the line become longer in flexion and posterior fibers become shorter (Fig. 4-11; see also Fig. 4-10). The region for the line for the PCL, in contrast, is oriented in an anterior-to-posterior direction, with distal fibers becoming longer with knee flexion and proximal fibers lengthening with knee extension. Thus, the line that divides the shortening and lengthening regions has a completely different orientation for the ACL than for the PCL. This is one of the most basic concepts of how ligament fibers function. Many current illustrations for ACL femoral attachment sites incorrectly show that the proximal fibers lengthen with knee flexion and the distal fibers lengthen with knee extension. In fact, there are fibers within the ACL proximal and distal femoral attachment regions, governed by the contour plot behavior (see Fig. 4-10), that do not show this reciprocal tension behavior with knee flexion and extension. The data for these studies are not based on true fiber attachment separation distances, and these differences have rather profound effects on where ACL and PCL grafts are placed and tensioned. The PCL fiber length-tension behaviors under loading are shown in Chapter 20, Function of the Posterior Cruciate Ligament and Posterolateral Ligament Structures.
It should be noted that both Sidles and colleagues72 and Hefzy and coworkers32 reported that the contour maps describing fiber elongation patterns were strongly dependent on whether an anterior or a posterior displacement load was applied to the tibia and the contour maps provided were under loading conditions for the respective ACL or PCL. A more complete description of contour maps for the femoral and tibial attachments is provided for the reader,28,32,72 and the effect of tibial attachment sites is discussed in Chapters 7, Anterior Cruciate Ligament Primary and Revision Reconstruction: Diagnosis, Operative Techniques, and Clinical Outcomes, and 20, Function of the Posterior Cruciate Ligament and Posterolateral Ligament Structures.
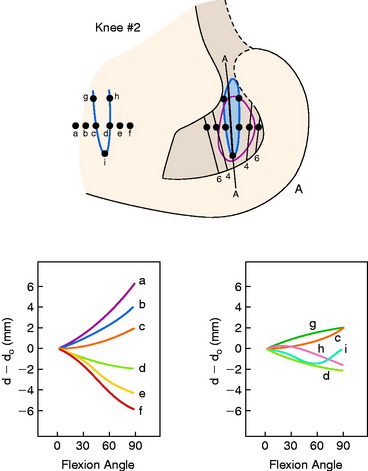
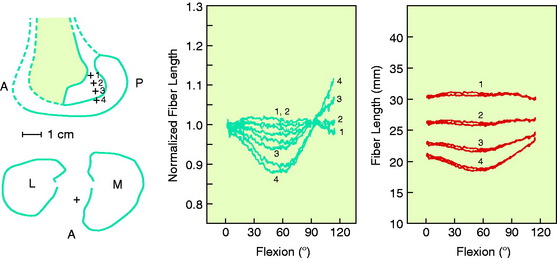
The effects of changing the tibial attachment of an ACL graft in cadaveric specimens is shown in Figure 4-12. The six ACL fiber locations on the tibia all originate at the approximate center of the ACL femoral attachment. Moving the fiber attachment on the tibia in a medial-to-lateral direction had only a small effect on fiber length and normalized length patterns. In contrast, moving the fiber in an anterior-to-posterior direction had a strong effect on fiber length. An anterior shift of the tibial attachment of 7.5 mm increased the fiber length by 5 to 8 mm. An anterior tibial attachment resulted in the fiber length behavior to become more taut in flexion. In Figure 4-13, the strong effect of moving the femoral attachment location in an anterior-to-posterior location on changing the length with knee flexion is shown. The location of the tibial insertion site is unchanged. The effect of moving the femoral attachment in a proximal-to-distal direction is shown in Figure 4-14. The more distal attached fibers were markedly shortened and had a concave length pattern, whereas the longer proximal fibers had a slightly convex pattern. In summary, these studies show the complex behavior of the cruciate ligaments in which individual fibers and fiber regions are loaded to resist coupled motions of tibial translation and rotation. For the surgeon, the placement of a graft for the ACL in an anterior-to-posterior location within its footprint has significant effects in determining the tension and loading conditions of the graft, as demonstrated. For the PCL, as is discussed in Chapter 20, Function of the Posterior Cruciate Ligament and Posterolateral Ligament Structures, placing the PCL graft in a proximal-to-distal direction has similar profound effects on its length-tension behaviors. The surgeon does have the ability to approximately select the range of knee flexion (low flexion, high flexion positions) under which the graft will be at its longest length and, therefore, should be tensioned at this position. Tensioning a graft at a flexion range at which the graft is in its shortest position would be expected to produce failure of portions of the graft as it elongates at a different knee flexion position. Within each graft, there will be asymmetrical loading of the graft fibers and the contour plots show the different fiber elongations of fibers in the center of the graft compared with the fibers at the periphery of the graft. The concept of placing more than one graft is designed to allow adjustments to more closely simulate ligament fiber behaviors, although it is probable that the surgeon is adding collagen fibers to fill the ACL or PCL footprint and that native cruciate fiber behavior is never achieved.
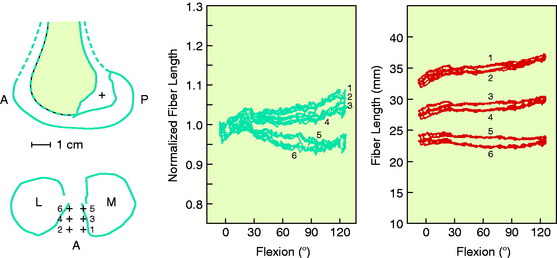
FIGURE 4-12 Sensitivity of fiber-length patterns to tibial attachment location for specimen 901.
(From Hefzy, M. S.; Grood, E. S.: Sensitivity of insertion locations on length patterns of anterior cruciate ligament fibers. J Biomech Eng 108:73–82, 1986.)
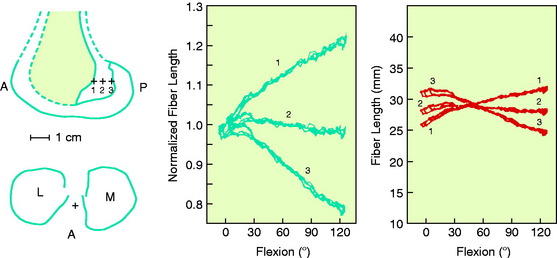
FIGURE 4-13 Sensitivity of fiber-length patterns to femoral attachment location for specimen 901.
(From Hefzy, M. S.; Grood, E. S.: Sensitivity of insertion locations on length patterns of anterior cruciate ligament fibers. J Biomech Eng 108:73–82, 1986.)
In agreement with Grood and associates’ studies,28 Markolf and colleagues47 reported in a cadaveric in vitro biomechanical study that positioning the femoral ACL tunnel in an anterior-to-posterior is more critical in terms of graft forces and function than is a proximal-to-distal direction.
LIGAMENT FIBER LENGTH-TENSION PATTERNS AND BURMESTER CURVES
As already discussed, one of the primary scientific bases for ligament fiber function and graft placement is the measurement or computation of fiber length patterns. An alternative approach for determining ligament function proposed by Menschik50,51 is frequently referenced in the literature. This approach is based on the four-bar model of ACL and PCL ligament function shown in Figure 4-15 first proposed by Strasser75 and on the mathematical theory for knee motions developed by Burmester.9 This mathematical theory was developed to determine all pairs of femoral and tibial attachments that remain the same distance apart (isometric) as the knee is moved through small (infinitesimal) motions. The pairs of attachment points are represented by the two curves shown in Figure 4-16, one for all possible femoral attachments and one for all possible tibial attachments, which are described as a cubic curve because of their mathematical form. A single tibial and femoral attachment of a ligament is obtained by drawing a straight line through the instant center of knee flexion controlled by the four-bar mechanism of where the cruciate links cross each other. The MCL tibial and femoral isometric attachments are the points at which a line crosses the tibial and femoral cubics.
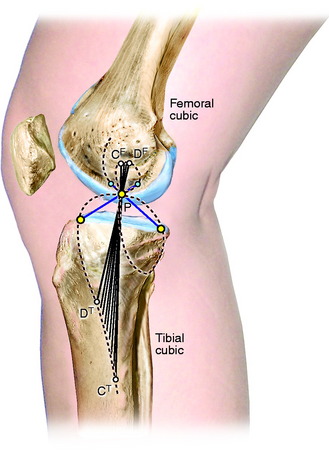
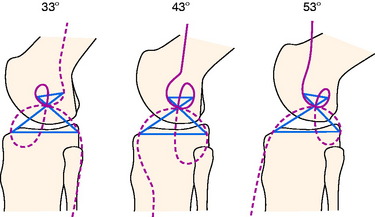
FIGURE 4-16 Burmester curves computed for flexion angles of 33°, 43°, and 53°. The curves for 43° of flexion are nearly identical to the curves published by Menschik50,51 and Mueller.54 Note that most of the tibial cubics for 33° and 53° of flexion are not on the tibia, and, thus they are not possible ligament attachments.
(From Grood, E. S.: Placement of knee ligament grafts. In Finerman, G. A.; Noyes, F. R. [eds.]: Biology and Biomechanics of the Traumatized Synovial Joint: The Knee as a Model. Rosemont, IL: American Academy of Orthopaedic Surgeons [AAOS], 1992; pp. 393–417.)
The Burmester curves have been used by many authors to explain the attachment locations of the collateral ligaments and capsular structures, and references are available proposing these curves can explain ligament function.54 However, there are important scientific objections to using this model to define ligament function and possible graft attachment locations. The shape of the curves depends on the knee flexion angle chosen, and different curves can be computed for different flexion angles (see Fig. 4-16). Menschik50,51 published the curves for 43° of flexion without providing the specific criteria used for computing the curves at this particular position of knee flexion. The authors of this chapter computed the curves for other flexion angles that differed markedly in shape and had different sites for the attachment of the collateral ligaments that may not be close to their anatomic attachment (see Fig. 4-16). In addition, the Burmester curves are based on small knee motions, and it has been determined that there are tibial attachment locations that are as isometric that are not on the Burmester curve when a wider range of knee motion is considered.
Critical Points LIGAMENT FIBER LENGTH-TENSION PATTERNS AND BURMESTER CURVES
MECHANICAL PROPERTIES OF LIGAMENTS
The ligaments of the knee have unique anatomic and mechanical characteristics that cannot be generalized from one ligament to another. The mechanical behavior of ligaments depends on the material properties of the fibers, the geometric arrangement of collagen fibrils18,21,65 and fiber bundles (as already described), the proportion of different types of fibrous constituents, and the effect of the surrounding ground substance.18,27,35,53,62 The ligament insertion site and underlying bone are additional portions of the ligament unit that must be considered when evaluating overall mechanical properties.
Critical Points MECHANICAL PROPERTIES OF LIGAMENTS
Effect of Strain Rate on Mechanical Properties
Analysis of Failure-Mode Mechanisms
Effect of Strain Rate on Mechanical Properties
The strain rate describes the rate of deformation used in mechanical studies (length change/initial length per unit of time). The authors conducted a series of fast and slow strain-rate tests on ACL bone-ligament-bone specimens in rhesus monkeys.56 A slow rate of deformation was chosen to represent the strain rates used in many prior in vitro experiments. A fast rate of deformation was chosen to represent the physiologic in vivo loading conditions to which ligaments may be subjected. The ligament units were tested as right-left pairs at the two strain rates to exclude animal variability. The femur and tibia were at an angle that corresponded to 45° of knee flexion to allow as nearly uniform loading of the ligament as possible. In this experiment, a distraction of the joint was produced. An alternative loading sequence would be to induce anterior translation. Both of these loading profiles have been used experimentally.
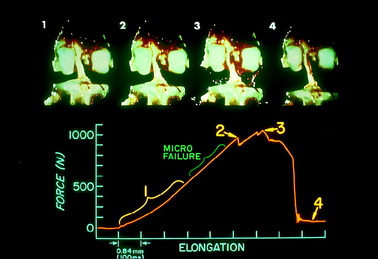
An example of a load-versus-time record from a typical test at the fast strain rate is shown in Figure 4-17. The curves demonstrate an initial concave toe region, followed by a fairly linear region up to the first significant failure. At this point, the load is termed the linear load because it denotes the approximate point at which the ligament preparation enters into the major failure region. Minor failures occur first, with a drop in load. Decreases in load after the linear load indicate successive failures until complete failure, at which time the load falls to zero. The maximum load occurs in the major failure region. The time axis is proportional to the relative displacement of the grips and represents elongation of the ligament after the compliance of the testing device and the grips are computed. Because the extension rate is known, specimen elongation at the linear load, maximum load, and zero load (complete failure) is determined. The area under the load-deformation curve indicates the energy absorbed by the specimen up to complete failure. The slope of the curve in the linear region provides the approximate stiffness of the preparation. It was not possible in this experiment to calculate the cross-sectional area of the ACL with any degree of reproducible accuracy. Force values are reported as load rather than as stress (force per unit area). Alternative experiments, discussed later, employ other testing configurations in which ligament strain is measured by sensitive optic techniques.
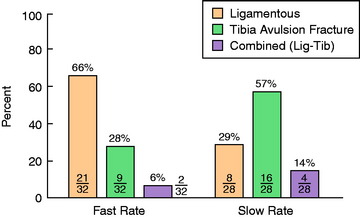
A statistically significant difference was found in the predominant mode of failure of the specimens tested at the fast strain rate compared with those tested at the slow rate (P < .05; Fig. 4-18). At the fast rate, two thirds of the specimens demonstrated a ligamentous failure and 28% failed by tibial avulsion fracture. At the slow rate, 57% of the specimens failed by tibial avulsion fracture and 29% failed by ligamentous failure.
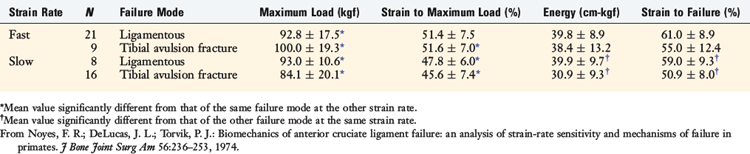
The results of the strain-rate properties according to the modes of failure are shown in Table 4-1. Under slow strain-rate conditions, the bone-insertion area of the tibia was the weakest component, demonstrated by the reduced maximum load and energy absorbed to failure. At the fast strain rate, representing the more physiologic loading condition, the ligament and bone components failed at a similar maximum load and energy. The overall difference in strength properties was due in part to increased strength of the bone component at the fast rate. At the slow rate, failure by tibial avulsion fracture was interpreted as premature failure, indicating a decrease in the specimen’s potential strength. The size of the animals was not a factor contributing to the predominant mode of failure. The different types of failure were distributed throughout each strain-rate group regardless of the weight of the animal. In addition, juvenile animals were not used, which could have biased the results toward a higher frequency of tibial avulsion fractures.
Analysis of Failure-Mode Mechanisms
Macroscopic Analysis
High-speed films of specimen loadings demonstrated that the mechanism of failure usually involved both the bony and the ligamentous components in a progressive manner until complete failure occurred. Sequential failure of ligament fibers commonly occurred first, prior to major tibial avulsion fractures. In other specimens, minor avulsion fractures were associated with major ligamentous failure (Fig. 4-19).
Microscopic Analysis
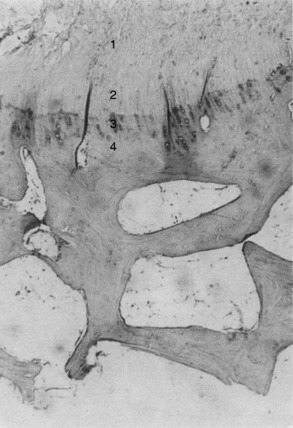
Microscopic analyses were conducted after the loading tests to define the mechanisms of specimen failure. Resorption changes at the bone-ligament interface, indicative of premature failure, were not visualized in any of the femoral or tibial insertion sites. Polarized light microscopy demonstrated that the ACL inserted at femoral and tibial sites through four well-defined zones of fibrocartilage (see Fig. 4-19).17 The zonal arrangement at the insertion site represents a change in composition of the surrounding medium as the ligament collagen fibers (zone 1) pass through fibrocartilage (zone 2), across a blue line to mineralized fibrocartilage (zone 3), and into the bone (zone 4).
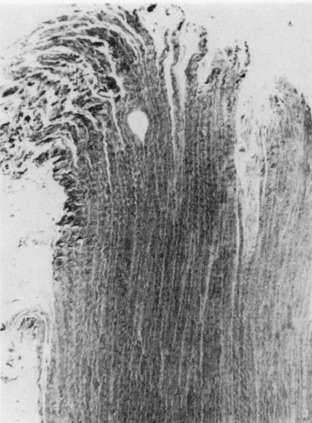
The specimens in this investigation demonstrated three histologic modes of failure, which were consistent with the macroscopic observations. First, ligamentous failure occurred by an initial tensile failure of collage fibers, followed by a pulling-apart shear failure of the disrupted fibers (Fig. 4-20). Rupture of collagen fiber bundles was also observed throughout the ligament. The ligament fiber microgeometry under the loading conditions in the experiment determined which fibers were subjected to the greatest deformation leading to the serial rupture of fibers and accounted for rupture of fibers in areas adjacent to intact fibers. Although branching between individual collagen fiber bundles was observed, the pulling-apart type of failure suggests that little in the way of cohesive properties exists between the major fiber bundles. A more explicit definition of the mechanism of failure of collagen tissues also involves the ultrastructural changes of fibrils and microfibrils under failure conditions.56
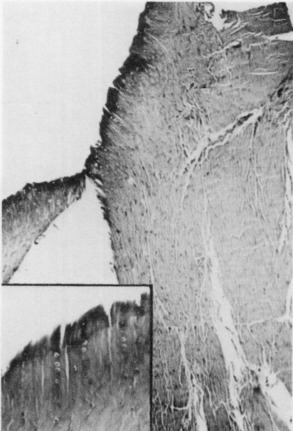
Second, avulsion fracture at the attachment site occurred most commonly through the cancellous bone immediately beneath the dense cortical bone (Fig. 4-21). The minute gritty material sometimes just barely palpable on the end of the ligament after failure represented fragments of bone beneath the cartilaginous zone of ligament insertion.56
Third, cleavage at the ligament-bone interface showed a predilection for the fracture cleavage line to occur through the zone of mineralized fibrocartilage (zone 3) at or just distal to the blue line. Failure at this interface was the least common mode of failure. It was identified microscopically in 6 of 22 specimens; however, it represented only a minor part of the failure process, the major failure having occurred by either a ligamentous or a bone avulsion mode. Failure through the fibrocartilaginous zone was, therefore, never the major mode of specimen failure, but not infrequently accompanied the other two modes of failure.56
In summary, it was possible to classify the major mechanism of failure histologically, although minor modes of failure involved to different degrees all portions of the bone-ligament-bone unit. Thus, it was not unusual to find microscopic evidence of minor to moderate ligament disruption associated with major bone avulsion failures or vice versa.56
This study showed for the first time that an ACL-ligament-bone preparation failed at a higher load and at greater elongation, and absorbed significantly more energy, at a fast rate of deformation than at a slow rate. These findings show the time-dependent behavior of bone-ligament-bone preparations and questioned the results of prior ligament failure studies that often showed premature bone failure at less than expected failure loads. At the slow deformation rate, the bone insertion area of the tibia was the weakest component. At the fast deformation rate, the ligament and tibial osseous component were balanced as to strength properties with an increased frequency of ligamentous failure.56 The specimen under the fast-deformation rate withstood greater loads without premature osseous failure, allowing the ligament to participate in the failure process.67 Even with expected viscoelastic effects in the ligament as a result of the higher strain rate, the strength of the bone increased faster than did an expected increase in strength of the ligament.56
Many cadaveric and experimental animal studies have reported the difficulty of producing ligamentous injuries and have traditionally stated that the bone is the weakest component of the bone-ligament-bone system.34,52,73,78,7984,85,93 Other than the difficulty in reproducing in the laboratory the complex loading and displacement conditions that occur in traumatic injuries, the deformation rate of the experimental tests and the effect of disuse-induced bone changes due to animal caging or aged cadavers are believed to be the major explanations for premature bone avulsion of the ligament-bone unit.56
In agreement with these results, Welsh and associates89 demonstrated that the failure mode of a calcaneal–Achilles tendon unit changed from bone avulsion at low deformation rates to failure at the tendon-grip apparatus under high deformation rates. The ultimate load of the specimens in that investigation may not have been obtained because of the difficulty of clamping the tendons; however, the bone insertion site did not fail at the high strain rate despite the specimen reaching a higher load.
In cases of tibial avulsion fracture, the ligament failure component could not be appreciated on gross examination after the test. In view of the demonstrated elongation on the ligament in the region of failure, it is reasonable to expect damage to collagen fibers and blood vessels within the ligament, even though continuity remains. It is well appreciated that the visual determination of continuity of a ligament at surgery provides an inadequate determination of the extent of ligament damage that has actually occurred and its functional capacity. Such factors, among others, may contribute to the occasional unsatisfactory result in cases of partial ligament disruption with continuity and in cases of ligament reinsertion after bone avulsion.56
The fibrocartilaginous zone at the ligament insertion site is believed to be advantageous in producing a gradual change in mechanical properties, decreasing the stress-concentration effect of the ligament’s insertion into the stiffer bone structure.17 This zone protects against fatigue and shear failure at the bone-ligament junction, providing a composite structure with the addition of cartilage and mineralized fibrocartilage to the collagen network. The fibrocartilaginous ground substance may provide greater cohesion between fiber bundles and provide a mechanism for diffusion of load over the entire insertion site, avoiding the deleterious effects of stress concentration. Based on the microscopic analysis of specimen failure and the infrequent occurrence of failure through the fibrocartilaginous zone, the zonal insertion arrangement appears to be mechanically advantageous.56
EFFECTS OF IMMOBILIZATION AND DISUSE ON LIGAMENT BIOMECHANICAL PROPERTIES
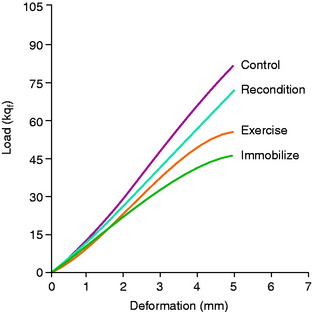
It is well appreciated that immobility may lead to deleterious changes in bone, joint, and soft tissue.* The authors conducted a study to determine the effect of altered activity levels on the mechanical properties of ligaments in primates.60 Whereas exercise is accepted as beneficial in preventing muscle atrophy and maintaining joint motion, its effect in preventing deterioration or strengthening a bone-ligament-bone unit had not been established. The study simulated certain clinical states of immobility and determined: (1) the effect of immobilization on the mechanical properties of a bone-ligament-bone unit, (2) the effect of an exercise program in preventing changes in these properties, and (3) the extent to which the changes remained after a 20-week reconditioning period. The reader is referred to the publication for the detailed explanation of the study.60
The results showed that 8 weeks of immobilization produced a marked decrease of nearly one half of the maximum failure load (P < .001; Table 4-2). No significant differences were found in ultimate failure load between the immobilized or the exercise group or between the right and the left ligament units from the exercised group. The failure load for the reconditioned animals indicates partial but incomplete recovery at 20 weeks (Fig. 4-22).
TABLE 4-2 Effect of Immobilization, Exercise, and Reconditioning on Biomechanical Properties of Primate Femur–Anterior Cruciate Ligament–Tibia Complex Preparations*
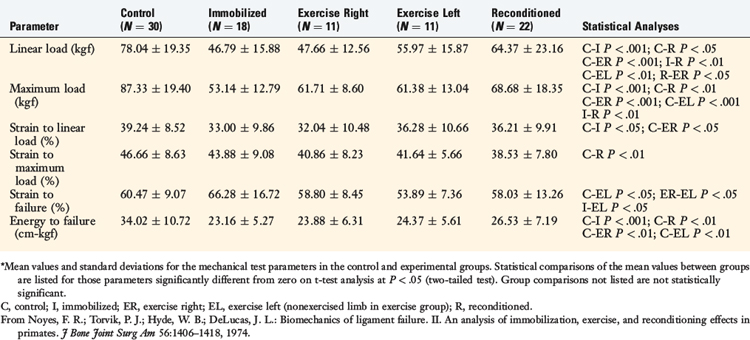
The mechanism of failure of a ligament-bone unit after disuse-induced changes depends on the anatomic characteristics at the ligament-bone insertion site. Most knee ligaments insert into bone through the well-defined zones of fibrocartilage previously described.17,46,56,68 These zones appear to be protective, because subsynovial and subperiosteal (femoral site) resorption of bone was observed at the peripheral margins of the ligament insertion site but not at the ligament-bone junction. Ultimate failure of the ligament unit occurred either through the underlying cortical bone at the insertion site or through the body of the ligament (or at both of these locations), but not through the ligament-bone junction. This protective effect of the fibrocartilage probably also applies to tendons that have a similar type of attachment.17,68,74 The zone also imposes a barrier to a vascular supply of the ligament from the bone beneath the insertion site.68 The tibial attachment of the long fibers of the MCL is into the periosteum and Sharpy fibers without a fibrocartilaginous interface. Immobility has a pronounced effect on producing subperiosteal bone reabsorption that decreases the tibial MCL attachment site strength, resulting in premature failure prior to involving the ligament in the failure process.41,43,46 Because of the premature attachment failure, the use of a MCL bone-ligament unit is not ideal and disuse-induced cage confinement of experimental animals induces this as a variable affecting the results. The authors agree with Laros and coworkers46 that the reported increase in ligament strength above control values resulting from increased activity in animals may represent the prevention or reduction of the disuse effect of caging.
The effect of immobility on the ligament itself is of importance to its mechanical function. The change in the relationship between force and ligament elongation (stiffness) after immobilization correlated with the inactivity of the primates. The exercised ligament units were somewhat less affected than the fully immobilized specimens. Both groups were significantly different compared with the control group. The stiffness of the ligament unit in the reconditioned specimens had nearly returned to normal at 20 weeks, although the recovery in strength was incomplete. Other studies have shown a similar correlation between the general level of activity during confinement and the strength of a ligament unit.1,46,78,80,85,93
STRENGTH OF THE ACL: AGE-RELATED AND SPECIES-RELATED CHANGES
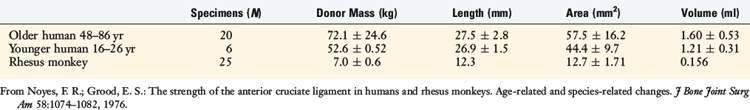
Important changes occur in the functional properties of bone-ligament units with age and, as well, differences from one animal species to another. The authors57 conducted a study in which the mechanical properties of ACL specimens from humans and rhesus monkeys were determined in tension to failure under high strain-rate conditions. The age of the cadaver specimens ranged from 16 to 86 years. One of the purposes of the study was to determine whether discrepancies in strength and mechanisms of ligament failure between human and animal specimens were due to size differences, to variables in the human specimens such as age or disuse atrophy, or to certain experimental testing variables. In addition, human data are required to define the strength properties required for ACL graft replacements.
Comparison of Size Parameters
The mass of the rhesus animals was small in comparison to that of the human donors (Table 4-3). The ligament lengths and areas of the animals were approximately one half and one fourth those in the human donors, respectively.
Comparison of Structural Parameters
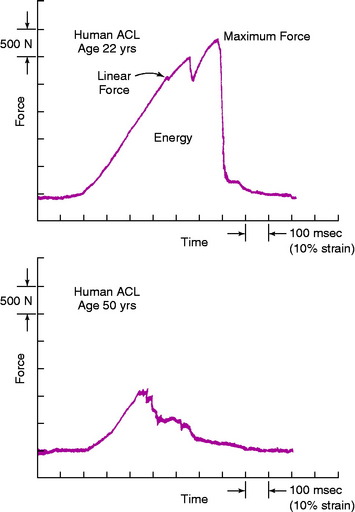
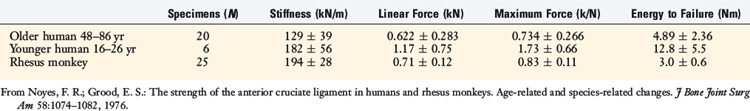
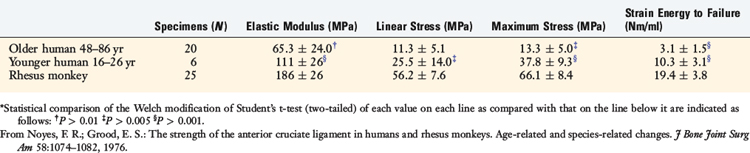
A typical force/elongation curve for one young and one older adult human specimen is shown in Figure 4-23. The mean values for the stiffness and strength parameters of the human and rhesus ligament specimens are shown in Table 4-4. A significant difference was found between the older and the younger human specimens. The preparations from the younger humans failed at a maximum force that was an average of 2.4 times that of the specimens from the older humans. The ligaments from the animals failed at force values higher than those of the older human specimens, despite an approximate fivefold difference in the respective cross-sectional areas of the ligaments.
Comparison of Material Properties
The data shown in Table 4-5 represent measurements of the mechanical properties of the ligament collagen as a material. They are normalizations of the structural parameters, adjusted for variations in the cross-sectional areas and lengths of the specimens. There were large differences in all parameters shown between ligaments from younger and older humans. The mean value for the elastic modulus of the ligaments from young adult humans was 1.7 times that of the ligaments from the older humans, but was significantly lower than the mean value for the ligaments from the animals.
Age-related Changes
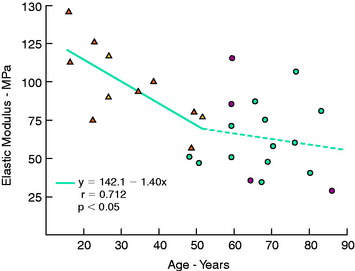
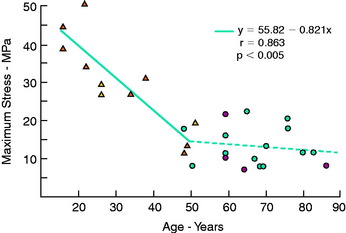
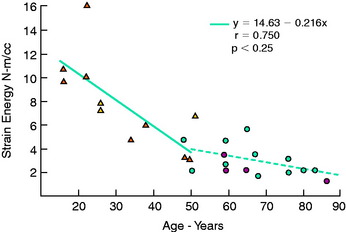
The regression equation (y) and correlation coefficient (r) for the specimens that failed by a ligamentous mode are shown in Figure 4-24. Maximum stress showed the highest correlation with age (R = 0.863; P < .005). A low correction was found with strain energy to failure (0.75) and elastic modulus (0.712), but all correlations were statistically significant.
Histologic Findings
The histologic findings frequently included other minor modes of failure involving all other portions of the ACL unit, as previously described.56,60
Comparison of Ligament Structural Properties
Alm and colleagues2 conducted a study on the tensile strength of the canine cruciate ligament in which the data was normalized by calculating the ratio between ligament separation force and animal mass. Ratios were reported ranging from 80 to 95 N/kg body mass. Similar ratios ranging from 80 to 118 N/kg body mass may be calculated from data reported by Viidik84,85 in the rabbit model. Smith73 reported a ratio that ranged from 40 to 80 N/kg of body mass in rabbits. A ratio of 119 N/kg body mass was found in the rhesus monkey preparations in the authors’ study, and the specimens from older and younger humans had ratios of 10 and 33 N/kg of body mass, respectively. The human maximum force ratios were markedly low in comparison with those of the rhesus animals as well as other animal models.
Age-related Changes
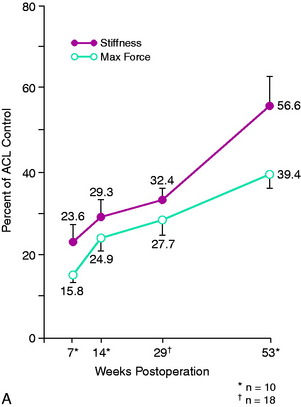
Kennedy and colleagues44 reported an ultimate tensile strength of 626 N for human specimens obtained from donors with a mean age of 62 years. Trent and coworkers81 reported a range of 285 to 1718 N in five cadaver specimens with a donor age of 29 to 55 years. Woo and associates91 evaluated the structural properties of 27 pairs of human cadaver knees to determine effects of specimen age on the tensile properties of the FATC. Tensile tests of the bone-ligament unit were performed at 30° of knee flexion with the ACL aligned vertically along the direction of applied tension load. One knee from each pair was oriented anatomically, and the second knee was oriented with the tibial aligned vertically. Specimen age did not affect anteroposterior (AP) displacement tests in intact knees at 30° and 90° of flexion. Structural properties of linear stiffness, ultimate load, and energy absorbed significantly decreased with specimen age (Fig. 4-25). Specimen orientation affected these properties, because higher values were found in specimens tested in the anatomic orientation (Table 4-6).
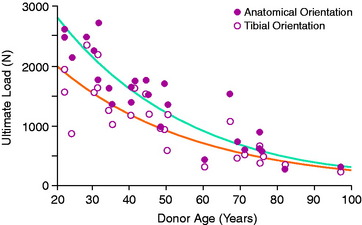
TABLE 4-6 Effects of Specimen Age and Orientation on the Structural Properties of the Femur–Anterior Cruciate Ligament–Tibia Complex*
Other studies of age-related changes in the mechanical properties of collagenous soft tissues have shown increases in tensile strength and stiffness and decreases in elongation properties with aging.86,87 However, these studies involved young animals, and the results reflect a maturation process rather than aging, which were probably related to changes in insoluble collagen, increased intermolecular and intramolecular cross-linking, and increases in the collagen-to-glycosaminoglycan and collagen-to-water ratios.73 The physiochemical and mechanical changes that occur in collagen after completion of maturation, which can be ascribed to an aging process in the absence of adverse environmental or disease factors, have not been defined.
EFFECT OF INTRA-ARTICULAR CORTICOSTEROIDS ON LIGAMENT PROPERTIES
The effect of an intra-articular, slightly soluble corticosteroid (methylprednisolone acetate) was investigated on the mechanical properties of a ligament unit.58,59 ACL preparations from wild rhesus animals were used to determine the effect of corticosteroid dosage and time duration after administration.
Direct Steroid Injection into Ligament
In the first study, animals were divided into a control group, a sham control group (saline injection), a 20-mg large-dosage group, and a 4-mg small-dosage group (methylprednisolone acetate).12,58 The large-dosage group was studied at 6 and 15 weeks after injection, and the small-dosage group was studied at 15 and 52 weeks. The FATC specimens were tested in tension to failure using a procedure previously described.56
Intra-articular Steroid Injection
In the second investigation, two animal groups were studied.59 The first group (high corticosteroid dosage) comprised 10 animals that received a total of three intra-articular injections of methylprednisolone acetate (6.0 mg/kg) into one knee. The injections were spaced 1 week apart. A sham procedure was performed on the opposite knee that consisted of an intra-articular saline injection in equal volume to that of the drug. These animals were sacrificed 6 weeks after the first injection. The second group (low corticosteroid dosage) comprised 12 animals that received two injections of a dosage one tenth that used in the other animal group (methylprednisolone acetate 0.6 mg/kg). The two injections were given 2 weeks apart, with a sham saline injection administered into the opposite knee. The animals were sacrificed 15 weeks after the first injection.
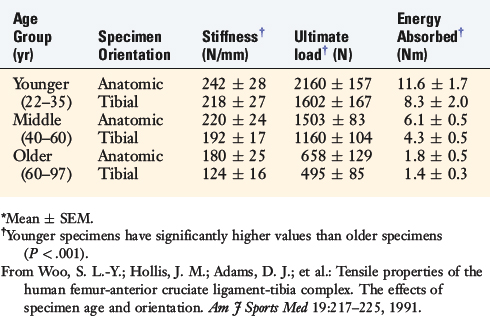
A load-versus-time record from a typical right and left specimen pair in an animal from the high corticosteroid dosage group is shown in Figure 4-26. The strain parameters are approximated owing to inherent errors in measuring ligament length and in using the tibia-femur separation distance as a measure of ligament elongation during testing.
The histologic analysis of the failed ligament units showed no detectable corticosteroid effect in that the fibrocartilage zones at the ligament insertion sites were intact. There were no bone resorptive changes at the ligament attachment sites. On scanning electron microscopy, no alterations were found in the surface appearance of collagen fibers and fibrils in the ligaments that received the corticosteroid.59
Wiggins and colleagues90 and Walsh and coworkers88 reported extensive studies on the effect of a steroid injection in human equivalent doses on the healing of a rabbit MCL model. Their data show statistically significant reductions in maximum failure loads and alteration in histologic properties compared with appropriate controls. The authors concluded that a single steroid injection at the site of a healing ligament would decrease or retard healing properties; however, they suggested that the effect was probably reversible. The authors reviewed a number of mechanisms for the deleterious effects. It should be noted that the studies were performed on a rabbit model that exhibits a known hypersensitivity to steroids that is more pronounced than that expected in other animals and humans.
EFFECT OF VASCULARIZED AND NONVASCULARIZED ACL GRAFTS ON BIOMECHANICAL PROPERTIES
After ACL graft reconstruction, there is marked cellular invasion that removes necrotic collagenous tissues with replacement collagenous fibers that are a ligament in a parallel fashion, but do not resemble the native microgeometry of the ACL. The question that has been posed is whether maintaining a vascular supply (and any concomitant neural innervation) of an ACL graft would limit the so-called necrotic phase of ligament remodeling and retain more normal ligament functional properties. An investigation was conducted to measure the mechanical properties of patellar tendon autografts used to replace the ACL in the cynomolgus monkey at four time periods up to 1 year.11 The ACL was replaced with the medial half of the patellar tendon as a vascularized graft in one knee and as a nonvascularized (or free) graft in the contralateral knee. The 5-mm-wide medial patellar tendon free grafts were prepared through a standard medial parapatellar exposure. The vascularized grafts were prepared in a similar manner, except the medial retinacular vascular supply and a portion of the fat pad were preserved. The tibial attachment sites were prepared by producing a thin bony trough in the anteromedial aspect of the tibia to the site of the ACL attachment, and the ACL grafts with the vascularized pedicle were transposed into a bony trough. An identical tibial and femoral placement was used for the free grafts. Standard graft fixation methods were used. The knees were immobilized for 4 weeks at 30° of flexion followed by unrestricted activity in large cages.
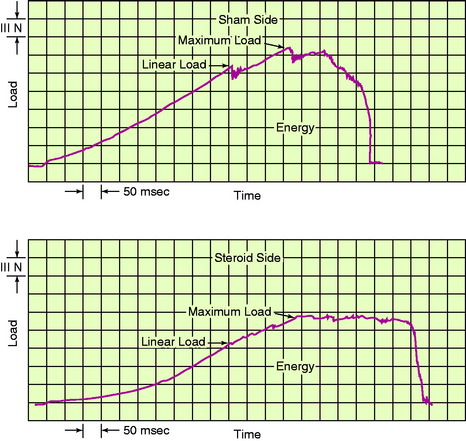
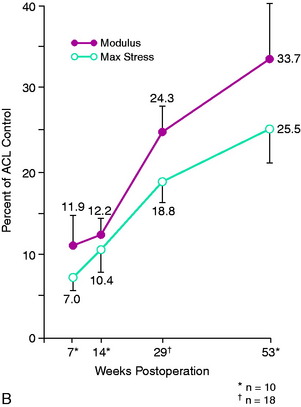
Both the vascularized and the nonvascularized grafts underwent significant reductions in structural mechanical and material properties as early as 7 weeks after surgery. Stiffness values were as low as 24% to 28% of control ACL and medial patellar tendon values. Maximum force at 7 weeks was 16% of control ACL values, increasing to 39% of control maximum force by 1 year (Fig. 4-27A). Modulus and maximum stress showed even greater reductions and were only 34% and 26%, respectively, of control ACL values at 1 year (see Fig. 4-27B). The rate of return was slow up to 1 year for all variables studied. The changes in maximum force over time were generally consistent with other studies that used free grafts, showing on a mechanical basis that an extended period of time is required for ACL graft remodeling and partial return of strength. The study concluded that retention of a portion of the blood supply to the ligament is not sufficient to avoid a major reduction in ligament mechanical properties that occur in vivo after implantation.
EFFECT OF CELLULAR NECROSIS AND STRESS-SHIELDING ON ACL HEALING AND RETENTION OF NATIVE ACL FIBER MICROARCHITECTURE
Jackson and associates37–39 performed a series of landmark studies in a goat model in which the ACL was frozen in situ, producing cellular necrosis while retaining the normal fiber microarchitecture. Mechanical loading tests of the ACL bone-ligament-bone preparation at 6 months showed no difference in the maximum failure load, stiffness, or AP translation compared with those in untreated controls. The authors theorized that the large decreases in ACL mechanical properties and strength in experimental animals after ACL reconstruction could not be explained by cell death and devascularization.
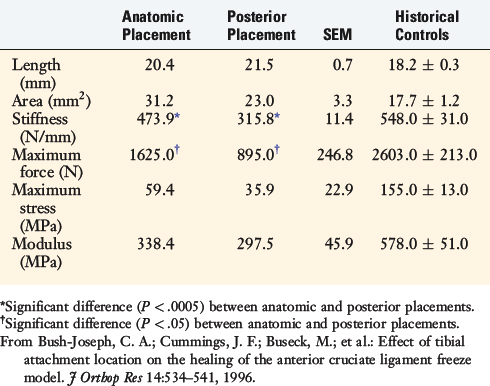
To provide additional experimental information, a study was conducted in the authors’ laboratory in which the previously described devitalized freeze model in the goat ACL was used and two conditions were added.10 In one group of knees, the ACL tibial attachment was elevated by osteotomy and then replaced in its normal anatomic position. In a second group of knees, the ACL tibial attachment was osteotomized and replaced on the tibia 5 mm posterior to its normal attachment to study the effects of an altered loading state (stress-shielding) on ligament remodeling properties. The results of the ACL mechanical failure tests are summarized in Table 4-7. The stiffness, maximum force, and stress and modulus were greater in the anatomic placement group than in the posterior ACL placement group; however, they were still less than historical controls. Increased failures were noted at the tibial attachment site in the posterior ACL placement group.
Based on a series of studies,37–39 Jackson et al concluded that large decreases in ACL mechanical properties and strength in experimental animals after ACL reconstruction could not be explained by cell death and devascularization.
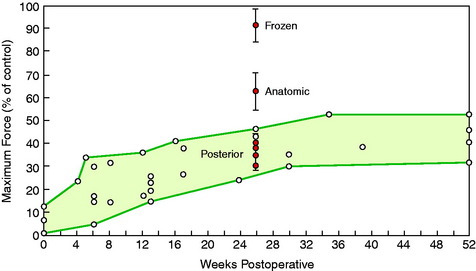
The results of all of the studies* are summarized in Figure 4-28, which compares historical maximum failure loads in experimental animals with the frozen devitalized specimens in Jackson and associates’ study38 and the anatomic- and posterior-placed ACL preparations.10 Although the anatomic-placed ACL (after tibial osteotomy) had a reduction in strength compared with the native frozen ACL, the strength was still greater than ACL graft reconstructions. The presumed loss of the normal stress and fiber loading in the posterior-placed ACL, in addition to tibial healing effects, produced marked reductions in all mechanical properties.
ALLOGRAFTS AND AUTOGRAFTS: BIOMECHANICAL PROPERTIES AFTER IMPLANTATION AND EFFECT OF IRRADIATION
Multiple studies have been published on the biomechanical properties of autografts and allografts in experimental animal models.3,10,20,37–40,70,71,77,83 The majority demonstrate that allografts have inferior results compared with those of autografts (and contralateral controls) in regard to mechanical strength properties. In 1989, Thorson and colleagues77 studied the 4-month postoperative mechanical properties of adult canines that received either bone-tendon-bone allografts or autografts. The allograft group showed a mean load to failure of only 17% of the contralateral control ligament, compared with 41% in the autograft group. Shino and coworkers,70,71 in two studies using the canine model, reported that allografts had a mean maximum tensile load of approximately 30% that of contralateral controls 1 year postimplantation. Jackson and associates39 reported in 1993 in a goat model that the strength of fresh frozen patellar tendon allografts was only 27% of controls at 6 months postimplantation. In contrast, the strength of patellar tendon autografts was 62% of control ACLs. The authors concluded that allograft remodeling is much slower than autograft and suggested that patients who receive allografts should probably be protected against maximum activities for a longer period of time than those who receive autografts.
In another study in which freeze-dried bone-ACL-bone allografts were implanted, Jackson and associates37 reported that the maximum load of the allografts was only 25% of the contralateral ACL controls at 1 year postimplantation. Figure 4-2910 summarizes a number of allograft ACL reconstruction studies and demonstrates that all had mechanical properties in low ranges from 4 to 52 weeks postoperative. The healing effects of autografts and allografts are covered in greater detail in Chapter 5, Biology of ACL Graft Healing.
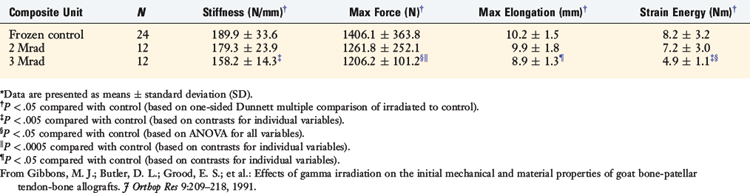
The authors’ laboratory has studied the effects of gamma irradiation on the mechanical and material properties of allografts in the goat model and in human cadavers. In the first study, Gibbons and colleagues25 reported on the effects of 2 and 3 Mrads of gamma irradiation on goat ACL bone–patellar tendon–bone in vitro properties. The study reported that the maximum stress, maximum strain, and strain energy were significantly reduced after 3 Mrads; however, there were no signification reductions after 2 Mrads of irradiation (Table 4-8).
TABLE 4-8 Dose-dependent Effects of Gamma Irradiation on Composite Unit Structural Mechanical Properties*
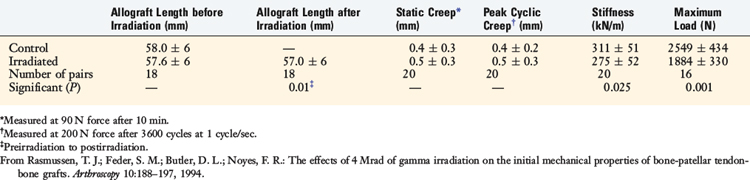
In a second study, the effects of a higher level of irradiation (4 Mrad) were studied on human cadaver donor (aged 18–59 yr) frozen patellar tendon-bone allografts and were compared with a frozen control graft (0 Mrad).64 Irradiation produced a small, but significant, decrease in graft length (0.6 mm; P < .01; Table 4-9). The irradiated grafts showed significant reductions in stiffness (P < .025) and maximum force (P < .001).
TABLE 4-9 Effects of 4 MRads of Irradiation on Human Patellar Tendon–Bone Allograft Length and Mechanical Properties
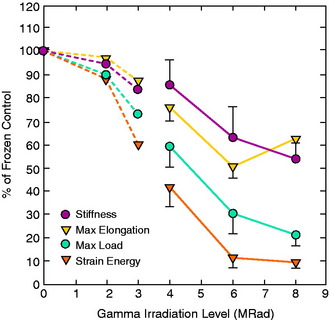
In a third study, Salehpour and associates66 studied the effects of 4, 6, and 8 Mrad (40,000, 60,000, or 80,000 Gys) of gamma irradiation on the in vitro properties of a bone–patellar tendon–bone allograft unit retrieved from mature female goats. On average, stiffness decreased by 18%, 40%, and 42% at 4, 6, and 8 Mrad, respectively (P < .05 for all comparisons). The data as a whole showed the overall dose-dependent effects of irradiation on ligament mechanical properties. Doses less than 2 Mrad have minimal effects. Recently, Schwartz and coworkers69 examined the in vivo effect of 4 Mrad of gamma irradiation on bone–patellar tendon–bone units in adult goats at time 0 and 6 months postimplantation. The irradiation significantly altered structural but not material properties. Stiffness was reduced by 30% and maximum force by 21%, resulting in these parameters averaging 12% to 20% of normal ACL values (Table 4-10).
TABLE 4-10 Structural Properties of Anterior Cruciate Ligament Allografts 6 Months Postimplantation in Caprine Model
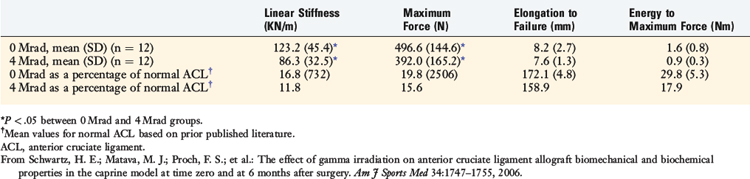
The authors concluded that 4 Mrad of gamma irradiation affect ACL allograft subfailure viscoelastic and structural properties but not material or biochemical properties over time. The ACL allografts of the 0 Mrad failed at 497 N (see Table 4-9), which in comparison with the first study of Gibbons and associates25 showed a control graft of 1400 N maximum force. This suggests that the effects of the remodeling process, resulting in a weakened graft with altered mechanical properties as previously described, produced even more profound deleterious effects than the irradiation treatment. At present, there are no experimental data to show that the low-dose irradiation as used to secondarily sterilize allografts has a deleterious effect on graft mechanical properties. One clinical study63 reported inferior outcomes in knees that received irradiated Achilles tendon allografts compared with knees that received frozen Achilles tendon allografts, and the authors recommended that other secondary sterilization methods be pursued. These concepts are further discussed in Chapter 7, ACL Primary and Revision Reconstruction: Diagnosis, Operative Techniques, and Clinical Outcomes. The authors prefer to obtain allografts for patients from tissue banks that use secondary chemical sterilization for bacterial contamination.
1 Adams A. Effect of exercise upon ligament strength. Res Q. 1966;37:163-167.
2 Alm A., Ekstrom H., Stromberg B. Tensile strength of the anterior cruciate ligament in the dog. Acta Chir Scand Suppl. 1974;445:15-23.
3 Arnoczky S.P., Warren R.F., Ashlock M.A. Replacement of the anterior cruciate ligament using a patellar tendon allograft. An experimental study. J Bone Joint Surg Am. 1986;68:376-385.
4 Barfred T. Experimental rupture of the Achilles tendon. Comparison of experimental ruptures in rats of different ages and living under different conditions. Acta Orthop Scand. 1971;42:406-428.
5 Beynnon B.D., Fleming B.C., Johnson R.J., et al. Anterior cruciate ligament strain behavior during rehabilitation exercises in vivo. Am J Sports Med. 1995;23:24-34.
6 Beynnon B.D., Johnson R.J., Fleming B.C., et al. The measurement of elongation of anterior cruciate-ligament grafts in vivo. J Bone Joint Surg Am. 1994;76:520-531.
7 Beynnon B.D., Johnson R.J., Fleming B.C., et al. The strain behavior of the anterior cruciate ligament during squatting and active flexion-extension. A comparison of an open and a closed kinetic chain exercise. Am J Sports Med. 1997;25:823-829.
8 Bradley J., FitzPatrick D., Daniel D., et al. Orientation of the cruciate ligament in the sagittal plane. A method of predicting its length-change with flexion. J Bone Joint Surg Br. 1988;70:94-99.
9 Burmester L., editor. Lehrbuch der Kinematik. Leipzig, Germany: A. Felix Verlag, 1888.
10 Bush-Joseph C.A., Cummings J.F., Buseck M., et al. Effect of tibial attachment location on the healing of the anterior cruciate ligament freeze model. J Orthop Res. 1996;14:534-541.
11 Butler D.L., Grood E.S., Noyes F.R., et al. Mechanical properties of primate vascularized vs. nonvascularized patellar tendon grafts; changes over time. J Orthop Res. 1989;7:68-79.
12 Butler D.L., Grood E.S., Noyes F.R., Zernicke R.F. Biomechanics of ligaments and tendons. Hutton R., editor. Exercise and Sports Science Review. Philadelphia: Franklin Institute Press; 1978;Vol. 6:125-182.
13 Butler D.L., Hulse D.A., Kay M.D., et al. Biomechanics of cranial cruciate ligament reconstruction in the dog. II. Mechanical properties. Vet Surg. 1983;12:113-118.
14 Clancy W.G., Narechania R.G., Rosenberg T.D., et al. Anterior and posterior cruciate ligament reconstruction in rhesus monkeys. A histological, microangiographic, and biomechanical analysis. J Bone Joint Surg Am. 1981;63:1270-1284.
15 Collins H.R., Hughston J.C., Dehaven K.E., et al. The meniscus as a cruciate ligament substitute. J Sports Med. 1974;2:11-21.
16 Cooper R.R. Alterations during immobilization and regeneration of skeletal muscle in cats. J Bone Joint Surg Am. 1972;54:919-953.
17 Cooper R.R., Misol S. Tendon and ligament insertion. A light and electron microscopic study. J Bone Joint Surg Am. 1970;52:1-20.
18 Crisp J.D.C. Properties of tendon and skin. In: Fung Y.C., Perrone N., Anliker M., editors. Foundations and Objectives. NJ: Prentice-Hall: Englewood Cliffs; 1972:141-177.
19 Crowninshield R., Pope M.H., Johnson R.J. An analytical model of the knee. J Biomech. 1976;9:397-405.
20 Curtis R.J., Delee J.C., Drez D.J.Jr. Reconstruction of the anterior cruciate ligament with freeze-dried fascia lata allografts in dogs. A preliminary report. Am J Sports Med. 1985;13:408-414.
21 Elliott D.H. Structure and function of mammalian tendon. Biol Rev Camb Philos Soc. 1965;40:392-421.
22 Enneking W.F., Horowitz M. The intra-articular effects of immobilization on the human knee. J Bone Joint Surg Am. 1972;54:973-985.
23 Fick R., editor. Anatomie und mechanik der gelenke. Part I: anatomie der gelenke; Part II: allgemeine gelenk- und muskelmechanik; Part III: apezielle gelenk- und muskelmechanik. Jena: Germany: Gustav Fischer, 1911.
24 Geiser M., Trueta J. Muscle action, bone rarefaction and bone formation: an experimental study. J Bone Joint Surg Br. 1958;40:282-311.
25 Gibbons M.J., Butler D.L., Grood E.S., et al. Effects of gamma irradiation on the initial mechanical and material properties of goat bone–patellar tendon–bone allografts. J Orthop Res. 1991;9:209-218.
26 Ginsberg J.M., Eyring E.J., Curtiss P.H.Jr. Continuous compression of rabbit articular cartilage producing loss of hydroxyproline before loss of hexosamine. J Bone Joint Surg Am. 1969;51:467-474.
27 Grant M.E., Prockop D.J. The biosynthesis of collagen. 1. N Engl J Med. 1972;286:194-199.
28 Grood E.S., Hefzy M.S., Lindenfeld T.N. Factors affecting the region of most isometric femoral attachments. Part I: the posterior cruciate ligament. Am J Sports Med. 1989;17:197-207.
29 Harner C.D., Livesay G.A., Kashiwaguchi S., et al. Comparative study of the size and shape of human anterior and posterior cruciate ligaments. J Orthop Res. 1995;13:429-434.
30 Harner C.D., Zerogeanes J.W., Livesay G.A., et al. The human posterior cruciate ligament complex: an interdisciplinary study. Ligament morphology and biomechanical evaluation. Am J Sports Med. 1995;23:736-745.
31 Hefzy M.S., Grood E.S. Sensitivity of insertion locations on length patterns of anterior cruciate ligament fibers. J Biomech Eng. 1986;108:73-82.
32 Hefzy M.S., Grood E.S., Noyes F.R. Factors affecting the region of most isometric femoral attachments. Part II: the anterior cruciate ligament. Am J Sports Med. 1989;17:208-216.
33 Holden J.P., Grood E.S., Butler D.L., et al. Biomechanics of fascia lata ligament replacements: early postoperative changes in the goat. J Orthop Res. 1988;6:639-647.
34 Horwitz M.T. Injuries of the ligaments of the knee joint. An experimental study. Arch Surg. 1939;38:946-954.
35 Hruza Z., Chvapil M., Dlouha M. The influence of age, sex and genetic factors on the mechanical and physico-chemical structural stability of collagen fibres in mice. Gerontologia. 1967;13:20-29.
36 Issekutz B.Jr., Blizzard J.J., Birkhead N.C., Rodahl K. Effect of prolonged bed rest on urinary calcium output. J Appl Physiol. 1966;21:1013-1020.
37 Jackson D.W., Grood E.S., Arnoczky S.P., et al. Freeze-dried anterior cruciate ligament allografts. Preliminary studies in a goat model. Am J Sports Med. 1987;15:295-303.
38 Jackson D.W., Grood E.S., Cohn B.R., et al. The effects of in situ freezing on the anterior cruciate ligament. An experimental study in goats. J Bone Joint Surg Am. 1991;73:201-213.
39 Jackson D.W., Grood E.S., Goldstein J.D., et al. A comparison of patellar tendon autograft and allograft used for anterior cruciate ligament reconstruction in the goat model. Am J Sports Med. 1993;21:176-185.
40 Jackson D.W., Grood E.S., Wilcox P., et al. The effects of processing techniques on the mechanical properties of bone–anterior cruciate ligament–bone allografts. An experimental study in goats. Am J Sports Med. 1988;16:101-105.
41 Jenkins D.P., Cochran T.H. Osteoporosis: the dramatic effect of disuse of an extremity. Clin Orthop Relat Res. 1969;64:128-134.
42 Kazarian L.E., Von Gierke H.E. Bone loss as a result of immobilization and chelation. Preliminary results in Macaca mulatta. Clin Orthop Relat Res. 1969;65:67-75.
43 Keim H.A. An analysis of periosteal attachment in human long bones of normal adults and adult paraplegics: an electron microscopic study. Clin Orthop Relat Res. 1967;54:207-214.
44 Kennedy J.C., Hawkins R.J., Willis R.B., Danylchuck K.D. Tension studies of human knee ligaments. Yield point, ultimate failure, and disruption of the cruciate and tibial collateral ligaments. J Bone Joint Surg Am. 1976;58:350-355.
45 Kharmosh O., Saville P.D. The effect of motor denervation on muscle and bone in the rabbit’s hind limb. Acta Orthop Scand. 1965;36:361-370.
46 Laros G.S., Tipton C.M., Cooper R.R. Influence of physical activity on ligament insertions in the knees of dogs. J Bone Joint Surg Am. 1971;53:275-286.
47 Markolf K.L., Hame S., Hunter D.M., et al. Effects of femoral tunnel placement on knee laxity and forces in an anterior cruciate ligament graft. J Orthop Res. 2002;20:1016-1024.
48 McFarland E.G., Morrey B.F., An K.N., Wood M.B. The relationship of vascularity and water content to tensile strength in a patellar tendon replacement of the anterior cruciate in dogs. Am J Sports Med. 1986;14:436-448.
49 McPherson G.K., Mendenhall H.V., Gibbons D.F., et al. Experimental mechanical and histologic evaluation of the Kennedy ligament augmentation device. Clin Orthop Relat Res. 1985;196:186-195.
50 Menschik A. The basic kinematic principle of the collateral ligaments demonstrated on the knee joint. In: Chapchal G., editor. Injuries of the Ligaments and Their Repair: Hand, Knee, Foot. Stuttgart: Thieme; 1977:9-16.
51 Menschik A. [Mechanics of the knee-joint. 1 (author’s trans.)]. Z Orthop Ihre Grenzgeb. 1974;112:481-495.
52 Miltner L.J., Hu C.H., Fang H.C. Experimental joint sprain. Pathologic study. Arch Surg. 1937;35:234-240.
53 Minns R.J., Soden P.D., Jackson D.S. The role of the fibrous components and ground substance in the mechanical properties of biological tissues: a preliminary investigation. J Biomech. 1973;6:153-165.
54 Mueller W., editor. The Knee—Form, Function and Ligament Reconstruction. New York: Springer-Verlag, 1983.
55 Ng G.Y., Oakes B.W., Deacon O.W., et al. Biomechanics of patellar tendon autograft for reconstruction of the anterior cruciate ligament in the goat: three-year study. J Orthop Res. 1995;13:602-608.
56 Noyes F.R., DeLucas J.L., Torvik P.J. Biomechanics of anterior cruciate ligament failure: an analysis of strain-rate sensitivity and mechanisms of failure in primates. J Bone Joint Surg Am. 1974;56:236-253.
57 Noyes F.R., Grood E.S. The strength of the anterior cruciate ligament in humans and rhesus monkeys. Age-related and species-related changes. J Bone Joint Surg Am. 1976;58:1074-1082.
58 Noyes F.R., Grood E.S., Nussbaum N.S., Cooper S.M. Biomechanical and ultrastructural changes in ligaments and tendons after local corticosteroid injections. Proceedings of the Orthopaedic Research Society, 1975 Annual Meeting. J Bone Joint Surg Am. 1975;57:876.
59 Noyes F.R., Grood E.S., Nussbaum N.S., Cooper S.M. Effect of intra-articular corticosteroids on ligament properties: a biomechanical and histological study in rhesus knees. Clin Orthop. 1977;123:197-209.
60 Noyes F.R., Torvik P.J., Hyde W.B., DeLucas J.L. Biomechanics of ligament failure. II. An analysis of immobilization, exercise, and reconditioning effects in primates. J Bone Joint Surg Am. 1974;56:1406-1418.
61 O’Connor J.T.S., FitzPatrick D. Geometry of the knee. In: Daniel D., Akeson W., O’Connor J., editors. Knee Ligaments: Structure, Function, Injury, and Repair. New York: Raven; 1990:163-199.
62 Partington F.R., Wood G.C. The role of non-collagen components in the mechanical behaviour of tendon fibres. Biochim Biophys Acta. 1963;69:485-495.
63 Rappe M., Horodyski M., Meister K., Indelicato P.A. Nonirradiated versus irradiated Achilles allograft: in vivo failure comparison. Am J Sports Med. 2007;35:1653-1658.
64 Rasmussen T.J., Feder S.M., Butler D.L., Noyes F.R. The effects of 4 Mrad of gamma irradiation on the initial mechanical properties of bone-patellar tendon-bone grafts. Arthroscopy. 1994;10:188-197.
65 Rigby B.J., Hiral N., Spikes J.D., Eyring H. The mechanical properties of rat tail tendon. J Gen Physiol. 1959;43:265-283.
66 Salehpour A., Butler D.L., Proch F.S., et al. Dose-dependent response of gamma irradiation on mechanical properties and related biochemical composition of goat bone–patellar tendon–bone allografts. J Orthop Res. 1995;13:898-906.
67 Sammarco G.J., Burstein A.H., Davis W.L., Frankel V.H. The biomechanics of torsional fractures: the effect of loading on ultimate properties. J Biomech. 1971;4:113-117.
68 Scapinelli R. Studies on the vasculature of the human knee joint. Acta Anat (Basel). 1968;70:305-331.
69 Schwartz H.E., Matava M.J., Proch F.S., et al. The effect of gamma irradiation on anterior cruciate ligament allograft biomechanical and biochemical properties in the caprine model at time zero and at 6 months after surgery. Am J Sports Med. 2006;34:1747-1755.
70 Shino K., Horibe S. Experimental ligament reconstruction by allogeneic tendon graft in a canine model. Acta Orthop Belg. 1991;57(suppl 2):44-53.
71 Shino K., Kawasaki T., Hirose H., et al. Replacement of the anterior cruciate ligament by an allogeneic tendon graft. An experimental study in the dog. J Bone Joint Surg Br. 1984;66:672-681.
72 Sidles J.A., Larson R.V., Garbini J.L., et al. Ligament length relationship in the moving knee. J Orthop Res. 1988;6:593-610.
73 Smith J.W. The elastic properties of the anterior cruciate ligament of the rabbit. J Anat. 1954;88:369-380.
74 Stilwell D.L.Jr., Gray D.J. The microscopic structure of periosteum in areas of tendinous contact. Anat Rec. 1954;120:663-677.
75 Strasser H., editor. Lehrbuch der Muskel- und Gelenkmechanik. Berlin: Springer, 1913.
76 Thompson R.C.Jr., Bassett C.A. Histological observations on experimentally induced degeneration of articular cartilage. J Bone Joint Surg Am. 1970;52:435-443.
77 Thorson E., Rodrigo J.J., Vasseur P., et al. Replacement of the anterior cruciate ligament. A comparison of autografts and allografts in dogs. Acta Orthop Scand. 1989;60:555-560.
78 Tipton C.M., James S.L., Mergner W., Tcheng T.K. Influence of exercise on strength of medial collateral knee ligaments of dogs. Am J Physiol. 1970;218:894-902.
79 Tipton C.M., Schild R.J., Flatt A.E. Measurement of ligamentous strength in rat knees. J Bone Joint Surg Am. 1967;49:63-72.
80 Tipton C.M., Schild R.J., Tomanek R.J. Influence of physical activity on the strength of knee ligaments in rats. Am J Physiol. 1967;212:783-787.
81 Trent P.S., Walker P.S., Wolf B. Ligament length patterns, strength, and rotational axes of the knee joint. Clin Orthop Relat Res. 1976;117:263-270.
82 van Rens T.J., van den Berg A.F., Huiskes R., Kuypers W. Substitution of the anterior cruciate ligament: a long-term histologic and biomechanical study with autogenous pedicled grafts of the iliotibial band in dogs. Arthroscopy. 1986;2:139-154.
83 Vasseur P.B., Rodrigo J.J., Stevenson S., et al. Replacement of the anterior cruciate ligament with a bone-ligament-bone anterior cruciate ligament allograft in dogs. Clin Orthop Relat Res. 1987;219:268-277.
84 Viidik A. Biomechanics and functional adaptation of tendons and joint ligaments. In: Evans F.G., editor. Studies on the Anatomy and Function of Bone and Joints. Berlin: Springer-Verlag; 1966:17-39.
85 Viidik A. Elasticity and tensile strength of the anterior cruciate ligament in rabbits as influenced by training. Acta Physiol Scand. 1968;74:372-380.
86 Viidik A. Functional properties of collagenous tissues. Int Rev Connect Tissue Res. 1973;6:127-215.
87 Vogel H.G. Correlation between tensile strength and collagen content in rat skin. Effect of age and cortisol treatment. Connect Tissue Res. 1974;2:177-182.
88 Walsh W.R., Wiggins M.E., Fadale P.D., Ehrlich M.G. Effects of a delayed steroid injection on ligament healing using a rabbit medial collateral ligament model. Biomaterials. 1995;16:905-910.
89 Welsh R.P., Macnab I., Riley V. Biomechanical studies of rabbit tendon. Clin Orthop Relat Res. 1971;81:171-177.
90 Wiggins M.E., Fadale P.D., Ehrlich M.G., Walsh W.R. Effects of local injection of corticosteroids on the healing of ligaments. A follow-up report. J Bone Joint Surg Am. 1995;77:1682-1691.
91 Woo S.L.-Y., Hollis J.M., Adams D.J., et al. Tensile properties of the human femur–anterior cruciate ligament–tibia complex. The effects of specimen age and orientation. Am J Sports Med. 1991;19:217-225.
92 Yoshiya S., Andrish J.T., Manley M.T., Bauer T.W. Graft tension in anterior cruciate ligament reconstruction. An in vivo study in dogs. Am J Sports Med. 1987;15:464-470.
93 Zuckerman J., Stull G.A. Effects of exercise on knee ligament separation force in rats. J Appl Physiol. 1969;26:716-719.