[level-membership-for-critical-care-medicine-category]
6 The changing health care system and its implications for the PACU
The health care system in the United States is one of the nation’s largest and most important economic sectors. It consists of all the resources and activities whose primary purpose is to promote, restore, or maintain the health of the American people.1 Continuous efforts have been made to improve the health care system’s ability to produce care that is safe, effective, patient-centered, timely, efficient, and equitable.2 An emphasis on safety implies that medical care should bring minimal harm to patients. Effectiveness highlights the importance of providing evidence-based services only to those who could benefit. Patient-centeredness emphasizes individualized care and the patients’ pivotal role in all clinical decisions. Timeliness underscores the significance of “reducing waits and sometimes harmful delays for both those who receive and those who give care.”2 Efficiency focuses on eliminating waste in the production of medical care, including overuse of medical resources and undue administrative costs. Finally, equity stresses the need for “providing care that does not vary in quality because of personal characteristics such as gender, ethnicity, geographic location, and socioeconomic status.”2 As health technology and the role of government in financing care have increased in the past 10 years, the health care system has played an increasingly important role in people’s lives. The rapid development of medical science and technology, changing economic and political environment, and soaring consumer expectations have profoundly changed what health care is and how it can be delivered. It is critical for postanesthesia nurses to understand the nation’s health care system.
A health care system is shaped by four functional components: financing, workforce development, service delivery, and regulation.1 This chapter provides a broad overview of these components, including how the health care system is financed, who provides health care services, what medical services are produced, and role of the government in the health care system. There is also a discussion of the issue of the uninsured population, a summary of the recent health care reform legislation, and an explanation of the implications for the post anesthesia care unit (PACU) and perianesthesia nurses.
Health care financing
In the United States, the private sector has a larger role in paying for health care costs than in most developed countries. Public programs are focused on health care for special population subgroups, such as senior citizens, low-income populations, veterans, and active duty and retired military personnel and their dependents. The financial burden of health care is shouldered by three major sponsors in the United States: businesses, households, and governments.3 Health care costs are billed through private insurance plans, out-of-pocket payments, philanthropic funds, and public programs.
Private business
Private businesses contribute to approximately one fifth of health care spending, in the form of employer-sponsored health insurance, contribution to Medicare, workers compensation, disability insurance, and worksite health care.3 Employers are the leading source of health coverage. The majority of employers (69% in 2010) offer health insurance as a fringe benefit to cover their employees as well as their employees’ dependents.4 Federal, state, and local governments, as employers, also make contributions to private health insurance programs to insure public employees. For example, in 2009, the federal government contributed $26.8 billion to the Federal Employees Health Benefits Program to cover more than 8 million federal employees, retirees, and their dependents, including members of the U.S. Congress.5
Employer-sponsored health insurance has been designed predominantly through managed care plans of various kinds in recent decades. Managed care plans are lower cost alternatives to conventional indemnity insurance by incorporating a wide range of organizational and financial arrangements to organize, reimburse, and monitor services. The most common type of managed care plans is the preferred provider organization (PPO). A PPO selectively contracts with hospitals and other providers to form a network and creates financial incentives for members to use network providers. The incentives can include lower deductibles, lower copayment, and coinsurance. The advantage to the PPO is that network providers negotiate lower reimbursement rates in exchange for higher anticipated volume. Another type of managed care plan, the health maintenance organization (HMO), is more restrictive. Members are required to use in-network providers and must be authorized by their primary care physician to see a specialist. HMO plans usually have lower out-of-pocket payments than PPO plans. Point-of-service (POS) plans are hybrids of PPO and HMO plans in which enrollees can choose to pay extra at the point of a particular service to see a non-network provider. Some employers also offer a high-deductible health plan with savings option (HDHP/SO). The annual deductible of a typical HDHP plan can be $2000 or higher for single coverage. Health reimbursement arrangements and health savings accounts are linked with such plans, allowing employees to save for medical expenses on a tax-free basis. In 2010, 58% of covered employees were enrolled in PPOs, followed by HMOs (19%), HDHP/SOs (13%), and POS plans (8%). Approximately 1% were covered by conventional indemnity plans.4
Employers and employees both contribute to the cost of employment-based health insurance. Covered employees on average shouldered 19% of the total premium for single coverage and 30% for family coverage in 2009%,4 approximately $75 monthly for single coverage and $333 monthly for family coverage. Private and public sector employers often vary as to the relative role of health benefits in the total compensation package. From 2000 to 2009, the share of premiums paid by private sector employers dropped from 74.7% to 69.7%. During the same time period, the share paid by the federal government remained at 72% to 73%, whereas state and local governments’ contributions increased from 79.2% to 83%.3
Not all employers provide health benefits to their employees. Those offering insurance benefits tend to be large firms with well-paid workers.4 Even if employers offer insurance, employees can choose not to participate if the premium share is too high, the value of the benefits too low, or if the employee has higher value options for coverage elsewhere (e.g., through a spouse). Employer-based insurance coverage is clearly tied to employment. In the economic downturn near the end of the first decade of the twenty-first century, millions of workers lost their jobs and their insurance coverage. Nearly three of five adults who lost a job with health benefits in 2010 became uninsured.6 Private business health spending decreased 0.5% in 2009, the first decline since 1987, resulting from a 3.2% decrease in employer-sponsored health insurance coverage.3
Households
The financial burden of health care on households consists of three parts: health insurance premiums, out-of-pocket payments (deductibles, copayments, and coinsurance), payments for services that are not covered by insurance, and the mandatory Medicare payroll tax for employed individuals. Households contributed to 28% of national health spending in 2009, or 6.2% of personal income.3 This average, however, conceals the larger burden on low-income families. In 2010, half of adults from families with incomes less than 100% of the federal poverty level (FPL, $22,050 for a family of four) spent 10% or more of their income on health care.6
Direct household spending on health care can be strongly influenced by economic conditions. The growth rate of out-of-pocket payments dropped from 3.1% in 2008 to 0.4% in 2009 as consumers postponed medical services during the economic recession.3
Governments
Federal and state governments are charged with funding public health-related programs, including Medicare, Medicaid, and the Children’s Health Insurance Program (CHIP).The Centers for Medicare and Medicaid Services (CMS) is the federal agency that administers these three programs (Medicaid and CHIP are administered jointly with the states.) The federal government also subsidizes employment-based health insurance through tax laws that allow recipients of employer-based insurance to receive these benefits tax free. This subsidy is estimated to be $177 billion in the year 2011.7
Medicare is the nation’s largest health insurer. It covers people age 65 or older, those with certain disabilities, and those with end-stage renal disease. The program is organized into four parts. Medicare Part A (Hospital Insurance) pays for inpatient care in hospitals, skilled nursing services, hospice, and home health care. The Part A program is financed primarily through the Federal Insurance Contributions Act tax, which funds Social Security and Medicare. Currently, the Medicare payroll tax is 2.9%, with the worker and the employer each paying 1.45%. Self-employed individuals must pay the entire 2.9% tax.
Medicare Part B (Medical Insurance) covers doctors’ services and tests, outpatient care, some home health services, durable medical equipment, and certain preventive services. Part B is financed through premiums paid by enrollees and contributions from general revenues of the U.S. Treasury. Beneficiary premiums are currently set to cover approximately 25% of the per capita cost of Part B. In 2011, the Part B premium is $96.40 for those enrolled before 2010, $110.50 for those enrolled in 2010, and $115.40 for all others. Individuals with yearly incomes higher than $85,000, or couples with income above $170,000, pay premiums that range from $161.50 to $369.10 per month.8
Medicare Part D (Medicare Prescription Drug Coverage) helps to pay for prescription drugs. People eligible for Medicare participate on a voluntary basis and pay a monthly premium. All prescription drug plans are administered by Medicare-approved private insurance companies. The premium, cost sharing, and drugs covered vary from plan to plan. As of January 2008, more than 25 million Medicare beneficiaries (57%) were enrolled in Part D plans.9
Medicaid is a joint federal and state program that provides comprehensive medical and long-term care coverage for individuals with limited income and resources and for those with major disabilities. Although the federal government provides broad guidelines, states have a wide degree of flexibility to design the eligibility criteria and benefit package. For example, California’s Medicaid program (Medi-Cal) covered 29% of its total population in 2007, while the Medicaid program in Nevada covered 10% of its population in the same year.10 Income limits for program eligibility for single adults varied from 17% of the FPL in Arkansas to 215% of the FPL in Minnesota.11 In general, eligibility rules for children are more generous than for adults in all states. Medicaid plays a key role in ensuring access to care for the low-income population.
CHIP represents another joint effort on the part of federal and state governments. This program provides free or low-cost health insurance coverage to children up to 19 years old in families with incomes exceeding eligibility limits for Medicaid who cannot afford private health insurance. Uninsured children in families with incomes up to $44,100 a year (200% of the FPL for a family of four) are eligible for the CHIP in many states. The program generally covers doctor visits, hospitalizations, prescription drugs, and vision and dental care. Pregnant women and other adults may also be covered by the program. Similar to Medicaid, CHIP is administered by each state under broad federal requirements; therefore eligibility, benefits, premiums, and cost sharing are different from state to state. For the federal fiscal year 2010, a total of 7.7 million children were enrolled in CHIP at some point during the year.12
Health care spending by governments amounted to 44% of national health expenditures in 2009, with the federal government accounting for approximately 27% and state and local governments accounting for 16%.3 Government health care spending is projected to account for more than half of total health care spending by 2012.13
The U.S. health care system is the most expensive one in the world. National health spending was $2.5 trillion in total, or $8086 per capita in 2009.14 The ratio of health spending to the gross domestic product (GDP) reached 17.6%.14 Health care spending in the United States is significantly higher than in other industrialized countries. For example, France, Switzerland, and Germany devoted 11.2%, 10.7%, and 10.5%, respectively, of their GDP to health care in 2008.15 The United States spent more than twice as much as relatively rich European countries on health care per capita. Adjusted for purchasing power parity, France spent $3696 per capita on health care in 2008, Germany spent $3737 per capita, and the United Kingdom spent $3129 per capita.15 National health care expenditures are projected to grow at an average annual rate of 6.1% (1.7 percentage points faster than GDP), climbing to $4.5 trillion, or 19.3% of GDP by 2019.13
The uninsured population
The United States is one of three countries in the Organization for Economic Co-operation and Development (OECD) that do not offer health coverage to all of its citizens (Mexico and Turkey are the other two.) Although the elaborate patchwork of public and private coverage options works well for many of those who have employer-sponsored health benefits or who are eligible for public programs, it has many holes. In 2009, for example, 676,000 elderly people did not qualify for Medicare.16 Two of every 10 individuals younger than 65 years are not covered by employment-based health insurance, are not eligible for Medicaid or other public programs, and are left uninsured.16 The resulting uninsured population was 50 million in 2009.16
Adults with low and moderate incomes, young adults, and racial or ethnic minority groups, such as Hispanics and blacks, are more likely to be uninsured.6 Those between 19 and 29 years of age have the highest uninsured rate (28%) of any age group (Fig. 6-1). Noncitizens (legal and undocumented) are approximately threefold more likely to be uninsured than citizens.16 Insurance rates vary across states because of differences in average income, employment opportunity, and Medicaid policy at the state level (Fig. 6-2). Massachusetts has an uninsured rate of less than 5%, whereas the rate exceeds 25% in New Mexico, Florida, and Texas.16
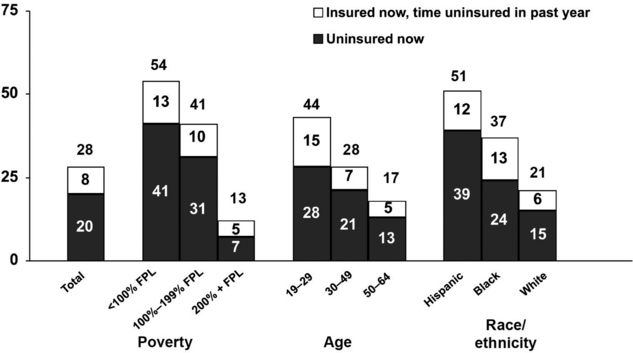
(From Collins SR, et al: Help on the horizon: how the recession has left millions of workers without health insurance, and how health reform will bring relief, The Commonwealth Fund Biennial Health Insurance Survey, New York, 2011, The Commonwealth Fund.)
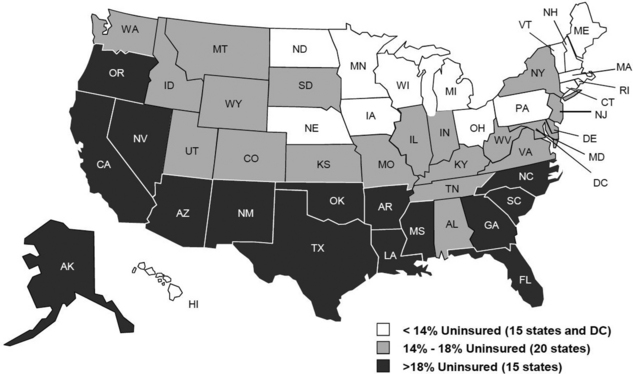
FIG. 6-2 Uninsured rates among nonelderly by state, 2009 to 2010.
(From Kaiser Family Foundation: Kaiser Commission on Medicaid and the Uninsured/Urban Institute analysis of 2010 and 2011 ASEC Supplement to the CPS, two-year pooled data, available at http://facts.kff.org/chart.aspx?ch=2345. Accessed September 20, 2011.)
Having no health insurance negatively affects the financial condition, health-seeking behavior, and health outcomes of the uninsured. Three of five uninsured adults reported having problems paying medical bills or having accrued medical debt, nearly twice the rate of the insured population.6 Because they have to pay for medical bills out of pocket, the uninsured are inclined to delay or forego needed health care. Two thirds of the adults who were uninsured in 2010 reported experiencing one or more of the following: failing to fill a prescription; skipping a medical test, treatment, or follow-up visit; choosing not to see a doctor when sick; or not seeing a specialist because of cost.6 Emergency department services are often the only option for the uninsured when medical care is unavoidable. The uninsured are more likely to be in poor health than the insured. Uninsured adults were more than twice as likely to report being in fair or poor health as those with private insurance.16
Health care workforce
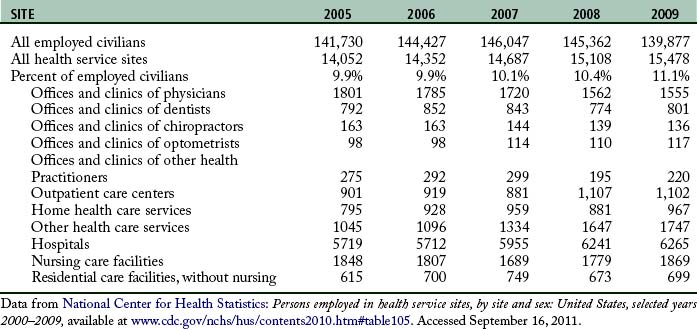
A capable and motivated health care workforce is essential to achieve national health goals. The health care industry is the largest employer in the nation. More than 15 million people worked in this enterprise in 2009 (Table 6-1). Major categories of health care professionals include physicians, dentists, registered nurses, licensed practical nurses (LPNs), pharmacists, health services administrators, and allied health professionals. In addition, millions more work in health-related industries to produce supplies, capital goods, and services for people providing direct patient care.
Physicians are central to the delivery of health care services. They are responsible for the evaluation, diagnosis, and treatment of patients. Even as insurance companies and health care organizations create incentives to influence the preferences of patients and the practice pattern of physicians, physicians still exert enormous power in controlling and directing the use of medical inputs in the production of health care services. Those wishing to practice allopathic medicine must get a four year undergraduate degree and a doctor of medicine (MD) degree from an accredited medical school, pass a series of the United States Medical Licensing Examination tests offered by the National Board of Medical Examiners, and complete a supervised residency program. Physicians must be licensed by every state in which they practice. Those who wish to further specialize in areas such as cardiology or pediatric surgery must complete a fellowship beyond the residency and typically sit for specialty board examinations to achieve voluntary board certification. Similar requirements exist for practitioners of osteopathic medicine (i.e., doctor of osteopathic medicine).
Major medical services
There are three major types of medical services: outpatient services, inpatient services, and long-term care (LTC). Outpatient medical services consist of diagnostic and therapeutic services that do not require an overnight stay in a health care facility. In 2008, there were 956 million visits to physician offices, 110 million visits to hospital outpatient departments, and 124 million visits to hospital emergency departments.17
Advances in medical and surgical technology enable increasingly more inpatient services such as surgical procedures, rehabilitative therapies, renal dialysis, and chemotherapy to be performed in outpatient settings. Pressure from payers to reduce medical expenses also promotes the use of ambulatory care settings as alternatives to expensive inpatient care. Currently, as many as 70% of all surgeries are performed in ambulatory settings.18 Outpatient services can be rendered in physicians’ offices, hospital outpatient departments, hospital emergency departments, freestanding ambulatory surgery centers (ASCs), medical laboratories, and hospice facilities and through home health agencies in the patient’s home.
Inpatient services refer to medical services received during one or more overnight stays in a health care facility. These services include room and board, physician services, inpatient pharmacy, skilled nursing care, rehabilitation services, and ancillary services. The use of inpatient services per capita has declined over the past 30 years. In 2007, there were 112.4 hospital stays and 540.4 days of inpatient care per 1000 population. In 1980, there were 174.5 stays and 1302.7 days of care per 1000 population.17 The length of a hospital stay declined sharply after CMS adopted a prospective payment system for reimbursing hospital care in 1983. This system pays a fixed amount for each case in the same diagnosis-related group regardless of the actual days spent in the hospital or services used. The average length of stay in nonfederal short-term hospitals was 4.8 days in 2007 compared with 7.5 days in 1980.17
Hospitals are the major source of inpatient services. There were 5815 hospitals in the United States in 2008 (Fig. 6-3). Among them, 5010 were nonfederal, community, short-term hospitals with an average patient stay of less than 30 days.19 Other types of hospitals serve special population subgroups, including federal hospitals, long-term hospitals, psychiatric hospitals, and hospital units of institutions (e.g., prison hospitals, college infirmaries).
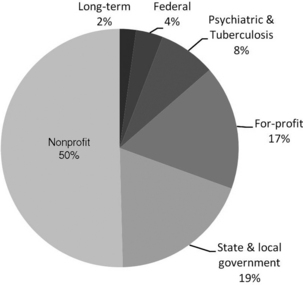
FIG. 6-3 Proportion of hospitals by type of hospital, 2008.
(Data from U.S. Census Bureau: Statistical abstract of the United States: 2011, available at http://www.census.gov/compendia/statab/cats/health_nutrition/health_care_utilization.html. Accessed July 25, 2011.)
An increasing number of hospitals are operated as for-profit organizations. These hospitals are typically owned by national or regional health systems; fewer are freestanding facilities. For-profit hospitals operate at a relatively smaller scale. The average number of beds among for-profit hospitals was 121 in 2008 compared with 557 beds for nonprofit hospitals and 131 beds for state and local government hospitals.19
In 2009, there were 15,700 nursing homes providing LTC to 1.4 million residents.17 Nursing homes are the most common providers of LTC. LTC can also be provided by assisted living facilities, home health agencies, or family members and other informal caregivers in various noninstitutional settings. A study by the U.S. Department of Health and Human Services estimated that people who reach age 65 have a 40% chance of entering a nursing home. Among those entering a nursing home, approximately 10% will stay there 5 years or more.20 Most of the nursing homes are for-profit entities owned by multi-facility chains.
Government’s role in health care
The government is deeply involved in every aspect of the health care system. Government intervention mainly takes four forms21: (1) commodity taxes and subsides (e.g., government at several levels imposes taxes on tobacco to discourage smoking, and the federal government offers tax credits to employers who provide health benefits to their employees); (2) direct provision (the federal government provides medical care to American Indians, veterans, and military personnel and their dependents); (3) transfer programs, such as Medicaid as discussed in the previous section; and (4) regulation (e.g., state licensure of health care professionals.) This section discusses the responsibilities of the federal, state, and local governments with an emphasis on their role as regulators.
Role of the federal government
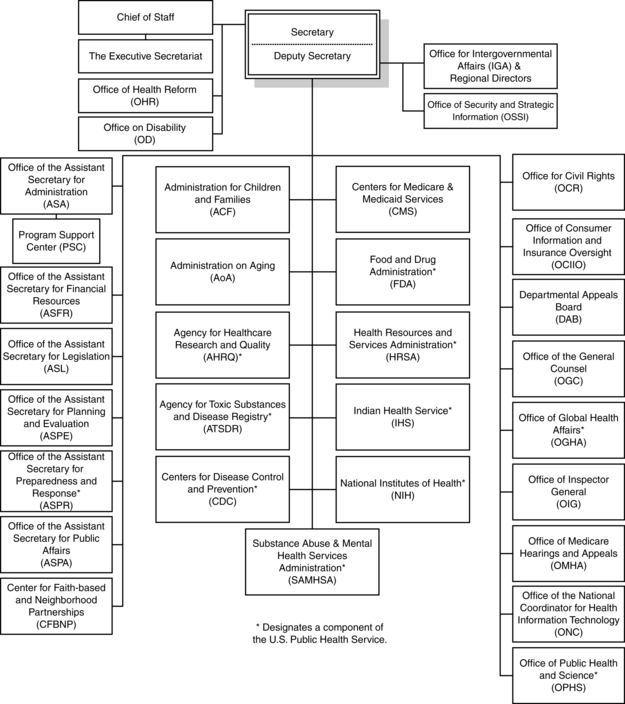
The federal government’s duty to protect the health of all Americans and to provide essential human services is executed by the U.S. Department of Health and Human Services. Departmental leadership is provided by the Office of the Secretary, which is directly supported by the Deputy Secretary, Chief of Staff, a number of assistant secretaries, staff offices, and operating divisions (Fig. 6-4). The 11 operating divisions include eight agencies within the U.S. Public Health Service and three human services agencies. In the Public Health Service Division, the National Institutes of Health, the Food and Drug Administration, and the Centers for Disease Control and Prevention are the primary federal agencies that conduct research and establish regulations aimed protecting the health and safety of the U.S. population. CMS is the federal agency that administers Medicare, Medicaid, and CHIP (the last two are administered jointly with states). To achieve better efficiency and improve the overall quality of care, CMS has taken significant steps toward a strategy that links payment to health care providers’ performance. For example, after October 1, 2008, CMS ceased to pay for a series of hospital-acquired conditions (“never events”) that are deemed as avoidable in most cases through the application of evidence-based guidelines.22 One of the “never events” is surgical site infection following certain surgical procedures. The CMS payment policy, which is usually adopted by private payers and state governments, imposes financial pressure on health care organizations to redesign the process of care and also requires every health worker to change clinical practices and follow recommended quality guidelines more closely.
2010 health care reform
The pressure for health care reform in recent years arose from the severe challenges faced by the health care system. Health spending was consuming a substantial and ever larger share of government, business, and family expenditures. Efforts to control rising costs were largely failing, and the number of uninsured had risen to an unprecedented level. With these facts as backdrop and amid much political wrangling, the Patient Protection and Affordable Care Act (PPACA) and the Health Care and Education Reconciliation Act of 2010, were approved by the U.S. Congress and signed by President Barack Obama in March 2010. These two pieces of legislation aim to overhaul the health care system through expansions of coverage, reform of health insurance market, and delivery system reorganization.23
Health insurance market reforms
The legislation creates state-based health insurance exchanges where individuals and small businesses can purchase qualified health insurance products offered by private insurance companies. All plans offered in the exchanges must set premiums based only on age, benefit package, family structure, geographic area, and tobacco use. Before the operation of such exchanges in 2014, a temporary national high-risk pool will be created to provide health coverage to individuals with preexisting conditions. The law requires that group health insurance plans must use no less than 85% (individual and small business insurance no less than 80%) of premium dollars on clinical services, quality, and other nonadministrative costs. The law also extends dependent coverage for children to age 26 and prohibits insurance companies from imposing lifetime maximums on coverage or rescinding coverage after a policy has been written.
Implications for the PACU
Working within A changing health care system
Although the managed care movement of the 1990s was dismantled in large part by the providers and consumer backlash it generated, successful health care organizations of the twenty-first century will operate under many of the principles of managed care. Managed care represented efforts made by market forces to finance and deliver health care in a way that both reduced costs and maintained the quality of care. The concept of managed care originated with prepaid group plans in the post–World War II period. Managed care began to gain momentum during 1970s, when the purchasers of health care (i.e., government and employers) were increasingly frustrated by escalating health care costs. Managed care emerged as a cost-saving alternative to the traditional fee-for-service system. The most important feature of managed care involves closing, in one way or another, the open-ended promises of traditional insurance policies of unlimited volume-based payment for providers and unlimited choice for consumers. Although the rapid growth of managed care in the 1990s encountered a backlash from consumers and providers, the cost control methods in managed care have been widely adopted because the imperative of expenditure control without sacrificing quality did not disappear with the unpopular nomenclature. Approximately 70% of Medicaid recipients and 25% of Medicare beneficiaries receive their benefits through managed care organizations.24,25 Most of the plans offered by employers are also some form of managed care plan.
Financial management in the PACU
The total cost of care reflects the monetary value of all the resources used to deliver the surgical or medical services. Costs can be broken into two main categories: fixed costs and variable costs.
Fixed costs
Fixed costs are independent of output. They are considered to be constant in the short-term. Examples of fixed costs in the PACU include monitors, stretchers, intravenous pumps, and the physical plant of the facility itself.26.
Variable costs
From the perspective of a health care organization, labor costs comprise two parts: direct and indirect labor costs. Direct labor costs represent the amount paid to employees who are directly involved in the production of patient services. Direct labor costs for a PACU are calculated by multiplying the average hourly wage rate of each job class by the number of hours provided in each class and adding the results together.27 Indirect labor costs are composed of the salaries of those not directly involved in the provision of patient care. Salaries of the nurse manager, unit secretaries, and any other staff who do not provide direct patient care are in this category. This category also contains any portion of staff salaries that are derived from attendance at meetings, in-service education, or other ancillary or support services.
Charges do not accurately reflect the true costs of providing services to a patient. Authors of one study reported that the cost-to-charge ratio for the PACU is 0.54.26 In other words, the fees charged to patients can be twofold the actual costs. Charges often reflect the market forces of supply and demand and do not necessarily maintain a constant relationship with costs.26 Charges may also be deliberately set higher to cover costs for other departments that receive no reimbursement, such as medical records and risk management. The actual cost of providing services can be assessed using the microcosting method, in which each input consumed is identified, measured, and valued.28
There are many ways that nurses can contribute to the efficiency of patient care. For example, evidence suggests that preexisting pain, anxiety, age, and type of surgery are the four most significant predictive factors for the intensity of postoperative pain.29 Perianesthesia nurses can identify patients prone to postoperative pain and take proactive actions. As a result, the need for pain medication can be reduced and the costs of the PACU can be lowered. Perianesthesia nurses can also achieve cost savings by ensuring the smooth transition of patients to the community or other care settings. Preprinted instructions are a necessity in patient discharge education. Evidence indicates that patients who receive both verbal and written instructions are more likely to fully understand the care instructions.30 Perianesthesia nurses must be involved in the creation of these materials and should serve on the patient education committee in their facilities.
Nursing quality improvement in the PACU
Quality of care has been a focus for the health care delivery system, especially after the publication of the Institute of Medicine’s Cross the Quality Chasm report in 2001.2 In recent years, efforts to control health costs and improve access to care have caused widespread concerns that the quality of care may be compromised.
Perianesthesia nurses can begin to set the tone of the patient experience during preoperative teaching. This exchange provides the opportunity for the nurse to explain the postoperative course of care and for the patient to share expectations and concerns. A discussion of what the patient anticipates can help to guide care in the PACU. This type of exchange and follow-through in care costs little and can provide the patient and family with a better PACU experience.
Perianesthesia nurses need to adopt evidence-based practice (EBP) in order to substantially improve the quality of care while at the same time reducing unnecessary services and costs. One commonly used definition of EBP is “the conscientious, explicit, and judicious use of the current best evidence in making decisions about the care of individual patients.”31 An example of EBP is fast-tracking, a process in which patients are moved rapidly through the phases of recovery from anesthesia and are discharged home sooner. A review of published studies concluded that implementation of fast-track recovery pathways in pancreatic surgery is feasible and can achieve shorter hospital stay and reduced costs, with no increase in readmission or perioperative mortality rates.32 Perianesthesia nurses should pay close attention to quality-related research and update their knowledge frequently to optimize their practice.
To standardize the process of care, various national professional groups, managed care organizations, and government agencies have embarked on the development of clinical practice guidelines. The American Society of PeriAnesthesia Nurses (ASPAN) is responsible for advancing the unique specialty of perianesthesia nursing. Clinical guidelines on normothermia, pain and comfort, postoperative nausea and vomiting, and postoperative discharge nausea and vomiting can be found on the ASPAN web site33 and should be incorporated into daily practices by PACU nurses.
Cultural competency in the PACU
The health care system is facing an ever more diverse patient population. In the last three decades, the proportion of the population speaking a language other than English at home has increased as racial and ethnic diversity in the United States have increased.34 It is estimated that 55 million people spoke a language other than English at home in 2007. Among those for whom English was not the first language, 24.4% spoke English “not well” or “not at all.”34 Communication between patients with limited English proficiency and their providers can be impaired by language barriers, which may lower both patient and provider satisfaction, compromise patient safety, and potentially lead to suboptimal quality of care and health disparities for this population.35–39 The challenges related to language and culture barriers may be even more prominent in the post–health care reform era because the new legislation will bring in large numbers of previously uninsured people and who are more likely to be from racial or ethnic minority populations.
In this environment, PACUs need to be transformed into culturally competent delivery systems that “acknowledge and incorporate at all levels the importance of culture, assessment of cross-cultural relations, vigilance toward the dynamics that result from cultural differences, expansion of cultural knowledge, and adaptation of services to meet culturally unique needs.”40 Many efforts can be made to improve the ability of postanesthesia nurses to deliver effective and respectful care to patients with cultural or linguistic barriers. These patients should be identified quickly so that care givers can pay special attention to the possible sources of misunderstanding. Special programs, such as translation services, should be made available. Currently, the District of Columbia and 13 states provide Medicaid and CHIP reimbursement for interpreter services.41 Health care staff members, especially nurses, should be trained to interact effectively with patients from other cultures and languages. PACUs located in communities with large percentages of minorities should employ staff from those populations. Cultural competence strategies should be included in health care facility accreditation and licensure processes.
Summary
The U.S. health care system continues to evolve at a rapid pace. This requires health care organizations and health professionals to constantly make adjustments to the demands of the health care environment. Nurses are perfectly situated to assist with strategies that cut costs while simultaneously improving quality of care. Acquiring the knowledge and skills to deliver health care to an increasingly diverse population is the challenge faced by each perianesthesia nurse. Perianesthesia nursing can make significant contributions to the surgical experience of the patients.
1. World Health Organization: The world health report 2000—health systems improving performance. Geneva: World Health Organization; 2000.
2. Institute of Medicine: Crossing the quality chasm A New Health System for the Twenty-first Century. Washington DC: National Academy Press; 2001.
3. Centers for Medicare and Medicaid Services: Health expenditures by sponsors business, household and government. available at: https://www.cms.gov/nationalhealthexpenddata/06_nationalhealthaccountsbusinesshouseholdgovernment.asp, February 25, 2011. Accessed
4. Kaiser family foundation and health research & educational trust: 2010 Kaiser/HRET employer health benefits survey. available at: http://ehbs.kff.org/pdf/2010/8085.pdf, May 18, 2011. Accessed
5. . U.S. Office of Personnel Management: Federal Employees Health Benefits Program Handbook. available at http://www.opm.gov/insure/health/reference/handbook/fehb03.asp#govshare Accessed May 1, 2011
6. Collins SR, et al. Help on the horizon—findings from the commonwealth fund biennial health insurance survey of 2010. available at http://www.commonwealthfund.org/%/media/Files/Publications/Fund%20Report/2011/Mar/1486_Collins_help_on_the_horizon_2010_biennial_survey_report_FINAL_v2.pdf, May 18, 2011. Accessed
7. Employee Benefit Research Institute: Tax Expenditures and Employee Benefits Estimates from the FY 2011 Budget. available at: http://www.ebri.org/pdf/publications/facts/FS-209_Mar10_Bens-Rev-Loss.pdf, 2011. Accessed May 18
8. Centers for Medicare & Medicaid Services: 2011 Part B Premium Amounts for Persons with Higher Income Levels. available at: http://questions.medicare.gov/app/answers/detail/a_id/2306/session/L2F2LzEvc2lkL0VRa3J6NnBr, 2011. Accessed March 6
9. Kaiser Family Foundation: Prescription drug benefit under Medicare 2008. available at: http://www.kaiseredu.org/Issue-Modules/Prescription-Drug-Benefit-Under-Medicare/Background-Brief.aspx, March 6, 2011. Accessed
10. Kaiser Family Foundation: Medicaid Enrollment as a Percent of Total Population, 2008. available at: http://statehealthfacts.org/comparereport.jsp?rep=54&cat=4&sortc=1&o=a, May 4, 2011. Accessed
11. Kaiser Family Foundation: Income Eligibility Limits for Working Adults at Application as a Percent of the Federal Poverty Level (FPL) by Scope of Benefit Package. available at: http://statehealthfacts.org/comparereport.jsp?rep=54&cat=4&sortc=1&o=a, May 12, 2011. Accessed
12. Centers for Medicare & Medicaid Services: FY 2010 Number of Children Ever Enrolled Year—CHIP by Program Type. available at: http://www.cms.gov/NationalCHIPPolicy/downloads/FY2010StateCHIP TotalTable_020111_FINAL.pdf, 2011. Accessed March 10, 2011
13. Truffer CJ, et al. Health spending projections through 2019: the recession’s impact continues. Health Affairs. 2010;29(3):522–529. 10.1377/hlthaff.2009.1074.
14. Centers for Medicare & Medicaid Services: National health expenditures 2009 highlights. available at: http://www.cms.gov/NationalHealthExpendData/downloads/highlights.pdf, January 28, 2011. Accessed
15. Organisation for Economic Co-operation and Development: Briefing note for OECD Health Data 2010 How Does the United States Compare. available at: http://www.oecd.org/dataoecd/46/2/38980580.pdf, January 25, 2011. Accessed
16. Kaiser Family Foundation Kaiser Commission on Medicaid and the Uninsured: The uninsured a primer, December 2010. available at: http://www.kff.org/uninsured/upload/7451-06.pdf, May 18, 2011. Accessed
17. National Center for Health Statistics: Health, United States, 2010 With Special Feature on Death and Dying,Hyattsville, MD. available at: http://www.cdc.gov/nchs/data/hus/hus10.pdf, 2011. Accessed May 18, 2011
18. Medicare Payment Advisory Commission (MedPAC): Report to the congress Medicare payment policy. (March 2004),Washington, DC. available at: http://www.medpac.gov/documents/Mar04_Entire_reportv3.pdf, 2004. Accessed April 5, 2011
19. . U.S. Census Bureau: Statistical Abstract of the United States:2011. available at: http://www.census.gov/compendia/statab/2011edition.html, May 18, 2011. Accessed
20. Centers for Medicare & Medicaid Services: Long-Term Care. available at: http://www.medicare.gov/longtermcare/static/home.asp, 2009. Accessed March 10, 2011
21. Folland S, et al. The Economics of Health and Health Care, ed 6. Upper Saddle River, New Jersey: Prentice Hall; 2010.
22. Centers for Medicare & Medicaid Services: Hospital-acquired conditions (present on admission indicator). available at: http://www.cms.gov/HospitalAcqCond/, July 26, 2011. Accessed
23. Kaiser Family Foundation: Focus on Health Reform—Summary of New Health Reform Law. available at: http://www.kff.org/healthreform/upload/8061.pdf, March 10, 2011. Accessed
24. Centers for Medicare & Medicaid Services: Medicaid Managed Care Enrollment Report, Summary Statistics as of June 30, 2008. available at: https://www.cms.gov/MedicaidDataSourcesGenInfo/04_MdManCrEnrllRep.asp, February 14, 2012. Accessed
25. Kaiser Family Foundation: Medicare Advantage 2010. Data Spotlight Plan Enrollment Patterns and Trends 2010. available at: http://www.kff.org/medicare/8080.cfm, May 18, 2011. Accessed
26. Macario A, et al. What can the postanesthesiacare unit manager do to decrease costs in the postanesthesia care unit. J Perianesth Nurs. 1999;14:284–293.
27. Kahl K, Preston B. Identifying the cost of patient care in the postanesthesia care setting. J Post Anesth Nurs. 1988;3:198–202.
28. Gold MR, et al. Cost-Effectiveness in Health and Medicine. New York: Oxford University Press; 1996.
29. Ip HYV, et al. Predictors of postoperative pain and analgesic consumption: a qualitative systematic review. Anesthesiology.2009;111:657–677.
30. Flacker J, et al. Hospital discharge information and older patients: do they get what they need. Journal of Hospital Medicine.2007;2:291–296.
31. Sackett DL, et al. Evidence based medicine: what it is and what it isn’t. BMJ.1996;312:71–72.
32. Ypsilantis E, Praseedom RK. Current status of fast-track recovery pathways in pancreatic surgery. JOP. 2009;10:646–650.
33. American Society of PeriAnesthesia Nurses: Clinical practice guidelines. available at: http://www.aspan.org/ClinicalPractice/ClinicalGuidelines/tabid/3254/Default.aspx, May 1, 2011. Accessed
34. Shin HB, Kominski RA. Language Use in the united states: 2007, American Community Survey Reports, ACS-12. Washington, DC: U.S. Census Bureau; 2010.
35. Carrasquillo O, et al. Impact of language barriers on patient satisfaction in an emergency department. J Gen Intern Med. 1999;14:82–87.
36. Morales LS, et al. Are Latinos less satisfied with communication by health care providers. J Gen Intern Med. 1999;14:409–417.
37. Atchison KA, et al. A qualitative report of patient problems and postoperative instructions. J Oral Maxillofac Surg. 2005;63:449–456.
38. John-Baptiste A, et al. The effect of English language proficiency on length of stay and in-hospital mortality. J Gen Intern Med. 2004;19:221–228.
39. Bard MR, et al. Language barrier leads to the unnecessary intubation of trauma patients. Am Surg. 2004;70:783–786.
40. Betancourt JR, et al. Defining cultural competence: a practical framework for addressing racial/ethnic disparities in health and health care. Public Health Rep.2003;118:293–330.
41. National Health Law Program and The Access Project: Language Services Action Kit interpreter services in health care settings for people with limited English proficiency. Washington, DC: National Health Law Program and The Access Project; 2004.
[/level-membership-for-critical-care-medicine-category][not-level-membership-for-critical-care-medicine-category]
6 The changing health care system and its implications for the PACU
The health care system in the United States is one of the nation’s largest and most important economic sectors. It consists of all the resources and activities whose primary purpose is to promote, restore, or maintain the health of the American people.1 Continuous efforts have been made to improve the health care system’s ability to produce care that is safe, effective, patient-centered, timely, efficient, and equitable.2 An emphasis on safety implies that medical care should bring minimal harm to patients. Effectiveness highlights the importance of providing evidence-based services only to those who could benefit. Patient-centeredness emphasizes individualized care and the patients’ pivotal role in all clinical decisions. Timeliness underscores the significance of “reducing waits and sometimes harmful delays for both those who receive and those who give care.”2 Efficiency focuses on eliminating waste in the production of medical care, including overuse of medical resources and undue administrative costs. Finally, equity stresses the need for “providing care that does not vary in quality because of personal characteristics such as gender, ethnicity, geographic location, and socioeconomic status.”2 As health technology and the role of government in financing care have increased in the past 10 years, the health care system has played an increasingly important role in people’s lives. The rapid development of medical science and technology, changing economic and political environment, and soaring consumer expectations have profoundly changed what health care is and how it can be delivered. It is critical for postanesthesia nurses to understand the nation’s health care system.
A health care system is shaped by four functional components: financing, workforce development, service delivery, and regulation.1 This chapter provides a broad overview of these components, including how the health care system is financed, who provides health care services, what medical services are produced, and role of the government in the health care system. There is also a discussion of the issue of the uninsured population, a summary of the recent health care reform legislation, and an explanation of the implications for the post anesthesia care unit (PACU) and perianesthesia nurses.
Health care financing
In the United States, the private sector has a larger role in paying for health care costs than in most developed countries. Public programs are focused on health care for special population subgroups, such as senior citizens, low-income populations, veterans, and active duty and retired military personnel and their dependents. The financial burden of health care is shouldered by three major sponsors in the United States: businesses, households, and governments.3 Health care costs are billed through private insurance plans, out-of-pocket payments, philanthropic funds, and public programs.
Private business
Private businesses contribute to approximately one fifth of health care spending, in the form of employer-sponsored health insurance, contribution to Medicare, workers compensation, disability insurance, and worksite health care.3 Employers are the leading source of health coverage. The majority of employers (69% in 2010) offer health insurance as a fringe benefit to cover their employees as well as their employees’ dependents.4 Federal, state, and local governments, as employers, also make contributions to private health insurance programs to insure public employees. For example, in 2009, the federal government contributed $26.8 billion to the Federal Employees Health Benefits Program to cover more than 8 million federal employees, retirees, and their dependents, including members of the U.S. Congress.5
Employer-sponsored health insurance has been designed predominantly through managed care plans of various kinds in recent decades. Managed care plans are lower cost alternatives to conventional indemnity insurance by incorporating a wide range of organizational and financial arrangements to organize, reimburse, and monitor services. The most common type of managed care plans is the preferred provider organization (PPO). A PPO selectively contracts with hospitals and other providers to form a network and creates financial incentives for members to use network providers. The incentives can include lower deductibles, lower copayment, and coinsurance. The advantage to the PPO is that network providers negotiate lower reimbursement rates in exchange for higher anticipated volume. Another type of managed care plan, the health maintenance organization (HMO), is more restrictive. Members are required to use in-network providers and must be authorized by their primary care physician to see a specialist. HMO plans usually have lower out-of-pocket payments than PPO plans. Point-of-service (POS) plans are hybrids of PPO and HMO plans in which enrollees can choose to pay extra at the point of a particular service to see a non-network provider. Some employers also offer a high-deductible health plan with savings option (HDHP/SO). The annual deductible of a typical HDHP plan can be $2000 or higher for single coverage. Health reimbursement arrangements and health savings accounts are linked with such plans, allowing employees to save for medical expenses on a tax-free basis. In 2010, 58% of covered employees were enrolled in PPOs, followed by HMOs (19%), HDHP/SOs (13%), and POS plans (8%). Approximately 1% were covered by conventional indemnity plans.4
Employers and employees both contribute to the cost of employment-based health insurance. Covered employees on average shouldered 19% of the total premium for single coverage and 30% for family coverage in 2009%,4 approximately $75 monthly for single coverage and $333 monthly for family coverage. Private and public sector employers often vary as to the relative role of health benefits in the total compensation package. From 2000 to 2009, the share of premiums paid by private sector employers dropped from 74.7% to 69.7%. During the same time period, the share paid by the federal government remained at 72% to 73%, whereas state and local governments’ contributions increased from 79.2% to 83%.3
Not all employers provide health benefits to their employees. Those offering insurance benefits tend to be large firms with well-paid workers.4 Even if employers offer insurance, employees can choose not to participate if the premium share is too high, the value of the benefits too low, or if the employee has higher value options for coverage elsewhere (e.g., through a spouse). Employer-based insurance coverage is clearly tied to employment. In the economic downturn near the end of the first decade of the twenty-first century, millions of workers lost their jobs and their insurance coverage. Nearly three of five adults who lost a job with health benefits in 2010 became uninsured.6 Private business health spending decreased 0.5% in 2009, the first decline since 1987, resulting from a 3.2% decrease in employer-sponsored health insurance coverage.3
Households
The financial burden of health care on households consists of three parts: health insurance premiums, out-of-pocket payments (deductibles, copayments, and coinsurance), payments for services that are not covered by insurance, and the mandatory Medicare payroll tax for employed individuals. Households contributed to 28% of national health spending in 2009, or 6.2% of personal income.3 This average, however, conceals the larger burden on low-income families. In 2010, half of adults from families with incomes less than 100% of the federal poverty level (FPL, $22,050 for a family of four) spent 10% or more of their income on health care.6
Direct household spending on health care can be strongly influenced by economic conditions. The growth rate of out-of-pocket payments dropped from 3.1% in 2008 to 0.4% in 2009 as consumers postponed medical services during the economic recession.3
Governments
Federal and state governments are charged with funding public health-related programs, including Medicare, Medicaid, and the Children’s Health Insurance Program (CHIP).The Centers for Medicare and Medicaid Services (CMS) is the federal agency that administers these three programs (Medicaid and CHIP are administered jointly with the states.) The federal government also subsidizes employment-based health insurance through tax laws that allow recipients of employer-based insurance to receive these benefits tax free. This subsidy is estimated to be $177 billion in the year 2011.7
Medicare is the nation’s largest health insurer. It covers people age 65 or older, those with certain disabilities, and those with end-stage renal disease. The program is organized into four parts. Medicare Part A (Hospital Insurance) pays for inpatient care in hospitals, skilled nursing services, hospice, and home health care. The Part A program is financed primarily through the Federal Insurance Contributions Act tax, which funds Social Security and Medicare. Currently, the Medicare payroll tax is 2.9%, with the worker and the employer each paying 1.45%. Self-employed individuals must pay the entire 2.9% tax.
Medicare Part B (Medical Insurance) covers doctors’ services and tests, outpatient care, some home health services, durable medical equipment, and certain preventive services. Part B is financed through premiums paid by enrollees and contributions from general revenues of the U.S. Treasury. Beneficiary premiums are currently set to cover approximately 25% of the per capita cost of Part B. In 2011, the Part B premium is $96.40 for those enrolled before 2010, $110.50 for those enrolled in 2010, and $115.40 for all others. Individuals with yearly incomes higher than $85,000, or couples with income above $170,000, pay premiums that range from $161.50 to $369.10 per month.8
Medicare Part D (Medicare Prescription Drug Coverage) helps to pay for prescription drugs. People eligible for Medicare participate on a voluntary basis and pay a monthly premium. All prescription drug plans are administered by Medicare-approved private insurance companies. The premium, cost sharing, and drugs covered vary from plan to plan. As of January 2008, more than 25 million Medicare beneficiaries (57%) were enrolled in Part D plans.9
Medicaid is a joint federal and state program that provides comprehensive medical and long-term care coverage for individuals with limited income and resources and for those with major disabilities. Although the federal government provides broad guidelines, states have a wide degree of flexibility to design the eligibility criteria and benefit package. For example, California’s Medicaid program (Medi-Cal) covered 29% of its total population in 2007, while the Medicaid program in Nevada covered 10% of its population in the same year.10 Income limits for program eligibility for single adults varied from 17% of the FPL in Arkansas to 215% of the FPL in Minnesota.11 In general, eligibility rules for children are more generous than for adults in all states. Medicaid plays a key role in ensuring access to care for the low-income population.
CHIP represents another joint effort on the part of federal and state governments. This program provides free or low-cost health insurance coverage to children up to 19 years old in families with incomes exceeding eligibility limits for Medicaid who cannot afford private health insurance. Uninsured children in families with incomes up to $44,100 a year (200% of the FPL for a family of four) are eligible for the CHIP in many states. The program generally covers doctor visits, hospitalizations, prescription drugs, and vision and dental care. Pregnant women and other adults may also be covered by the program. Similar to Medicaid, CHIP is administered by each state under broad federal requirements; therefore eligibility, benefits, premiums, and cost sharing are different from state to state. For the federal fiscal year 2010, a total of 7.7 million children were enrolled in CHIP at some point during the year.12
Health care spending by governments amounted to 44% of national health expenditures in 2009, with the federal government accounting for approximately 27% and state and local governments accounting for 16%.3 Government health care spending is projected to account for more than half of total health care spending by 2012.13
The U.S. health care system is the most expensive one in the world. National health spending was $2.5 trillion in total, or $8086 per capita in 2009.14 The ratio of health spending to the gross domestic product (GDP) reached 17.6%.14 Health care spending in the United States is significantly higher than in other industrialized countries. For example, France, Switzerland, and Germany devoted 11.2%, 10.7%, and 10.5%, respectively, of their GDP to health care in 2008.15 The United States spent more than twice as much as relatively rich European countries on health care per capita. Adjusted for purchasing power parity, France spent $3696 per capita on health care in 2008, Germany spent $3737 per capita, and the United Kingdom spent $3129 per capita.15 National health care expenditures are projected to grow at an average annual rate of 6.1% (1.7 percentage points faster than GDP), climbing to $4.5 trillion, or 19.3% of GDP by 2019.13
The uninsured population
The United States is one of three countries in the Organization for Economic Co-operation and Development (OECD) that do not offer health coverage to all of its citizens (Mexico and Turkey are the other two.) Although the elaborate patchwork of public and private coverage options works well for many of those who have employer-sponsored health benefits or who are eligible for public programs, it has many holes. In 2009, for example, 676,000 elderly people did not qualify for Medicare.16 Two of every 10 individuals younger than 65 years are not covered by employment-based health insurance, are not eligible for Medicaid or other public programs, and are left uninsured.16 The resulting uninsured population was 50 million in 2009.16
Adults with low and moderate incomes, young adults, and racial or ethnic minority groups, such as Hispanics and blacks, are more likely to be uninsured.6 Those between 19 and 29 years of age have the highest uninsured rate (28%) of any age group (Fig. 6-1). Noncitizens (legal and undocumented) are approximately threefold more likely to be uninsured than citizens.16 Insurance rates vary across states because of differences in average income, employment opportunity, and Medicaid policy at the state level (Fig. 6-2). Massachusetts has an uninsured rate of less than 5%, whereas the rate exceeds 25% in New Mexico, Florida, and Texas.16
(From Collins SR, et al: Help on the horizon: how the recession has left millions of workers without health insurance, and how health reform will bring relief, The Commonwealth Fund Biennial Health Insurance Survey, New York, 2011, The Commonwealth Fund.)
FIG. 6-2 Uninsured rates among nonelderly by state, 2009 to 2010.
(From Kaiser Family Foundation: Kaiser Commission on Medicaid and the Uninsured/Urban Institute analysis of 2010 and 2011 ASEC Supplement to the CPS, two-year pooled data, available at http://facts.kff.org/chart.aspx?ch=2345. Accessed September 20, 2011.)
Having no health insurance negatively affects the financial condition, health-seeking behavior, and health outcomes of the uninsured. Three of five uninsured adults reported having problems paying medical bills or having accrued medical debt, nearly twice the rate of the insured population.6 Because they have to pay for medical bills out of pocket, the uninsured are inclined to delay or forego needed health care. Two thirds of the adults who were uninsured in 2010 reported experiencing one or more of the following: failing to fill a prescription; skipping a medical test, treatment, or follow-up visit; choosing not to see a doctor when sick; or not seeing a specialist because of cost.6 Emergency department services are often the only option for the uninsured when medical care is unavoidable. The uninsured are more likely to be in poor health than the insured. Uninsured adults were more than twice as likely to report being in fair or poor health as those with private insurance.16
Health care workforce
A capable and motivated health care workforce is essential to achieve national health goals. The health care industry is the largest employer in the nation. More than 15 million people worked in this enterprise in 2009 (Table 6-1). Major categories of health care professionals include physicians, dentists, registered nurses, licensed practical nurses (LPNs), pharmacists, health services administrators, and allied health professionals. In addition, millions more work in health-related industries to produce supplies, capital goods, and services for people providing direct patient care.
[/not-level-membership-for-critical-care-medicine-category]
