[level-membership-for-internal-medicine-category]
Chapter 10 The Cardiovascular Exam
A. Generalities
1 What are the main components of the cardiovascular physical examination?


B. General (Physical) Appearance
2 What aspects of general appearance should be observed in evaluating cardiac patients?
As suggested by Perloff, one should sequentially evaluate the following nine areas:


See Tables 10-1 and 10-2.
Table 10-1 Diagnostic Clues: Body and Facies, Gestures and Gait, Face and Ears
| Body Appearance and Facies |
 The anasarca of congestive heart failure The anasarca of congestive heart failure |
 The struggling, anguished, frightened, orthopneic, and diaphoretic look of pulmonary edema The struggling, anguished, frightened, orthopneic, and diaphoretic look of pulmonary edema |
 The tall stature, long extremities (with arm span exceeding patient’s height), and sparse subcutaneous fat of Marfan’s syndrome (mitral valve prolapse, aortic dilation, and dissection) The tall stature, long extremities (with arm span exceeding patient’s height), and sparse subcutaneous fat of Marfan’s syndrome (mitral valve prolapse, aortic dilation, and dissection) |
 The long extremities, kyphoscoliosis, and pectus carinatum of homocystinuria (arterial thrombosis) The long extremities, kyphoscoliosis, and pectus carinatum of homocystinuria (arterial thrombosis) |
 The tall stature and long extremities of Klinefelter’s syndrome (atrial or ventricular septal defects, patent ductus arteriosus, and even tetralogy of Fallot) The tall stature and long extremities of Klinefelter’s syndrome (atrial or ventricular septal defects, patent ductus arteriosus, and even tetralogy of Fallot) |
 The tall stature and thick extremities of acromegaly (hypertension, cardiomyopathy, and conduction defects) The tall stature and thick extremities of acromegaly (hypertension, cardiomyopathy, and conduction defects) |
 The short stature, webbed neck, low hairline, small chin, wide-set nipples, and sexual infantilism of Turner’s syndrome (coarctation of the aorta and valvular pulmonic stenosis) The short stature, webbed neck, low hairline, small chin, wide-set nipples, and sexual infantilism of Turner’s syndrome (coarctation of the aorta and valvular pulmonic stenosis) |
 The dwarfism and polydactyly of Ellis-van Creveld syndrome (atrial septal defects and common atrium) The dwarfism and polydactyly of Ellis-van Creveld syndrome (atrial septal defects and common atrium) |
 The morbid obesity and somnolence of obstructive sleep apnea (hypoventilation, pulmonary hypertension, and cor pulmonale) The morbid obesity and somnolence of obstructive sleep apnea (hypoventilation, pulmonary hypertension, and cor pulmonale) |
 The truncal obesity, thin extremities, moon face, and buffalo hump of hypertensive patients with Cushing’s syndrome The truncal obesity, thin extremities, moon face, and buffalo hump of hypertensive patients with Cushing’s syndrome |
 The mesomorphic, overweight, balding, hairy, and tense middle-aged patient with coronary artery disease The mesomorphic, overweight, balding, hairy, and tense middle-aged patient with coronary artery disease |
 The hammer toes and pes cavus of Friedreich’s ataxia (hypertrophic cardiomyopathy, angina, and sick sinus syndrome) The hammer toes and pes cavus of Friedreich’s ataxia (hypertrophic cardiomyopathy, angina, and sick sinus syndrome) |
 The straight lower back of ankylosing spondylitis (aortic regurgitation and complete heart block) The straight lower back of ankylosing spondylitis (aortic regurgitation and complete heart block) |
| Gestures, Gait, and Stance |
 The Levine’s sign (clenched fist over the chest of patients with an acute myocardial infarction) The Levine’s sign (clenched fist over the chest of patients with an acute myocardial infarction) |
 The preferential squatting of tetralogy of Fallot The preferential squatting of tetralogy of Fallot |
 The ataxic gait of tertiary syphilis (associated with aortic aneurysm and regurgitation) The ataxic gait of tertiary syphilis (associated with aortic aneurysm and regurgitation) |
 The waddling gait, lumbar lordosis, and calves pseudohypertrophy of Duchenne’s muscular dystrophy (associated with hypertrophic cardiomyopathy and a pseudo infarction pattern on ECG) The waddling gait, lumbar lordosis, and calves pseudohypertrophy of Duchenne’s muscular dystrophy (associated with hypertrophic cardiomyopathy and a pseudo infarction pattern on ECG) |
| Face and Ears |
 Pulsatility of the earlobes (tricuspid regurgitation) Pulsatility of the earlobes (tricuspid regurgitation) |
 Head bobbing (De Musset’s and Lincoln’s signs) Head bobbing (De Musset’s and Lincoln’s signs) |
 The round and chubby face of congenital pulmonary stenosis The round and chubby face of congenital pulmonary stenosis |
 The hypertelorism, pigmented moles, webbed neck, and low-set ears of Turner’s syndrome The hypertelorism, pigmented moles, webbed neck, and low-set ears of Turner’s syndrome |
 The round and chubby face of congenital valvular pulmonic stenosis The round and chubby face of congenital valvular pulmonic stenosis |
 The elfin face (small chin, malformed teeth, wide-set eyes, patulous lips, baggy cheeks, blunt and upturned nose) of congenital stenosis of the pulmonary arteries and supravalvular aortic stenosis—often associated with hypercalcemia and mental retardation. The elfin face (small chin, malformed teeth, wide-set eyes, patulous lips, baggy cheeks, blunt and upturned nose) of congenital stenosis of the pulmonary arteries and supravalvular aortic stenosis—often associated with hypercalcemia and mental retardation. |
 The unilateral lower facial weakness of infants with cardiofacial syndrome—this can be encountered in 5–10% of infants with congenital heart disease (usually ventricular septal defect); often noticeable only during crying. The unilateral lower facial weakness of infants with cardiofacial syndrome—this can be encountered in 5–10% of infants with congenital heart disease (usually ventricular septal defect); often noticeable only during crying. |
 The premature aging of Werner’s syndrome and progeria (associated with premature coronary artery and systemic atherosclerotic disease) The premature aging of Werner’s syndrome and progeria (associated with premature coronary artery and systemic atherosclerotic disease) |
 The drooping eyelids, expressionless face, receding hairline, and bilateral cataracts of Steinert’s disease (myotonic dystrophy, associated with conduction disorders, mitral valve prolapse) The drooping eyelids, expressionless face, receding hairline, and bilateral cataracts of Steinert’s disease (myotonic dystrophy, associated with conduction disorders, mitral valve prolapse) |
 The epicanthic fold, protruding tongue, small ears, short nose, and flat bridge of Down syndrome (endocardial cushion defects) The epicanthic fold, protruding tongue, small ears, short nose, and flat bridge of Down syndrome (endocardial cushion defects) |
 The dry and brittle hair, loss of lateral eyebrows, puffy eyelids, apathetic face, protruding tongue, thick and sallow skin of myxedema (associated with pericardial and coronary artery disease) The dry and brittle hair, loss of lateral eyebrows, puffy eyelids, apathetic face, protruding tongue, thick and sallow skin of myxedema (associated with pericardial and coronary artery disease) |
 The macroglossia not only of Down syndrome and myxedema, but also of amyloidosis (linked to restrictive cardiomyopathy, congestive heart failure) The macroglossia not only of Down syndrome and myxedema, but also of amyloidosis (linked to restrictive cardiomyopathy, congestive heart failure) |
 The paroxysmal facial and neck flushing of carcinoid syndrome (with pulmonic stenosis and tricuspid stenosis/regurgitation) The paroxysmal facial and neck flushing of carcinoid syndrome (with pulmonic stenosis and tricuspid stenosis/regurgitation) |
 The saddle-shaped nose of polychondritis (associated with aortic aneurysm) The saddle-shaped nose of polychondritis (associated with aortic aneurysm) |
 The tightening of skin and mouth, scattered telangiectasias, and hyperpigmentation/hypopigmentation of scleroderma (with pulmonary hypertension, pericarditis, and myocarditis) The tightening of skin and mouth, scattered telangiectasias, and hyperpigmentation/hypopigmentation of scleroderma (with pulmonary hypertension, pericarditis, and myocarditis) |
 The flushed cheeks and cyanotic lips of mitral stenosis (acrocyanosis) The flushed cheeks and cyanotic lips of mitral stenosis (acrocyanosis) |
 The gargoylism of Hurler’s syndrome (associated with mitral and/or aortic disease) The gargoylism of Hurler’s syndrome (associated with mitral and/or aortic disease) |
 The short palpebral fissures, small upper lip, and hypoplastic mandible of fetal alcohol syndrome (associated with atrial or ventricular septal defects) The short palpebral fissures, small upper lip, and hypoplastic mandible of fetal alcohol syndrome (associated with atrial or ventricular septal defects) |
 The diagonal earlobe crease as a (questionable) marker of coronary artery disease (earlobe sign [also known as Frank’s sign]) The diagonal earlobe crease as a (questionable) marker of coronary artery disease (earlobe sign [also known as Frank’s sign]) |
Table 10-2 Diagnostic Clues: Eyes, Extremities, Skin, Thorax, and Abdomen
| Eyes |
 Xanthelasmhas of dyslipidemia and coronary artery disease (CAD) Xanthelasmhas of dyslipidemia and coronary artery disease (CAD) |
 The enlarged lacrimal glands of sarcoidosis (restrictive cardiomyopathy, conduction defects, and, possibly, cor pulmonale) The enlarged lacrimal glands of sarcoidosis (restrictive cardiomyopathy, conduction defects, and, possibly, cor pulmonale) |
 The cataracts and deafness of “rubella syndrome” (patent ductus arteriosus [PDA] or stenosis of the pulmonary artery) The cataracts and deafness of “rubella syndrome” (patent ductus arteriosus [PDA] or stenosis of the pulmonary artery) |
 The stare and proptosis of increased central venous pressure The stare and proptosis of increased central venous pressure The lid lag, stare, and exophthalmos of hyperthyroidism (tachyarrhythmias, angina, and high output failure) The lid lag, stare, and exophthalmos of hyperthyroidism (tachyarrhythmias, angina, and high output failure) |
 The conjunctival petechiae of endocarditis The conjunctival petechiae of endocarditis |
 The conjunctivitis of Reiter’s disease (pericarditis, aortic regurgitation, and prolongation of the P-R interval) The conjunctivitis of Reiter’s disease (pericarditis, aortic regurgitation, and prolongation of the P-R interval) |
 The blue sclerae of osteogenesis imperfecta (aortic regurgitation) The blue sclerae of osteogenesis imperfecta (aortic regurgitation) |
 The icteric sclerae of cirrhosis The icteric sclerae of cirrhosis |
 The Brushfield’s spots (small white spots on the periphery of the iris, usually crescentic and with an outward concavity, frequently but not exclusively seen in Down syndrome—endocardial cushion defects) The Brushfield’s spots (small white spots on the periphery of the iris, usually crescentic and with an outward concavity, frequently but not exclusively seen in Down syndrome—endocardial cushion defects) |
 The fissuring of the iris (coloboma) of total anomalous pulmonary venous return The fissuring of the iris (coloboma) of total anomalous pulmonary venous return |
 The dislocated lens of Marfan’s syndrome The dislocated lens of Marfan’s syndrome |
 The retinal changes of hypertension and diabetes (CAD and congestive heart failure) The retinal changes of hypertension and diabetes (CAD and congestive heart failure) |
 The Roth spots of bacterial endocarditis The Roth spots of bacterial endocarditis |
| Extremities |
 The cyanosis and clubbing of “central mixing” (right-to-left shunts, pulmonary arteriovenous fistulas, and drainage of the inferior vena cava into left atrium) The cyanosis and clubbing of “central mixing” (right-to-left shunts, pulmonary arteriovenous fistulas, and drainage of the inferior vena cava into left atrium) |
 The differential cyanosis and clubbing of PDA with pulmonary hypertension (the reversed shunt limits cyanosis and clubbing to the feet, but spares hands) The differential cyanosis and clubbing of PDA with pulmonary hypertension (the reversed shunt limits cyanosis and clubbing to the feet, but spares hands) |
 The “reversed” differential cyanosis and clubbing of transposition (aorta originating from the right ventricle): hands are cyanotic and clubbed, but feet are normal The “reversed” differential cyanosis and clubbing of transposition (aorta originating from the right ventricle): hands are cyanotic and clubbed, but feet are normal |
 The sudden pallor, pain, and coldness of peripheral embolization The sudden pallor, pain, and coldness of peripheral embolization |
 Osler’s nodes (swollen, tender, raised, pea-sized lesion of finger pads, palms, and soles) and Janeway lesions (small, nontender, erythematous or hemorrhagic lesions of the palms or soles) of bacterial endocarditis Osler’s nodes (swollen, tender, raised, pea-sized lesion of finger pads, palms, and soles) and Janeway lesions (small, nontender, erythematous or hemorrhagic lesions of the palms or soles) of bacterial endocarditis |
 The clubbing, splinter hemorrhages of endocarditis The clubbing, splinter hemorrhages of endocarditis |
 The Raynaud’s of scleroderma The Raynaud’s of scleroderma |
 The simian line of Down’s syndrome (atrial septal defect [ASD]) The simian line of Down’s syndrome (atrial septal defect [ASD]) |
 The hyperextensible joints of osteogenesis imperfecta (aortic regurgitation) The hyperextensible joints of osteogenesis imperfecta (aortic regurgitation) |
 The nicotine finger stains of chain smokers (CAD) The nicotine finger stains of chain smokers (CAD) |
 The leg edema of congestive heart failure The leg edema of congestive heart failure |
 The tightly tapered and contracted fingers of scleroderma, with ischemic ulcers and hypoplastic nails (often associated with pulmonary hypertension and myocardial disease, pericarditis, and valvulopathy) The tightly tapered and contracted fingers of scleroderma, with ischemic ulcers and hypoplastic nails (often associated with pulmonary hypertension and myocardial disease, pericarditis, and valvulopathy) |
 The arachnodactyly, hyperextensible joints (especially knees, wrists, and fingers), and flat feet of Marfan’s syndrome (associated with aortic disease and regurgitation) The arachnodactyly, hyperextensible joints (especially knees, wrists, and fingers), and flat feet of Marfan’s syndrome (associated with aortic disease and regurgitation) |
 The ulnar deviation of rheumatoid arthritis (pericardial, valvular, or myocardial disease) The ulnar deviation of rheumatoid arthritis (pericardial, valvular, or myocardial disease) |
 The mainline track lines of addicts (tricuspid regurgitation, septic emboli, and endocarditis) The mainline track lines of addicts (tricuspid regurgitation, septic emboli, and endocarditis) |
 The liver palms (thenar and hypothenar erythema) of chronic hepatic congestion The liver palms (thenar and hypothenar erythema) of chronic hepatic congestion |
| Skin |
 The jaundice or hepatic congestion The jaundice or hepatic congestion |
 The cyanosis of right-to-left shunt The cyanosis of right-to-left shunt |
 The pallor of anemia and high output failure The pallor of anemia and high output failure |
 The bronzing of hemochromatosis (restrictive cardiomyopathy) The bronzing of hemochromatosis (restrictive cardiomyopathy) |
 The telangiectasias of Rendu-Osler-Weber (at times associated with pulmonary arteriovenous fistulae) The telangiectasias of Rendu-Osler-Weber (at times associated with pulmonary arteriovenous fistulae) |
 The neurofibromas, café-au-lait spots, and axillary freckles (Crowe’s sign) of von Recklinghausen’s (pheochromocytomas) The neurofibromas, café-au-lait spots, and axillary freckles (Crowe’s sign) of von Recklinghausen’s (pheochromocytomas) |
 The symmetric vitiligo (especially of the distal extremities) of hyperthyroidism The symmetric vitiligo (especially of the distal extremities) of hyperthyroidism |
 The butterfly rash of SLE (endo-myo- pericarditis) The butterfly rash of SLE (endo-myo- pericarditis) |
 The eyelid purplish discoloration of dermatomyositis (cardiomyopathy, heart block, and pericarditis) The eyelid purplish discoloration of dermatomyositis (cardiomyopathy, heart block, and pericarditis) |
 The skin nodules and macules of sarcoidosis (cardiomyopathy and blocks) The skin nodules and macules of sarcoidosis (cardiomyopathy and blocks) |
 The xanthomas of dyslipidemia The xanthomas of dyslipidemia |
 The hyperextensible skin (and joints) of Ehlers-Danlos (mitral valve prolapse) The hyperextensible skin (and joints) of Ehlers-Danlos (mitral valve prolapse) |
 The coarse and sallow skin of hypothyroidism The coarse and sallow skin of hypothyroidism |
 The skin nodules (sebaceous adenomas), shagreen patches, and periungual fibromas of tuberous sclerosis (rhabdomyomas of the heart and arrhythmias) The skin nodules (sebaceous adenomas), shagreen patches, and periungual fibromas of tuberous sclerosis (rhabdomyomas of the heart and arrhythmias) |
| Thorax and Abdomen |
 The thoracic bulges of ventricular septal defect/ASD The thoracic bulges of ventricular septal defect/ASD |
 The pectus carinatum, pectus excavatum, and kyphoscoliosis of Marfan’s syndrome The pectus carinatum, pectus excavatum, and kyphoscoliosis of Marfan’s syndrome |
 The akyphotic and straight back of mitral valve prolapse The akyphotic and straight back of mitral valve prolapse |
 The systolic (and rarely diastolic) murmurs of pectus carinatum, excavatum, straight back The systolic (and rarely diastolic) murmurs of pectus carinatum, excavatum, straight back |
 The barrel chest of emphysema (cor pulmonale) The barrel chest of emphysema (cor pulmonale) |
 The shield chest of Turner’s syndrome The shield chest of Turner’s syndrome |
 The cor pulmonale of severe kyphoscoliosis The cor pulmonale of severe kyphoscoliosis |
 The ascites of right-sided or biventricular failure The ascites of right-sided or biventricular failure |
 The hepatic pulsation of tricuspid regurgitation The hepatic pulsation of tricuspid regurgitation |
 The positive abdominojugular reflux of congestive heart failure The positive abdominojugular reflux of congestive heart failure |
C. The Arterial Pulse
3 Which arteries should be examined during the evaluation of the arterial pulse?
 Arteries on both sides should be compared to detect asymmetries suggestive of embolic, thrombotic, atherosclerotic, dissecting, or extrinsic occlusion.


Since this section focuses on the bedside examination of the arterial wave as part of the cardiovascular exam, we will exclusively discuss evaluation of central arteries. Assessment of peripheral vessels is discussed in Chapter 22, Extremities and Peripheral Vascular Exam, questions 1–25.
5 What alterations occur in peripheral arteries?
The major ones are an increase in amplitude and upstroke velocity. As the distance from the aortic valve increases, the primary percussion wave that is transmitted downward along the aorta begins to merge with the secondary waves that reverberate back from more peripheral arteries. This fusion leads to greater amplitude and upstroke velocity in peripheral as compared to central arteries (Fig. 10-1). This phenomenon is similar to that occurring at the shoreline, where waves tend to be taller. It is also the mechanism behind Hill’s sign, the higher indirect systolic pressure of lower extremities as compared to upper extremities (see Chapter 2, Vital Signs, questions 110–115).


12 What are the characteristics of a normal arterial pulse?
A normal arterial pulse comprises a primary (systolic) and a secondary (diastolic) wave. These are separated by a dicrotic notch (dikrotos, double-beating in Greek), which corresponds to the closure of the semilunar valves (S2) (see Fig. 10-2).

14 How are primary and secondary waves generated?
 The primary wave derives from the ejection of blood into the aorta. Its early portion (percussion wave) reflects discharge into the central aorta, whereas its mid-to-late portion (tidal wave) reflects movement of blood from the central to the peripheral aorta. The two portions are separated by an anacrotic notch, only visible on tracing and usually not palpable.

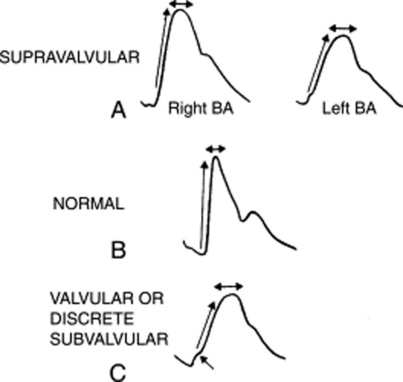
18 How can you differentiate supravalvular from valvular aortic stenosis?
Supravalvular AS is associated with right-to-left asymmetry of the arterial pulse: the right brachial is normal while the left resembles the pulse of valvular AS (see Fig. 10-3). This is akin to aortic coarctation and underscores the importance of examining both pulses.
20 What is the significance of a brisk arterial upstroke?
 The simultaneous emptying of the left ventricle into a high-pressure bed (the aorta) and a lower pressure bed. The latter can be the right ventricle (in patients with ventricular septal defect, VSD) or the left atrium (in patients with mitral regurgitation, MR). Both will allow a rapid left ventricular emptying, which, in turn, generates a brisk arterial upstroke. The pulse pressure, however, remains normal.

22 What is pulsus paradoxus?
It is an exaggerated fall in systolic blood pressure during quiet inspiration. In contrast to evaluation of arterial contour and amplitude, pulsus paradoxus is best detected in a peripheral vessel, such as the radial. Although palpable at times, optimal detection of the pulsus paradoxus usually requires a sphygmomanometer (see Chapter 2, Vital Signs, questions 85–103).
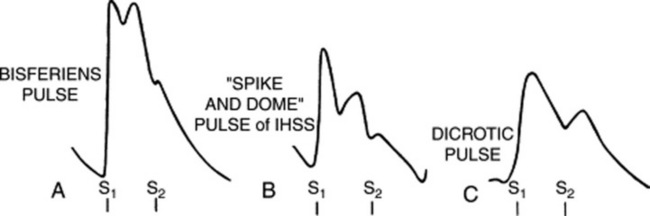
30 What is a double-peaked pulse?
It is a pulse characterized by two palpable spikes per cycle (Fig. 10-4). The first peak always occurs in systole, whereas the second may instead occur during either systole (as part of the primary wave: pulsus bisferiens and bifid pulse) or diastole (as part of the secondary wave: dicrotic pulse).
33 What is the diagnostic significance of a pulsus bisferiens?


38 What is the prognostic value of a pulsus bisferiens?
It indicates a very large stroke volume. Hence, it may disappear with left ventricular dysfunction.
43 What is a hypokinetic pulse?


47 What is the carotid shudder?
It is a palpable thrill felt at the peak of the carotid pulse in patients with AS, AR, or both. It represents the transmission of the murmur to the artery and is a relatively specific but rather insensitive sign of aortic valvular disease (Fig. 10-5).

51 What is Corrigan’s pulse?
It is one of the various names for the bounding and quickly collapsing pulse of aortic regurgitation. This is both visible and palpable. Another common term for it is “water hammer,” but also cannonball, collapsing, or pistol-shot pulse. Corrigan’s may be so brisk as to cause other typical findings, such as De Musset’s or Lincoln’s signs (see Chapter 1, questions 53 and 54).
55 What is a pulsus durus?
A pulse so hardened that it is difficult to compress (durus, hard in Latin). This is usually a finding of arteriosclerosis, which may be associated with Osler’s sign (see Chapter 2, questions 70–72).
58 What other findings can mimic a carotid bruit?
 Systolic heart murmurs: These are only transmitted to the neck. Hence, in contrast to a bruit, they are louder over the precordium than the neck.
 Venous hums: These are innocent murmurs caused by flow in the internal jugular vein. In contrast to carotid bruits, they are loudest in diastole (although, actually, continuous) and can only be heard in a sitting position (see questions 120–123).
59 What is the interobserver agreement on carotid bruits?
Quite good for detecting bruits, but only fair for evaluating their intensity, pitch, or duration.
60 Can carotid bruits occur in children?
Yes. In fact, they are present in 20% of children younger than 15 years of age.
D. Central Venous Pressure and Jugular Venous Pulse (Waveform)


68 Which veins should be evaluated for assessing venous pulse and CVP?
Central veins, as much in direct communication with the right atrium as possible. The ideal one is therefore the internal jugular. Of course, as part of a comprehensive examination, all visible veins should be evaluated. Since this chapter focuses on the cardiovascular exam, we will limit our discussion to jugular waveform and central venous pressure. Evaluation of peripheral veins is covered in Chapter 22, The Extremities and Peripheral Vascular Exam, questions 41–62.
69 What is the clinical value of jugular venous distention and pulse?
It is a “poor man’s” monitor of right heart hemodynamics. More specifically:


72 Can the external jugulars be used for evaluating central venous pressure?


73 But don’t external jugulars have valves?
They do, but so do the internal jugulars. Yet, this doesn’t interfere with estimation of CVP since the normal flow of blood is toward the heart, and not from it. It might interfere, though, with the evaluation of the venous pulse (see question 79).
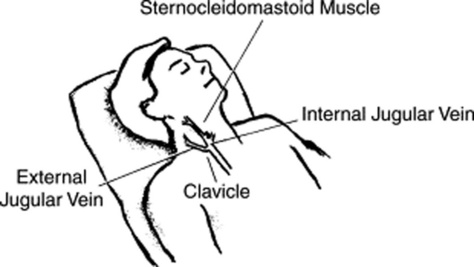
75 What is the anatomy of internal and external jugular veins?
The external jugulars lie above the sternocleidomastoid muscles, coursing obliquely from behind and laterally toward the angle of the jaw (Fig. 10-6). The internal jugulars lie instead below the sternocleidomastoids, crossing them in a vertical straight line. At the junction with the subclavian veins, the internal jugulars create a dilation known as the bulb, which is often visible between the two heads of the sternocleidomastoid muscles.
77 How important is the patient’s position during examination of the neck veins?


78 How do you tell apart the carotid pulse from the jugular venous pulse?
By the following differentiating features:
 The waveform is different: The venous pulsation is diffuse, at least bifid, and with a slow upward deflection. Conversely, the carotid pulse is well localized, single, and with a fast outward deflection. Also, the most striking event in the venous pulse is the troughs, whereas in the arterial pulse, it is the ascent.

 The response to respiration is different: In the absence of intrathoracic disease (and Kussmaul’s sign—see questions 115–118), the top of the venous waveform descends toward the heart during inspiration (because of lower intrathoracic pressure and greater venous return). The carotid pulse, instead, remains unchanged. The only exception is pulsus paradoxus, and even in this case, the variation is rarely visible, at most palpable. Note that inspiration makes jugular “pulsations” more visible (by enhancing venous return), even though it also lowers the mean jugular “pressure.”

 The response to abdominal pressure is different: Sustained pressure on the abdomen (the abdominojugular reflux test, see questions 106–114) will not change the carotid pulse, but will increase (at least momentarily) even the normal venous pulse (see Table 10-3).
Table 10-3 Differentiation Between Jugular and Carotid Pulses
| Characteristic | Internal Jugular Vein and Jugular Venous Pulse | Carotid Artery and Carotid Pulse |
|---|---|---|
| Location | Low in neck and lateral | Deep in neck and medial |
| Contour | Double peaked and diffuse | Single peaked and sharp |
| Character | Undulant, not palpable | Forceful, brisk, easily felt |
| Response to position | Varies with position | No variation |
| Response to respiration | Mean pressure decreases on inspiration (height of column falls), but A and V waves become more visible | No variation |
| Response to abdominal pressure | Displaces pulse upward and induces transient increase in mean pressure | Pulse unchanged |
| Effect of palpation | Wave visible but nonpalpable | Pulse unchanged |
| Gentle pressure 3–4 cm above the clavicle obliterates pulse and fills the vein | Vessel difficult to compress |
(Adapted from Cook DJ, Simel N: Does this patient have abnormal central venous pressure? JAMA 275:630–634, 1996; and Abrams J: Essentials of Cardiac Physical Diagnosis. Philadelphia, Lea & Febiger, 1987.)
79 How do you evaluate the jugular venous pulse?


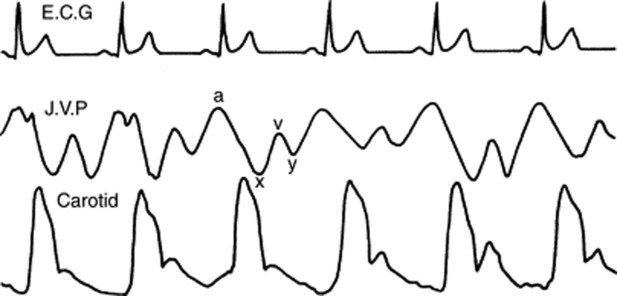
80 What are the components of the jugular waveform?
 On venous tracing, the jugular pulse consists of three positive waves (A, C, and V) and three negative descents (X, X1, and Y). The A wave is followed by the X descent, the C wave by the X1 descent, and the V wave by the Y descent.
 At the bedside, the jugular venous pulse consists instead of only two positive waves (A and V—with A taller than V) and two negative descents (X1 and Y—with X1 steeper than Y). Neither the C wave nor the X descent is visible (C is usually lost in the A wave, and X is merged with X1). Note that descents are easier to spot than ascents (see Fig. 10-7).
82 What is the physiology of the various ascents and descents of the jugular venous pulse?


85 What is the influence of respiration on the jugular venous pressure?
The opposite. Inspiration lowers the mean jugular venous pressure, exhalation increases it.
86 Which diseases can be diagnosed by jugular venous pulse?
Quite a few. Some are both common and important, affecting either waves or descents (see Fig. 10-8).
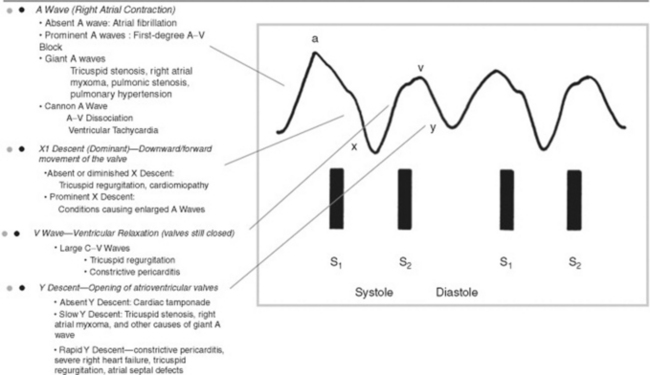
87 What are the most important abnormalities of jugular waves?
For both this and the next question, see Fig. 10-9.
 Giant A wave. In addition to tricuspid stenosis, this also can occur in increased right ventricular end-diastolic pressure (from pulmonic stenosis, primary pulmonary hypertension, pulmonary emboli, or chronic pulmonary disease). In these patients, the large A wave reflects a strong atrial contraction against a stiffer ventricle presenting with a concomitantly blunted and small Y descent. The acoustic counterpart of a giant A wave is a right-sided S4, and its electric equivalent is a P pulmonale. Giant A waves also may be seen in marked left ventricular hypertrophy (like AS, severe hypertension, or hypertrophic obstructive cardiomyopathy). In these patients, the ventricular septum bulges toward the right, making right ventricular filling more difficult (the Bernheim effect, from Hippolyte Bernheim, the French physician and hypnotist who described it in 1910).


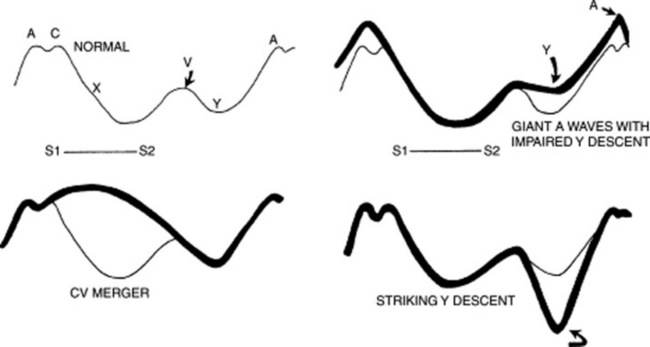
88 What are the most important abnormalities of jugular descents?


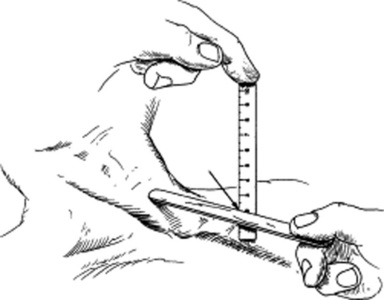
89 How do you estimate the CVP?
 By positioning the patient so that you can get a good view of the internal jugular vein and its oscillations. Although it is wise to start at 45 degrees, it doesn’t really matter which angle you will eventually use to raise the patient’s head, as long as it can adequately reveal the vein. In the absence of a visible internal jugular, the external jugular may suffice.


 By measuring in centimeters the vertical height from the sternal angle to the top of the jugular pulsation. To do so, place two rulers at a 90-degree angle: one horizontal (and parallel to the meniscus) and the other vertical to it and touching the sternal angle (see Fig. 10-10). The extrapolated height between the sternal angle and meniscus represents the jugular venous pressure (JVP).
 By adding five to convert jugular venous pressure into central venous pressure.
93 Are there alternative methods to assess the CVP?
Yes, but they have not been validated:
 Von Recklinghausen’s maneuver consists in asking the patient to lie supine, with the palm of one hand laid down over the thigh, and the other laid down over the bed (thereby 5–10 cm below the first hand). Patients have high CVP if the veins of both hands are engorged but normal CVP if only the lower hand veins are engorged.

94 How precise is the clinical assessment of CVP?
 In a study of 50 intensive care unit patients, agreement on CVP values was substantial between students and residents, moderate between students and attending physicians, and modest between residents and staff. Factors that interfered with the precision of the estimate included variations in patients’ positioning, poor ambient lighting, confusion between carotid and venous pulsations, and changes in CVP with respiration.


95 So what conclusions can be drawn about the clinical use of CVP assessment?
When compared to the gold standard of a central venous catheter, clinical measurement of CVP is overall poor, especially in the acutely ill patient. In the aforementioned study of 50 critically ill patients, for example, the pooled accuracy of the test was 56%. All groups involved (students, residents, and attending physicians) tended to underestimate central venous pressure (see question 96), and level of expertise was not a guarantee of accuracy. In fact, the correlation coefficient between clinical assessment and central venous catheter recording was highest for medical students (0.74), a little lower for residents (0.71), and lowest for staff physicians (0.65). These correlations slightly improved after exclusion of patients on mechanical ventilation, suggesting that CVP assessment is more accurate in patients who breathe spontaneously. Hence, bedside assessment of CVP is only accurate at the extremes of presentation:


98 What is the significance of an elevated jugular venous pressure?


101 How are the neck veins in tamponade?
Distended. This is a must, together with dyspnea/tachypnea, tachycardia, and clear lungs. Given this constellation of four symptoms/findings, the differential diagnosis is narrowed to five major entities: right ventricular infarction, massive pulmonary embolism, constrictive pericarditis, tension pneumothorax, and tamponade. The first four present with a positive Kussmaul’s sign in approximately one half of the cases, but never have a pulsus paradoxus >21 mmHg. Conversely, tamponade comes with no Kussmaul’s, but does present with a pulsus of 20–50 mmHg (see Chapter 2, questions 92–95).
104 What is the prognostic value of an increased CVP in preoperative patients?
If untreated, it predicts postoperative pulmonary edema and/or infarction.
105 What are the jugular findings of right ventricular infarction?
 The right ventricular filling pressure is increased (as a result of an ischemic and less compliant chamber). Since the ventricle also becomes unable to handle incoming venous flow, the mean jugular (and central) venous pressures will be similarly increased. This has high specificity (96.8%) but low sensitivity (39%) for right ventricular infarction.

 Positive Kussmaul’s sign is as specific as a JVP increase, but less sensitive (26.1%).


107 What is it used for?
To unmask subclinical right ventricular failure (and silent tricuspid regurgitation) but also to confirm symptomatic left ventricular failure (see question 113). Hence, the “Pasteur-Rondot maneuver” is a very helpful tool, albeit one that is often misused and misinterpreted.
111 How do you perform an abdominojugular test?
By observing the jugular venous pressure before, during, and after abdominal compression:
 Position the supine patient so that the jugular venous pulsations are properly monitored (an angle of 45 degrees will usually suffice). Then instruct the patient to relax and breathe normally through the open mouth. This will avoid the false positive increase in jugular venous pressure caused by a Valsalva’s maneuver inadvertently triggered by abdominal discomfort.


112 When is the abdominojugular test considered positive?


116 Which disease processes are associated with a positive Kussmaul’s?


120 What is the “venous hum”?
It is a functional murmur (see Chapter 12, questions 44 and 45) produced by turbulent flow in the internal jugular vein. It is continuous (albeit louder in diastole) and at times strong enough to be associated with a palpable thrill. It is best heard on the right side of the neck, just above the clavicle, but sometimes it can become audible over the sternal/parasternal areas, both right and left. This may lead to misdiagnoses of carotid disease, patent ductus arteriosus, or AR/AS.
E. The Precordial Movement and Impulse
129 How do you assess the precordial impulse(s)?


130 How do you time precordial events?
By simultaneously palpating the carotid, or by concomitantly auscultating for S1 and S2.
131 Which characteristics of the apical impulse should be analyzed?
 Location: Normally over the fifth left interspace midclavicular line, which usually (but not always) corresponds to the area just below the nipple. Volume loads to the left ventricle (such as aortic or mitral regurgitation) tend to displace the apical impulse downward and laterally. Conversely, pressure loads (such as aortic stenosis or hypertension) tend to displace the impulse more upward and medially—at least initially. Still, a failing and decompensated ventricle, independent of its etiology, will typically present with a downward and lateral shift in PMI. Although not too sensitive, this finding is very specific for cardiomegaly, low ejection fraction, and high pulmonary capillary wedge pressure. Correlation of the PMI with anatomic landmarks (such as the left anterior axillary line) can be used to better characterize the displaced impulse.


 Contour: A normal apical impulse is single. Double or triple impulses are clearly pathologic.
132 What are the most common abnormal apical movements?
 A double systolic apical impulse can be seen in patients with hypertrophic obstructive cardiomyopathy (HOCM). This may even present as a triple apical impulse (triple ripple), with one impulse being presystolic (and corresponding to a strong atrial contraction) and the other two being instead systolic (corresponding to the initial ventricular contraction, and a delayed one necessary to overcome the outflow obstruction by the septum). A thrill is often present. Note that a double systolic impulse also may be encountered in patients with left ventricular dyskinesia due to either ischemia or aneurysm of the wall (see question 138). In fact, one third of patients with ventricular aneurysm present with abnormal precordial findings.


133 What is the significance of a precordial movement in the left lower sternal area?


140 What is a thrill?
A palpable vibration associated with an audible murmur (see Chapter 12, question 7). A thrill automatically qualifies the murmur as being >4/6 in intensity and thus pathologic.
1 Amoroso T, Greenwood RN. Posture and central venous pressure measurement in circulatory volume depletion. Lancet. 1989;2:258-260.
2 Basta LL, Bettinger JJ. The cardiac impulse. Am Heart J. 1979;197:96-111.
3 Benchimol A, Tippit HC. The clinical value of the jugular and hepatic pulses. Prog Cardiovasc Dis. 1967;10:159-186.
4 Boicourt OW, Nagle RE, Mounsey JPD. The clinical significance of systolic retraction of the apical impulse. Br Heart J. 1965;127:379-391.
5 Borst JGG, Molhuysen A. Exact determination of the central venous pressure by a simple clinical method. Lancet. 1952;2:304-309.
20 Bude RO, Rubin JM, Platt JF, et al. Pulsus tardus: Its cause and potential limitations in detection of arterial stenosis. Radiology. 1994;190:779-784.
6 Butman SM, Ewy GA, Standen JR, et al. Bedside cardiovascular examination in patients with severe chronic heart failure: Importance of rest or inducible jugular venous distension. J Am Coll Cardiol. 1993;22:968-974.
7 Cintron GB, Hernandez E, Linares E, et al. Bedside recognition of right ventricular infarction. Am J Cardiol. 1981;47:224-227.
8 Constant J. Using internal jugular pulsations as a manometer for right atrial pressure measurements. Cardiology. 2000;93:26-30.
9 Cook DJ, Simel N. Does this patient have abnormal central venous pressure? JAMA. 1996;275:630-634.
10 Davison R, Cannon R. Estimation of central venous pressure by examination of the jugular veins. Am Heart J. 1974;87:279-282.
11 Dell’Italia J, Starling MR, O’Rourke RA. Physical examination for exclusion of hemodynamically important right ventricular infarction. Ann Intern Med. 1983;99:608-611.
120 Drazner MH, Rame JE, Stevenson LW, et al: Prognostic importance of elevated jugular venous pressure and a third heart sound in patients with heart failure. N Engl J Med 345:574–581, 200.
13 Ducas J, Magder S, McGregor M. Validity of the hepatojugular reflux as a clinical test for congestive heart failure. Am J Cardiol. 1983;52:1299-1303.
14 Eddleman EE, Langley JO. Paradoxical pulsation of the precordium in myocardial infarction and angina pectoris. Am Heart J. 1962;63:579-581.
15 Ellen SD, Crawford MH, O’Rourke RA. Accuracy of precordial palpation for detecting increased left ventricular volume. Ann Intern Med. 1983;99:628-630.
16 Ewy GA. The abdominojugular test. Ann Intern Med. 1988;109:456-460.
17 Forssell G, Jonasson R, Orinius E. Identifying severe aortic valvular stenosis by bedside examination. Acta Med Scand. 1985;218:397-400.
18 Ikram H, Nixon PGF, Fox JA, et al. The hemodynamic implications of bisferiens pulse. Br Heart J. 1964;26:452-459.
19 Lange RL, Boticelli JT, Tsagaris TJ, et al. Diagnostic signs in compressive cardiac disorders: Constrictive pericarditis, pericardial effusion, and tamponade. Circulation. 1966;33:763-777.
21 Lorell B, Leinbach RC, Pohost GM, et al. Right ventricular infarction: Clinical diagnosis and differentiation from cardiac tamponade and pericardial constriction. Am J Cardiol. 1979;43:465-471.
22 McGee SR. Physical examination of venous pressure: A critical review. Am Heart J. 1998;136:10-18.
23 O’Neill TW, Barry M, Smith M, et al. Diagnostic value of the apex beat. Lancet. 1989;1:410-411.
24 Sauve JS, Laupacis A, Ostbye T, et al. The rational clinical examination. Does this patient have a clinically important carotid bruit? JAMA. 1993;270:2843-2845.
25 Smith D, Craige E. Mechanisms of the dicrotic pulse. Br Heart J. 1986;156:531-534.
26 Sochowski RA, Dubbin JD, Naqvi SZ. Clinical and hemodynamic assessment of the hepatojugular reflux. Am J Cardiol. 1990;66:1002-1006.
27 Surawicz B, Fisch C. Cardiac alternans: Diverse mechanisms and clinical manifestations. J Am Coll Cardiol. 1992;20:483-499.
28 Wiese J. The abdominojugular reflux sign. Am J Med. 2000;109:59-61.
[/level-membership-for-internal-medicine-category][not-level-membership-for-internal-medicine-category]
Chapter 10 The Cardiovascular Exam
A. Generalities
1 What are the main components of the cardiovascular physical examination?
B. General (Physical) Appearance
2 What aspects of general appearance should be observed in evaluating cardiac patients?
As suggested by Perloff, one should sequentially evaluate the following nine areas:
See Tables 10-1 and 10-2.
Table 10-1 Diagnostic Clues: Body and Facies, Gestures and Gait, Face and Ears
| Body Appearance and Facies |
| The anasarca of congestive heart failure |
| The struggling, anguished, frightened, orthopneic, and diaphoretic look of pulmonary edema |
| The tall stature, long extremities (with arm span exceeding patient’s height), and sparse subcutaneous fat of Marfan’s syndrome (mitral valve prolapse, aortic dilation, and dissection) |
| The long extremities, kyphoscoliosis, and pectus carinatum of homocystinuria (arterial thrombosis) |
| The tall stature and long extremities of Klinefelter’s syndrome (atrial or ventricular septal defects, patent ductus arteriosus, and even tetralogy of Fallot) |
| The tall stature and thick extremities of acromegaly (hypertension, cardiomyopathy, and conduction defects) |
| The short stature, webbed neck, low hairline, small chin, wide-set nipples, and sexual infantilism of Turner’s syndrome (coarctation of the aorta and valvular pulmonic stenosis) |
| The dwarfism and polydactyly of Ellis-van Creveld syndrome (atrial septal defects and common atrium) |
| The morbid obesity and somnolence of obstructive sleep apnea (hypoventilation, pulmonary hypertension, and cor pulmonale) |
| The truncal obesity, thin extremities, moon face, and buffalo hump of hypertensive patients with Cushing’s syndrome |
| The mesomorphic, overweight, balding, hairy, and tense middle-aged patient with coronary artery disease |
| The hammer toes and pes cavus of Friedreich’s ataxia (hypertrophic cardiomyopathy, angina, and sick sinus syndrome) |
| The straight lower back of ankylosing spondylitis (aortic regurgitation and complete heart block) |
| Gestures, Gait, and Stance |
| The Levine’s sign (clenched fist over the chest of patients with an acute myocardial infarction) |
| The preferential squatting of tetralogy of Fallot |
| The ataxic gait of tertiary syphilis (associated with aortic aneurysm and regurgitation) |
| The waddling gait, lumbar lordosis, and calves pseudohypertrophy of Duchenne’s muscular dystrophy (associated with hypertrophic cardiomyopathy and a pseudo infarction pattern on ECG) |
| Face and Ears |
| Pulsatility of the earlobes (tricuspid regurgitation) |
| Head bobbing (De Musset’s and Lincoln’s signs) |
| The round and chubby face of congenital pulmonary stenosis |
| The hypertelorism, pigmented moles, webbed neck, and low-set ears of Turner’s syndrome |
| The round and chubby face of congenital valvular pulmonic stenosis |
| The elfin face (small chin, malformed teeth, wide-set eyes, patulous lips, baggy cheeks, blunt and upturned nose) of congenital stenosis of the pulmonary arteries and supravalvular aortic stenosis—often associated with hypercalcemia and mental retardation. |
| The unilateral lower facial weakness of infants with cardiofacial syndrome—this can be encountered in 5–10% of infants with congenital heart disease (usually ventricular septal defect); often noticeable only during crying. |
| The premature aging of Werner’s syndrome and progeria (associated with premature coronary artery and systemic atherosclerotic disease) |
| The drooping eyelids, expressionless face, receding hairline, and bilateral cataracts of Steinert’s disease (myotonic dystrophy, associated with conduction disorders, mitral valve prolapse) |
| The epicanthic fold, protruding tongue, small ears, short nose, and flat bridge of Down syndrome (endocardial cushion defects) |
| The dry and brittle hair, loss of lateral eyebrows, puffy eyelids, apathetic face, protruding tongue, thick and sallow skin of myxedema (associated with pericardial and coronary artery disease) |
| The macroglossia not only of Down syndrome and myxedema, but also of amyloidosis (linked to restrictive cardiomyopathy, congestive heart failure) |
| The paroxysmal facial and neck flushing of carcinoid syndrome (with pulmonic stenosis and tricuspid stenosis/regurgitation) |
| The saddle-shaped nose of polychondritis (associated with aortic aneurysm) |
| The tightening of skin and mouth, scattered telangiectasias, and hyperpigmentation/hypopigmentation of scleroderma (with pulmonary hypertension, pericarditis, and myocarditis) |
| The flushed cheeks and cyanotic lips of mitral stenosis (acrocyanosis) |
| The gargoylism of Hurler’s syndrome (associated with mitral and/or aortic disease) |
| The short palpebral fissures, small upper lip, and hypoplastic mandible of fetal alcohol syndrome (associated with atrial or ventricular septal defects) |
| The diagonal earlobe crease as a (questionable) marker of coronary artery disease (earlobe sign [also known as Frank’s sign]) |
Table 10-2 Diagnostic Clues: Eyes, Extremities, Skin, Thorax, and Abdomen
| Eyes |
| Xanthelasmhas of dyslipidemia and coronary artery disease (CAD) |
| The enlarged lacrimal glands of sarcoidosis (restrictive cardiomyopathy, conduction defects, and, possibly, cor pulmonale) |
| The cataracts and deafness of “rubella syndrome” (patent ductus arteriosus [PDA] or stenosis of the pulmonary artery) |
| The stare and proptosis of increased central venous pressure The lid lag, stare, and exophthalmos of hyperthyroidism (tachyarrhythmias, angina, and high output failure) |
| The conjunctival petechiae of endocarditis |
| The conjunctivitis of Reiter’s disease (pericarditis, aortic regurgitation, and prolongation of the P-R interval) |
| The blue sclerae of osteogenesis imperfecta (aortic regurgitation) |
| The icteric sclerae of cirrhosis |
| The Brushfield’s spots (small white spots on the periphery of the iris, usually crescentic and with an outward concavity, frequently but not exclusively seen in Down syndrome—endocardial cushion defects) |
| The fissuring of the iris (coloboma) of total anomalous pulmonary venous return |
| The dislocated lens of Marfan’s syndrome |
| The retinal changes of hypertension and diabetes (CAD and congestive heart failure) |
| The Roth spots of bacterial endocarditis |
| Extremities |
| The cyanosis and clubbing of “central mixing” (right-to-left shunts, pulmonary arteriovenous fistulas, and drainage of the inferior vena cava into left atrium) |
| The differential cyanosis and clubbing of PDA with pulmonary hypertension (the reversed shunt limits cyanosis and clubbing to the feet, but spares hands) |
| The “reversed” differential cyanosis and clubbing of transposition (aorta originating from the right ventricle): hands are cyanotic and clubbed, but feet are normal |
| The sudden pallor, pain, and coldness of peripheral embolization |
| Osler’s nodes (swollen, tender, raised, pea-sized lesion of finger pads, palms, and soles) and Janeway lesions (small, nontender, erythematous or hemorrhagic lesions of the palms or soles) of bacterial endocarditis |
| The clubbing, splinter hemorrhages of endocarditis |
| The Raynaud’s of scleroderma |
| The simian line of Down’s syndrome (atrial septal defect [ASD]) |
| The hyperextensible joints of osteogenesis imperfecta (aortic regurgitation) |
| The nicotine finger stains of chain smokers (CAD) |
| The leg edema of congestive heart failure |
| The tightly tapered and contracted fingers of scleroderma, with ischemic ulcers and hypoplastic nails (often associated with pulmonary hypertension and myocardial disease, pericarditis, and valvulopathy) |
| The arachnodactyly, hyperextensible joints (especially knees, wrists, and fingers), and flat feet of Marfan’s syndrome (associated with aortic disease and regurgitation) |
| The ulnar deviation of rheumatoid arthritis (pericardial, valvular, or myocardial disease) |
| The mainline track lines of addicts (tricuspid regurgitation, septic emboli, and endocarditis) |
| The liver palms (thenar and hypothenar erythema) of chronic hepatic congestion |
| Skin |
| The jaundice or hepatic congestion |
| The cyanosis of right-to-left shunt |
| The pallor of anemia and high output failure |
| The bronzing of hemochromatosis (restrictive cardiomyopathy) |
| The telangiectasias of Rendu-Osler-Weber (at times associated with pulmonary arteriovenous fistulae) |
| The neurofibromas, café-au-lait spots, and axillary freckles (Crowe’s sign) of von Recklinghausen’s (pheochromocytomas) |
| The symmetric vitiligo (especially of the distal extremities) of hyperthyroidism |
| The butterfly rash of SLE (endo-myo- pericarditis) |
| The eyelid purplish discoloration of dermatomyositis (cardiomyopathy, heart block, and pericarditis) |
| The skin nodules and macules of sarcoidosis (cardiomyopathy and blocks) |
| The xanthomas of dyslipidemia |
| The hyperextensible skin (and joints) of Ehlers-Danlos (mitral valve prolapse) |
| The coarse and sallow skin of hypothyroidism |
| The skin nodules (sebaceous adenomas), shagreen patches, and periungual fibromas of tuberous sclerosis (rhabdomyomas of the heart and arrhythmias) |
| Thorax and Abdomen |
| The thoracic bulges of ventricular septal defect/ASD |
| The pectus carinatum, pectus excavatum, and kyphoscoliosis of Marfan’s syndrome |
| The akyphotic and straight back of mitral valve prolapse |
| The systolic (and rarely diastolic) murmurs of pectus carinatum, excavatum, straight back |
| The barrel chest of emphysema (cor pulmonale) |
| The shield chest of Turner’s syndrome |
| The cor pulmonale of severe kyphoscoliosis |
| The ascites of right-sided or biventricular failure |
| The hepatic pulsation of tricuspid regurgitation |
| The positive abdominojugular reflux of congestive heart failure |
C. The Arterial Pulse
3 Which arteries should be examined during the evaluation of the arterial pulse?
Arteries on both sides should be compared to detect asymmetries suggestive of embolic, thrombotic, atherosclerotic, dissecting, or extrinsic occlusion.
Since this section focuses on the bedside examination of the arterial wave as part of the cardiovascular exam, we will exclusively discuss evaluation of central arteries. Assessment of peripheral vessels is discussed in Chapter 22, Extremities and Peripheral Vascular Exam, questions 1–25.
5 What alterations occur in peripheral arteries?
The major ones are an increase in amplitude and upstroke velocity. As the distance from the aortic valve increases, the primary percussion wave that is transmitted downward along the aorta begins to merge with the secondary waves that reverberate back from more peripheral arteries. This fusion leads to greater amplitude and upstroke velocity in peripheral as compared to central arteries (Fig. 10-1). This phenomenon is similar to that occurring at the shoreline, where waves tend to be taller. It is also the mechanism behind Hill’s sign, the higher indirect systolic pressure of lower extremities as compared to upper extremities (see Chapter 2, Vital Signs, questions 110–115).
12 What are the characteristics of a normal arterial pulse?
A normal arterial pulse comprises a primary (systolic) and a secondary (diastolic) wave. These are separated by a dicrotic notch (dikrotos, double-beating in Greek), which corresponds to the closure of the semilunar valves (S2) (see Fig. 10-2).
14 How are primary and secondary waves generated?
The primary wave derives from the ejection of blood into the aorta. Its early portion (percussion wave) reflects discharge into the central aorta, whereas its mid-to-late portion (tidal wave) reflects movement of blood from the central to the peripheral aorta. The two portions are separated by an anacrotic notch, only visible on tracing and usually not palpable.
18 How can you differentiate supravalvular from valvular aortic stenosis?
Supravalvular AS is associated with right-to-left asymmetry of the arterial pulse: the right brachial is normal while the left resembles the pulse of valvular AS (see Fig. 10-3). This is akin to aortic coarctation and underscores the importance of examining both pulses.
20 What is the significance of a brisk arterial upstroke?
The simultaneous emptying of the left ventricle into a high-pressure bed (the aorta) and a lower pressure bed. The latter can be the right ventricle (in patients with ventricular septal defect, VSD) or the left atrium (in patients with mitral regurgitation, MR). Both will allow a rapid left ventricular emptying, which, in turn, generates a brisk arterial upstroke. The pulse pressure, however, remains normal.
22 What is pulsus paradoxus?
It is an exaggerated fall in systolic blood pressure during quiet inspiration. In contrast to evaluation of arterial contour and amplitude, pulsus paradoxus is best detected in a peripheral vessel, such as the radial. Although palpable at times, optimal detection of the pulsus paradoxus usually requires a sphygmomanometer (see Chapter 2, Vital Signs, questions 85–103).
30 What is a double-peaked pulse?
It is a pulse characterized by two palpable spikes per cycle (Fig. 10-4). The first peak always occurs in systole, whereas the second may instead occur during either systole (as part of the primary wave: pulsus bisferiens and bifid pulse) or diastole (as part of the secondary wave: dicrotic pulse).
33 What is the diagnostic significance of a pulsus bisferiens?
38 What is the prognostic value of a pulsus bisferiens?
It indicates a very large stroke volume. Hence, it may disappear with left ventricular dysfunction.
