The arterial waveform
Dynamic indexes of fluid responsiveness
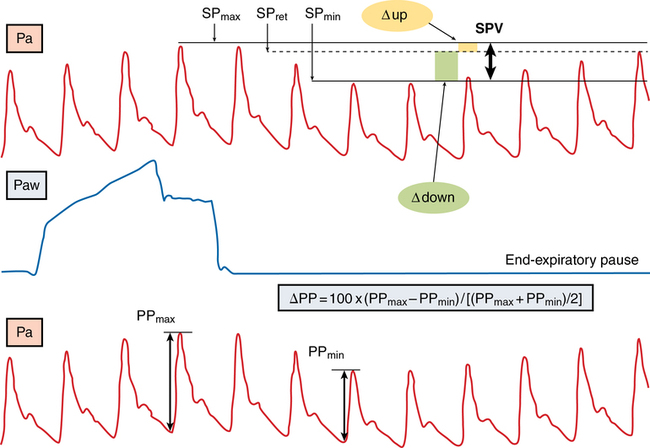
The SPV and PPV derived from the arterial waveform during a mechanical breath (Figure 16-1) are more pronounced during hypovolemia because the left ventricle operates on the steep portion of the Frank-Starling curve. Changes in right and left ventricular preload, which are highly sensitive to changes in intrathoracic pressure induced by a mechanical breath, cause the variation in the left ventricular SV. Observing the various components of SPV and PPV can establish the presence and cause of hypovolemia, with dynamic changes in the arterial waveform predicting the response to fluid challenge. SPV, PPV, and SVV (measured by pulse contour analysis) are currently the most accurate indicators for fluid responsiveness in patients in the intensive care unit and in many surgical patients. Given that only 50% of patients in the intensive care unit respond to fluid loading, this measurement may provide valuable data for determining which patients should be first treated with fluids and which may benefit from inotropic support as the first intervention to increase CO. Although simply viewing the arterial waveform on the arterial pressure tracing can provide information about the presence of respiratory variation, an accurate electronic measurement can quantify the pressure variation and its components, allowing the effect of fluid loading to be continually assessed.
Cardiac output derived from the arterial pressure waveform
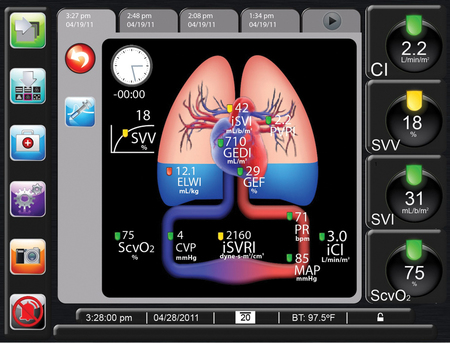
Arterial pressure waveform analysis is now used in clinical practice with several commercially available devices that can be used to continuously measure CO, based on the arterial pressure waveform. These devices provide a CO value derived from pulse-contour measurements that correlates well with the value derived from the pulmonary artery catheter thermodilution technique (a bias of 0.03-0.3 L/min), but, under various clinical conditions and therapies, this correlation might be disrupted. Compared with the thermodilution technique, these devices are less invasive and their use is associated with potentially fewer complications. Examples of commercially available devices include the PiCCO (Pulsion Medical Systems, Munich, Germany) and LiDCO (LiDCO, Ltd, Cambridge, UK), and the EV1000 Clinical Platform (Edwards Lifesciences, Irvine, CA) which require an invasive calibration and recalibration, and the FloTrac/Vigileo (Edwards Lifesciences) device, which uses individual demographic data to estimate arterial compliance and, therefore, does not require invasive calibration. These devices use pulse-contour analysis with various algorithms to estimate SV from the arterial waveform. The SV is calculated by a mathematical computation of the area under the systolic portion of the arterial pressure waveform. The algorithm incorporates parameters such as aortic impedance, arterial compliance, and peripheral vascular resistance. These devices can also calculate other hemodynamic variables (e.g., static preload parameters, peripheral resistance, oxygen delivery, and the dynamic indexes of fluid responsiveness [see earlier]). The hemodynamic profile is continuously displayed, with the option to follow trends and changes during patient care (Figure 16-2).