[level-membership-for-cardiovascular-category]
CHAPTER 109 Sonography of the Renal Vessels
TECHNICAL REQUIREMENTS
Successful sonography of renal vessels requires the use of gray-scale sonography, tissue harmonics, color flow imaging, power Doppler, and spectral Doppler wave analysis. Additionally, ultrasound contrast agents can aid in the sonographic evaluation of renal vessels. In adult patients, a transducer frequency range between 3.5 and 5 MHz is required, whereas in pediatric patients a higher transducer frequency range can be used.1,2 Transducers with higher frequencies, of 6 to 8 MHz or more, are used to evaluate renal allografts because of their superficial location as compared with native kidneys. The highest transducer frequency that will provide the best resolution should be selected, depending on the depth of penetration required.3
Patients should fast or be on a clear liquid diet starting at midnight the day before the examination.2 Patients should also be encouraged to drink at least two 8-oz glasses of water the previous night and the morning of the examination.4 An oral dose of simethicone, an antigas medication, may be helpful in reducing bowel gas.
TECHNIQUES
Renal vascular ultrasound is indicated for a broad range of renal arterial and venous indications (Box 109-1). Clinically, renal arterial indications are more common, notably for the evaluation of possible renal artery stenosis. Select indications are detailed later. There are no known contraindications for the sonography of renal vessels.
BOX 109-1
Indications for Renal Vascular Ultrasound


Renal Artery Stenosis
The detection of renal artery stenosis in hypertensive patients (i.e., evaluation for renal vascular hypertension) represents the overwhelming indication in most practices. Renal artery stenosis (RAS) is estimated to be responsible for less than 5% of cases of hypertension. However, because it is one of the few treatable causes of hypertension, second only to the secondary hypertension caused by the use of oral contraceptives in women,5 it remains a common indication for renal artery imaging. About one quarter to one third of all patients with RAS eventually develop ischemic nephropathy. Renovascular hypertension is also responsible for the development of end-stage renal disease in 20% of patients. RAS is also seen in approximately 7% of all patients who have cardiovascular diseases (e.g., atherosclerosis, myocardial infarction, congestive heart failure). Its association with stroke has also been reported. Atherosclerosis is the most common cause of RAS, with fibromuscular dysplasia representing a distant second, but other entities such as Takayasu arteritis can also result in renal artery stenosis.
Atherosclerotic Renal Artery Stenosis
Atherosclerotic RAS is mostly progressive, because 20% to 50% of patients with 50% stenosis of renal arteries show progression of the disease within a few years, and 12% to 20% of those having greater than 75% RAS end up with complete occlusion within a year (Figs. 109-1 to 109-9). If RAS patients are left untreated, then in addition to worsening renovascular hypertension, 5% to 16% of these patients will progress to complete occlusion of the renal artery. Even in cases of unilateral RAS, damage to the other kidney in the form of nephrosclerosis caused by increased systemic blood pressure will occur if RAS is left untreated.
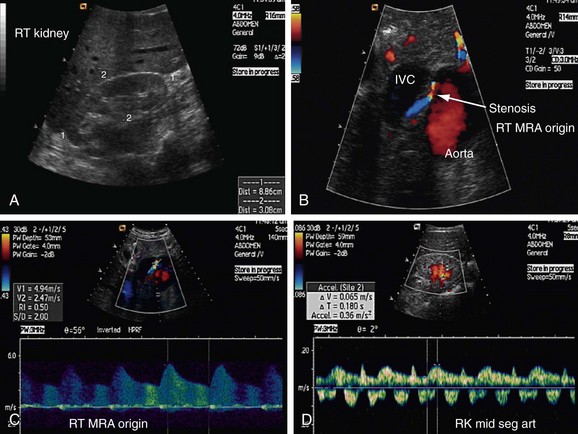
 FIGURE 109-1
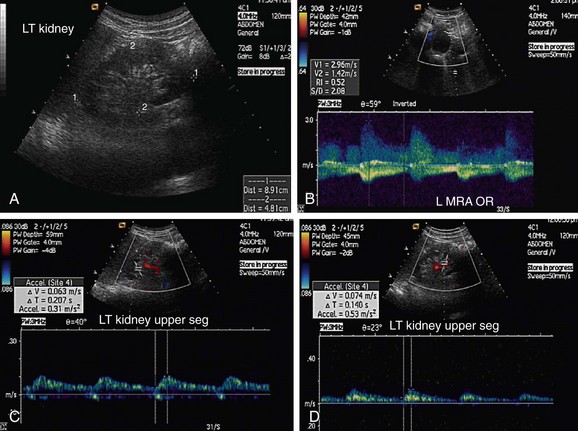
 FIGURE 109-2
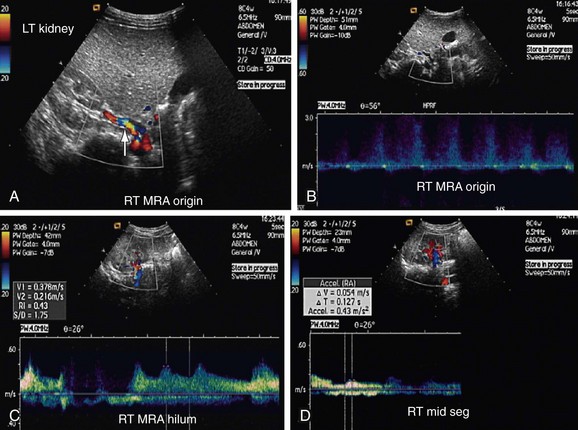
 FIGURE 109-3
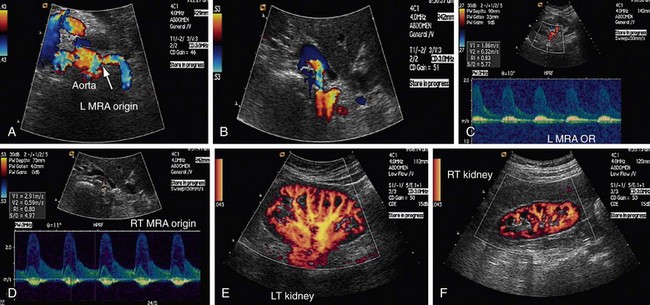
 FIGURE 109-4
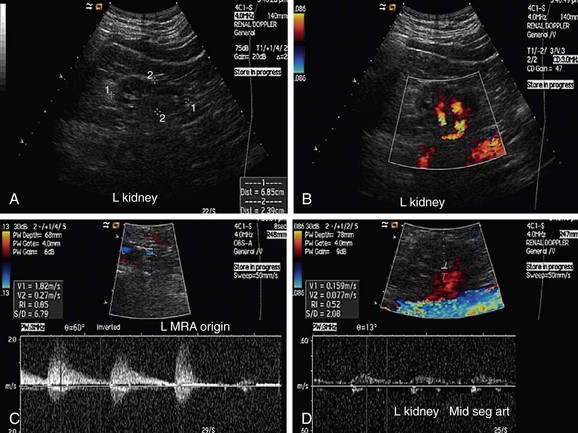
 FIGURE 109-5
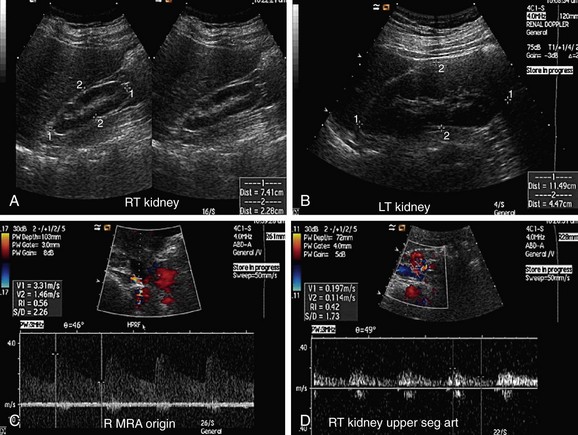
 FIGURE 109-6
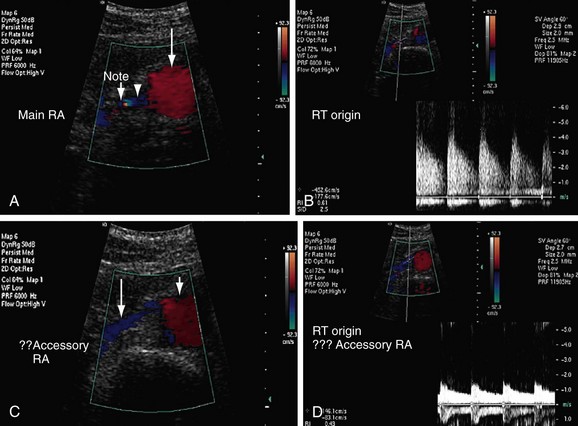
 FIGURE 109-7
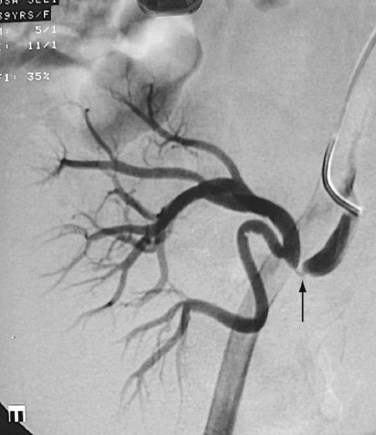
 FIGURE 109-8
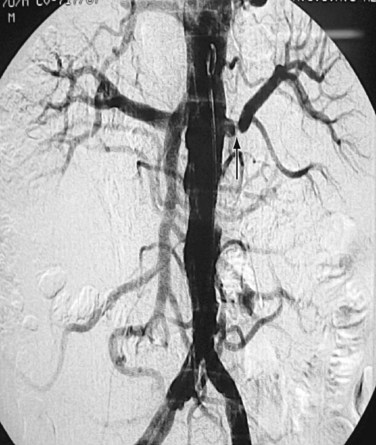
 FIGURE 109-9 Renal angiogram shows stenosis (arrow) in the proximal segment of left renal artery.
(Courtesy of Dr. Gurpreet Singh Gulati, New Delhi, India.)
Fibromuscular Dysplasia
Fibromuscular dysplasia (FMD) results in RAS involving mainly the mid or distal part, and sometimes the intrarenal branches, of the renal artery (Fig. 109-10). FMD is almost eight times more commonly seen in females than males and usually occurs in younger individuals. FMD represents a collection of vascular diseases that affect the intima, media, and adventitia. It generally accounts for less than 10% of cases of RAS. FMD can be classified according to the layer of the arterial wall involved. Clinically, FMD involves the renal artery in three forms, with most (up to 90% of patients) having medial fibroplasia, which typically affects patients younger than 35 years. About one third of patients with medial fibroplasia show progression of the disease, but complications such as dissection and thrombosis are rarely seen.
 FIGURE 109-10
The classic appearance of FMD, which is seen in 85% of patients, is known as the string of beads appearance, as seen angiographically. An endovascular ultrasound study of FMD by Gowda and colleagues6 has challenged the status of renal angiography as the gold standard for RAS in FMD patients. Other findings of FMD, such as a fibrous diaphragm, may not be seen sonographically; however, focal narrowing of the main artery caused by medial or adventitial hyperplasia might be seen.
Takayasu Arteritis
Takayasu arteritis, or nonspecific arteritis, is associated with stenosis (and occlusion) of the aorta and renal arteries (Figs. 109-11 to 109-15). This disease is more prevalent in Far Eastern and Southeast Asian countries.7 The disease is classified into four types, with each type assigned to the vessels involved: aortic arch, thoracoabdominal aorta and its branches, both aortic arch and thoracoabdominal aorta, and pulmonary arteries.8 The thoracoabdominal type is more common in the Indian subcontinent and Southeast Asia, as is middle aortic syndrome. The disease predominantly involves the media of the vessel and then progresses to cause fibrosis of intima and the adventitia. Most of the patients present during adulthood, very frequently during the third decade of life.
 FIGURE 109-11
 FIGURE 109-12
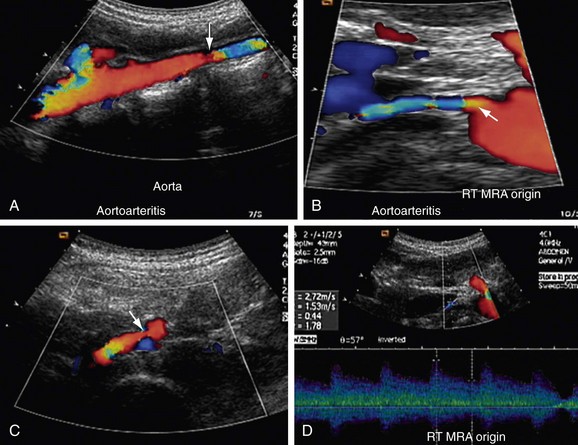
 FIGURE 109-13
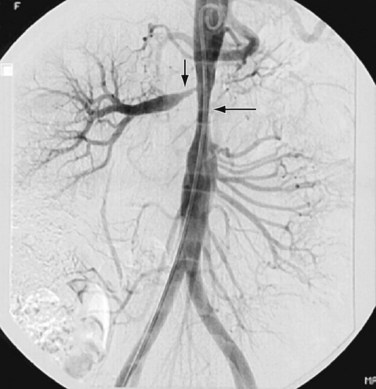
 FIGURE 109-14
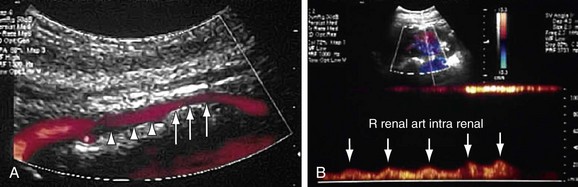
 FIGURE 109-15
Renal Artery Thrombosis
A renal artery can be occluded by atherosclerotic embolism, thromboembolism, thrombus in situ, aortic dissection, or vasculitis. Renal artery embolism is a common cause of renal insufficiency in older patients, especially those with atherosclerosis. Renal artery thromboembolism can occur in association with a variety of conditions, such as aortic aneurysm, myocardial infarction, bacterial endocarditic, aseptic vegetations, and even paradoxical emboli originating in the right heart caused by congenital heart diseases such as atrial septal defect (ASD; Fig. 109-16).
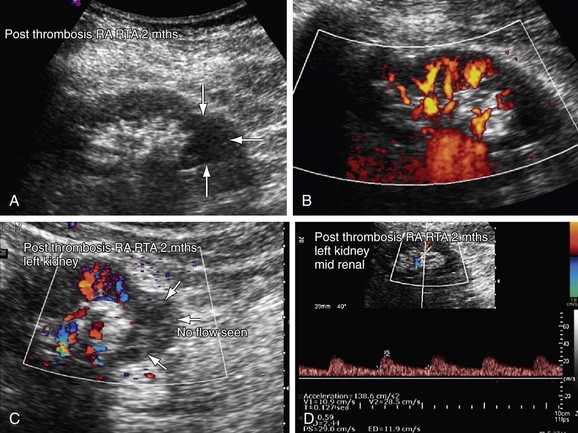
 FIGURE 109-16
Renal Vein Thrombosis
Renal vein occlusion can occur because of thrombus formation, intraluminal tumor, or external compression of the renal vein. The predisposing factors for renal vein thrombosis (RVT) are nephrotic syndrome, membranous glomerulonephritis, hypercoagulable states, abdominal surgery, dehydration, trauma, renal cell carcinoma and, rarely, hypereosinophilic syndrome (Figs. 109-17 and 109-18).9–13 Renal vein thrombosis is commonly seen in patients with nephrotic syndrome and can present as acute or chronic RVT. RVT occurs in up to 40% of patients of nephrotic syndrome caused by membranous glomerulopathy, membranoproliferative glomerulonephritis, and amyloidosis. RVT is frequently bilateral in cases of nephrotic syndrome.
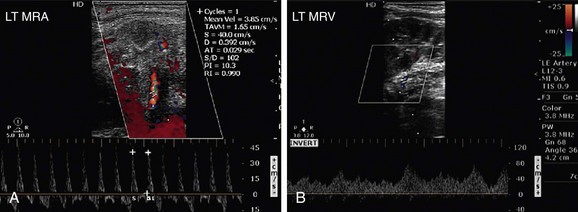
 FIGURE 109-17
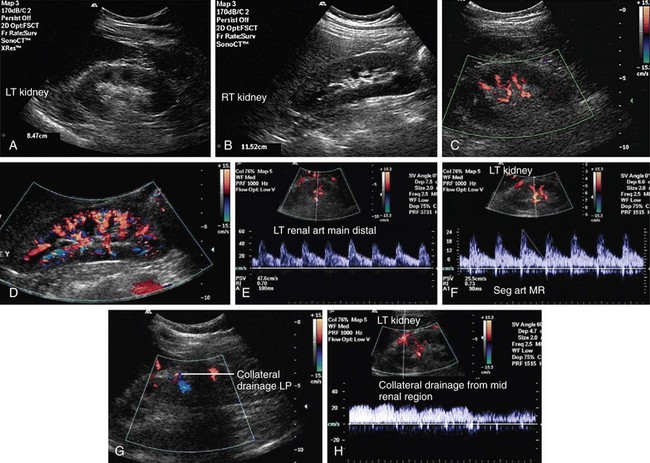
 FIGURE 109-18
Intraluminal extension of tumor into the renal vein can occur with renal malignancy, notably renal cell carcinoma, but also may be seen with renal lymphoma, transitional cell carcinoma, and adrenal tumors such as Wilms’ tumor.14,15 Extension of the thrombus from ovarian veins into the renal vein can also occur.16
Renal Transplant Assessment
Renal transplantation is becoming routine practice and evaluation presents a particular challenge. Ultrasound is an ideally suited modality for renal transplant assessment because of its relatively lower cost and excellent ability to assess the transplant noninvasively without the need for ionizing radiation or the use of iodinated contrast agents, with their inherent nephrotoxicity concerns. Further discussion of renal transplant imaging can be found in Chapter 112.
TECHNIQUE DESCRIPTION
Anatomic Considerations
Renal Arteries
Both renal arteries arise from the abdominal aorta approximately 1 to 1.5 cm below the origin of the superior mesenteric artery and at the level of the superior border of the L2 vertebra, with the origin of the left renal artery (LRA) slightly inferior to the right renal artery (RRA; Fig. 109-19). The RRA arises from the anterolateral aspect of the aorta at approximately the 10 o’clock position and the left main renal artery arises from the posterior or lateral aspect of the aorta at about the 4 o’clock position. The RRA courses anterolaterally in its proximal few centimeters, and then courses posterior to the inferior vena cava (IVC) and eventually follows a posterolateral course towards the right kidney (Figs. 109-20 and 109-21). Sonographically, it is identified as the largest vessel seen posterior to the inferior vena cava. The LRA runs a shorter course and passes between the superior mesenteric artery and the left adrenal vein (Fig. 109-22). Bannister and associates17 have reported accessory renal arteries in approximately 25% to 30% of individuals; however, most imaging studies have reported these in from 12% to 22% of patients (Fig. 109-23). The accessory renal arteries can arise from the aorta or iliac arteries. The rate of successful imaging of the accessory renal artery varies between 0% and 24%. In the presence of a normal main renal artery, a concerted attempt should be made to search for these vessels because stenosis of an accessory renal artery can similarly result in renovascular hypertension.18–20 The small caliber of the main renal artery is an indirect clue to the presence of the accessory renal artery.21
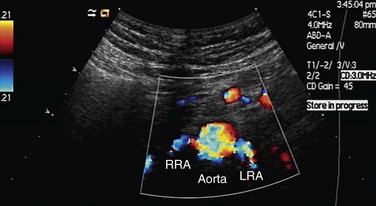
 FIGURE 109-19 Color Doppler image acquired by the midline transverse approach shows origin of both renal arteries from aorta.
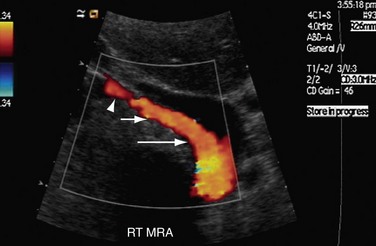
 FIGURE 109-20
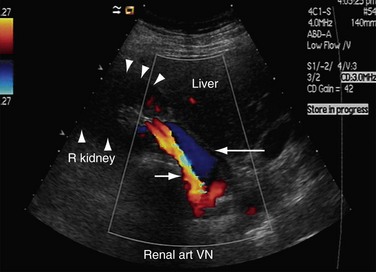
 FIGURE 109-21
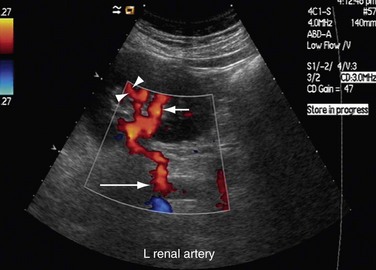
 FIGURE 109-22
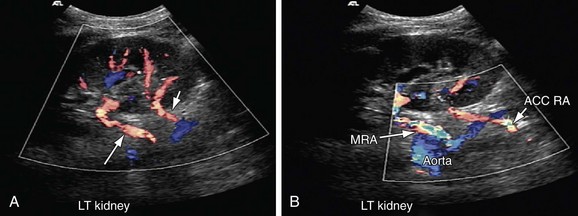
 FIGURE 109-23
Intrarenal Arteries: Segmental, Interlobar, and Arcuate Arteries
After entering the hilum, the main renal arteries split into anterior and posterior divisions. The arteries in these divisions give rise to segmental arteries, usually four, that supply each of the four vascular regions of the kidney—apical, anterior, posterior, and inferior. The segmental arteries give rise to lobar and interlobar arteries that travel between the medullary pyramids (Fig. 109-24). After traversing the corticomedullary junction, interlobar arteries give rise to arcuate arteries. Arcuate arteries give rise to the cortical and medullary branches, which supply the cortex and medulla, respectively. Most of the blood flow (90%) to the kidney goes to the cortex, with only 10% flowing into the medulla.
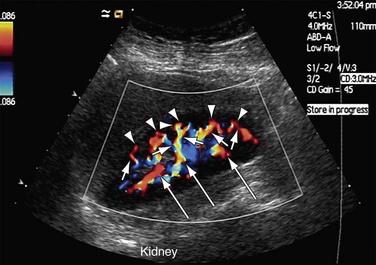
 FIGURE 109-24
Renal Veins
The right renal vein lies anterior to the right main renal artery and runs in a posterior to anterior direction to end in the IVC. On sonography, the left renal vein appears larger than the right in a supine position. The left adrenal vein, left gonadal vein, and lumbar veins are tributaries of the left renal vein (Fig. 109-25). The left renal vein runs a horizontal course and is placed anterior to the aorta and posterior to the superior mesenteric artery. The left renal vein ends at the IVC at the level of the L1 vertebra. The left renal vein can be retroaortic in 0.5% to 3.7% of patients, but has been reported to be as high as 25%.2,22
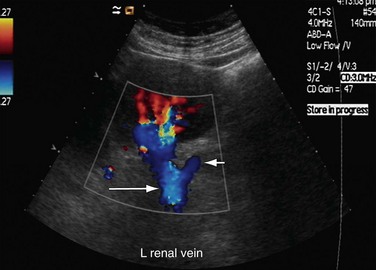
 FIGURE 109-25
Abdominal Aorta
Sonography of renal vessels is always preceded by sonography of the aorta.2,4,14 The presence of atherosclerotic plaque in the aorta increases the possibility of atherosclerotic ostial stenosis of the renal arteries. To see the presence of atherosclerotic plaque in the abdominal aorta, the aorta should be scanned in its entirety—that is, from the origin of the celiac artery to the bifurcation of the aorta into the common iliac arteries. The ostium of the superior mesenteric artery and the celiac artery should also be assessed. In addition to atherosclerotic plaque, the aorta is also evaluated for any aneurysm, stenosis, coarctation, or features of aortic arteritis (Figs. 109-26 and 109-27).7 Examination of the aorta should include evaluation in the sagittal, transverse, and coronal planes. If bowel gas interferes with the visualization of the aorta, the transducer can be placed in paramedian longitudinal planes, and medial sweeps of the transducer can then be made to facilitate visualization of the aorta.
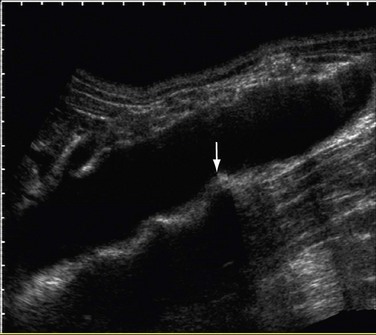
 FIGURE 109-26
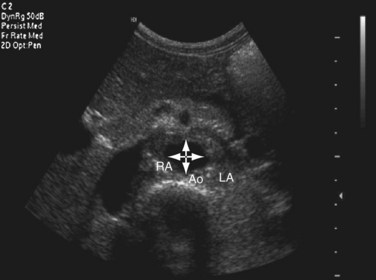
 FIGURE 109-27
Functional Ultrasound Assessment
After this initial overview, the second part of the examination should include color flow and spectral imaging of the aorta and renal vessels. For proper color flow assessment, the parameters of the machine have to be calibrated for every patient. To do this, an area of laminar flow in the aorta is identified and this window is used to adjust color gain, pulse repetition frequency, and wall filter (Fig. 109-28). The peak systolic velocity and end-diastolic velocity of the aorta are recorded just below the level of origin of the superior mesenteric artery by keeping a Doppler angle of insonation of less than 60° C.23 The peak systolic velocity of the aorta is used to calculate the renal artery aortic ratio (RAR; Fig. 109-29). After taking these measurements, the ostium of the renal arteries is identified just inferior and caudal to the origin of the superior mesenteric artery.
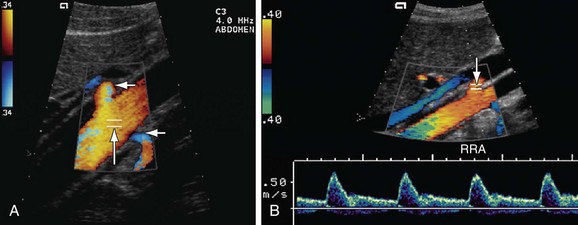
 FIGURE 109-28 The RAR is the ratio of the PSV of the aorta and renal artery. A, Color Doppler image of the aorta shows the sampling gate (long arrow) placed at an area of laminar flow in the aorta, which is usually at the level of origin of the renal arteries (short arrows). B, Color and pulse wave Doppler image shows the sampling gate (arrow) in the proximal segment of renal artery (also see Fig. 109-36).
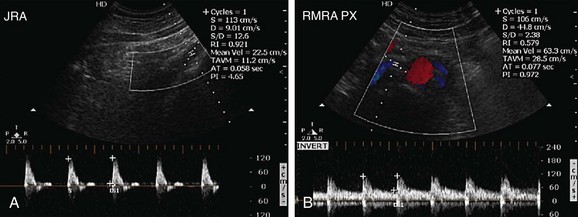
 FIGURE 109-29
Technical Considerations
Main Renal Arteries
As far as color Doppler and spectral wave imaging of the renal arteries is concerned, the ideal transducer position is one in which the direction of blood flow in the vessel is parallel to the ultrasound beam and the Doppler angle of insonation is almost 0 degrees. Practically, this is only possible in very thin and cooperative patients who can hold their breath reliably. A normal spectral waveform in the renal artery is that of low resistance with continuous forward diastolic flow (Fig. 109-30).
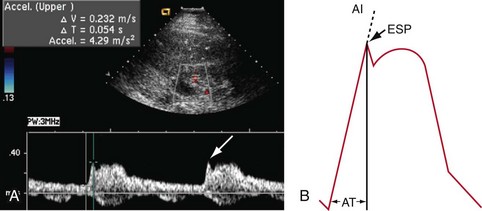
 FIGURE 109-30
Color Doppler and spectral waveform assessment of the proximal segment of the RRA is done by placing the transducer in a transverse plane, slightly to the right of midline and rotating it toward the left kidney (see Fig. 109-19). This results in a Doppler angle of nearly 0 degrees and blood flow is seen as red because its direction is toward the transducer. If the anterior transverse approach is not successful, the patient is rotated 45 degrees to the right anterior oblique position. A right subcostal approach is adapted by using the liver as an acoustic window to analyze the proximal part of the RRA. By following this approach, the color flow in the proximal segment of the RRA will again appear as red, but the Doppler angle of insonation will be increased (the aim should be to keep the angle as low as possible and never allow it to exceed 60 degrees).
The proximal and middle segments of the LRA are studied by using an anterior approach, with the transducer located slightly to the right side of midline. The transducer is placed in a transverse plane and rotated (4 or 5 o’clock) toward the left side so that the blood flow in the proximal and middle segments of the LRA is parallel to the beam of transducer. The flow of blood in the proximal and middle segments of the LRA will be seen as blue because it is moving away from the transducer (Fig. 109-31). Moreover, the angle of insonation will also be low. If this anterior approach is unsuccessful, a lateral approach through the liver is used. In this approach, the transducer is placed in a transverse plane and directed toward the left side to visualize the proximal two thirds of the LRA. If the proximal and middle segments of the LRA are not optimally visualized by these positions, these are studied by placing the patient in a right lateral decubitus position and approached laterally by using the left kidney as an acoustic window. Sometimes, pediatric patients are placed in the right lateral decubitus position; a longitudinal scan through the left kidney provides a good view for adequate visualization of both renal arteries. The distal segment of the RRA is studied by placing the patient in the left lateral decubitus position and using a lateral longitudinal and flank scanning approach. Similarly, the distal segment of the LRA is studied by placing the patient in the right lateral decubitus position and using a lateral longitudinal and flank scanning approach to perform Doppler imaging. In situations in which other approaches to assess the proximal and middle segments of renal arteries fail because of bowel gas, morbid obesity, or inability to hold the breath, the lateral approaches in decubitus positions are used to assess the proximal two thirds of both renal arteries.
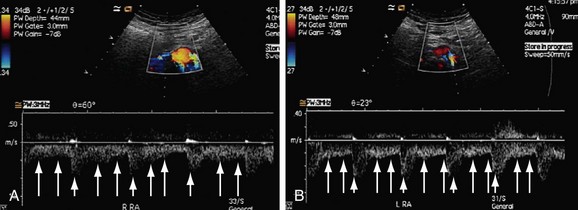
 FIGURE 109-31
An additional approach that yields a banana or banana peel view is also popular with renal sonographers (Fig. 109-32). The patient is placed in a left lateral decubitus position and the transducer is placed anterior to the anterior paraspinal muscles, with a longitudinal orientation of the scanning plane to identify the aorta. The transducer is adjusted slightly in an anterior or posterior direction so that both renal arteries are seen arising from the aorta and coming toward the transducer. The banana peel view is especially useful in older patients, in whom stenosis caused by atherosclerosis is expected in the ostium of the renal arteries. In case of failure of all approaches for optimum visualization of the renal arteries, the patient can be asked to lie prone and the examination can be attempted by using the kidneys as acoustic windows on both sides.
 FIGURE 109-32
Intrarenal Arteries
Sampling of the intrarenal arteries is done in the upper, middle, and lower poles of the kidney by color Doppler guidance. By taking a Doppler angle of insonation of 0 degree, using the lowest velocity scale and lowest wall filter setting, and adjusting the smallest Doppler gate width, a good spectral waveform is typically obtained (Fig. 109-33). Peak systolic and end-diastolic velocities are recorded for the intrarenal arteries. Spectral traces of the intrarenal arteries are used for calculation of acceleration time (AT) and acceleration index (AI; see Table 109-1). The software installed in almost all modern ultrasound machines automatically performs these calculations. Acceleration time is the time from the beginning of the systole upstroke to the systolic peak and AI is the gradient of this upstroke (see Fig. 109-30B).24–26
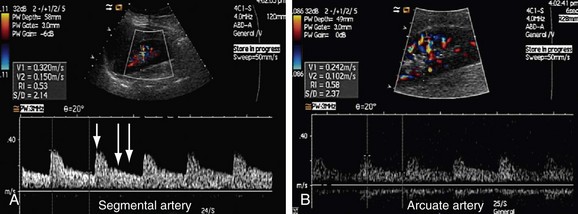
 FIGURE 109-33
Renal Morphology
No evaluation of renal vessels is complete without assessment of kidney size, shape, and echo texture. Longitudinal measurement of the kidney in the cephalocaudal plane should always be performed. In case of a normal-sized kidney, and a very small diameter main renal artery (less than 5 mm), there is every likelihood that an accessory, supernumerary, or polar renal artery supplies the kidney.21 This criterion for the presence of an accessory renal artery in a smaller sized main renal artery of a normal-sized kidney is useful in some patients with renovascular hypertension, but does not eliminate the necessity of performing magnetic resonance angiography (MRA) or catheter angiography before renal transplantation and surgical correction of the abdominal aorta. Therefore, to see any accessory renal arteries, longitudinal and transverse sweeps of the transducer are done in the decubitus position. Several helpful suggestions from Li and coworkers27 are that the sample line should be parallel to the direction of the jet stream of the vessel, the sample gate should be placed at the most stenotic site, and repeated samples around the turbulent signals should be taken.
PITFALLS AND SOLUTIONS
Complete evaluation of main renal arteries may not be possible because of obesity, interference of bowel gas, respiratory motion or the inability to suspend respiration, transmitted aortic pulsation, and difficulty in measuring the Doppler angle. In addition, other pitfalls include the inherent difficulties of imaging small vessels, the posterior location of mid and distal arteries, and failure to make a good acoustic window. There is a 10% to 20% failure rate for complete examination of both renal arteries from their ostium to the hilum of the kidneys.28 Other pitfalls of sonography include shadowing from plaque, interobserver variation, and the presence of accessory arteries. Technical factors that may limit renal evaluation include pulse repetition frequency and wall filter frequency, actual flow velocity and Doppler angle of insonation, and choice of transducers used. Tortuosity and kinking of the renal artery and a Doppler angle of more than 60 degrees can result in a false-positive RAS.
The following can help overcome above-mentioned pitfalls:
The renal resistive index (RI) is not specific and depends on many variables, such as the site of measurement and intra-abdominal pressure, pulse rate, age of the patient, the sonographer’s skill, presence of other renal diseases such as diabetes, hypertensive nephrosclerosis, acute renal failure, and urinary obstruction with hydronephrosis.31 An increased pulse rate (more than 70 beats/min) lowers the RI, whereas a pulse rate less than 50 beats/min increases the RI.
The compliance index, which measures pulsating renal blood flow distribution using power Doppler, is technically simple and independent of many variables for RI. The compliance index considers multiple interlobular arteries, rather than a single large artery.32
A difference of mean RIs between both kidneys of more than 5% can be used as a criterion for diagnosing RAS of more than 50%.33 A difference of mean RIs of both kidneys has been used by a few researchers in cases of unilateral RAS, but this cannot be used in cases of bilateral stenosis, renal artery disease, single kidney, or renal allograft.
There is considerable interobserver variation in the measurement of AT. Some observers measure it as time from the beginning of the systole to the first peak, others measure it up to the first inflection point, and some measure it to the second or maximum peak.26
There have been a large number of false-negative and false-positive cases of RAS on sonography. The false-negative cases can result from a variety of causes, such as multifocal or diffuse but severe RAS, segmental RAS, small atrophic kidneys, accessory renal artery stenosis, or distal renal artery stenosis. False-positive RAS cases also occur in patients with aortic stenosis or with conditions leading to increased cardiac output, such as hyperthyroidism.27
Renal artery angiography still remains the gold standard for the evaluation of renal arteries. MRA of the renal arteries offers a good alternative for patients, in addition to multidetector computed tomography (MDCT) angiography of renal vessels. MRA is a useful noninvasive method for assessing renal arteries that has the advantage of three-dimensional views. The limitations of MRA are its relatively higher cost and suboptimal ability to evaluate most patients who have undergone renal stenting, typically using stents made of Nitinol or platinum.23 Contrast-enhanced MR imaging (MRI), however, is useful for the diagnosis of infarctions, ranging from small ones caused by vasculitis to segmental or global infarctions caused by renal artery occlusion. Sometimes, in cases of arteriovenous (AV) fistulas or pseudoaneurysms, the perifistular vibration may limit the assessment on ultrasound; MRI may be helpful in these cases.
Sonography may not be able to diagnose renal vein thrombosis in some native kidneys that develop rich collaterals that lead to a normal venous flow within the kidney. A wrong diagnosis of RVT can be made if there is a very sluggish flow for any reason. MRA can be used as an alternative. MRI for significant RAS has a sensitivity of 88% to 100% and specificity of 71% to 99%.34
IMAGE INTERPRETATION
Diagnosis of Renal Artery Stenosis
Renal artery stenosis is considered significant when the internal diameter of the renal artery is reduced more than 60%, although some use the more conservative threshold of 50%.34 The location of RAS is often ostial, but it may occur in any segment of the main renal artery (proximal, middle, or distal), in an accessory renal artery, or in segmental arteries. The diagnosis of RAS can be made on sonography by two criteria (Box 109-2), direct and indirect.
BOX 109-2
Criteria for Hemodynamically Significant Renal Artery Stenosis in Native Vessels (>60% Stenosis)
Direct Criteria
Direct criteria for the diagnosis of RAS include an intrastenotic increased velocity of blood flow, poststenotic turbulence, color aliasing phenomenon, increased peak systolic velocity (PSV), increased ratio of PSV of the renal artery to the PSV of the aorta (renal-aortic ratio, or RAR), increased ratio of the PSV in the renal artery to the PSV in the interlobar arteries (renal artery interlobar artery ratio or RIR) in addition to the gray-scale findings (Figs. 109-34 to 109-36). A PSV more than 180 to 200 cm/sec and RAR more than 3.5 are diagnostic of RAS. An RI more than 0.7 predicts a poor outcome after revascularization.
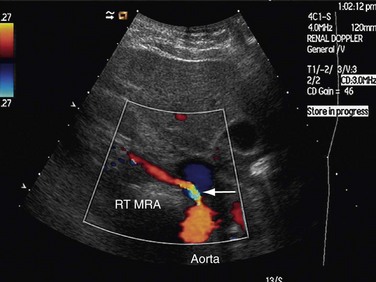
 FIGURE 109-34
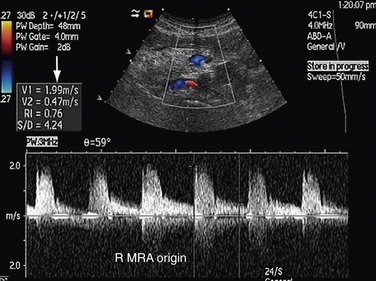
 FIGURE 109-35
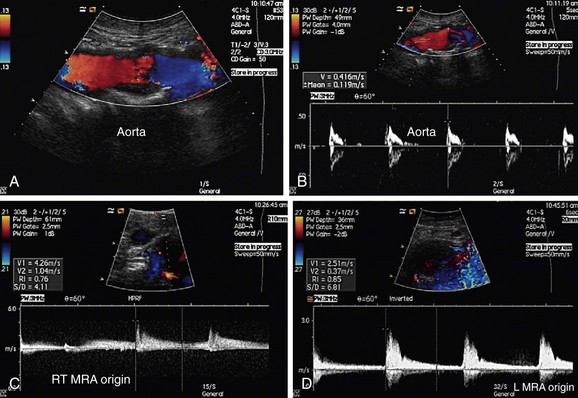
 FIGURE 109-36
Indirect Criteria
Indirect criteria for the diagnosis of RAS are acceleration index (AI) less than 300 cm/sec, AT more than 0.07 second, resistive index (RI), pulsatility index (PI), demonstration of a pulsus parvus tardus waveform in intrarenal vessels, and spectral broadening (Figs. 109-37 and 109-38).
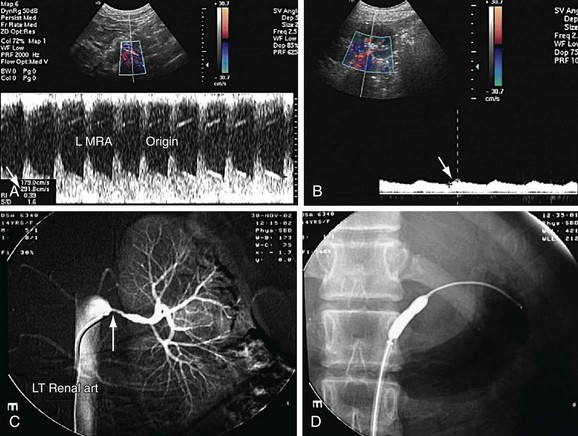
 FIGURE 109-37
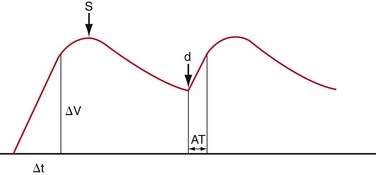
 FIGURE 109-38
Diagnostic Accuracy of Sonographic Criteria
A meta-analysis by Williams and colleagues35 has evaluated the test performance of Duplex sonographic parameters for screening for hemodynamically significant RAS. In their comprehensive review of the literature, they identified 88 studies involving a total of slightly more than 8,000 patients who had renal sonographic evaluation to determine PSV, AT, AI and renal-aortic radio (RAR) for the diagnosis of RAS. PSV was found to be the single measurement with the highest performance characteristics and with sensitivity of 85%, specificity of 92%, and diagnostic odds ratio of 60.9%. The RAR was noted to provide a sensitivity of 78%, specificity of 89%, and odds ratio of 29.3% for RAS diagnosis. The AT was found to have a sensitivity of 78%, specificity of 89%, and diagnostic odds ratio of 29.3%; the AI was found to have a sensitivity of 78%, specificity of 89%, and diagnostic odds ratio of 29.3%. Interestingly, the combination of PSV with other measurements did not increase accuracy.
Other Diagnostic Findings
Postangioplasty Renal Artery Assessment
Patients who undergo renal angioplasty consequent to a diagnosis of RAS still have a 15% restenosis rate (Figs. 109-39 to 109-44). The follow-up for evaluation of patency of renal artery is therefore important. Intimal hyperplasia is a common cause for in-stent restenosis and can be detected by enhanced PSV within a stent. Whenever there is enhanced PSV and deteriorating renal function, repeat renal angiography should be performed to assess for restenosis.
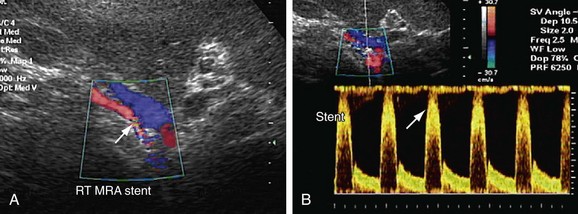
 FIGURE 109-39
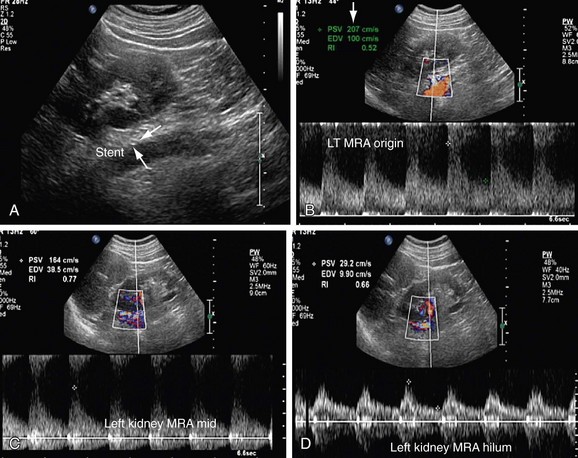
 FIGURE 109-40
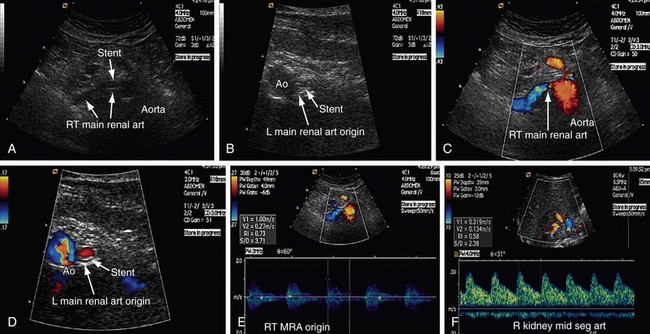
 FIGURE 109-41
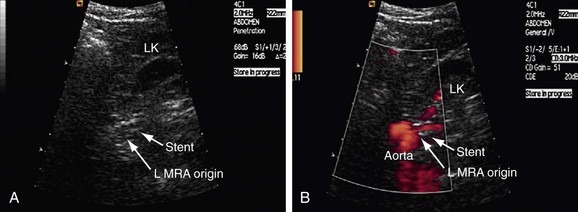
 FIGURE 109-42
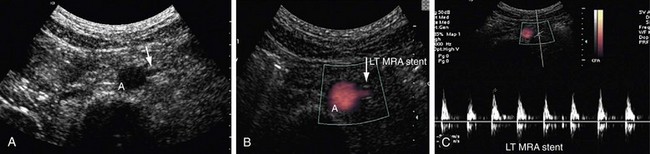
 FIGURE 109-43
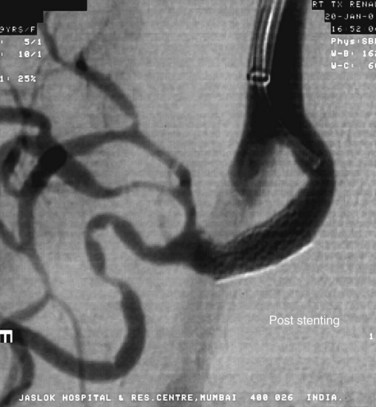
 FIGURE 109-44
Diagnosis of Renal Artery Aneurysm
A renal artery aneurysm can involve the main renal artery or a branch of the renal artery. On gray-scale sonography, a hypoechoic mass is seen, showing a color flow signal on Doppler imaging. In cases of calcified aneurysms, the calcification is easily identified by gray-scale sonography. Calcified aneurysms can be thrombosed or patent, and therefore a Doppler sonography appearance would be seen accordingly.14
Diagnosis of Renal Vein Thrombosis
Renal vein occlusion caused by any pathology mostly leads to an initial increase in the size of the kidney. Gray-scale sonographic appearance of the kidney in renal vein occlusion is variable and nonspecific. The usual appearance is a hypoechoic cortex, with loss of corticomedullary differentiation.14 On gray-scale sonography, the renal vein thrombus in the native kidney is typically echogenic—a thrombus full of solid echogenicity or with strip echogenicity. A partial or complete filling defect within the lumen of the main renal vein may be seen. Color Doppler imaging typically shows a mute renal vein, with absent or few intrarenal venous flow signals, with the renal vein associated with increased renal arterial resistance. Sometimes, a small trickle of flow around the clot may be seen. Reverse diastolic flow in the intrarenal arteries is seen in RVT patients, but this feature has a low sensitivity for the diagnosis. In acute RVT, the clot may appear as hypoechoic or anechoic and hence is sometimes missed on gray-scale imaging; however, color Doppler imaging will usually help visualize the RVT.
Color Doppler imaging and spectral imaging help in the diagnosis of RVT. The initial stage of RVT shows a lack of flow and pulsatility in the intrarenal and main renal veins, with an increased RI and renal arterial diastolic flow. Retraction of the thrombus and formation of collaterals around the hilum and capsule may occur in the first few days, leading to the detection of some flow on color Doppler imaging of the renal vein. These events also lead to poor sensitivity and poor specificity of RI in these patients. The detected flow should therefore be analyzed for any pulsatility, because reduced or absent pulsatility points to obstruction of flow.16
Renal vein thrombosis is frequently associated with a few malignancies, such as renal cell carcinoma (Fig. 109-45). In patients with renal cell carcinoma, tumor extension into the renal veins (21% to 35%) and into the IVC (4% to 10%) is a common feature.15 In particular, tumor extending into the right renal vein is three times more likely to extend into the IVC as compared with the left renal vein. The operative treatment approach of renal cell carcinoma with or without venous extension does not change if it extends only up to the right renal vein or lateral segment of left renal vein. However, if a tumor extends into the IVC or involves the medial segment of the left renal vein, the operative procedure is more extensive, requiring modification; thus, the exact extent of the venous extension of a tumor on imaging is essential for preoperative planning. On gray-scale sonography the tumor venous extension is seen as an intraluminal lesion, with homogeneous low or medium echogenicity within the distended renal vein. On occasion, renal vein thrombosis can be differentiated from the extension of tumor into the renal vein by the demonstration of color flow in small blood vessels within the tumor, which would be absent in bland thrombus.
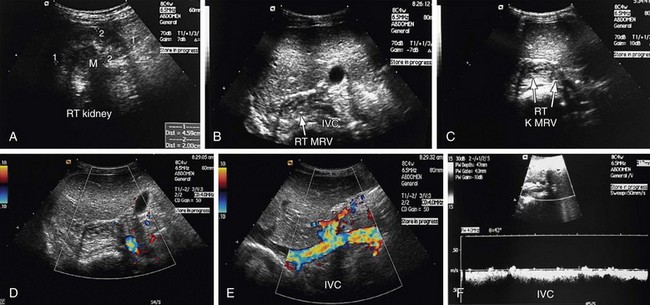
 FIGURE 109-45
Vascular Evaluation of Renal Transplants
Allograft renal vessels can be easily visualized sonographically because of their superficial location as compared with native renal vessels. Gray-scale sonographic assessment of an allograft kidney is important before the sonography of renal vessels is carried out. Renal size is assessed in the orthogonal planes and renal volume is calculated. Renal volume serves as a reference tool for all future sonographic examination of allograft and allograft vessels. Doppler and spectral imaging of the allograft renal vessels and ipsilateral external iliac artery are done to view the patency of renal vessels and the anastomotic site and to view any focal area of color aliasing. Doppler and spectral sonography of the main renal vein and intrarenal vessels (interlobar arteries) are also carried out. The parameters to be measured are PSV, AT, RI, pulsatility index, and ratio of PSV of the iliac artery and main renal artery (Boxes 109-3 and 109-4). The normal flow in an allograft renal artery is low-resistance flow. The RI is increased in allograft rejection because of edema, and serial measurements are required to monitor the allograft. Sometimes, there can be a normal RI in allograft rejection. Other features of graft rejection include a high-resistance waveform, with minimal or absent diastolic flow, narrow systolic peak, with the second peak higher than the first, and flow reversal in early diastole. The pulsatility index (PI) and RI above 1.8 and 0.7, respectively, are abnormal.14
Power Doppler imaging shows alterations of small vessels in the cortex in the early stages of rejection and therefore is more sensitive. The flow can be patchy or completely absent in the cortex (Figs. 109-46 and 109-47). The absence of these signs on power Doppler imaging does not rule out acute graft rejection. Chronic rejections take months to occur and result in a smaller kidney, with reduced visualization of intrarenal vessels.
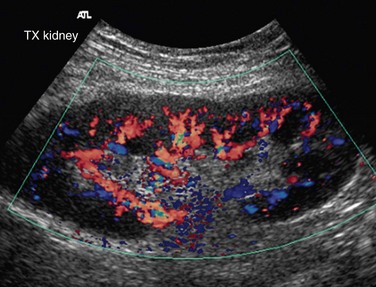
 FIGURE 109-46
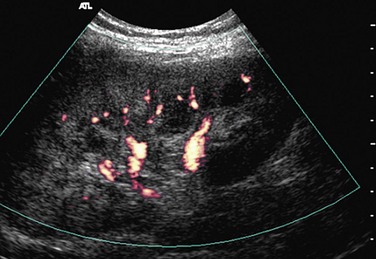
 FIGURE 109-47
RAS is the most common vascular complication of allografts and accounts for 75% of all of these (Fig. 109-48). It affects 1% to 10% of all allografts. Stenosis of an allograft renal artery usually occurs during the first year of renal transplantation, although cases can present for the first time even 3 years after transplantation. Stenosis is usually seen at the site of anastomosis, although stenosis proximal or distal to anastomosis can also occur. Proximal stenosis is exclusively caused by atherosclerotic disease of the donor vessel, whereas stenosis of the anastomosis site is caused by a perfusion injury or suture-related issues, such as a reaction to suture material or a faulty suture technique. Stenosis distal to the anastomosis is primarily caused by rejection, although mechanical factors such as compression, renal artery kink, or turbulent flow can also cause stenosis. Kinks of the renal transplant artery with normal intra-arterial pressures do not progress to threaten graft function, even up to 5 years after transplantation. End to end anastomoses have three times more risk of stenosis than end to side anastomoses.
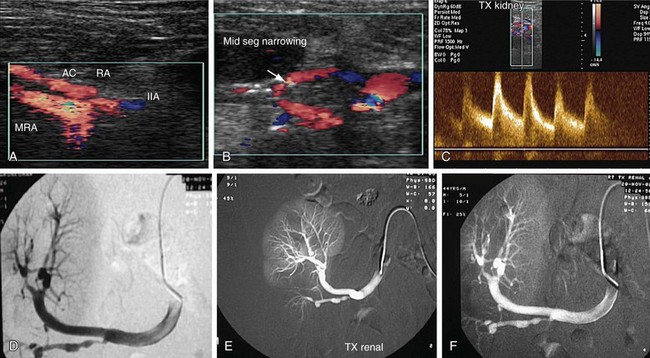
 FIGURE 109-48
Renal artery thrombosis in renal allografts is associated with hyperacute transplant rejection, anastomotic occlusion, arterial kinking, and arterial intimal tear. If extensive, renal artery occlusion can occur, resulting in segmental or global infarction of the kidney (Fig. 109-49). On gray-scale sonography, segmental infarction appears as a focal or diffuse hypoechoic area with either well-defined echogenicity or with margins. Color Doppler imaging reveals wedge-shaped areas with no flow signals. Global infarction of the entire kidney results in an enlarged, swollen, hypoechoic kidney, with no arterial or venous blood flow. Acute pyelonephritis and rupture of the allograft can also mimic these findings on ultrasound imaging.
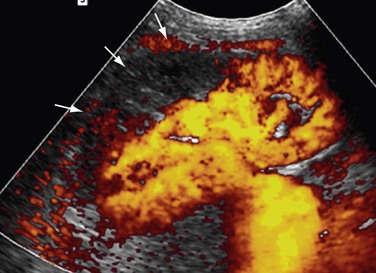
 FIGURE 109-49
Other vascular complications of renal transplants, such as AV fistulas and pseudoaneurysms, are seen consequent to percutaneous graft biopsies. AV fistulas have turbulent flow in the small artery coupled with color aliasing in the involved vein (Fig. 109-50). There is a high-velocity, low-resistance waveform in the involved artery, with arterialization of the draining vein. Areas of disorganized color outside the walls of the vessels are seen in AV fistulas because of the phenomenon of perifistular vibration. Pseudoaneurysms appear as cystic structures on gray-scale imaging and exhibit high flow within their confines on color Doppler imaging.
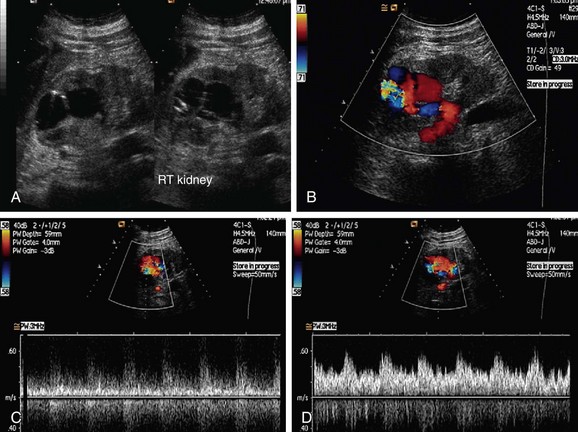
 FIGURE 109-50
RVT can occur in the first week after transplantation, although it is seen in fewer than 5% of cases. RVT can have multiple causes, such as hypovolemia, clot progression from the iliac vein, faulty surgical technique, or external compression by collections (Fig. 109-51). The increased prevalence of RVT on the left side is because of compression of the left common iliac vein between the sacrum and left common iliac artery. This phenomenon is called silent iliac artery compression. On gray-scale imaging, an echogenic thrombus is seen inside a dilated renal vein in cases of complete RVT. Allograft vessels are not able to develop collateral venous drainage, so Doppler sonography shows reversed diastolic flow in the renal artery along with no flow in the renal vein. This type of reversed flow in the renal artery is also seen in acute pyelonephritis, but venous flow is normal. In cases of partial RVT, there is reduced venous flow along with a nonspecific increase in arterial resistance.
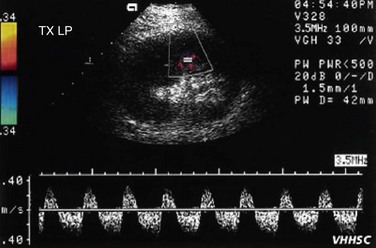
 FIGURE 109-51 Color Doppler and spectral waveform images of a patient with renal vein occlusion of the allograft kidney.


Akbar SA, Jafri ZH, Amendola MA, et al. Complications of renal transplantation. Radiographics. 2005;25:1335-1356.
Bradley DL, James EM, Charboneau JW, et al. Current applications of color Doppler imaging in the abdomen and extremities. Radiographics. 1989;9:599-631.
Helenom O, Rody FE, Correas JM, et al. Color Doppler US of renovascular disease in native kidneys. Radiographics. 1995;15:833-854.
Helenon O, Correas JM, Chabriais, et al. Renal vascular Doppler imaging: clinical benefits of power mode. Radiographics. 1998;18:1441-1454.
Langer JE, Jones LP. Sonographic evaluation of the renal transplant. Ultrasound Clin. 2007;2:73-88.
Lee HY, Grant ED. Sonography in renovascular hypertension. J Ultrasound Med. 2002;21:431-441.
Moukaddam H, Pollak J, Scoutt LM. Imaging of renal artery. Ultrasound Clin. 2007;2:455-475.
Singh AK, Sahani DV. Imaging of the renal donor and transplant recipient. Radiol Clin North Am. 2008;46:79-93.
Soulez G, Oliva EL, Turpin S, et al. Imaging of renovascular hypertension: respective values of renal scintigraphy, renal Doppler US, and MR angiography. Radiographics. 2000;20:1355-1368.
Staub D, Canevascini R, Huegli RW, et al. Best Duplex-sonographic criteria for the assessment of renal artery stenosis—correlation with intra-arterial pressure gradient. Ultraschall Med. 2007;85:45-51.
Zubarav AV. Evaluation of renal vessels. Eur Radiol. 2001;11:1902-1915.
1 de Hann MW, Kroon AA, Flobbe K, et al. Renovascular disease in patients with hypertension: detection with duplex ultrasound. J Hum Hypertension. 2002;16:501-507.
2 Herman MG, Gardin JM, Jaff M, et al. Guidelines for the noninvasive vascular laboratory testing: a report from the American Society of Echocardiography and the Society for Vascular Medicine and Biology. Vasc Med. 2006;11:183-200.
3 Tublin ME, Bude RO, Platt JE. The resistive index in renal Doppler sonography. AJR Am J Roentgenol. 2003;180:885-892.
4 Soares GM, Murphy TP, Singha MS, et al. Renal artery duplex ultrasonography as a screening and surveillance tool to detect renal artery stenosis. J Ultrasound Med. 2006;25:293-298.
5 Cardosa CM, Xavier SS, Lopez GE, Brunini TMC. Direct Duplex scanning parameters in the diagnosis of renal artery stenosis: a study to validate and optimize cut-off points. Arq Brasiel Cardiol. 2005;87:286-293.
6 Gowda M, Loeb AL, Crouse LJ, Kramer PH. Complementary roles of color flow Duplex imaging and intravascular ultrasound in the diagnosis of renal artery fibromuscular dysplasia: should renal arteriography serve as the “gold standard”? J Am Coll Cardiol. 2003;41:1305-1311.
7 Rao SA, Mandalan KR, Rao VR. Takayasu’s arteritis: initial and long-term follow-up in 16 patients after percutaneous transluminal angioplasty of the descending thoracic and abdominal aorta. Radiology. 1993;189:173-179.
8 Lupi-Herrera E, Sanchez TG, Marcushamer J, et al. Takayasu’s arteritis: clinical study of 107 patients. Am Heart J. 1977;93:94-103.
9 Kliewer MA, Tupler RH, Hertzberg BS, et al. Doppler evaluation of renal artery stenosis: interobserver agreement in the interpretation of waveform morphology. AJR Am J Roentgenol. 1994;162:1371-1376.
10 Zucchelli PC. Hypertension and atherosclerotic renal artery stenosis: diagnostic approach. J Am Soc Nephrol. 2002;13:S184-S186.
11 Garcia-Criado A, Gilabert R, Nicolau C. Value of Doppler sonography for predicting clinical oucome after renal artery revascularization in atherosclerotic renal artery stenosis. J Ultrasound Med. 2005;24:141-1647.
12 Platt JF, Rubin JM, Ellis JH. Diabetic nephropathy: evaluation with renal duplex Doppler US. Radiology. 1994;190:343-346.
13 Platt JF, Rubin JM, Ellis JH. Lupus nephritis: predictive value of conventional and Doppler US and comparison with serologic and biopsy parameters. Radiology. 1997;203:82-86.
14 Zwiebel WJ, Pellerito J. Ultrasound assessment of native renal vessels and renal allografts. In: Zwiebel WJ, Pellerito J, editors. Introduction to Vascular Ultrasonography. 5th ed. Philadelphia: Elsevier Saunders; 2005:611-636.
15 Habboub HK, Abu Yousef MM, William RD, et al. Accuracy of color Doppler sonography in assessing venous thrombus extension in renal cell carcinoma. Am J Roentgenol. 1997;168:267-271.
16 Hibbert J, Howlett DC, Greenwood KL, et al. The ultrasound appearances of neonatal renal vein thrombosis. Br J Radiol. 1997;70:1191-1194.
17 Bannister LH, Berry MM, Williams PL, editors. Gray’s Anatomy, 37th ed, 1989. Churchill Livingstone. London. 1407-1409.
18 Berland L, Koslin B, Routh W, Keller F. Renal artery stenosis: prospective evaluation of diagnosis with color duplex US compared with angiography. Radiology. 1990;174:421-423.
19 Desberg A, Pauster D, Lammert G, et al. Renal artery stenosis: evaluation with color Doppler flow imaging. Radiology. 1990;177:749-753.
20 Haplen EJ, Nazarian LN, Wechsler RJ, et al. US, CT and MR evaluation of accessory renal arteries and proximal arterial branches. Acta Radiol. 1999;6:299-304.
21 Aytac SK, Yigit H, Sancak T, Ozcan H. Correlation between diameter of the main renal artery and the presence of an accessory renal artery. J Ultrasound Med. 2003;22:433-439.
22 Yagci B, Tavasli B, Karabulut N, Kiroglu Y. Clinical significance and renal hemodynamics of incidentally detected retroaortic left renal vein: assessment with venous Doppler sonography. Br J Radiol. 2008;81:187-191.
23 Soares GM, Murphy TM, Singha MS, et al. Renal artery duplex ultrasonography as a screnning and surveillance tool to detect renal artery stenosis. J Ultrasound Med. 2006;25:293-298.
24 House MK, Dowling RJ, King P, Gibson RN. Using Doppler sonography to reveal renal artery stenosis. AJR Am J Roentgenol. 1999;173:761-765.
25 Li JC, Yuan Y, Qin W, et al. Evaluation of the tardus-parvus pattern in patients with atherosclerotic and nonatherosclerotic renal artery stenosis. J Ultrasound Med. 2007;26:419-426.
26 Gottlieb RH, Snitzer EL, Hartley DF, et al. Interobserver and intraobserver variation in determining intrarenal parameters by Doppler sonography. AJR Am J Roentgenol. 1997;168:627-631.
27 Li JC, Wang L, Jiang YX, et al. Evaluation of renal artery stenosis with velocity parameters of Doppler sonography. J Ultrasound Med. 2006;25:735-742.
28 Turi ZG, Jaff MR. Renal artery stenosis: searching for the algorithms for the diagnosis and treatment. J Am Coll Cardiol. 2003;41:1312-1315.
29 Claudon M, Plauin PE, Baxter GM, et al. Renal arteries in patients at risk of renal arterial stenosis: multicenter evaluation of the echo-enhancer SH U508A at color and spectral Doppler US. Radiology. 2000;214:739-746.
30 Manganaro A, Ando G, Salvo A, et al. A comparision of power Doppler with conventional sonographic imaging for the evaluation of renal artery stenosis. Cardiovasc Ultrasound. 2004;2:1.
31 Radermacher J, Mengel M, Ellis S, et al. The renal arterial resistive index and renal allograft survival. N Engl J Med. 2003;349:115-124.
32 Nago M, Murase K, Saeki H, et al. Pulsating renal blood flow distribution measured using power Doppler ultrasound: correlation with hypertension. Hypertens Res. 2002;25:697-702.
33 Schwerk WB, Restrepo IK, Stellwaag M, et al. Renal artery stenosis: grading with image-directed Doppler US evaluation renal resistive index. Radiology. 1994;190:785-790.
34 Grenier N, Haugher O, Cimpean A, Perot V. Update of renal imaging. Semin Nucl Med. 2006;36:3-15.
35 Williams GJ, Macaskill P, Chan SF, et al. Comparative accuracy of renal duplex sonographic parameters in the diagnosis of renal artery stenosis: paired and unpaired analysis. AJR Am J Roentgenol. 2007;188:798-811.
[/level-membership-for-cardiovascular-category][not-level-membership-for-cardiovascular-category]
CHAPTER 109 Sonography of the Renal Vessels
TECHNICAL REQUIREMENTS
Successful sonography of renal vessels requires the use of gray-scale sonography, tissue harmonics, color flow imaging, power Doppler, and spectral Doppler wave analysis. Additionally, ultrasound contrast agents can aid in the sonographic evaluation of renal vessels. In adult patients, a transducer frequency range between 3.5 and 5 MHz is required, whereas in pediatric patients a higher transducer frequency range can be used.1,2 Transducers with higher frequencies, of 6 to 8 MHz or more, are used to evaluate renal allografts because of their superficial location as compared with native kidneys. The highest transducer frequency that will provide the best resolution should be selected, depending on the depth of penetration required.3
Patients should fast or be on a clear liquid diet starting at midnight the day before the examination.2 Patients should also be encouraged to drink at least two 8-oz glasses of water the previous night and the morning of the examination.4 An oral dose of simethicone, an antigas medication, may be helpful in reducing bowel gas.
TECHNIQUES
Renal vascular ultrasound is indicated for a broad range of renal arterial and venous indications (Box 109-1). Clinically, renal arterial indications are more common, notably for the evaluation of possible renal artery stenosis. Select indications are detailed later. There are no known contraindications for the sonography of renal vessels.
BOX 109-1
Indications for Renal Vascular Ultrasound
Renal Artery Stenosis
The detection of renal artery stenosis in hypertensive patients (i.e., evaluation for renal vascular hypertension) represents the overwhelming indication in most practices. Renal artery stenosis (RAS) is estimated to be responsible for less than 5% of cases of hypertension. However, because it is one of the few treatable causes of hypertension, second only to the secondary hypertension caused by the use of oral contraceptives in women,5 it remains a common indication for renal artery imaging. About one quarter to one third of all patients with RAS eventually develop ischemic nephropathy. Renovascular hypertension is also responsible for the development of end-stage renal disease in 20% of patients. RAS is also seen in approximately 7% of all patients who have cardiovascular diseases (e.g., atherosclerosis, myocardial infarction, congestive heart failure). Its association with stroke has also been reported. Atherosclerosis is the most common cause of RAS, with fibromuscular dysplasia representing a distant second, but other entities such as Takayasu arteritis can also result in renal artery stenosis.
Atherosclerotic Renal Artery Stenosis
Atherosclerotic RAS is mostly progressive, because 20% to 50% of patients with 50% stenosis of renal arteries show progression of the disease within a few years, and 12% to 20% of those having greater than 75% RAS end up with complete occlusion within a year (Figs. 109-1 to 109-9). If RAS patients are left untreated, then in addition to worsening renovascular hypertension, 5% to 16% of these patients will progress to complete occlusion of the renal artery. Even in cases of unilateral RAS, damage to the other kidney in the form of nephrosclerosis caused by increased systemic blood pressure will occur if RAS is left untreated.
FIGURE 109-9 Renal angiogram shows stenosis (arrow) in the proximal segment of left renal artery.
(Courtesy of Dr. Gurpreet Singh Gulati, New Delhi, India.)
Fibromuscular Dysplasia
Fibromuscular dysplasia (FMD) results in RAS involving mainly the mid or distal part, and sometimes the intrarenal branches, of the renal artery (Fig. 109-10). FMD is almost eight times more commonly seen in females than males and usually occurs in younger individuals. FMD represents a collection of vascular diseases that affect the intima, media, and adventitia. It generally accounts for less than 10% of cases of RAS. FMD can be classified according to the layer of the arterial wall involved. Clinically, FMD involves the renal artery in three forms, with most (up to 90% of patients) having medial fibroplasia, which typically affects patients younger than 35 years. About one third of patients with medial fibroplasia show progression of the disease, but complications such as dissection and thrombosis are rarely seen.
The classic appearance of FMD, which is seen in 85% of patients, is known as the string of beads appearance, as seen angiographically. An endovascular ultrasound study of FMD by Gowda and colleagues6 has challenged the status of renal angiography as the gold standard for RAS in FMD patients. Other findings of FMD, such as a fibrous diaphragm, may not be seen sonographically; however, focal narrowing of the main artery caused by medial or adventitial hyperplasia might be seen.
Takayasu Arteritis
Takayasu arteritis, or nonspecific arteritis, is associated with stenosis (and occlusion) of the aorta and renal arteries (Figs. 109-11 to 109-15). This disease is more prevalent in Far Eastern and Southeast Asian countries.7 The disease is classified into four types, with each type assigned to the vessels involved: aortic arch, thoracoabdominal aorta and its branches, both aortic arch and thoracoabdominal aorta, and pulmonary arteries.8 The thoracoabdominal type is more common in the Indian subcontinent and Southeast Asia, as is middle aortic syndrome. The disease predominantly involves the media of the vessel and then progresses to cause fibrosis of intima and the adventitia. Most of the patients present during adulthood, very frequently during the third decade of life.
Renal Artery Thrombosis
A renal artery can be occluded by atherosclerotic embolism, thromboembolism, thrombus in situ, aortic dissection, or vasculitis. Renal artery embolism is a common cause of renal insufficiency in older patients, especially those with atherosclerosis. Renal artery thromboembolism can occur in association with a variety of conditions, such as aortic aneurysm, myocardial infarction, bacterial endocarditic, aseptic vegetations, and even paradoxical emboli originating in the right heart caused by congenital heart diseases such as atrial septal defect (ASD; Fig. 109-16).
Renal Vein Thrombosis
Renal vein occlusion can occur because of thrombus formation, intraluminal tumor, or external compression of the renal vein. The predisposing factors for renal vein thrombosis (RVT) are nephrotic syndrome, membranous glomerulonephritis, hypercoagulable states, abdominal surgery, dehydration, trauma, renal cell carcinoma and, rarely, hypereosinophilic syndrome (Figs. 109-17 and 109-18).9–13 Renal vein thrombosis is commonly seen in patients with nephrotic syndrome and can present as acute or chronic RVT. RVT occurs in up to 40% of patients of nephrotic syndrome caused by membranous glomerulopathy, membranoproliferative glomerulonephritis, and amyloidosis. RVT is frequently bilateral in cases of nephrotic syndrome.
Intraluminal extension of tumor into the renal vein can occur with renal malignancy, notably renal cell carcinoma, but also may be seen with renal lymphoma, transitional cell carcinoma, and adrenal tumors such as Wilms’ tumor.14,15 Extension of the thrombus from ovarian veins into the renal vein can also occur.16
Renal Transplant Assessment
Renal transplantation is becoming routine practice and evaluation presents a particular challenge. Ultrasound is an ideally suited modality for renal transplant assessment because of its relatively lower cost and excellent ability to assess the transplant noninvasively without the need for ionizing radiation or the use of iodinated contrast agents, with their inherent nephrotoxicity concerns. Further discussion of renal transplant imaging can be found in Chapter 112.
TECHNIQUE DESCRIPTION
Anatomic Considerations
Renal Arteries
Both renal arteries arise from the abdominal aorta approximately 1 to 1.5 cm below the origin of the superior mesenteric artery and at the level of the superior border of the L2 vertebra, with the origin of the left renal artery (LRA) slightly inferior to the right renal artery (RRA; Fig. 109-19). The RRA arises from the anterolateral aspect of the aorta at approximately the 10 o’clock position and the left main renal artery arises from the posterior or lateral aspect of the aorta at about the 4 o’clock position. The RRA courses anterolaterally in its proximal few centimeters, and then courses posterior to the inferior vena cava (IVC) and eventually follows a posterolateral course towards the right kidney (Figs. 109-20 and 109-21). Sonographically, it is identified as the largest vessel seen posterior to the inferior vena cava. The LRA runs a shorter course and passes between the superior mesenteric artery and the left adrenal vein (Fig. 109-22). Bannister and associates17 have reported accessory renal arteries in approximately 25% to 30% of individuals; however, most imaging studies have reported these in from 12% to 22% of patients (Fig. 109-23). The accessory renal arteries can arise from the aorta or iliac arteries. The rate of successful imaging of the accessory renal artery varies between 0% and 24%. In the presence of a normal main renal artery, a concerted attempt should be made to search for these vessels because stenosis of an accessory renal artery can similarly result in renovascular hypertension.18–20 The small caliber of the main renal artery is an indirect clue to the presence of the accessory renal artery.21
FIGURE 109-19 Color Doppler image acquired by the midline transverse approach shows origin of both renal arteries from aorta.
Intrarenal Arteries: Segmental, Interlobar, and Arcuate Arteries
After entering the hilum, the main renal arteries split into anterior and posterior divisions. The arteries in these divisions give rise to segmental arteries, usually four, that supply each of the four vascular regions of the kidney—apical, anterior, posterior, and inferior. The segmental arteries give rise to lobar and interlobar arteries that travel between the medullary pyramids (Fig. 109-24). After traversing the corticomedullary junction, interlobar arteries give rise to arcuate arteries. Arcuate arteries give rise to the cortical and medullary branches, which supply the cortex and medulla, respectively. Most of the blood flow (90%) to the kidney goes to the cortex, with only 10% flowing into the medulla.
[/not-level-membership-for-cardiovascular-category]
