[level-membership-for-endocrinology-diabetes-and-metabolism-category]CHAPTER 59
Sleep and endocrinology
1. Why should endocrinologists concern themselves with sleep-wake cycles and circadian rhythmicity?
The 24-hour profile of nearly all pituitary hormones is related to the presence and quality of sleep. Stereotypical changes in nearly all hormonal and metabolic variables are observed in and around sleep, especially the transition to and from sleep. This fact challenges the assertion that hormone release is solely based on feedback loops. Understanding these reproducible changes in view of sleep-wake cycling is fundamental to recognizing normal and early abnormal endocrine processes. For example, appreciation of hormone changes during the day and night provides insight into a patient’s laboratory values drawn at varied times through a 24-hour period.
2. Do sleep disorders cause endocrine disease, or does endocrine disease cause sleep disorders?
Both are true. Sleep experts have dubbed sleep symptoms as the “canary in the mine” for serious medical and psychological disease. Sleep quality can be a tool for assessment of disease. Additionally, sleep disorders are common in many endocrine diseases. For example, acromegalic patients are at risk for sleep apnea (also see question 26). Excessive androgens can worsen OSA, as can hypothyroidism. Thyrotoxicosis can contribute to debilitating insomnia, with profound daytime fatigue accompanying other presenting complaints. Disruptive sleep is now associated with increased risk for diabetes and obesity.
3. What are the stages of sleep?
Sleep is organized into non–rapid eye movement (NREM) sleep and rapid eye movement (REM) sleep (Table 59-1). In classic teaching, NREM was organized into four stages. Typically, adults enter sleep through stage 1, which is characterized on electroencephalogram (EEG) by low-amplitude mixed-frequency waves. As one enters stage 2, the EEG displays predominantly sleep spindles and K complexes. The 2007 American Academy of Sleep Medicine (AASM) manual combines stages 3 and 4 into one stage, N3, or slow wave sleep (SWS). In SWS, the EEG slows and is associated with a progressive increase in the number of delta waves, which are characterized by increased amplitude and slowed frequency. It may take up to 100 minutes for the first NREM sleep cycle to finish, but once completed, it heralds the first REM period. Although REM is not defined by characteristic EEG patterns, the EEG can look like that of stage 1. The true hallmark of REM sleep, however, is rapid movement of the eyes in all directions compared with the slow eye movement (SEM) seen on electrooculography (EOG) in stage 1 sleep. Also defining REM is muscle atonia, usually manifested by low electromyography (EMG) tone and absence of chin muscle movement. The only somatic muscles working in REM are the extraocular muscles and the diaphragm.
TABLE 59-1.
| CHARACTERISTICS | NREM | REM |
| Responsiveness to stimuli | Reduced | Reduced to absent |
| Sympathetic activity | Reduced | Reduced or variable |
| Parasympathetic activity | Increased | Markedly increased |
| Eye movements | SEMs | REMs |
| Heart rate | Bradycardia | Tachycardia/bradycardia |
| Respiratory rate | Decreased | Variable; apneas can occur |
| Muscle tone | Reduced | Markedly decreased |
| Upper airway muscle tone | Reduced | Moderately decreased to absent |
| Cerebral blood flow | Reduced | Markedly increased |
| Other characteristics | Sleep walks | Dreams |
| Night Terrors |
NREMs, Nonrapid eye movements; REMs, rapid eye movements; SEMs, slow eye movements.
Modified from Chokroverty S: Disorders of sleep. In American College of Physicians Medicine, editors: Neurology, 2006, WebMD Inc. Rights reserved.
4. What is the progression of sleep stages in a usual night of sleep?
In the human, NREM sleep and REM sleep typically alternate in 90- to 120-minute cycles (Fig. 59-1). Four to six cycles occur during a normal sleep period, depending on the length of sleep. Each cycle is similar, with sleep onset initiating in stage 1, progressing to stage 2, then to SWS, and without significant arousal back to stage 2. In a typical night of adult sleep, stage 1 will comprise up to 5% of total sleep, stage 2 up to 50%, SWS up to 20%, and REM up to 25%. SWS is predominantly experienced in the first third of sleep and REM in the last half of sleep. Achieving predominant SWS or predominant REM sleep likely has neuroendocrine significance.
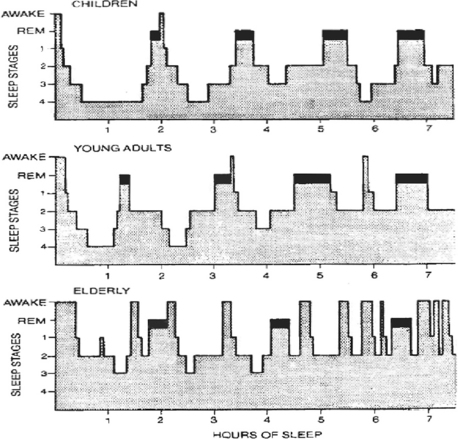
5. How do the sleep stages change during one’s life span?
As we age, total sleep time decreases, and sleep begins to fragment (see Fig. 59-1). The time in sleep declines with age from 16 to 18 hours a day in a newborn to 9 to 10 hours in a 10 year old to 7 ½ to 8 hours in the average adult, to 6 hours in an 80 year old. A newborn’s sleep is up to 50% REM sleep, which declines to 25% of sleep by adulthood. There is also a progressive decrease in SWS with aging. This loss of SWS also has endocrine repercussions because anterior pituitary hormone release is associated with SWS.
6. What are the fundamental changes in the nervous system in NREM versus REM sleep, and what other differences are noted between the phases of NREM and REM sleep (see Table 59-1)?
Sleep is characterized by reversible unconsciousness and variable responsiveness to stimuli. There is a shift in the autonomic nervous system (ANS) in sleep, with parasympathetic nervous system (PNS) predominance in NREM sleep and especially in REM sleep. Sympathetic nervous system (SNS) tone decreases in NREM sleep and usually in REM sleep, but sympathetic tone in REM sleep can be variable. In NREM sleep, there are decreases in respiratory rate (RR), heart rate (HR), blood pressure (BP), and cardiac output. Normal REM sleep is characterized by fluctuations in BP, HR, and RR. Dreaming and somatic muscle hypotonia to atonia (which includes reduced to absent upper airway muscle tone) are also REM sleep events. REM sleep can have a few periods of decreased or absent breathing. Cerebral metabolic rates for glucose and oxygen decrease during NREM sleep, but they increase to above waking levels in REM sleep.
7. What are the two basic processes controlling sleep timing and quality and therefore contributing to anterior pituitary hormone cycling in a 24-hour period?
The first process is called Process-C, for circadian process (circadian from Latin “approximately a day”). It regulates the timing of sleep. Process-C is regulated in the hypothalamic suprachiasmatic nuclei (SCN), which receives input from environmental cues, the strongest of which is light. Process-C does not just coordinate hormone release; it is the broader of the two processes and transmits circadian output to coordinate behavioral, physiologic, and genetic rhythms. Research has uncovered core molecular clock machinery responsive to Process-C in most tissues. For further discussion of the circadian clock field, please see appropriate references.
The second process is sleep-wake homeostasis (SWH), also known as Process-S. SWH is dependent on Process-C but the circadian process is not dependent on SWH.
The SWH process relates the amount and intensity of sleep to the duration of prior wakefulness. So, if one has 24 hours with no sleep, there is increased pressure to sleep. The pressure to sleep is least when one is most rested. This pressure increases during the day and peaks just before midnight. The interaction of these two processes, Process-C and Process-S, influences the hypothalamic generators of releasing or inhibiting hormones that influence anterior pituitary function.
8. Discuss the basic neuroendocrinology contributing to Process-C.
The bilaterally paired SCN of the hypothalamus has been regarded as the sole master 24-hour pacemaker. Research since 2000, however, has shown the circadian process to be a decentralized hierarchy of oscillations within the SCN and downstream oscillations within the brain and other tissues. Interactions among several hypothalamic nuclei are also involved in Process-C. SCN timing is genetically determined to be slightly greater than 24 hours and must be modified or reset (synchronized) to the 24-hour day-night cycle by environmental stimuli (zeitgebers, German for time givers or time cues). SCN cytoarchitecture reveals functional organization. The SCN projects into the periventricular hypothalamic nucleus (PVH), mediating melatonin and corticosteroid synthesis. SCN projections to other hypothalamic nuclei are also critical to sleep-wake cycling.
9. What is the relationship of “entrainment” and “synchronization” with circadian rhythms?
Circadian rhythms are synchronized to the 24-hour day through the process of entrainment. The SCN is the neural pacemaker for biologic rhythms, but it is set at greater than 24 hours. Entrainment is the phase shift caused by daily stimuli. This phase shift corrects for the difference between the intrinsic period of the pacemaker (slightly greater than 24 hours) and the environmental cycle. For example, light is the dominant time cue, capable of inducing sleep phase or wake phase changes. Aside from photic stimuli, there are other nonphotic stimuli or time cues, such as exercise, social interaction, temperature variation, and even feeding, all capable of shifting circadian rhythms. The interaction between photic and nonphotic clues is complex. The magnitude of contributions to the human system remains to be determined. At this point, it can be said that stable entrainment likely reflects integration of both central and peripheral parameters.
10. How is melatonin involved in regulation of sleep and circadian rhythm?
Melatonin levels in the pineal gland are inhibited by light; they increase at sundown and peak at mid-darkness. This makes the neurohormone, melatonin, the chemical message communicating a photoperiod “fine tuning” to the autonomous master clock in the SCN. Melatonin also communicates a chemical message of light-dark cycling to the remainder of the body. This communication occurs through specific melatonin receptors. The MT1 and MT2 melatonin receptors are G-protein coupled, with characteristic seven transmembrane domains. These two receptor families are distributed throughout the brain and peripheral tissues, for example, in the SCN itself, the adipocytes, macrophages, platelets, gastrointestinal tract, liver, heart, kidneys, and adrenals. The melatonin receptors are only receptive at the light-/dark transitions, so exogenous administration of melatonin is most effective at these transitions.
11. Name the two hormones elevated early in sleep and the two hormones elevated late in sleep.
The SWS predominates in the first third of sleep, and REM predominates in the last half of sleep. Growth hormone (GH) and prolactin (PRL) are entrained to SWS (Table 59-2). Regardless of age and gender, most of the PRL released occurs when the individual is asleep. The nighttime GH and PRL surges are associated with the first period of SWS. In fact, the GH surge immediately after sleep onset is the largest of the 24-hour period for both genders, although girls and women burst less than boys and men. Girls and women have two evening GH bursts; the first is before sleep onset late in evening, and a second is with SWS. Boys and men have few daytime GH pulses compared with girls and women. The surge of PRL and GH is lost if the patient goes sleepless and returns if the patient gets recovery sleep. It is the onset of sleep and not the time of day that triggers the release of these hormones. The hormones that increase later in sleep are cortisol and testosterone. Testosterone rises just after midnight and cortisol begins its rise at 2 am, peaking at 6 to 9 am. The timing and amount of REM sleep are related to the late-sleep rise of these two hormones in men. However, the 24-hour rhythm for both testosterone and cortisol is primarily controlled by circadian rhythmicity (Process-C) and not SWH (Process-S).
TABLE 59-2.
PRIMARY INFLUENCE ON 24-HOUR VARIATION
| HORMONE | SLEEP-WAKE HOMEOSTASIS | CIRCADIAN |
| Growth hormone | +++ | + |
| PROLACTIN | +++ | ++ |
| Thyroid-stimulating hormone | ++ | +++ |
| Testosterone | ++ | ++ |
| Cortisol | + | +++ |
12. How does gonadotropin release change from youth to adulthood, and is the LH adulthood pattern of release solely responsible for testosterone release?
They vary with sleep according to gender and stage of maturity. Before puberty, there is daytime pulsatile gonadotropin release, which is augmented with sleep onset. One of the hallmarks of puberty for the child is increased nocturnal amplitude of luteinizing hormone (LH) and follicle-stimulating hormone (FSH) pulses. Both Process-S and Process-C contribute to this nocturnal surge in pubertal children. As the pubescent boy enters adulthood, there is increased daytime LH as well, thus making the variation on a 24-hour cycle less apparent. Accumulating evidence in adult men indicates that the testosterone profile is significantly influenced by NREM-REM cycling. The nighttime LH surges of puberty dampen in height and decrease in frequency in adulthood. The early morning male testosterone rise starts with sleep onset and increases to maximum levels during last half of sleep (REM predominant). This surge of testosterone is different from that of cortisol, which is quiescent in early sleep. In addition, during the early phase of sleep, there is no corresponding LH surge. The characteristic nighttime LH bursts occur later on, in the last half of sleep. A testosterone surge was observed during adult daytime recovery sleep, and a testosterone decrease followed as the patient remained awake after the daytime recovery sleep. All this suggests that sleep itself, and not only the LH bursts, is contributing to testosterone release. The mechanisms for this increase are not yet known. The 24-hour testosterone profile and its response to sleep deprivation and daytime recovery sleep are more like PRL (Fig. 59-2). For example, when the sleep-deprived male internal medicine resident finally gets some sleep, his testosterone will surge during his recovery sleep; during the normal day and in one who has not slept, testosterone levels are on a decline. To take this example to clinical application, if low testosterone is found in an individual, it may be from sleep deprivation, OSA, or even shift work. It is fair to tell our patients to have their testosterone levels drawn first thing in the morning in a rested state, based on the observations that sleep increases testosterone, wakefulness decreases it, and the circadian influence may be less potent than SWH.
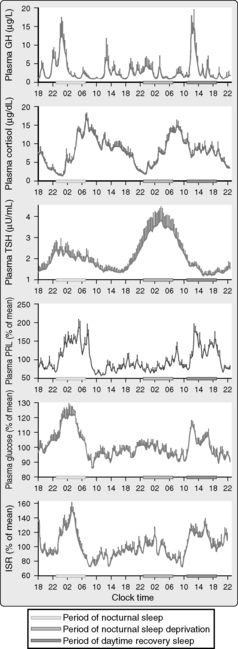
Figure 59-2. Mean 24-hour profiles of plasma growth hormone (GH), cortisol, thyrotropin (thyroid-stimulating hormone [TSH]), prolactin (PRL), glucose, and insulin secretion rates (ISR) in a group of eight healthy young men (20 to 27 years old) studied during a 53-hour period including 8 hours of nocturnal sleep, 28 hours of sleep deprivation, and 8 hours of daytime sleep. The vertical bars on the tracings represent the standard error of the mean (SEM) at each time point. The horizontal bars are the following periods: light gray is nighttime sleep, medium gray is nocturnal sleep deprivation, and darkest gray is daytime recovery sleep. Caloric intake was exclusively under the form of a constant glucose infusion. Shifted sleep was associated with an immediate shift of GH and PRL release. In contrast, the secretory profiles of cortisol and TSH remained synchronized to circadian time. Both sleep-dependent and circadian inputs can be recognized in the profiles of glucose and ISR. (From Van Cauter E, Tasali E: Endocrine physiology and relationship to sleep and sleep disturbances. In Kryger MH, Roth T, Dement WC, editors: Principles and practice of sleep medicine, ed 5, Philadelphia, 2011, Elsevier Saunders.)
13. Is the LH pattern the same in women?
In women, plasma LH is significantly influenced by the menstrual cycle. However, some sleep modulation of LH levels occurs because the LH pulse frequency slows during sleep. In the early follicular and early luteal phases, the LH pulse amplitude actually increases, although the frequency decreases, and the nocturnal LH pulse frequency slowing becomes more evident. In middle and late follicular and luteal phases, this slowing is less apparent or absent. In postmenopausal women, FSH and LH levels are elevated without circadian variation.
14. Do the gonadal steroid hormones follow the LH and FSH changes mentioned in the earlier questions?
No. Gonadotropins have pulse amplitude and frequency that are not reflected in the gonadal steroids (i.e., gonadal steroids do not have similar pulsations). For pubertal girls, there is a daytime estradiol elevation. For pubescent boys, the testosterone increase coincides with elevation of the gonadotropins as described, with minimal testosterone levels in the late evening and highest levels in early morning. In postmenopausal women, the gonadotropins increase in an attempt to make estradiol, and there is no consistent circadian gonadotropin pattern.
15. What factors influence thyroid-stimulating hormone (TSH) release?
TSH release is primarily related to the circadian rhythm, although there is a strong Process-S influence. TSH release in healthy young male subjects shows an early evening circadian elevation and then a decline in levels shortly after sleep onset that continues until the nadir in late afternoon. The inhibitory influence of sleep on TSH is thought to occur in SWS. Therefore, clinicians may need to consider withholding therapeutic decisions on the sole basis of midafternoon TSH values. With acute sleep loss, TSH takes its usual early evening upturn at approximately 6 pm but continues to rise to nearly twice normal maximum through the middle of the usual sleep period. TSH normalizes when this sleep-deprived individual gets daytime recovery sleep. The loss of an inhibitory effect of sleep on the circadian TSH elevation may contribute to the elevated TSH values seen in acutely ill hospitalized patients.
16. Given that TSH and cortisol release are circadian, why are their levels not parallel through the night and day?
Essentially, TSH is influenced both by the quality and duration of sleep (SWH), as well as the time of day (circadian). However, corticotropin (adrenocorticotropic hormone [ACTH]) release is primarily influenced by the time of day. Cortisol is thus primarily influenced by the circadian process, with some influence from Process-S (see Table 59-2). The normal 24-hour cortisol profile does not have a significant change in shape when compared with those with daytime sleep deprivation in sequence with daytime recovery sleep. The wave shape of the two hormone profiles is highest in sleep compared with daytime; TSH starts to rise just before sleep onset and is highest in SWS, whereas cortisol starts its rise in REM-predominant sleep, followed by a burst on awakening. This burst is not seen with TSH. Therefore, a change to one’s sleep-wake cycle influences the release of both hormones, but to different extents. In general, TSH fluctuations precede cortisol; cortisol peaks later, with bursts on awakening. TSH begins to rise under circadian rhythm, reaches maximum levels around midnight to 2 am, and has a nadir at 1.5 mU/L by midafternoon. TSH then levels off, stopping a would-be ascent after sleep onset, thus reflecting sleep suppression of TSH. In a study of healthy young men during nocturnal sleep deprivation from 10 pm to 6 am (SWS suppression removed), TSH more than doubled; that is, TSH went from its afternoon nadir of approximately 1.5 mU/L to a new peak of approximately 3.8 mU/L at 2 am. In the follow-on recovery sleep (10 am to 6 pm), TSH returned to a mean of 1.25 mU/L. Cortisol, conversely, begins its rise abruptly after midnight, peaks around 6 to 9 am, and then declines throughout the day (reaching a nadir at midnight). It is well documented that interruptions to nocturnal sleep are associated with short-term TSH elevations. TSH levels normalize when normal nocturnal sleep is resumed. Repeated and prolonged nocturnal sleep interruptions result in elevations of cortisol.
17. Jet lag is not uncommon. How are some of its symptoms attributable to the observed changes in cortisol and TSH?
Jet lag is a sleep disorder arising from crossing time zones in a short period of time. Essentially, the circadian process becomes misaligned with the destination time zone. This is particularly true when flying east, which moves the clock ahead but the individual’s circadian clock remains set the time zone of take off. This puts the individual at risk for insomnia. Persons with insomnia, whose ratio of total time asleep to total time in bed is less than 70% of normal, have significantly higher evening and early sleep cortisol levels. In a study of young adults whose circadian rhythms were perturbed by a flight from Europe to the United States, GH secretory patterns adjusted within a few days to the new sleep-wake cycle, but the cortisol levels remained dissociated for 2 weeks. This dissociation is thought to contribute to the symptoms of jet lag syndrome. Disruption of the hypothalamic-thyroid axis during prolonged flight has also been studied. The inhibitory effects of sleep on TSH secretion may not be present in prolonged air travel, thus translating to an overall TSH elevation, paralleled by a small, temporarily prolonged increase in triiodothyronine (T3) levels. The study related the fatigue and discomfort of jet lag syndrome to the prolonged elevation of thyroid hormone, as well as to the desynchronization of multiple circadian rhythms.
18. How do circadian and sleep-wake processes influence glucose and insulin levels?
Glucose and insulin levels are influenced by both Process-C and SWH. Studies in normal adults demonstrated a 30% increase in glucose and a 60% increase in insulin levels during nocturnal sleep. In sleep deprivation, glucose and insulin secretion rates increase at habitual sleep time, although to a much lesser degree, a finding suggesting circadian modulation. In recovery sleep, however, secretion rates of both insulin and glucose markedly increase, a finding suggesting modulation by sleep itself.
19. How does aging change hormonal release?
Changes to sleep architecture with aging are thought to lead to hormonal changes. Normal aging is associated with loss of SWS and REM sleep, with increased sleep fragmentation (see Fig. 59-1). GH and PRL rise primarily in relation to the SWS of NREM sleep, whereas TSH, cortisol, and testosterone have primarily circadian increases. In younger men, there is a dose response relationship between SWS and GH secretion. For example, in 16- to 25-year-old boys and men, SWS is nearly 20% of the sleep period and tails off to 5% to 10% after age 40 years. This is associated with GH release during sleep of approximately 350 μg in the 16 to 25 year olds, but not more than 100 μg in individuals more than 35 years old. Most of the PRL released during a 24-hour period is during sleep regardless of gender. There is nearly a 50% decrement in nocturnal PRL release with aging. The extent of circadian changes in cortisol and TSH are less dramatic with aging. Day-night TSH fluctuations also dampen with age.
20. What is the definition of sleep-disordered breathing (SDB), and how does this differ from OSA?
Confusion arises when the terms sleep-related breathing disorders (SRBD), SDB, and OSA are used interchangeably in the literature and in sleep laboratory reports. SRBD and SDB are disease headings under which other diseases are arranged, much like chronic obstructive pulmonary disease (COPD) comprises a general reference for other specific disease entities. SRBD contains adult and pediatric central apnea syndromes and OSA syndromes. OSA, in contrast, is a specific disorder that is diagnosed with polysomnography (PSG). OSA can be suspected on the basis of complaints by the patient or his or her bed partner. Such complaints include the following: unintentional sleep episodes during wakefulness; daytime sleepiness; unrefreshing sleep; fatigue or insomnia; waking from sleep with breath holding, gasping, or choking; loud snoring; and breathing interruptions. The PSG criteria are not as stringent if they are associated with patient or bed partner complaints. Accompanied by complaints, the PSG must have five or more respiratory events per hour of sleep associated with increased respiratory effort. Without a history of complaints, the PSG instead must contain 15 or more such respiratory events. In either case, rendering the diagnosis of OSA includes ruling out current medical, neurologic, and/or substance abuse disorders. Some prescribed medications can also increase the risk for OSA.
21. What are respiratory events?
Respiratory events are apneas, hypopneas, and respiratory effort–related arousals (RERAs). An apneic episode is an airflow decrease of at least 90% from baseline that lasts at least 10 seconds (try holding your own breath for 10 seconds). Hypopnea is defined as 10 seconds of at least a 30% decrease in airflow, which results in 4% or more of desaturation on pulse oximetry. Conversely, RERA criteria should be sought if an observed event does not meet apnea or hypopnea criteria. RERA is defined as a sequence of breaths more than 10 seconds in duration that is associated with increased respiratory effort and results in arousal from sleep. The AASM directs apneas, hypopneas, and RERAs, if present, to be scored in the routine PSG interpretation. The average number of apneas and hypopneas in 1 hour is referred to as the apnea-hypopnea index (AHI). However, if RERAs are present, then the average number of apneas, hypopneas, and RERAs should be calculated. This is called the respiratory disturbance index (RDI). The AHI does not equal the RDI, even though the terms are sometimes used interchangeably—such an interchange could create confusion.
22. What is the prevalence of OSA?
The prevalence depends on the definition of OSA. The earliest epidemiologic investigations, primarily of white men, estimated that up to 4% had OSA (60%–90% were obese). The classic prevalence of OSA for adults 30 to 60 years old is 24% in men and 9% in women. In nonobese patients, genetic craniofacial features such as retrognathia are correlated with OSA. As OSA data mature, the prevalence may become unique to populations or ethnicities. In Asian nonobese male office workers, body mass index (BMI) and age were positively correlated, but weight was less so than in white, non-Asian subjects. Risk factors for OSA other than adiposity, such as pharyngeal narrowing, retrognathia or micrognathia, and pharyngeal collapsibility are thought to assume greater pathologic significance in Chinese populations.
23. Define sleep deprivation. How common is it?
Sleep deprivation can be acute or chronic. By definition, going without sleep for 24 hours is acute sleep loss, whereas sleeping less than 6 hours a night for 6 nights or greater is considered chronic sleep deprivation. People in industrialized nations are sleeping less. In the United States, for example, more than 30% of adults less than 64 years of age report sleeping less than 6 hours per night, a finding leaving no doubt that many patients are accumulating chronic sleep deprivation.
24. What are the key features of sleep deprivation versus sleep apnea?
In sleep deprivation, one does not sleep but breaths normally. In OSA, one sleeps but does not breathe well during sleep. The AASM classifies volitional sleep deprivation as behaviorally induced insufficient sleep syndrome as long as it is associated with daytime sleepiness. One can objectively measure excessive daytime sleepiness (EDS) with a standardized tool such as the Epworth Sleepiness Scale (ESS). In the ESS the interviewer gives the patient 8 different life circumstances, asking them to rate their own sleep pressure in that circumstance using a four point scale, 0-3, with 0 meaning the patient feels no sleep pressure in that circumstance, whereas a patient assessment of themselves of 3 in that circumstance means they feel significant sleep pressure in that circumstance. The cumulative score from all these 8 life circumstances [the patient must answer all eight questions] has been validated in clinical practice. An ESS score of greater than 9 is consistent with EDS. Patients with acute or chronic shortening of sleep resist the drive to sleep with no impairment of gas exchange. In OSA, there is a repetitive collapse of the upper airway, which induces apneic and hypopneic episodes despite persistent thoracic and abdominal respiratory effort. This leads to mechanical loading on the upper airway, chest wall, and diaphragm. What follows are hypoxia, hypercarbia, and a marked increase in adrenergic tone. OSA often leads to disruption or fragmentation of the usual sleep-wake cycle and endocrine responsiveness. Both can contribute to fatigue and daytime sleepiness. If EDS is secondary to sleep deprivation, the patient’s sleep continuity is normal and is often associated with an increase in SWS. Recall the inhibitory influence of daytime recovery sleep on TSH; that is, if daytime recovery sleep follows nocturnal sleep deprivation, the inhibitory influence of sleep will decrease TSH (see question 15).
25. In view of increased SNS tone in OSA (see question 24), does the comorbidity of OSA interfere with the assessment of metanephrines and catecholamines when screening for pheochromocytoma?
Yes. OSA results in an appropriate release of catecholamines in response to physiologic stress or disease, just as myocardial infarctions, cerebral vascular accidents, and acute heart failure are associated with appropriate acute catecholamine increases. If a 24-hour urinary collection is performed in the setting of undiagnosed or poorly treated OSA, it would likely contain elevated metanephrine and catecholamine levels. This may falsely suggest a diagnosis of pheochromocytoma.
26. What endocrine diseases are associated with OSA?
The most common diseases are hypothyroidism, acromegaly, and polycystic ovary syndrome (PCOS). Although it was once thought that all patients with OSA had subclinical hypothyroidism, this has now been shown not to be the case. Evidence suggests that the prevalence of OSA in hypothyroid patients is about 30%. OSA is reversible in most such patients once they are treated appropriately with thyroid hormone replacement. In one prospective study of nonobese, middle-aged men and women with newly diagnosed symptomatic hypothyroidism, 30% had OSA by PSG at study onset. Eighty-four percent of these subjects had reversal of OSA with normalization of their TSH. Finally, insulin levels and measures of glucose tolerance in PCOS are strongly correlated with the risk and severity of OSA. Additionally, among those women with PCOS who have normal glucose tolerance, insulin levels are significantly higher in those at high versus low OSA risk, independent of BMI. Therefore it is reasonable to assess measures of restorative sleep, sleep habits, and sleep behaviors in all patients with PCOS.
27. How is the sleep apnea of GH excess different from the sleep apnea of thyroid hormone deficiency?
GH excess is associated with a high proportion of central sleep apnea, whereas hypothyroidism is almost uniformly associated with OSA. Up to 60% of patients with acromegaly are eventually found to have sleep apnea by PSG studies. In one series, more than 30% had central sleep apnea. Endoscopy revealed little occlusive posterior tongue movement during sleep, so this is not from macroglossia. This assertion is further supported by the observation that these patients have lower arterial carbon dioxide levels while awake and have increased ventilatory responsiveness when compared with patients with OSA. The mechanism for central sleep apnea in these patients is not clear.
28. How does sleep deprivation influence glucose tolerance?
In one study, after 1 week of sleeping 4 hours per night, increases in postbreakfast insulin resistance were noted. During sleep restriction, glucose tolerance is nearly 40% worse when compared with a group with sleep extension. It is first-phase insulin release that has been found to be markedly reduced. When sleep-deprived individuals go into recovery sleep (sleeping during the day because of prior sleep deprivation), there are marked elevations of glucose and insulin levels, indicating that sleep also exerts modulatory influences on glucose regulation independent of the circadian rhythm.
29. What is the evidence linking OSA to abnormal glucose metabolism?
Snoring, sleep deprivation, and OSA have all been linked to type 2 diabetes mellitus (DM2) risk. Data from diverse patient populations suggest that OSA severity is a risk for DM2 development. At present, available data do not definitively prove direct causation. Snoring, in nonobese Asians and especially in those who are obese, has been independently associated with abnormal oral glucose tolerance tests and higher hemoglobin A1C (HbA1C) percentages. In epidemiologic studies, sleep quality has been positively correlated with the risk of developing DM2. Observational studies have shown that patients who report less than 6 hours of sleep per night have an increased prevalence of glucose intolerance and DM2. It was found that the duration of sleep (<6 and >8 hours per night) was predictive of an increased incidence of DM2. OSA, as diagnosed by PSG, is independently associated with abnormal glucose metabolism. Another article extended this independent association through rigorous assessment of the potential confounders of overweight and obesity. In this cross-sectional analysis of 2588 patients, it was shown that impaired fasting glucose (IFG), impaired glucose tolerance (IGT), and occult diabetes are associated (but to different degrees) with OSA in both the normal-weight (BMI <25 kg/m2) and overweight or obese subgroups. This finding suggests that individuals with OSA are at special risk for DM2 and its cardiovascular complications.
30. What are the two main mechanisms underlying the development of abnormal glucose metabolism in patients with sleep apnea?
The hallmark of OSA is airflow reduction, which is typically associated with intermittent hypoxemia, sleep fragmentation, and SNS stimulation. In animal studies, insulin sensitivity has been shown to vary with intermittent hypoxemia, independent of activation of the SNS. Additionally, it has been shown that in nondiabetic overweight to mildly obese males, every 4% decrease in oxygen saturation is associated with an odds ratio that approaches 2 for worsened glucose tolerance. Sleep fragmentation has been associated with abnormal glucose metabolism. In one study of healthy adults, selective suppression of SWS (without decreasing total sleep time) was associated with decreases in insulin sensitivity by nearly 25%. This finding suggests that the low levels of SWS in elderly and obese persons may contribute to their increased incidence of DM2. In a study of consecutive adults with DM2, aged 41 to 77 years, BMI 20 to 57 kg/m2, mild OSA was associated with a mean HbA1C of 7.22% and severe OSA with an HbA1C of almost 9.42%. After adjustments for age, gender, race, BMI, number of diabetic medications, level of exercise, years of diabetes, and total sleep time, the severity of OSA by AHI correlated with higher mean HbA1C values.
31. With respect to causality, does the use of continuous positive airway pressure (CPAP) improve abnormal glucose metabolism parameters?
Yes. This is seen in nondiabetic patients, in nonobese diabetic patients, and in patients with poorly controlled diabetes. Caveat: In this body of work, the reader must discern from the trial whether there was a published measure of CPAP compliance. Trials reporting CPAP adherence definitions and those demonstrating no change in BMI during the study period do show improvement. A study of nondiabetic patients with moderate to severe OSA reported that CPAP significantly improved insulin sensitivity after only 2 days of treatment and that the improvement persisted at the 3-month follow-up with no significant changes in body weight. This influence was most pronounced in nonobese subjects. In contrast, this same research laboratory showed no improvement in insulin sensitivity in obese patients with DM2. In other trials, postprandial blood glucose levels improved most significantly after CPAP use in patients with DM2 and OSA.
32. How well are providers in diabetes clinics screening their patients for OSA? What are good tools for screening by history and physical examination?
A study of diabetic patients that used a validated clinical measurement and questionnaire to quantify OSA risk and sleepiness revealed that 56% of patients reported snoring, 29% had fatigue on awakening, and 34% reported feeling tired during wake time. The authors of the study concluded that 56% of those questioned were at high risk of OSA. This finding supports a call for greater vigilance in screening for OSA in diabetic patients, given the high prevalence of SDB found in that patient population. Certain screening tools may be helpful to this end. BMI is proportional to OSA risk; neck size greater than 17 inches is the most sensitive physical finding. Some craniofacial changes, such as retrognathia, also place a patient at high risk. A patient with OSA is often unaware of the neurocognitive changes that have developed slowly over time, and thus he or she may not volunteer a history consistent with OSA unless directly queried.
33. Does the effective use of CPAP in patients with OSA lead to weight loss?
Yes it does, apparently through two distinct mechanisms. First, patients with treated sleep apnea usually wake more rested and with a sense of improved vitality or energy. Once they are receiving treatment, patients with OSA have even been shown to exercise more. Second, treatment of sleep apnea results in normalization of serum leptin (from the Greek word leptos, meaning “thin”), the so-called satiety hormone. As discussed in the next question, leptin is suppressed during sleep deprivation and untreated sleep apnea.
34. What are the effects of sleep deprivation on leptin (satiety hormone) and ghrelin (hunger hormone)?
With sleep deprivation, leptin decreases and ghrelin (from the original root ghre meaning “to grow”) increases. In longer than average sleep, leptin increases and ghrelin decreases. It has been documented that leptin release is blunted in sleep-deprived subjects and that over a 6-month period, sleep-deprived subjects gain an average of 10 pounds more than do rested subjects.
35. Is the testosterone decline observed with aging related to changes associated with the sleep pattern of aging?
It probably is. As discussed previously, aging is associated with less time in sleep and less time in SWS. In older men, LH pulses show lower amplitude but increased frequency. The sleep-related rise of testosterone is still seen, although the magnitude is less, and it is no longer associated with time to the first REM period.
36. How do androgens influence sleep?
Exogenous testosterone may worsen existing OSA or lead to changes associated with sleep apnea. One randomized controlled trial revealed that high-dose testosterone administration in hypogonadal, otherwise healthy, elderly men shortened total sleep time and worsened coexisting undiagnosed sleep apnea. Although there have been no substantiated reports of decreased cognition and impaired driving ability with hypogonadism, it is incumbent on the prescriber to screen patients for the possibility of undiagnosed OSA.
37. How does the testosterone panel change with OSA? Does OSA treatment influence the panel?
The androgen changes of OSA are distinct from those seen in aging and obesity (Table 59-3). In OSA, there are decreases in sex hormone–binding globulin and free and total testosterone without concomitant increases in gonadotropins. In fact, one study showed LH pulse disturbances with untreated OSA. Testosterone levels improve with OSA treatment, whether by CPAP or with uvulopalatopharyngoplasty. These findings point to a hypothalamic mechanism for low testosterone levels in untreated OSA.
TABLE 59-3.
ANDROGEN CHANGES IN COMMON CIRCUMSTANCES
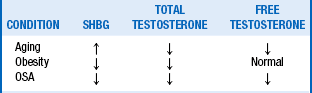
OSA, Obstructive sleep apnea; SHBG, sex hormone–binding globulin.
 KEY POINTS 1: SLEEP AND ENDOCRINOLOGY
1. Endocrine diseases associated with abnormal sleep include acromegaly, hyperthyroidism, hypothyroidism, and polycystic ovary syndrome.
2. Normal sleep preserves normal 24-hour hormone cycling. Sleep deprivation and obstructive sleep apnea can impair hormone cycling.
3. Mechanisms responsible for 24-hour hormone cycling are circadian, sleep-wake homeostatic, or both. These sleep mechanisms are complex, distinct, and superimposed on classic feedback loop mechanisms.
4. Sleep architecture changes with aging include less total sleep time and less slow wave sleep (SWS).
5. Obstructive sleep apnea (OSA) requires polysomnography for diagnosis.
6. Acute sleep loss eliminates the nocturnal thyroid-stimulating hormone suppression.
7. Sleep deprivation disrupts SWS, which is associated with decrease in hormone levels entrained to SWS (growth hormone and prolactin).
8. Short-term sleep deprivation increases cortisol levels, suppresses insulin secretion, and diminishes glucose tolerance. It also decreases serum leptin and increases ghrelin levels such that sleep-deprived subjects gain weight compared to non-sleep-deprived subjects.
9. OSA results in less predictable hormone changes depending on the extent of sleep fragmentation, elevation of adrenergic tone, and hypoxia. It is associated with decreased insulin sensitivity and worsened glucose tolerance proportional to the severity of OSA.
10. Effective treatment of OSA improves sleep architecture, normalizes hormone release, and improves abnormal glucose metabolism.
 WEBSITES
Aronsohn, RS, Whitmore, H, Van Cauter, E, Tasali, E, et al. Impact of untreated obstructive sleep apnea on glucose control in type 2 diabetes. Am J Respir Crit Care Med. 2010;181:507–513.
Aurora, RN, Punjabi, NM, Sleep apnea and metabolic dysfunction. cause or correlation. Sleep Med Clin 2007;2:237–250.
Brzezinski, A. Melatonin in humans. N Engl J Med. 1997;336:186–195.
Chokroverty, S, Disorders of sleep, In American College of Physicians Medicine, editors. Neurology. WebMD Inc. 2006
Czeiler, CA, Buxton, OM. The human circadian timing system and sleep wake regulation. In: Kryger MH, Roth T, Dement WC, eds. Principles and practice of sleep medicine. ed 5. Philadelphia: Elsevier-Saunders; 2011:402–419.
Gooley, JJ, Saper, CB. Anatomy of the mammalian circadian system. In: Kryger MH, Roth T, Dement WC, eds. Principles and practice of sleep medicine. ed 5. Philadelphia: Elsevier Saunders; 2011:376–389.
Guardiola-Lemaitre, B, Quera-Salva, MA. Melatonin and the regulation of sleep and circadian rhythms. In: Kryger MH, Roth T, Dement WC, eds. Principles and practice of sleep medicine. ed 5. Philadelphia: Elsevier-Saunders; 2011:420–430.
Iber, C, Ancoli-Israel, S, Chesson, AL, et al, The American Academy of Sleep Medicine manual for the scoring of sleep and associated events. rules, terminology and technical specifications, Westchester, Ill. American Academy of Sleep Medicine; 2007.
Ip, MS, Bing, L, Lauder, IJ, et al, A community study of sleep disordered breathing in middle-aged Chinese men in Hong Kong. 2001;119:62–69.
Jha, A, Sharma, SK, Tandon, N, et al. Thyroxine replacement therapy reverses sleep disordered breathing patients with primary hypothyroidism. Sleep Med. 2006;7:55–61.
Johns, MW, A new method for measuring daytime sleepiness. The Epworth sleepiness scale. Sleep 1991;14:540–545.
Jun, J, Polotsky, VY, Sleep disordered breathing and metabolic effects. evidence from animal models. Sleep Med Clin 2007;2:263–277.
Kales, A, Kales, JD, Sleep disorders. recent findings in the diagnosis and treatment of disturbed sleep. N Engl J Med 1974;290:487–499.
Kelly, E, Cullen, G, McGurk, C, et al. Are we missing OSAS in the diabetic clinic. Eur J Intern Med. 2008;19:e13.
Knutson, KL, Spiegel, K, Penev, P, Van Cauter, E, et al. The metabolic consequences of sleep deprivation. Sleep Med Rev. 2007;11:163–178.
Liu, PY, Caterson, ID, Grunstein, RR, Handelsman, DJ, et al. Androgens, obesity and sleep-disordered breathing in men. Endocrinol Metab Clin North Am. 2007;36:349–363.
Parish, JM, Adam, T, Facchiano, L, et al. Relationship of metabolic syndrome and obstructive sleep apnea. J Clin Sleep Med. 2007;3:467–472.
Punjabi, NM, Sorkin, JD, Katzel, LI, et al. Sleep-disordered breathing and insulin resistance in middle-aged and overweight men. Am J Respir Crit Care Med. 2002;165:677–682.
Rosenwassen, AM, Turek, FW. Physiology of the mammalian circadian system. In: Kryger MH, Roth T, Dement WC, eds. Principles and practice of sleep medicine. ed 5. Philadelphia: Elsevier Saunders; 2011:390–401.
Sack, RL. Jet lag. N Engl J Med. 2010;362:440–447.
Seicean, S, Kirchner, HL, Gottlieb, DJ, et al, Sleep disordered breathing and impaired glucose metabolism in normal-weight and overweight/obese individuals. the Sleep Heart Health Study. Diabetes Care 2008;31:1001–1006.
Spiegel, K, Leproult, R, L’hermite-Balériaux, M, et al, Leptin levels are dependent on sleep duration. relationships of sympathovagal balance, carbohydrate regulation, cortisol, and thyrotropin. J Clin Endocrinol Metab 2004;89:5762–5771.
Spiegel, K, Leproult, R, Van Cauter, E, et al. Impact of sleep debt on metabolic and endocrine function. Lancet. 1999;354:1435–1439.
Tasali, E, Mokhlesi, B, Van Cauter, E, et al, Obstructive sleep apnea and type 2 diabetes. interacting epidemics. Chest 2008;133:496–506.
Tasali, E, Leproult, R, Ehrmann, DA, Van Cauter, E, et al. Slow wave sleep and the risk of type 2 diabetes in humans. Proc Natl Acad Sci USA. 2008;105:1044–1049.
Tasali, E, Van Cauter, E, Ehrmann, DA, et al. Relationships between sleep disordered breathing in glucose metabolism in polycystic ovarian syndrome. J Clin Endocrinol Metab. 2006;91:36–42.
Tuomilehto, H, Peltonen, M, Partinen, M, et al, Sleep duration is associated with an increased risk for prevalence of type 2 diabetes in middle-aged women. the FIN-D2D survey. Sleep Med 2008;9:221–227.
Turek, FW. Chronobiology. In Kryger MH, Roth T, Dement WC, eds.: Principles and practice of sleep medicine, ed 5, Philadelphia: Elsevier-Saunders, 2011.
Van Cauter, E, Tasali, E. Endocrine physiology and relationship to sleep and sleep disturbances. In: Kryger MH, Roth T, Dement WC, eds. Principles and practice of sleep medicine. ed 5. Philadelphia: Elsevier-Saunders; 2011:291–311.
Young, WF, Jr., et al. Endocrine hypertension. In Kronenberg HM, ed.: Williams textbook of endocrinology, ed 11, Philadelphia: Saunders, 2008.
Zee, PC, Manthena, P, The brain’s master circadian clock. implications and opportunity for therapy of sleep disorders. Sleep Med Rev 2007;11:59–70.
[/level-membership-for-endocrinology-diabetes-and-metabolism-category][not-level-membership-for-endocrinology-diabetes-and-metabolism-category]CHAPTER 59
Sleep and endocrinology
1. Why should endocrinologists concern themselves with sleep-wake cycles and circadian rhythmicity?
The 24-hour profile of nearly all pituitary hormones is related to the presence and quality of sleep. Stereotypical changes in nearly all hormonal and metabolic variables are observed in and around sleep, especially the transition to and from sleep. This fact challenges the assertion that hormone release is solely based on feedback loops. Understanding these reproducible changes in view of sleep-wake cycling is fundamental to recognizing normal and early abnormal endocrine processes. For example, appreciation of hormone changes during the day and night provides insight into a patient’s laboratory values drawn at varied times through a 24-hour period.
2. Do sleep disorders cause endocrine disease, or does endocrine disease cause sleep disorders?
Both are true. Sleep experts have dubbed sleep symptoms as the “canary in the mine” for serious medical and psychological disease. Sleep quality can be a tool for assessment of disease. Additionally, sleep disorders are common in many endocrine diseases. For example, acromegalic patients are at risk for sleep apnea (also see question 26). Excessive androgens can worsen OSA, as can hypothyroidism. Thyrotoxicosis can contribute to debilitating insomnia, with profound daytime fatigue accompanying other presenting complaints. Disruptive sleep is now associated with increased risk for diabetes and obesity.
3. What are the stages of sleep?
Sleep is organized into non–rapid eye movement (NREM) sleep and rapid eye movement (REM) sleep (Table 59-1). In classic teaching, NREM was organized into four stages. Typically, adults enter sleep through stage 1, which is characterized on electroencephalogram (EEG) by low-amplitude mixed-frequency waves. As one enters stage 2, the EEG displays predominantly sleep spindles and K complexes. The 2007 American Academy of Sleep Medicine (AASM) manual combines stages 3 and 4 into one stage, N3, or slow wave sleep (SWS). In SWS, the EEG slows and is associated with a progressive increase in the number of delta waves, which are characterized by increased amplitude and slowed frequency. It may take up to 100 minutes for the first NREM sleep cycle to finish, but once completed, it heralds the first REM period. Although REM is not defined by characteristic EEG patterns, the EEG can look like that of stage 1. The true hallmark of REM sleep, however, is rapid movement of the eyes in all directions compared with the slow eye movement (SEM) seen on electrooculography (EOG) in stage 1 sleep. Also defining REM is muscle atonia, usually manifested by low electromyography (EMG) tone and absence of chin muscle movement. The only somatic muscles working in REM are the extraocular muscles and the diaphragm.
TABLE 59-1.
| CHARACTERISTICS | NREM | REM |
| Responsiveness to stimuli | Reduced | Reduced to absent |
| Sympathetic activity | Reduced | Reduced or variable |
| Parasympathetic activity | Increased | Markedly increased |
| Eye movements | SEMs | REMs |
| Heart rate | Bradycardia | Tachycardia/bradycardia |
| Respiratory rate | Decreased | Variable; apneas can occur |
| Muscle tone | Reduced | Markedly decreased |
| Upper airway muscle tone | Reduced | Moderately decreased to absent |
| Cerebral blood flow | Reduced | Markedly increased |
| Other characteristics | Sleep walks | Dreams |
| Night Terrors |
NREMs, Nonrapid eye movements; REMs, rapid eye movements; SEMs, slow eye movements.
Modified from Chokroverty S: Disorders of sleep. In American College of Physicians Medicine, editors: Neurology, 2006, WebMD Inc. Rights reserved.
4. What is the progression of sleep stages in a usual night of sleep?
In the human, NREM sleep and REM sleep typically alternate in 90- to 120-minute cycles (Fig. 59-1). Four to six cycles occur during a normal sleep period, depending on the length of sleep. Each cycle is similar, with sleep onset initiating in stage 1, progressing to stage 2, then to SWS, and without significant arousal back to stage 2. In a typical night of adult sleep, stage 1 will comprise up to 5% of total sleep, stage 2 up to 50%, SWS up to 20%, and REM up to 25%. SWS is predominantly experienced in the first third of sleep and REM in the last half of sleep. Achieving predominant SWS or predominant REM sleep likely has neuroendocrine significance.
5. How do the sleep stages change during one’s life span?
As we age, total sleep time decreases, and sleep begins to fragment (see Fig. 59-1). The time in sleep declines with age from 16 to 18 hours a day in a newborn to 9 to 10 hours in a 10 year old to 7 ½ to 8 hours in the average adult, to 6 hours in an 80 year old. A newborn’s sleep is up to 50% REM sleep, which declines to 25% of sleep by adulthood. There is also a progressive decrease in SWS with aging. This loss of SWS also has endocrine repercussions because anterior pituitary hormone release is associated with SWS.
6. What are the fundamental changes in the nervous system in NREM versus REM sleep, and what other differences are noted between the phases of NREM and REM sleep (see Table 59-1)?
Sleep is characterized by reversible unconsciousness and variable responsiveness to stimuli. There is a shift in the autonomic nervous system (ANS) in sleep, with parasympathetic nervous system (PNS) predominance in NREM sleep and especially in REM sleep. Sympathetic nervous system (SNS) tone decreases in NREM sleep and usually in REM sleep, but sympathetic tone in REM sleep can be variable. In NREM sleep, there are decreases in respiratory rate (RR), heart rate (HR), blood pressure (BP), and cardiac output. Normal REM sleep is characterized by fluctuations in BP, HR, and RR. Dreaming and somatic muscle hypotonia to atonia (which includes reduced to absent upper airway muscle tone) are also REM sleep events. REM sleep can have a few periods of decreased or absent breathing. Cerebral metabolic rates for glucose and oxygen decrease during NREM sleep, but they increase to above waking levels in REM sleep.
7. What are the two basic processes controlling sleep timing and quality and therefore contributing to anterior pituitary hormone cycling in a 24-hour period?
The first process is called Process-C, for circadian process (circadian from Latin “approximately a day”). It regulates the timing of sleep. Process-C is regulated in the hypothalamic suprachiasmatic nuclei (SCN), which receives input from environmental cues, the strongest of which is light. Process-C does not just coordinate hormone release; it is the broader of the two processes and transmits circadian output to coordinate behavioral, physiologic, and genetic rhythms. Research has uncovered core molecular clock machinery responsive to Process-C in most tissues. For further discussion of the circadian clock field, please see appropriate references.
The second process is sleep-wake homeostasis (SWH), also known as Process-S. SWH is dependent on Process-C but the circadian process is not dependent on SWH.
The SWH process relates the amount and intensity of sleep to the duration of prior wakefulness. So, if one has 24 hours with no sleep, there is increased pressure to sleep. The pressure to sleep is least when one is most rested. This pressure increases during the day and peaks just before midnight. The interaction of these two processes, Process-C and Process-S, influences the hypothalamic generators of releasing or inhibiting hormones that influence anterior pituitary function.
8. Discuss the basic neuroendocrinology contributing to Process-C.
The bilaterally paired SCN of the hypothalamus has been regarded as the sole master 24-hour pacemaker. Research since 2000, however, has shown the circadian process to be a decentralized hierarchy of oscillations within the SCN and downstream oscillations within the brain and other tissues. Interactions among several hypothalamic nuclei are also involved in Process-C. SCN timing is genetically determined to be slightly greater than 24 hours and must be modified or reset (synchronized) to the 24-hour day-night cycle by environmental stimuli (zeitgebers, German for time givers or time cues). SCN cytoarchitecture reveals functional organization. The SCN projects into the periventricular hypothalamic nucleus (PVH), mediating melatonin and corticosteroid synthesis. SCN projections to other hypothalamic nuclei are also critical to sleep-wake cycling.
9. What is the relationship of “entrainment” and “synchronization” with circadian rhythms?
Circadian rhythms are synchronized to the 24-hour day through the process of entrainment. The SCN is the neural pacemaker for biologic rhythms, but it is set at greater than 24 hours. Entrainment is the phase shift caused by daily stimuli. This phase shift corrects for the difference between the intrinsic period of the pacemaker (slightly greater than 24 hours) and the environmental cycle. For example, light is the dominant time cue, capable of inducing sleep phase or wake phase changes. Aside from photic stimuli, there are other nonphotic stimuli or time cues, such as exercise, social interaction, temperature variation, and even feeding, all capable of shifting circadian rhythms. The interaction between photic and nonphotic clues is complex. The magnitude of contributions to the human system remains to be determined. At this point, it can be said that stable entrainment likely reflects integration of both central and peripheral parameters.
10. How is melatonin involved in regulation of sleep and circadian rhythm?
Melatonin levels in the pineal gland are inhibited by light; they increase at sundown and peak at mid-darkness. This makes the neurohormone, melatonin, the chemical message communicating a photoperiod “fine tuning” to the autonomous master clock in the SCN. Melatonin also communicates a chemical message of light-dark cycling to the remainder of the body. This communication occurs through specific melatonin receptors. The MT1 and MT2 melatonin receptors are G-protein coupled, with characteristic seven transmembrane domains. These two receptor families are distributed throughout the brain and peripheral tissues, for example, in the SCN itself, the adipocytes, macrophages, platelets, gastrointestinal tract, liver, heart, kidneys, and adrenals. The melatonin receptors are only receptive at the light-/dark transitions, so exogenous administration of melatonin is most effective at these transitions.
11. Name the two hormones elevated early in sleep and the two hormones elevated late in sleep.
The SWS predominates in the first third of sleep, and REM predominates in the last half of sleep. Growth hormone (GH) and prolactin (PRL) are entrained to SWS (Table 59-2). Regardless of age and gender, most of the PRL released occurs when the individual is asleep. The nighttime GH and PRL surges are associated with the first period of SWS. In fact, the GH surge immediately after sleep onset is the largest of the 24-hour period for both genders, although girls and women burst less than boys and men. Girls and women have two evening GH bursts; the first is before sleep onset late in evening, and a second is with SWS. Boys and men have few daytime GH pulses compared with girls and women. The surge of PRL and GH is lost if the patient goes sleepless and returns if the patient gets recovery sleep. It is the onset of sleep and not the time of day that triggers the release of these hormones. The hormones that increase later in sleep are cortisol and testosterone. Testosterone rises just after midnight and cortisol begins its rise at 2 am, peaking at 6 to 9 am. The timing and amount of REM sleep are related to the late-sleep rise of these two hormones in men. However, the 24-hour rhythm for both testosterone and cortisol is primarily controlled by circadian rhythmicity (Process-C) and not SWH (Process-S).
TABLE 59-2.
PRIMARY INFLUENCE ON 24-HOUR VARIATION
| HORMONE | SLEEP-WAKE HOMEOSTASIS | CIRCADIAN |
| Growth hormone | +++ | + |
| PROLACTIN | +++ | ++ |
| Thyroid-stimulating hormone | ++ | +++ |
| Testosterone | ++ | ++ |
| Cortisol | + | +++ |
12. How does gonadotropin release change from youth to adulthood, and is the LH adulthood pattern of release solely responsible for testosterone release?
They vary with sleep according to gender and stage of maturity. Before puberty, there is daytime pulsatile gonadotropin release, which is augmented with sleep onset. One of the hallmarks of puberty for the child is increased nocturnal amplitude of luteinizing hormone (LH) and follicle-stimulating hormone (FSH) pulses. Both Process-S and Process-C contribute to this nocturnal surge in pubertal children. As the pubescent boy enters adulthood, there is increased daytime LH as well, thus making the variation on a 24-hour cycle less apparent. Accumulating evidence in adult men indicates that the testosterone profile is significantly influenced by NREM-REM cycling. The nighttime LH surges of puberty dampen in height and decrease in frequency in adulthood. The early morning male testosterone rise starts with sleep onset and increases to maximum levels during last half of sleep (REM predominant). This surge of testosterone is different from that of cortisol, which is quiescent in early sleep. In addition, during the early phase of sleep, there is no corresponding LH surge. The characteristic nighttime LH bursts occur later on, in the last half of sleep. A testosterone surge was observed during adult daytime recovery sleep, and a testosterone decrease followed as the patient remained awake after the daytime recovery sleep. All this suggests that sleep itself, and not only the LH bursts, is contributing to testosterone release. The mechanisms for this increase are not yet known. The 24-hour testosterone profile and its response to sleep deprivation and daytime recovery sleep are more like PRL (Fig. 59-2). For example, when the sleep-deprived male internal medicine resident finally gets some sleep, his testosterone will surge during his recovery sleep; during the normal day and in one who has not slept, testosterone levels are on a decline. To take this example to clinical application, if low testosterone is found in an individual, it may be from sleep deprivation, OSA, or even shift work. It is fair to tell our patients to have their testosterone levels drawn first thing in the morning in a rested state, based on the observations that sleep increases testosterone, wakefulness decreases it, and the circadian influence may be less potent than SWH.
Figure 59-2.
[/not-level-membership-for-endocrinology-diabetes-and-metabolism-category]
