[level-membership-for-pediatrics-category]Chapter 142
Skeletal Manifestations of Systemic Disease
Normal Bone Marrow
Bone marrow is one of the largest and most dynamic tissues in the body. Its functions include the production of red and white blood cells and platelets for tissue oxygenation, cellular immunity, and blood coagulation, respectively. Bone marrow occupies approximately 85% of the medullary cavity and is supported by a network of trabecular bone.1 In addition to hematopoietic elements, it contains stromal cells, collagen, nerves, and a variable amount of fat.
Function and Composition
Physiology: On gross examination, bone marrow may be red because of hemoglobin in the erythrocytes and their precursors, indicating active hematopoietic marrow, or it may be yellow as a result of the presence of carotenoid derivatives dissolved in fat droplets within adipocytes.1 Hematopoietic marrow is rich in vascular sinusoids, whereas fatty marrow is considerably less vascular. During periods of decreased hematopoiesis, the fat cells increase in size and number. During periods of increased hematopoiesis, the fat cells atrophy.
The cellularity of bone marrow diminishes most rapidly in the first two decades of life. The cellularity of hematopoietic marrow is near l00% at birth and decreases to 50% to 75% by 15 years of age. By adulthood, the hematopoietic marrow is composed of approximately 40% fat, 40% water, and 20% protein, with 60% of cells being hematopoietic and 40% being adipocytes.1 In contrast, the fatty marrow is composed of 80% fat, 15% water, and 5% protein, with 95% of cells being adipocytes (e-Fig. 142-1).1,2
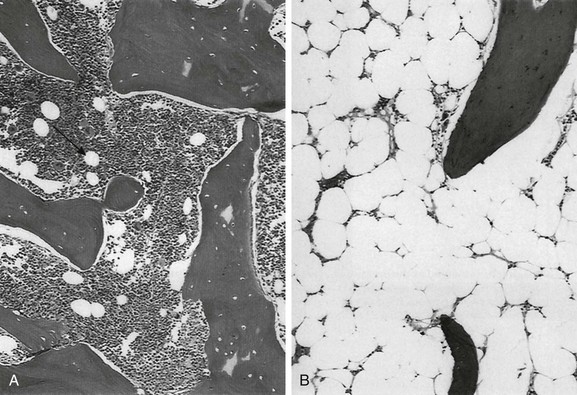
e-Figure 142-1 Histologic sections of normal bone marrow (hematoxylin-eosin, ×75).
A, Hematopoietic elements and bony trabeculae of hematopoietic marrow with few adipocytes (arrow). B, Fatty marrow contains numerous adipocytes. (From Babyn PS, Ranson M, McCarville ME. Normal bone marrow: signal characteristics and fatty conversion. Magn Reson Imaging Clin N Am. 1998;6:474.)
Imaging: Conventional radiography, computed tomography, and ultrasonography are of limited value in the assessment of bone marrow.3 Since the first reports of magnetic resonance imaging (MRI) of the marrow in children were published in 1984, MRI has emerged as the primary imaging modality to evaluate the bone marrow. It provides a noninvasive method for visualizing the gross anatomic structure of a large sample of the bone marrow and for inferring alterations in its chemical and cellular composition related to a variety of physiologic and pathologic processes. Furthermore, MRI can provide valuable information about regions of the bone marrow that may be inaccessible or difficult to biopsy.
The constituents of bone marrow that contribute to the signal characteristics on MRI are fat, water, and, to a lesser extent, mineralized matrix.3 Fat is the dominant contributor to both hematopoietic and fatty marrow signal intensity patterns. Most fat protons are in hydrophobic methylene (−CH2-) groups of relatively heavy molecular complexes, conferring very efficient spin-lattice relaxation; this results in a short T1 relaxation time, which results in high signal intensity on T1-weighted sequences.1 The T2 relaxation time of fat is much shorter than that of free water protons, and water contributes much more to the signal intensity of hematopoietic marrow than fatty marrow.1 The mineralized matrix of bone has a low density of hydrogen protons that lack mobility within the crystalline structure of bone, accounting for very long T1 and short T2 relaxation times and low signal intensity of mineralized matrix on T1- and T2-weighted sequences. In addition, local field gradients at the trabecular surface are generated by the fixed dipole from the immobile protons and cause magnetic field inhomogeneity. This magnetic susceptibility effect, as well as that resulting from iron deposition, can play a large role in the signal characteristics of hematopoietic and fatty marrow on gradient echo (GRE) images.1
The normal intervertebral disks, skeletal muscle, and subcutaneous fat have little interindividual and intraindividual variation in signal intensity on T1-weighted sequences during childhood and consequently serve as convenient internal reference standards for comparison with the signal intensity of the marrow.1,4 Fatty marrow has high signal intensity on conventional spin echo T1-weighted sequences. The relative amounts of fat, water, and protein contribute in a complex fashion to produce a longer T1 relaxation time in hematopoietic marrow, with signal intensity that ranges from intermediate to low (less than that of muscle or intervertebral disks) in fat-poor hematopoietic marrow to intermediate to high (greater than that of muscle or the intervertebral disks but less than that of subcutaneous fat) in hematopoietic marrow with larger proportions of fat.1,5 In neonates, hematopoietic marrow contains minimal fat and has low signal intensity on T1-weighted sequences. With aging, hematopoietic marrow signal intensity progressively increases on T1-weighted sequences, reflecting a progressive increase in fat content. After the neonatal period, hematopoietic marrow has signal intensity equal to or slightly greater than muscle and the intervertebral disks but much less than subcutaneous fat on T1-weighted sequences, whereas fatty marrow approaches the signal intensity of subcutaneous fat on T1-weighted sequences.5 Because of the similar proton densities of hematopoietic and fatty marrow, proton density sequences without fat suppression are less useful than T1-weighted sequences.6
The signal characteristics of marrow are highly variable on GRE sequences, with which images that exploit chemical shift can be obtained by choosing an echo time in which the phases of relaxing water and fat protons are either opposed 180° (out-of-phase or opposed-phase sequences) or coincide (in-phase sequences) related to differences in their resonance frequencies.1 When hematopoietic marrow contains approximately equivalent amounts of water and fat, as in normal adults, the signal intensity is markedly diminished on opposed-phase T1-weighted sequences, compared with in-phase T1-weighted sequences, as a result of intravoxel chemical shift effect.1 When the amount of fat and water is no longer balanced, for example, in fatty marrow or in edematous or hypercellular hematopoietic marrow, the marrow signal intensity does not show such a profound difference between the opposed-phase and in-phase T1-weighted images.1 Magnetic susceptibility effect from trabecular bone and iron leads to a lower signal intensity of the marrow on GRE T2*-weighted sequences than on spin echo sequences.
The degree of contrast enhancement of normal marrow varies with the contrast dose, timing of image acquisition following contrast administration, the age of the patient, and the composition of the marrow. Marrow enhancement peaks within a minute of contrast administration and then slowly declines.7 Enhancement is greater in children than in adults, greater in the metaphyses than in the epiphyses, and greater in hematopoietic marrow than in fatty marrow. Enhancement can be imperceptible by visual inspection in the marrow of adults and in the marrow of the epiphyses in patients aged more than 2 years. Interindividual variation in the degree of enhancement is also substantial.7 If gadolinium-enhanced T1-weighted sequences are acquired without fat suppression, contrast between hematopoietic and fatty marrow is decreased, which potentially obscures marrow lesions or age-related marrow conversion changes.8 Image-subtraction and fat-suppression techniques facilitate the detection of abnormal marrow enhancement on postcontrast T1-weighted sequences.6
A combination of T1-weighted and fat-suppressed FSE T2-weighted or STIR sequences is sufficient for the detection and characterization of most marrow lesions.9 Contrast-enhanced T1-weighted sequences increase the cost and duration of the MRI exam while providing only modest incremental added sensitivity; because of this, they should be reserved for cases with unclear findings on the precontrast sequences. GRE sequences are valuable for the assessment of the iron content of the marrow, and chemical-shift techniques are useful to detect subtle changes in the fat and water fractions of the marrow.
Practical time constraints previously limited MRI scanning of the marrow to only sections of the skeleton. This disadvantage has been mitigated by the development of fast, whole-body MRI scanning techniques that include FSE and single-shot sequences, parallel imaging, rolling table platforms with a large field of view, and global matrix coil concepts.10–12 Obscuration of lesions by motion artifact may be overcome to some extent by the use of respiratory triggering or other motion-suppression techniques. The lower signal-to-noise ratios in smaller children on whole-body MRI exams can be ameliorated by using MR systems with a higher field strength.13 Diffusion-weighted whole-body MRI holds particular promise as a technique to globally assess the bone marrow for hematologic disorders and tumor metastases.14,15
Molecular diffusion is a stochastic process characterized by brownian motion.16 Diffusion-weighted imaging (DWI) is based on the MR signal attenuation caused by the brownian motion of water molecules. In biologic tissues, the diffusion of water molecules is influenced by the microstructure of the surrounding environment. Bone marrow is semifluid in consistency and is confined within spaces defined by the bony trabeculae and supported by reticulum cells and adipocytes. DWI is not pure diffusion imaging, and the apparent diffusion coefficient (ADC) reflects both the molecular diffusion of water and the blood perfusion of the microvasculature. At b-values of 30 and 300 seconds/mm2, the ADC values of marrow are more affected by perfusion effect than by diffusion.17
A positive correlation exists between the degree of marrow cellularity and the marrow ADC. Hematopoietic marrow or marrow infiltrated by neoplastic cells has more abundant microvasculature and more intracellular and interstitial free water than fatty marrow, and it exhibits higher ADC values.18
Motion and susceptibility artifacts are especially problematic in DWI of the marrow, which is contained by bone and in proximity to physiologic motions, such as cerebrospinal fluid pulsations in the case of the spine.16 Recent advances have largely overcome these technologic challenges, and diffusion-weighted whole-body MRI is being used to evaluate an increasing number of benign and malignant conditions that include chronic recurrent multifocal osteomyelitis, Langerhans cell histiocytosis, and bony metastases.19–21
Distribution and Conversion
Physiology: Hematopoiesis occurs in the yolk sac in the early stages of fetal development; later in gestation, it shifts to the liver, and to a lesser extent, to the spleen. Bone marrow begins hematopoiesis in the fourth intrauterine month, overtakes the liver in this function by the sixth month, and is entirely responsible for hematopoietic cell production by birth.22 Shortly before birth, conversion from hematopoietic to fatty marrow begins in the distal phalanges of the hands and feet and proceeds in a centripetal fashion from the distal to the more proximal portions of the appendicular skeleton.4 Within the long bones, conversion from hematopoietic to fatty marrow proceeds from the mid diaphyses to the distal metaphyses and then to the proximal metaphyses. Conversion also progresses from the central medullary canal to the endosteum. Fatty transformation in the epiphyses and apophyses begins almost as soon as they begin to ossify. In infants, the skull and limbs contain about half of the total amount of hematopoietic marrow.1,4 By early adulthood, hematopoietic marrow becomes confined to the vertebrae, sternum, ribs, pelvis, skull, proximal humeri, and proximal femurs. Approximately one half of the bone marrow volume is fatty marrow in early adulthood and is located primarily in the appendicular skeleton. The involution of hematopoietic marrow continues throughout adult life, although at a slower pace than during childhood.1,4,23 Unlike skeletal maturation, there are generally no gender differences in the rate of marrow conversion during childhood.2 Knowledge of the normal age-related changes in the distribution of hematopoietic and fatty marrow is necessary for the recognition of abnormal conversion and reconversion patterns and for the detection of marrow infiltration by other pathologic processes.
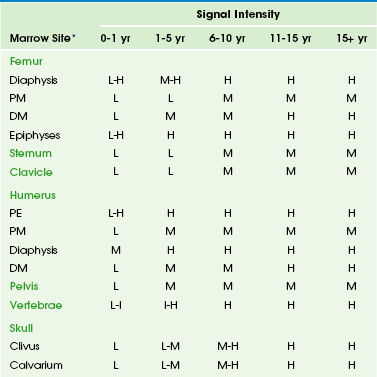
Imaging: Conversion from hematopoietic to fatty marrow is readily detected by MRI because of the high sensitivity of T1-weighted spin echo sequences to fat (e-Table 142-1).1 In fact, marrow conversion is observed earlier by MRI than by gross pathologic inspection because of the capability of MRI to detect microscopic fat present in marrow.2,4,5,24 Numerous publications detail the temporal and spatial sequence of marrow conversion revealed by MRI. Although there are discrepancies among these publications in the precise ages of transformation, the sequence of conversion is consistent along the long axes of individual bones and in the skeleton as a whole. Conversion occurs at a faster pace in the appendicular skeleton (extremities, shoulders, and pelvic girdle) than in the axial skeleton (skull, spine, ribs, and sternum).1,4
Marrow conversion follows a similar pattern in both the upper and lower limbs. Within the long bones, conversion initially begins within the diaphysis before spreading to the metaphysis.24 In general, low signal intensity on T1-weighted images marrow within the long-bone diaphyses is unusual after 10 years of age.1,5 Long-bone metaphyseal marrow demonstrates high signal intensity on T1-weighted images by 15 to 25 years of age, except for low to intermediate signal intensity hematopoietic marrow that may persist through adulthood in the proximal femoral metaphyses, the metaphyses around the knee, and the proximal humerus, particularly in populations with increased hematopoiesis, such as smokers, endurance athletes, and obese women.1,4,25
Under normal circumstances, the epiphyseal ossification centers do not participate in hematopoiesis to any appreciable degree. Soon after the onset of epiphyseal ossification, the low signal intensity bony trabeculae and hematopoietic marrow begin to be replaced by high signal intensity fatty marrow, with near complete conversion within 6 to 8 months from the onset.26 Fatty marrow appears earlier in the proximal humeral epiphysis, compared with the femur, because of the earlier onset of proximal humeral epiphyseal ossification.1,27 The apophyses and sesamoid bones follow a similar pattern to the epiphyses.
Fatty marrow conversion first occurs within the phalanges and is completed in the fingers and toes by 1 year of age.4 Conversion in the femurs begins in infancy. Fatty marrow is seen in the femoral diaphyses as early as 3 months of age and is commonly observed by 12 months of age.24 At 1 to 5 years of age, the diaphyseal fat signal becomes homogeneous, and the hematopoietic marrow in the distal femoral metaphyses becomes replaced by fatty marrow at 6 to 15 years of age (Fig. 142-2).24 However, a mottled pattern of relatively low to intermediate signal intensity in the proximal femoral metaphyses may remain, related to persistent hematopoietic marrow and bony trabeculae extending from the inferolateral aspect of the femoral neck to the superomedial aspect of the femoral head.
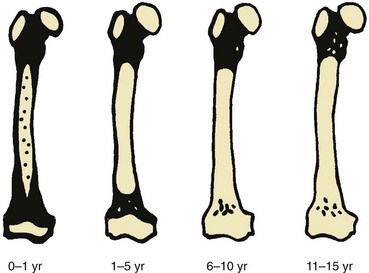
Figure 142-2 Diagrammatic representation of changes in magnetic resonance imaging appearance of the femoral marrow with increasing age.
Black areas represent hematopoietic marrow, black areas represent fatty marrow or cartilage, and stippled areas indicate heterogeneous hematopoietic and fatty marrow. (From Waitches G, Zawin JK, Poznanski AK. Sequence and rate of bone marrow conversion in the femora of children as seen on MR imaging: are accepted standards accurate? AJR Am J Roentgenol. 1994;162:1401.)
Bone marrow conversion in the humerus follows a similar predictable pattern. Conversion to fatty marrow is complete in the proximal humeral epiphyses by 1 year of age, nearly complete in the diaphyses by 5 years of age, and nearly complete in the distal metaphyses by 10 years of age.27 Conversion occurs less rapidly in the proximal humeral metaphyses and is nearly complete by 15 years of age. However, low to intermediate signal intensity hematopoietic marrow is retained in the proximal humeral metaphyses and subchondral medial aspects of the humeral heads into adulthood, particularly in women.2,28 The acromion behaves like an epiphysis in regard to marrow distribution and conversion rate.2
Conversion of marrow in the forearm and leg bones lags slightly behind the proximal arms and thighs. Conversion to fatty marrow begins in the diaphyses between 1 and 5 years of age and is complete in all portions of the forearm and leg bones by 10 to 15 years of age.4 Marrow conversion ensues in the tarsal and carpal bones at 2 to 6 months of age and is complete by 6 years of age, with the possible exception of small foci of residual hematopoietic marrow that persists in the tarsal bones up to 15 years of age.29
In the first year after birth, hematopoietic marrow is present in the pelvis. Conversion to fatty marrow initially occurs in the anterior ilium and acetabulum, beginning as early as 2 years of age (Fig. 142-3). In the second decade of life, the remainder of the pelvic marrow increases to intermediate signal intensity. Except in infancy, heterogeneous signal intensity of the pelvic marrow is a normal finding and is most prominent in adolescents and adults in the acetabulum and anterior ilium because of macroscopic foci of both hematopoietic and fatty marrow.30
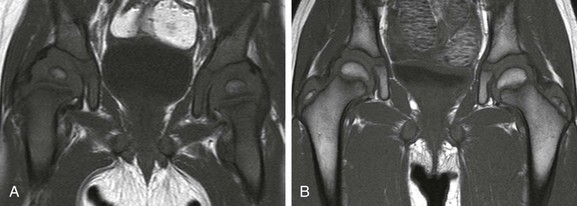
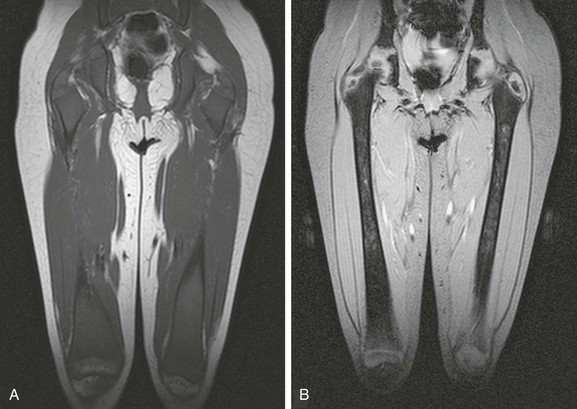
Figure 142-3 Coronal T1-weighted magnetic resonance images of the pelvis showing normal marrow changes.
A, In an 11-month-old boy, normal low signal intensity hematopoietic marrow is present in the pelvis and proximal femurs. B, In a 3-year-old girl, normal conversion to fatty marrow has occurred by this age, manifested by increased signal intensity throughout the pelvis and proximal femurs.
Axial Skeleton
During the first month after birth, the vertebral marrow lacks fat and exhibits uniformly lower signal than the adjacent cartilaginous disks on T1-weighted sequences. Later in infancy, as the vertebral ossification center increases in size, and the cartilaginous end plates decrease in prominence, the veterbral body marrow increases in signal intensity on T1-weighted sequences, particularly adjacent to the cartilaginous end plates.4 Compared with the intervertebral disks and cartilaginous end plates, vertebral body marrow is usually hypointense on T1-weighted images up to the age of 1 year.31 Vertebral body marrow is commonly isointense or hyperintense on T1-weighted images compared with the intervertebral disks from 1 to 5 years of age. After the age of 5 years, vertebral body marrow signal on T1-weighted images is typically greater than that of the intervertebral disks, and a band of fatty marrow may be conspicuous in the vertebral body centrally or along the basivertebral venous plexus (e-Fig. 142-4).4,31 The spine continues as a site of hematopoietic marrow throughout life, although the proportion of fatty marrow gradually rises approximately 7% per decade.
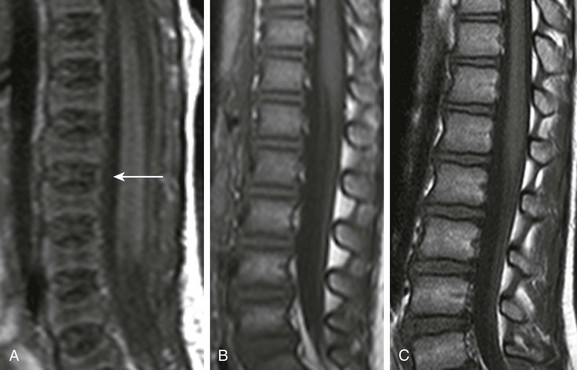
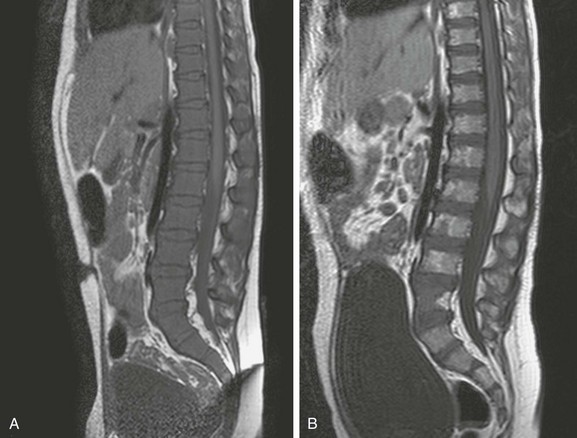
e-Figure 142-4 Sagittal T1-weighted magnetic resonance images of the lumbar spine show increase in signal intensity of vertebral body marrow with age.
A, In a 2-day-old infant girl, the paucity of marrow fat accounts for the low signal intensity of the marrow of the vertebral body (arrow) relative to the that of intervertebral disks. B, In a 2-year-old girl, vertebral body marrow is hyperintense compared with that of the intervertebral disks. C, In a 7-year-old girl, marrow signal intensity is greater than the signal intensity of the intervertebral disks, and there is a central band of more fatty, higher signal intensity marrow in the vertebral bodies.
The skull is where the bone marrow is most frequently imaged by MRI in childhood, typically incidentally in studies obtained to evaluate the brain.32 The skull contains 25% of the active hematopoietic marrow at birth, and conversion to fatty marrow begins by 2 years of age within the facial bones and skull base before proceeding to the calvarium.4 Marrow at the site of the future paranasal sinuses becomes fatty before pneumatization.32 By 3 to 4 years of age, foci of high signal intensity on T1-weighted sequences are seen in the clivus, and complete conversion is typical by 15 years of age. In the calvarium, conversion begins earlier in the frontal and occipital bones than in the parietal bones.23 Conversion in the calvarium should be obvious by 7 years of age, and it is complete in the great majority by 15 years of age.4 The conversion to fatty marrow in the calvarium may occur more slowly in females, an exception to the rule of no gender differences.3
Marrow conversion in the sternum precedes that in the ribs. Development of foci of intermediate to high signal intensity on T1-weighted sequences occurs in the sternum after 5 years of age and in the ribs by 10 years of age.4 The sternum and, to a lesser extent, the ribs remain hematopoietic into adulthood.
Detection of primary or systemic pathology that affects the marrow is usually easier in fatty marrow than in hematopoietic marrow.33 This includes processes associated with hematopoietic hypercellularity (hemolytic anemia, hematopoietic growth factor treatment, leukemoid reaction, glycogen storage disease type 1b [GSD1b], myelodysplastic syndrome, leukemia), marrow infiltration (metastatic tumor cells, inflammatory cells, Gaucher cells), iron overload, and myelofibrosis.7 Some of these processes are also associated with an increase in free water in the marrow and manifest as signal intensity higher than that of normal hematopoietic or fatty marrow on fat-suppressed FSE T2-weighted or STIR sequences.
Features that favor normal hematopoietic marrow include signal intensity equal to or only slightly higher than that of muscle on fat-suppressed FSE T2-weighted or STIR sequences, dropout of signal intensity on opposed-phase GRE sequences, a “flame” or “paintbrush” shape (Fig. 142-5), no underlying trabecular disruption, symmetry with the contralateral side, and no associated abnormalities of the cortical bone or extraosseous soft tissues. Residual red marrow may sometimes have a globular appearance on T1-weighted sequences, and this is a normal finding (Fig. 142-6). However, a low-grade infiltrative or edematous process of the marrow can be difficult or impossible to distinguish from hematopoietic marrow on MRI, particularly when the hematopoietic marrow is relatively hypercellular, such as in very young children and in states of marrow reconversion in patients on granulocyte colony-stimulating factor (G-CSF) therapy (Fig 142-7). Normal red marrow should never have a round, well-circumscribed configuration, which suggests a neoplastic process (Fig. 142-8).34
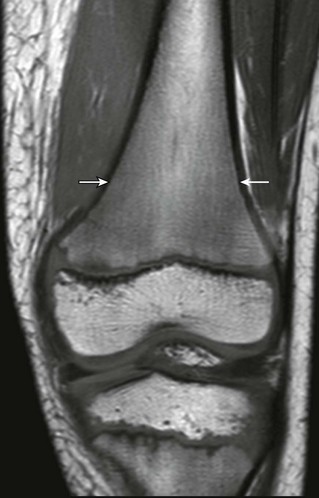
Figure 142-5 An 8-year-old boy with normal marrow.
T1-weighted coronal magnetic resonance image demonstrates paintbrush-like pattern of hypointensity (arrows) in the femoral metaphysis without underlying trabecular disruption, consistent with normal residual red marrow.
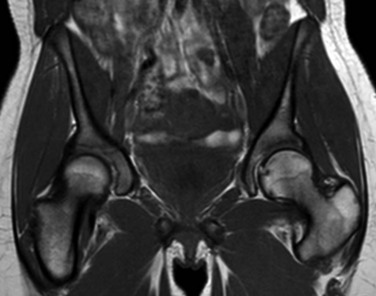
Figure 142-6 A 15-year-old girl with normal marrow.
T1-weighted coronal image demonstrates globular areas of decreased signal throughout the proximal femurs and throughout the innominate bones, consistent with normal, residual red marrow.
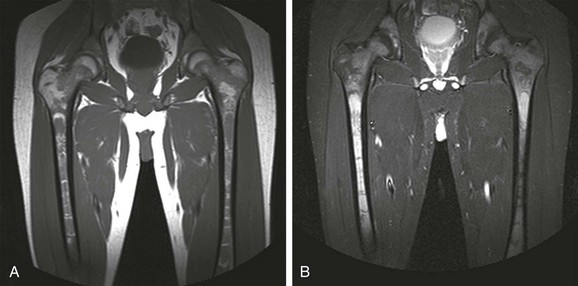
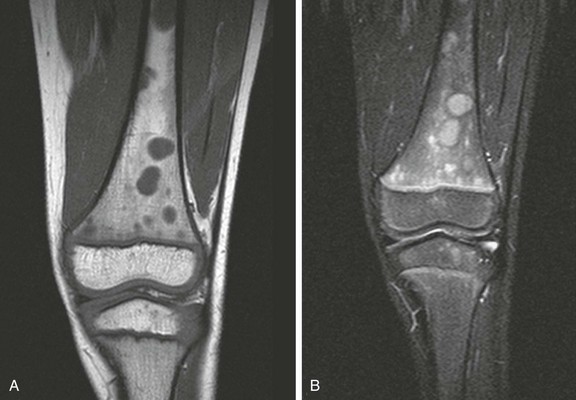
Figure 142-8 Magnetic resonance images of the left knee of a 6-year-old boy with knee pain.
A, Coronal T1-weighted image. B, Short tau inversion recovery (STIR) image. Multiple round, sharply defined masses identified on T1-weighted images are hyperintense on STIR images because of marrow involvement by Burkitt lymphoma.
Marrow Hyperplasia and Reconversion
Overview: Reconversion is a process by which established fatty marrow is replaced by hyperplastic hematopoietic marrow in response to conditions that create a demand for increased hematopoiesis. In children, reconversion is commonly encountered in patients with chronic anemia—such as from sickle cell disease, thalassemia, and spherocytosis—and in those administered hematopoietic growth factors, such as G-CSF, granulocyte-macrophage colony-stimulating factor (GM-CSF), and erythropoietin.
Etiology, Pathophysiology, and Clinical Presentation: The stimulus for increased oxygen-carrying capacity of the blood in cyanotic congenital heart disease patients, endurance athletes, heavy smokers, and high-altitude dwellers also induces hematopoietic marrow hyperplasia and reconversion. Because marrow conversion is a process that occurs throughout childhood, some of what is construed as reconversion in children actually represents an arrest or delay in conversion from hematopoietic to fatty marrow and is attributable to increased hematopoietic demands (e-Fig. 142-9).4
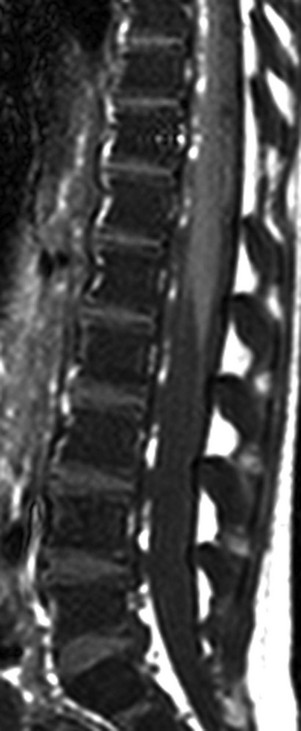
e-Figure 142-9 Sagittal T1-weighted magnetic resonance image of the lumbar spine in a 5-year-old girl with homozygous sickle cell disease.
The marrow signal intensity is lower than the adjacent intervertebral disks because of the hematopoietic marrow hyperplasia associated with chronic hemolytic anemia.
Reconversion occurs in the reverse order of normal marrow conversion, beginning in the axial skeleton and proceeding sequentially to the proximal metaphyses, distal metaphyses, and diaphyses of the long bones of the appendicular skeleton.4,6 The more distal long bones are the last to undergo this process. The epiphyses are usually spared but can undergo reconversion in response to very high hematopoietic demands.
Imaging: Positron-emission tomography (PET) with 18-fluorodeoxyglucose (FDG) may reveal increased FDG uptake in areas of marrow hyperplasia because of the metabolic demands of increased hematopoiesis. The marrow reconversion revealed by MRI is far more extensive than that suggested by technetium-99m (99mTc) phosphonate bone scintigraphy. Marrow reconversion usually begins in the metaphysis. On MRI, reconverted marrow follows the signal intensity of hematopoietic marrow and tends to involve the appendicular skeleton in a symmetric fashion.1,4 The reconverted hematopoietic marrow may be distributed in either a homogeneous or patchy pattern and may have an appearance overlapping with that of pathologic processes, such as leukemia and storage disorders. Although MRI is very sensitive to changes in marrow fat content, disease specificity is low, and the distinction between reconverted and diseased marrow often requires clinical correlation. Also, some of the conditions that exhibit marrow reconversion have additional superimposed marrow processes that complicate MRI interpretation, such as transfusion hemosiderosis in thalassemia and marrow infarction and fibrosis in sickle cell disease.
Etiology, Pathophysiology, and Clinical Presentation: Thalassemia is an inherited hemoglobinopathy characterized by ineffective erythropoiesis, intramedullary hemolysis, and anemia. With effective transfusion therapy, hematopoietic to fatty marrow conversion may proceed in the extremities by puberty. However, hematopoietic marrow hyperplasia in the skull, spine, and pelvis can remain pronounced. The paranasal sinuses often fail to develop, in part as a result of abrogation of the normal fatty conversion of marrow that precedes sinus pneumatization (see Chapter 8).32
Thalassemia patients have an increased risk of pathologic fractures because of osteopenia, arthralgias that are believed to be related to iron overload or the use chelation therapy, and back pain as a result of the high incidence of scoliosis and early intervertebral disk degeneration.35
Imaging: The radiographic changes of thalassemia are due to chronic hematopoietic marrow hyperplasia. These include diffuse osteopenia, undertubulization of bone, premature physeal fusion, “hair-on-end” appearance of the calvarium with widening of the diploic space (Fig. 142-10), decreased pneumatization of the paranasal sinuses, coarse trabeculation of appendicular bones, expansion of costochondral junctions, scoliosis, and soft tissue masses related to extramedullary hematopoiesis.36
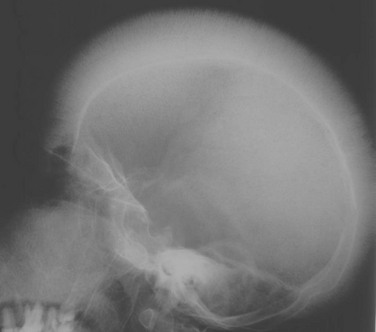
Figure 142-10 Child with thalassemia with diffuse “hair-on-end” appearance of the calvarium. (Courtesy Edward Singleton, MD.)
The appearance of the bone marrow on MRI is a reflection of the diffuse erythroid marrow hyperplasia, chronic transfusions, and iron chelation therapy.4 Iron deposition in the marrow results in lowered signal intensity on T1-, T2-, and especially T2*-weighted images because of T2 relaxation-time shortening and magnetic susceptibility effects.37 However, excess iron deposition can still be identified by MRI in some of those whose chelation is thought to be clinically adequate on the basis of serum ferritin levels. In severe cases of thalassemia, bone marrow transplantation may be pursued as a potentially curative treatment, and MRI can reveal the consequent degree of marrow conversion. FDG-PET in patients with thalassemia shows diffuse increased marrow uptake.38
Sickle Cell Disease
Etiology, Pathophysiology, and Clinical Presentation: Sickle cell disease is an inherited hemoglobinopathy characterized by deformation of red blood cells and resultant hemolytic anemia and intravascular sludging of blood. The bone marrow imaging manifestations of sickle cell disease are primarily related to hematopoietic marrow hyperplasia, osteonecrosis, and perivascular fibrosis.39 Because the circulation normally passes centrifugally from the medullary cavity to the cortex, sludging of blood flow in the nutrient artery branches places increased demands on the radially arranged periosteal-cortical system of anastomosing blood vessels to supply the marrow, particularly in the peripheral subcortical medullary cavity.39,40 This, coupled with the increased oxygen needs from increased hematopoietic activity, accounts for the vulnerability of the bone marrow to osteonecrosis.
Imaging: Osseous abnormalities in sickle cell disease are secondary to osteonecrosis and, less often, osteomyelitis. Radiographic findings are similar to osteonecrosis from other causes, with geographic and patchy areas of sclerosis (Fig. 142-11) that most commonly involve the femoral heads. Other common radiographic abnormalities include dactylitis (e-Fig. 142-12), H-shaped, or “Lincoln log” vertebral bodies from central growth plate osteonecrosis (Fig. 142-13), diffuse osteosclerosis, and widespread periostitis.41
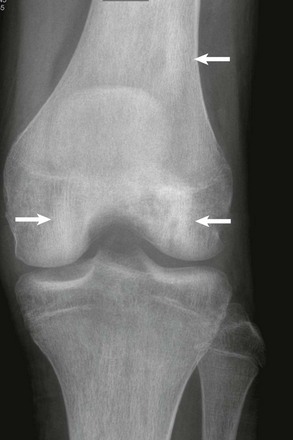
Figure 142-11 Sickle cell disease in a 17-year-old boy.
Antereroposterior radiograph of the knee demonstrates multiple areas of sclerosis in the condyles and femoral shaft consistent with areas of osteonecrosis (arrows).
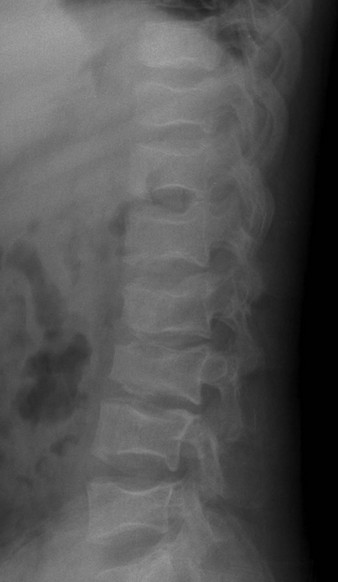
Figure 142-13 Sickle cell disease in an 18-year-old man.
Numerous Angulated end-plate depressions (“Lincoln log” vertebrae) are consistent with central growth plate osteonecrosis.
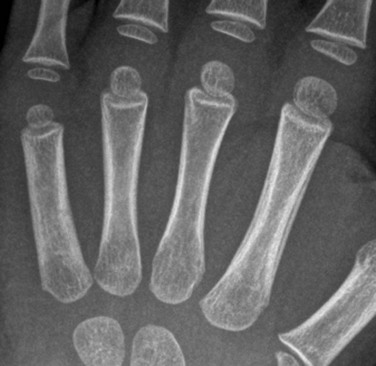
e-Figure 142-12 Two-year-old girl with sickle cell disease and left hand swelling diagnosed clinically with dactylitis.
Radiograph of the left hand shows smooth periosteal new bone formation along the second metacarpal.
Findings on MRI include bone marrow changes that reflect red marrow reconversion secondary to chronic anemia, with decreased signal intensity on T1-weighted images and increased signal intensity on fat-suppressed T2-weighted and STIR sequences. Marrow changes secondary to osteonecrosis are more complex and often reflect a combination of acute and chronic processes. Foci of low, serpentine signal intensity on T1-weighted images and abnormal high signal intensity on fat-saturated T2-weighted or STIR images are classic imaging features of osteonecrosis. Chronic osteonecrosis may be suggested when these findings are confined to the marrow itself with absent joint effusions or juxtacortical soft tissue edema (Fig. 142-14). Acute osteonecrosis may be suggested when there is also infiltrative marrow edema, periostitis, and/or juxtacortical soft tissue edema (Fig. 142-15).
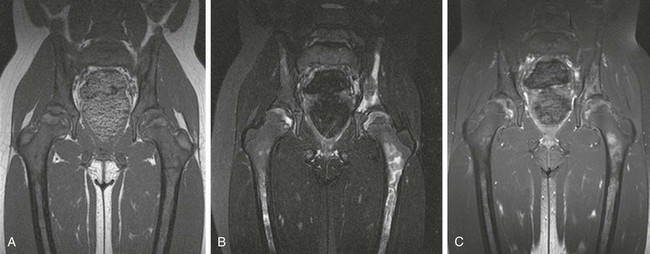
Figure 142-14 Homozygous sickle cell disease in a 10-year-old girl with diffuse changes of osteonecrosis of the pelvic bones and femurs.
Coronal T1-weighted (A), T2-weighted fat-saturated (B), and post-gadolinium T1-weighted fat-saturated (C) magnetic resonance images of the pelvis. Note absence of juxtacortical soft tissue edema or hip joint effusions, suggesting that the process is subacute or chronic in nature.
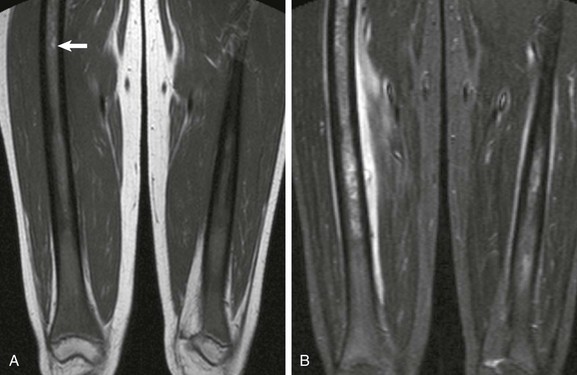
Figure 142-15 Sickle cell disease acute vasoocclusive crisis in a 16-year-old girl.
A, T1-weighted coronal image demonstrates diffuse red marrow hyperplasia with variegated sclerosis throughout the femoral shafts consistent with prior episodes of osteonecrosis. Note hyperintense T1 focus (arrow), which may represent sequestered blood. B, Short tau inversion recovery coronal sequence reveals diffuse marrow edema bilaterally, as well as exuberant periostitis bilaterally, and exuberant juxtacortical soft tissue edema on the right.
Acute osteomyelitis may be difficult to differentiate by MRI from the more common acute osteonecrosis and vasoocclusive crisis (see Fig. 142-15). Ultimately, aspiration and biopsy may be necessary to distinguish these entities, because both can manifest with marrow signal intensity abnormalities, periosteal reaction, and intraosseous, subperiosteal, or extraosseous soft tissue fluid collections. Gadolinium-enhanced MRI can be useful to distinguish vascularized inflammatory tissue from fluid collections and can guide the aspiration of fluid collections.42 Some evidence suggests the ability of unenhanced T1-weighted fat-saturated images to differentiate acute osteonecrosis from acute osteomyelitis based on the T1 shortening effects of sequestered red blood cell aggregrates in the marrow, but further studies are needed to validate this technique.43
Treatment: The two most common acute musculoskeletal manifestations of sickle cell disease are vasoocclusive crisis followed by infection. Osteonecrosis is the most frequent presentation of vasoocclusive crisis and is treated with supportive care and pain management.44 Infections include osteomyelitis and, less commonly, septic arthritis. Unlike the general pediatric population with musculoskeletal infections, Salmonella is most commonly identified by culture, followed by Staphylococcus aureus41; therefore antimicrobial therapy should be tailored accordingly in sickle cell patients.
Glycogen Storage Disease Type 1b
Etiology, Pathophysiology, and Clinical Presentation: The musculoskeletal manifestations of GSD1b are related to a defect in myeloid maturation that leads to bone marrow hypercellularity with hyperplasia of the myelopoietic cells and a leftward shift. Patients with GSD1b have a propensity to develop bacterial infections related to chronic neutropenia.45
Imaging: The most common radiographic changes in GSD1b during childhood are osteoporosis, undertubulization of appendicular bones, marked growth retardation, and delayed physeal closure.46,47 Epiphyseal ossification is often delayed, and open physes may persist into early adulthood. When epiphyseal ossification centers appear, they often have a spiculated and fragmented appearance but eventually normalize in shape as the skeleton matures.
On MRI, the signal intensity of the bone marrow varies and is dependent upon whether G-CSF has been administered for treatment. Without such treatment, patchy areas of low signal intensity on T1-weighted sequences and high signal intensity on T2-weighted FSE and STIR sequences reflect myeloid hyperplasia throughout the axial and appendicular skeleton. MR imaging features of glycogen storage disease may be indistinguishable from marrow hyperplasia related to profound anemia or leukemia. With G-CSF treatment, marrow hyperplasia becomes even more profound, and replacement of yellow marrow at the epiphyses may occur. In addition, G-CSF therapy often creates transverse bands of increased signal intensity on T2-weighted FSE and STIR sequences at the level of the juxtaphyseal metaphysis, likely related to hematopoeitic recruitment.25,45
Treatment: Medical nutrition therapy is the primary treatment. Additional therapies include allopurinol to prevent gout, lipid-lowering agents, citrate supplementation to help prevent urinary calculi, angiotensin-converting enzyme inhibitors to treat microalbuminuria, surgery or other treatments for hepatic adenomas, human G-CSF for recurrent infections, and organ transplantation for end-stage kidney and liver disease.48
Marrow Infiltration
Etiology, Pathophysiology, and Clinical Presentation: Gaucher disease is the most prevalent heritable lysosomal storage disorder. Mutations that confer a deficient level of activity of β-glucocerebrosidase lead to accumulation of the lipid glucocerebroside in the lysosomes of macrophage-like Gaucher cells.49 The symptoms and pathology of the type 1 form of Gaucher disease result from the accumulation of Gaucher cells in various organ systems, including the skeletal system. Those with Gaucher disease are subject to recurrent painful bone crises, like those with sickle cell disease.
Imaging: Skeletal imaging manifestations relate to marrow infiltration by Gaucher cells, leading to osteonecrosis, osteosclerosis, osteomyelitis, and predisposition to fractures.49,50 The most common radiographic abnormality in untreated Gaucher disease is undertubulation of the distal femoral metaphysis as a result of marrow infiltration, termed the Erlenmeyer flask deformity; this is less commonly identified in treated patients.
On MRI, replacement of fatty marrow by Gaucher cells results in low signal intensity of the marrow on T1- and T2-weighted sequences. Initially, marrow replacement is often diffuse and homogeneous and mimics a number of systemic metabolic disorders.51 Marrow replacement is usually confined to the metaphysis and diaphysis, and epiphyseal involvement is unusual except in severe cases.52 With time and treatment, marrow changes become patchy. Islands of Gaucher cells are separated by intervening fatty marrow throughout the skeleton with relative preservation of the epiphyseal fatty marrow (Fig. 142-16). The intramedullary presence of Gaucher cells is thought to hinder blood flow within the marrow, thereby predisposing these patients to osteonecrosis (e-Fig. 142-17).
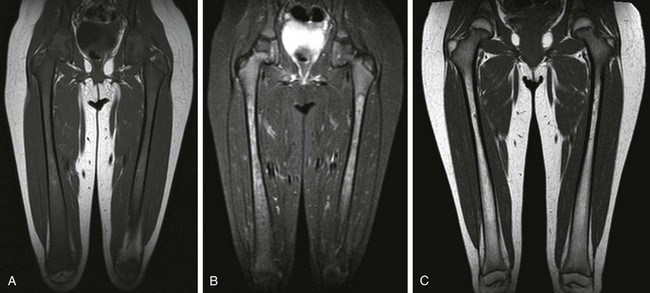
Figure 142-16 Four-year-old girl with Gaucher disease.
A, T1-weighted coronal image shows diffuse yellow marrow replacement with small diaphyseal islands of yellow marrow. B, Short tau inversion recovery coronal image shows lobulated marrow replacement with increased signal with respect to muscle. C, T1-weighted coronal image after treatment 7 years later shows yellow marrow conversion in the metaphysis and diaphysis.
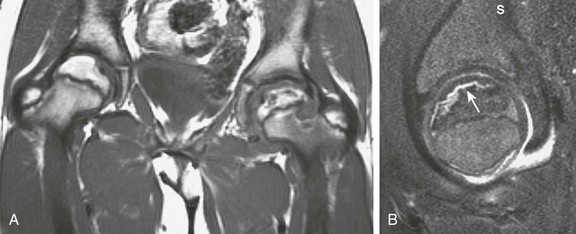
e-Figure 142-17 Five-year-old girl with severe type 1 Gaucher disease, with diffuse Gaucher cell infiltration and osteonecrosis.
Diffuse metadiaphyseal low signal intensity of the marrow is noted on the coronal T1-weighted magnetic resonance (MR) image (A), and corresponding patchy high signal intensity with intervening serpentine margins related to osteonecrosis is evident on the coronal fast field echo T2*-weighted MR image (B).
Treatment: Enzyme-replacement therapy results in degradation of Gaucher cell deposits and reconversion to normal fatty marrow.52 MRI has been advocated to monitor for an increase in the fat fraction of the marrow as an indicator of response to therapy, and several MRI-based methods of quantifying the bone marrow infiltration in patients with Gaucher disease are under investigation, including Dixon chemical-shift imaging, T1 relaxation-time calculation, and MR spectroscopy.51
Neoplasms
Etiology, Pathophysiology, and Clinical Presentation: Leukemia is the most common childhood malignancy, accounting for up to one third of childhood cancer.53 Leukemia is classified by the morphology, immunophenotype, and cytogenetics of the leukemic cells. Acute lymphoblastic leukemia (ALL) and acute myeloid leukemia (AML) account for three quarters and one fifth of childhood leukemia cases, respectively. The peak incidence of ALL among children is 2 to 3 years of age, and there is evidence that ALL can initiate in utero.54 AML rates are highest in the first 2 years of life, decline to a nadir at 6 years of age, and slowly increase during the adolescent years.55
An increased risk of leukemia is associated with certain genetic disorders, including trisomy 21, monosomy 7, neurofibromatosis type 1, and DNA repair disorders such as ataxia-telangiectasia.53 Of special interest to the radiologist, and increasingly the public, is the reported increased risk of leukemia from prenatal or postnatal radiation exposure.56,57
Imaging: Radiography of the appendicular and axial skeleton is most often normal when the patient is brought to medical attention. When radiographs are abnormal, the most common finding is osteopenia. Leukemic lines refers to juxtaphyseal radiolucent metaphyseal bands (Fig. 142-18), and has been attributed to various causes, including disruption of the zone of hypertrophy related to leukemic infiltration, insufficiency fractures of the metaphysis just above the physis, with rarefaction of the juxtaphyseal metaphysis; it has even been proposed to be a visual artifact related to profound osteopenia. Periostitis may also be seen at initial presentation related to the disease process itself or to insufficiency fractures as a result of osteopenia (e-Fig. 142-19).
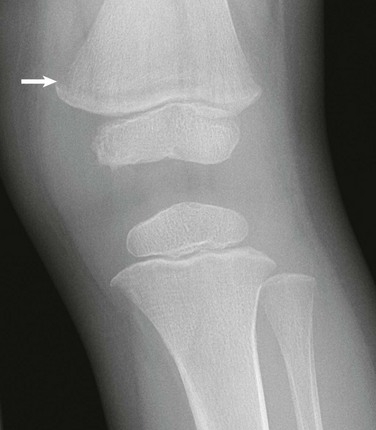
Figure 142-18 One-year-old boy with newly diagnosed acute lymphoblastic leukemia.
Leukemic lines manifesting as juxtaphyseal metaphyseal lucency are most pronounced in the distal femur (arrow).
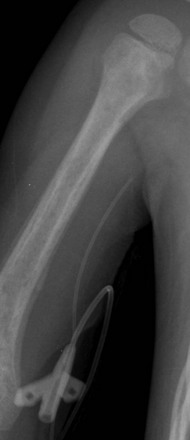
e-Figure 142-19 Three-year-old boy with trisomy 21 and anemia.
Coned-down image of the right humerus from a chest radiograph shows an aggressive, permeative lesion with a poorly defined zone of transition and periosteal reaction that affects the mid and distal humerus. Bone marrow biopsy revealed acute myeloid leukemia.
On MRI, diffuse decreased signal intensity on Tl-weighted images58,59 and increased signal intensity on fat-suppressed T2-weighted and STIR sequences is seen in the setting of leukemic infiltration. The epiphysis is often involved (Fig. 142-20). Marrow involvement may also have a well-defined nodular appearance, especially in the setting of leukemic relapse.34 The findings are less conspicuous in hematopoietic marrow than in fatty marrow, and consequently these are more difficult to appreciate in younger children, in whom marrow conversion has not yet occurred.33 The MRI appearance of diffuse cellular infiltration of the marrow in children is not specific for acute leukemia and can also be seen in conditions associated with hematopoietic marrow hyperplasia, in myelodysplastic and myeloproliferative syndromes, and in lymphoma and solid tumor metastases. The findings of periostitis, geographic replacement of fatty marrow by hematopoietic marrow throughout the entirety of the long bones and axial skeleton, and juxtacortical soft tissue edema favor a diagnosis of leukemia over hematopoietic marrow hyperplasia.
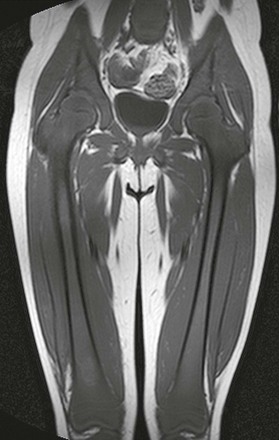
Figure 142-20 Six-year-old girl with newly diagnosed acute lymphoblastic leukemia.
Coronal T1-weighted magnetic resonance image of the pelvis and thighs demonstrates diffuse low signal intensity of the bone marrow consistent with leukemic replacement.
During chemotherapy for leukemia, the bone marrow becomes hypocellular and edematous. Following chemotherapy, there is progressive regeneration of normal hematopoietic cells and fat (e-Fig. 142-21).60 A marked increase in the marrow-fat fraction is observed by chemical-shift MRI in patients responding to chemotherapy, whereas a low marrow-fat fraction persists in the setting of unresponsive disease. In children with ALL who enter remission, marrow T1 relaxation time normalizes, whereas it remains prolonged in those who do not enter remission.59,61 These findings imply that MRI could potentially allow earlier prediction of therapeutic response and identification of residual disease, and it could reduce the need for serial bone marrow biopsies.
e-Figure 142-21 Sagittal T1-weighted magnetic resonance images of the lower spine in a 5-year-old boy with Down syndrome and acute lymphoblastic leukemia.
At the time of leukemia diagnosis, the marrow is hypercellular owing to diffuse infiltration of the marrow by lymphoblasts and resultant diffuse abnormal low signal intensity of the marrow (A). The increase in marrow signal intensity following chemotherapy is consistent with an increase in the fat content and a reduction in the cellularity of the marrow (B).
Treatment and Follow-up: No standard guidelines exist for routine imaging follow-up in children with leukemia. PET imaging, bone densitometry, and whole-body MRI at presentation, treatment, or follow-up may be components of clinical trials or other research investigations but are not part of routine clinical practice.
Imaging is often obtained to evaluate musculoskeletal complications in children treated for leukemia. Musculoskeletal complaints are common at presentation and during follow-up.62 The most common complications amenable to imaging diagnosis are osteonecrosis and insufficiency fractures. Osteonecrosis is seen in up to 70% of children screened by MRI, and 15% to 20% have symptoms.63 The reported incidence of fractures in leukemic patients is 18.5% with low lumbar spine bone mineral density and age greater than 10 years as independent predictors of fracture risk.64
The most common site of ALL relapse is the marrow, followed by the central nervous system and testes.55 MRI may be used to evaluate for relapse; however, its specificity is limited by difficulty in differentiating viable neoplasm from effects of therapy, including hematopoietic marrow regeneration (particularly with G-CSF or GM-CSF therapy), hematopoietic marrow reconstitution following stem cell transplantation, marrow iron overload from transfusional hemosiderosis, and marrow infarction and fibrosis.65–67 Because of these limitations, MR imaging has not replaced marrow aspirate or biopsy for assessment of therapeutic response in leukemia.68
Lymphoma
Etiology, Pathophysiology, and Clinical Presentation: Marrow involvement by lymphoma in children usually occurs with Burkitt and lymphoblastic lymphomas and with lymphocyte-depleted Hodgkin disease. The pattern of involvement is usually multifocal, and there is a predilection for sites of predominantly hematopoietic marrow. When involvement is diffuse, an arbitrary threshold of neoplastic lymphoid cells constituting 25% or greater of the marrow cellularity differentiates the diagnosis of lymphoblastic leukemia from lymphoma.69
Primary lymphoma of bone should be distinguished from Hodgkin and non-Hodgkin lymphoma with bone involvement. When isolated disease is confined to marrow without disease elsewhere for at least 6 months, a diagnosis of primary bone lymphoma can be made.70
Imaging: Disseminated lymphoma with marrow involvement may be indistinguishable from leukemia by imaging. However, primary lymphoma of bone may be seen initially as isolated focal bone involvement that may mimic other primary bone neoplasms. The most common radiographic pattern is lytic-destructive (Fig. 142-22).71 The lytic pattern may be permeative, consisting of many uniform small lucencies or “moth-eaten” areas made of larger, poorly marginated lucencies.70 Primary bone lymphoma often involves the flat bones of the pelvis and shoulder girdle as well as the diaphyses of long bones, similar to Ewing sarcoma.
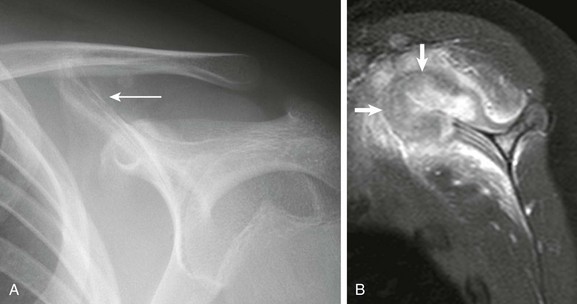
Figure 142-22 Fourteen-year-old boy with left shoulder pain.
A, Frontal radiograph of the left scapula at initial presentation shows periosteal reaction and irregularity (arrow) at the superomedial scapula. B, T1-weighted image with fat saturation shows cortical destruction, bone marrow edema, and a large heterogeneously enhancing soft tissue mass arising from the superior scapula (arrows) with adjacent soft tissue edema. Open surgical biopsy revealed large cell anaplastic lymphoma.
Unlike leukemia, primary bone lymphoma usually presents as a well-defined intramedullary mass with variable cortical destruction and soft tissue extension. The involved sites typically show low signal intensity on T1-weighted sequences and high signal intensity on fat-suppressed T2-weighted and STIR sequences (see Fig. 142-8). When primary bone lymphoma is unifocal on MRI with masslike features, it cannot be distinguished from other aggressive lesions, such as Ewing sarcoma and Langerhans cell histiocytosis. When diffuse, involvement is often patchy, and up to one third of lymphoma patients with negative bone marrow biopsies have lymphoma involvement visible by MRI distant from the standard iliac crest biopsy sites.67,72
Although MRI is a sensitive modality for detecting marrow infiltration, it is not routinely used for the staging of lymphoma. FDG-PET detects lymphoma on the basis of the increased glucose transporter activity and glycolysis in lymphoma, and it is emerging as the functional imaging study of choice for the evaluation of lymphoma. Like MRI, FDG-PET is more sensitive than standard bone scintigraphy for the detection of bone marrow involvement.72 However, assessment of lymphoma in the marrow after therapy may be limited, with false-positive findings as a result of hematopoietic growth factor effects.72
Treatment and Follow-up: Systemic lymphoma with marrow involvement portends a worse prognosis and is considered stage IV disease.53 Imaging follow-up is based on nonosseous disease, including nodal involvement. Patients with primary bone lymphoma have an excellent prognosis, and treatment is usually tailored to the site of involvement.73
Osteonecrosis
Etiology, Pathophysiology, and Clinical Presentation: Although often asymptomatic and rarely extensive enough to impair hematopoietic function, osteonecrosis can cause pain and disability. It can be separated into epiphyseal and nonepiphyseal osteonecrosis. The terms aseptic and avascular necrosis are alternative terms for epiphyseal osteonecrosis, and bone infarction is an alternative term for nonepiphyseal osteonecrosis.
Conditions associated with an increased risk of osteonecrosis include repetitive trauma, sickle cell disease, Gaucher disease, chronic renal failure, bone marrow transplantation, steroid therapy, pancreatitis, and highly active antiretroviral therapy for HIV infection.74 Putative pathophysiologic mechanisms related to nontraumatic spontaneous osteonecrosis include vascular occlusion, elevated medullary cavity pressure, coagulopathy, and altered lipid metabolism. Osteonecrosis most commonly occurs in regions of fatty marrow and is unusual in hematopoietic marrow, except in patients with a hemoglobinopathy.74
Legg-Calvé-Perthes (LCP) disease, also called idiopathic osteonecrosis of the capital femoral epiphysis, is one of the most common forms of epiphyseal osteonecrosis. LCP is a classic illustrative example of the clinical course and prognosis related to epiphyseal osteonecrosis at the femoral head and elsewhere. LCP affects boys between 2 and 14 years of age with peak incidence around 5 to 6 years (male/female ratio, 5 : 1). Bilateral involvement is seen in about 10% to 15% of cases, although it is almost always asynchronous.75 Forms of idiopathic osteonecrosis that affect other bones include but are not limited to Kienböck disease (lunate; Fig. 142-23), Köhler disease (navicular; Fig. 142-24), and Freiberg infraction (second or third metatarsal head; Fig. 142-25).
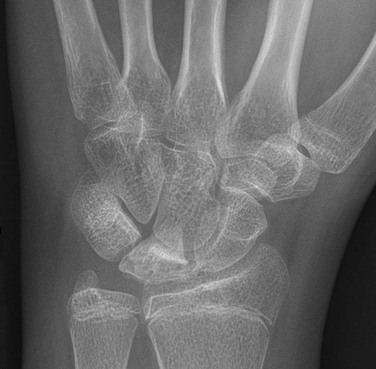
Figure 142-23 Fourteen-year-old girl with Keinboch disease with flattening and sclerosis of the lunate bone.
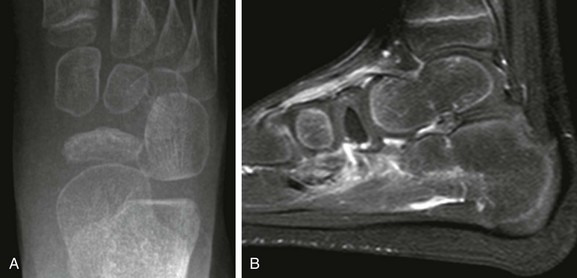
Figure 142-24 Fifteen-year-old girl with Kohler disease.
A, Anteroposterior view of the foot shows sclerosis and mild flattening of the navicular bone. B, Postcontrast T1-weighted fat-saturated sagittal image shows nonenhancement of the navicular bone and soft tissue edema about the dorsal and plantar surface of the midfoot.
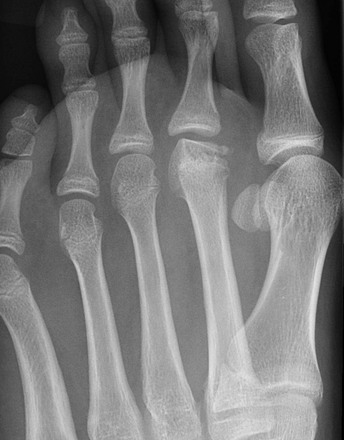
Figure 142-25 Freiberg infraction in an 11-year-old girl.
Oblique view of the forefoot shows flattening and collapse of the second metatarsal head.
For LCP, deformity of the femoral head, neck, and acetabulum results is a common cause of degenerative disease of the hip, particularly in men. Children who come to medical attention before 6 years of age generally have a benign course, whereas those who seek care after 8 years of age fare less well and often require surgery.76
Imaging: In acute osteonecrosis, radiographs are usually normal. With subacute and chronic osteonecrosis, radiographs will show geographic and patchy areas of sclerosis (see Fig. 142-11).
In the acute phase of osteonecrosis, marrow hemorrhage, edema, and liquefactive necrosis are evident. On MRI, this may be difficult to distinguish from infection and/or superimposed stress reaction. Acute-on-chronic osteonecrosis may occur, and the presence of edema and periostitis are helpful clues to identify the acute component (Fig. 142-26). Rarely, this may superficially mimic a neoplastic process. Unfortunately, early infection and superimposed stress reaction may be indistinguishable. During the reparative phase, central fatty marrow replacement usually occurs (Fig. 142-27). Osteonecrosis often has a geographic shape with a serpentine margin of low signal intensity on T1-weighted sequences and often does not respect epiphyseal, metaphyseal, and diaphyseal boundaries of the long bones (see Fig. 142-27). T2-weighted sequences may demonstrate a characteristic “double-line sign” consisting of an outer rim of low signal intensity corresponding to sclerotic bone and an inner rim of high signal intensity corresponding to vascularized granulation tissue (Fig. 142-28). Areas of low signal intensity on both T1- and T2-weighted sequences related to osteonecrosis represent fibrosis or calcification. Fatty marrow infiltration manifested by increased signal intensity on T1-weighted sequences within the area of osteonecrosis is believed to indicate central revascularization (see Fig. 142-27). Intense contrast enhancement is common at the periphery of evolving areas of osteonecrosis, and dynamic contrast-enhanced MRI has been advocated for early diagnosis but probably is not necessary in children with established osteonecrosis. The diagnosis can usually confidently be made on conventional MRI sequences without intravenous contrast.74
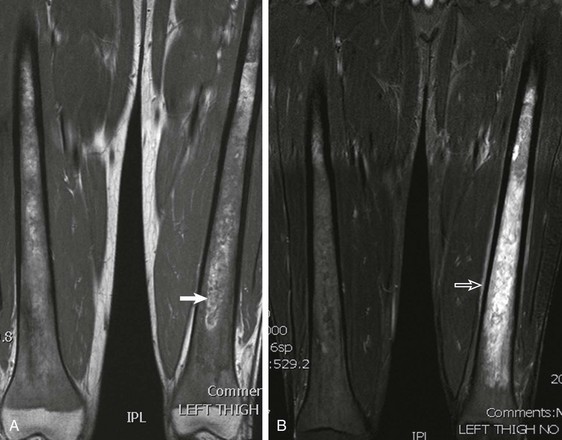
Figure 142-26 20-year-old man with sickle cell disease with acute bone infarction.
A, T1-weighted coronal image shows diffuse red marrow of the metaphyses and diaphyses. Hyperintense foci are apparent within the medullary cavity (arrow), presumably representing sequestered blood. B, Short tau inversion recovery coronal image shows diffuse marrow edema and periostitis (open arrow), consistent with acute bone infarction.
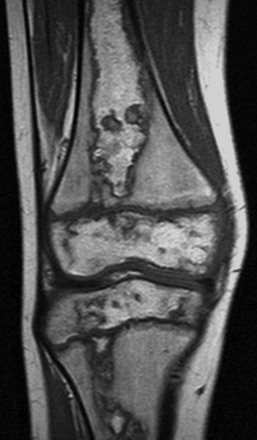
Figure 142-27 Diffuse osteonecrosis in an 11-year-old boy.
T1-weighted coronal image shows diaphyseal, metaphyseal, and epiphyseal involvement of osteonecrosis. Note central areas of increased signal intensity within the areas of osteonecrosis, believed to represent fatty marrow conversion.
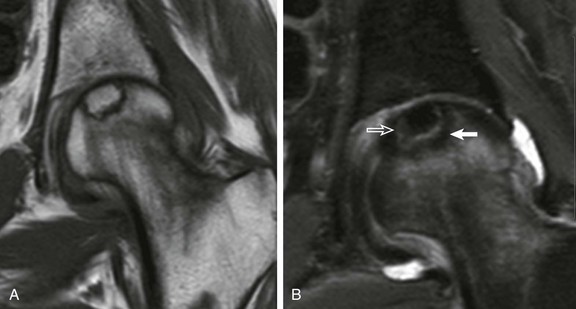
Figure 142-28 Epiphyseal osteonecrosis of the femoral head in an 18-year-old woman.
T1-weighted (A) and short tau inversion recovery coronal images (B) demonstrate a “double-line sign” with inner white line (open arrow) and outer dark line (solid arrow). Note central area of increased T1 signal consistent with fatty marrow replacement.
Imaging findings of epiphyseal osteonecrosis related to other causes are indistinguishable from those of LCP, which progresses through four main stages: 1) avascularity, 2) revascularization, 3) healing, and 4) residual deformity (e-Fig. 142-29). Early radiographic diagnosis is based on the detection of periarticular osteoporosis, medial joint space widening and lateral displacement of the femoral head, and eventually a relatively smaller and denser appearance of the femoral head.77,78
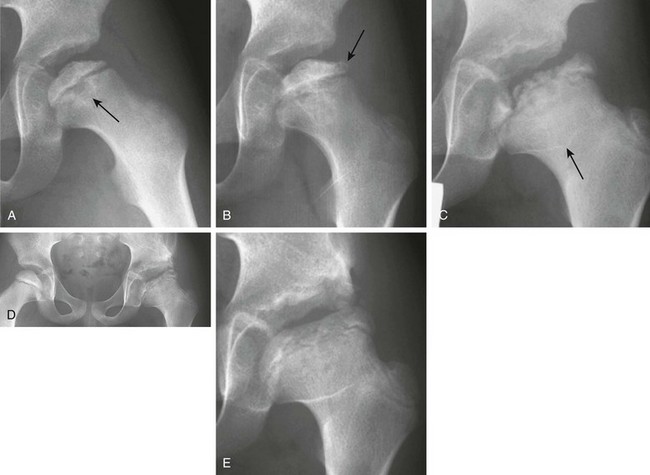
e-Figure 142-29 Osteonecrosis of the left proximal femoral epiphysis in a 7-year-old boy with a limp.
A, Radiograph of the left hip reveals a small, sclerotic proximal femoral epiphysis with an irregular articular surface. The metaphysis of the proximal femur also shows cystic changes (arrow), which indicates a poor prognosis. B, Radiograph performed 2 months later shows continued sclerosis and flattening, particularly laterally. Very early fragmentation of the epiphysis is noted in the lateral pillar (arrow). C, At 18 months after presentation, a radiograph of the left hip reveals further fragmentation with continued lateral extrusion of the epiphysis. The acetabulum is beginning to impinge on the portion of the lateral column that is uncovered, and incongruence of the hip joint is apparent. The “sagging rope sign” (arrow) is produced by the outline of an abnormally oriented physis, which indicates growth arrest, and widening of the femoral neck is seen (coxa magna). D, At 25 months after diagnosis, a left iliac osteotomy is evident, attempting to cover the widened, flattened, left capital femoral epiphysis that is starting to coalesce. Early sclerosis of the right proximal femoral epiphysis indicates early avascular necrosis in the contralateral hip. E, At 3 years after presentation, the left hip radiograph shows healed Legg-Calvé-Perthes disease with residual flattening, coxa magna, and an irregular acetabulum.
During the revascularization stage, which lasts from 1 to 4 years, surrounding tissues react to the dead bone. In this stage, the child experiences pain, and the most dramatic radiographic changes occur.79 The ossific nucleus appears even denser because of new bone formation that occurs within the dead trabeculae; it is easily flattened and deformed. A pathologic subchondral fracture in the anterosuperior ossific nucleus creates the radiographic “crescent sign.” The epiphyseal ossification center undergoes varying degrees of fragmentation, primarily in its central portion (e-Fig. 142-30). The adjacent metaphysis sometimes develops cystic changes and broadens. Disturbed endochondral ossification from ischemia probably results in residual cartilage in the metaphysis.80
e-Figure 142-30 A 10-year-old boy with left Legg-Calvé-Perthes disease.
A, Coronal T1-weighted magnetic resonance (MR) imaging reveals crescentic low signal in the left proximal femoral epiphysis with irregularity of the articular surface. Epiphyseal height is also decreased. Some normal high signal is present, indicating preserved fat in the epiphysis. The lateral left femoral metaphysis reveals a rounded area of lower signal, indicating cystic changes. Additionally, cartilaginous hypertrophy is evident within the left hip joint that often accounts for apparent radiographic joint space widening. B, Sagittal T2-weighted fat-saturated MR image shows a hyperintense crescentic fracture (white arrow) along the anterior portion of the left femoral epiphysis with an associated joint effusion.
Treatment: Treatment is aimed at managing the underlying condition or modifying administration of the causative agent, such as decreasing corticosteroid dosage. Resting the affected joint may help slow disease progression and may prevent complications, including pathologic fractures. Children with osteonecrosis are predisposed to pathologic fractures, and subchondral collapse occurs with epiphyseal osteonecrosis and pathologic long-bone fractures with nonepiphyseal involvement. For epiphyseal osteonecrosis, the most important predictors of patient outcome, aside from age of onset, are joint congruency and motion.
Treatment of LCP is individualized on the basis of clinical and radiographic findings, including age of onset, range of motion in the hip joint, extent of femoral head involvement, presence or absence of femoral deformity, and lateral subluxation of the femoral head. For many patients, a combination of traction treatment with an abduction cast, nonsteroidal antiinflammatory agents, and gentle range-of-motion exercises are used to enhance molding of the femoral head by the acetabulum. Surgery is indicated in children younger than 8 years who have femoral head deformity and in those older than 8 years even in the absence of deformity. Because LCP often affects the proximal femoral physeal vertex while preserving normal medial physeal physiology, a relative coxa valga may develop related to vertex physeal growth disturbance. As a consequence, surgical reduction to contain the femoral head is often indicated, including subtrochanteric varus osteotomies with or without congruent periacetabular shelf osteotomies, particularly in older patients (second decade). The main goals of surgical therapy are to preserve joint congruity during the active phase of the disease and to contain the femoral head within the acetabulum, preventing extrusion and subluxation. A femoral head that is contained by the acetabulum tends to heal more spherically than one that is partially subluxed. In severe cases, a vicious cycle ensues in which decreased containment leads to increased deformity that in turn leads to further subluxation. Surgery can prevent this progression and can be used to maintain a full range of motion at the hip joint.81
Effects of Therapy
Etiology, Pathophysiology, and Clinical Presentation: Hematopoietic growth factors such as G-CSF, GM-CSF, and erythropoietin are cytokines that regulate the proliferation and differentiation of hematopoietic progenitor cells in the bone marrow.82,83 Recombinant human hematopoietic growth factors are commonly used to hasten the recovery of hematopoietic marrow from myelosuppressive chemotherapy or bone marrow failure syndromes and to stimulate more effective myelopoiesis in GSD1b.45
Imaging: In those treated with G-CSF or GM-CSF, MRI will show signal intensity changes associated with reconversion of fatty marrow to hypercellular hematopoietic marrow that coincide temporally with increases in the absolute neutrophil count. These changes may be observed incidentally on routine imaging studies or on imaging studies prompted by bone pain accompanying G-CSF administration.25 As in other instances of marrow hyperplasia, the imaging changes follow a signal intensity similar to that of red marrow. GRE out-of-phase sequences designed to detect altered proportions of fat and water may be the most sensitive for the effects of G-CSF therapy. The peak of hematopoietic marrow hyperplasia observed by MRI occurs about 2 weeks after discontinuation of G-CSF administration, and the bone marrow alterations normalize in most patients within 6 weeks after treatment. The marrow changes may be diffuse, patchy, or have a masslike appearance, and they can be asymmetric and simulate bone marrow involvement by leukemia, metastatic disease, or other infiltrative process.66 The masslike appearance of red marrow on T1-weighted images may have well-defined margins rather than the wisplike, feathery appearance of residual red marrow (see Fig. 142-5). Marrow changes as a result of G-CSF may not follow the typical red marrow pattern of reconversion seen in patients who are anemic. For instance, diaphyseal red marrow islands may appear before metaphyseal red marrow changes are seen. The changes can also obscure underlying marrow lesions.84 Masslike marrow replacement owing to G-CSF usually is not associated with juxtacortical soft tissue edema at the same level of the lesion that is more likely with metastatic marrow replacement. Consideration of the timing of the therapy and imaging is necessary to avoid misinterpretation of the marrow changes (see Fig. 142-7).
Similarly, FDG-PET, 99mTc sulfur colloid scintigraphy, gallium-67 scintigraphy, and thallium-201 scintigraphy can show elevated radiopharmaceutical uptake by the stimulated hematopoietic marrow (Fig. 142-31). Large interindividual variability is seen in marrow FDG uptake induced by hematopoietic growth factors. FDG marrow uptake returns to normal within 1 month after the discontinuation of G-CSF treatment in most individuals.84
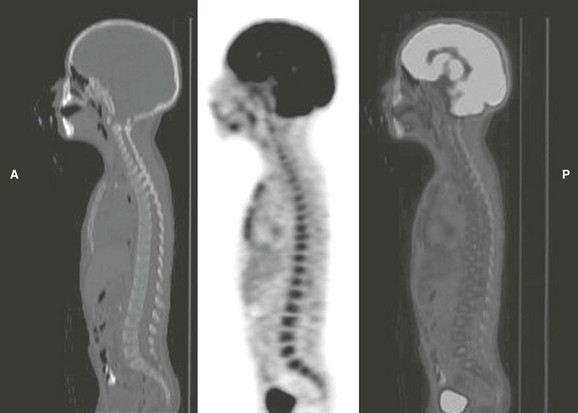
Figure 142-31 Fluorodeoxyglucose positron-emission tomography (FDG-PET) computed tomographic images of a 4-year-old boy on granulocyte-colony stimulating factor therapy to mitigate the myelosuppressive effects of Wilms tumor treatment.
Diffuse increased uptake of FDG by the bone marrow of the spine and sternum reflects the increased metabolic demand from stimulation of granulopoiesis in the marrow. (Courtesy Dr. Barry Shulkin, St. Jude Children’s Research Hospital, Memphis, TN.)
Radiation Therapy
Etiology, Pathophysiology, and Clinical Presentation: In the acute phase, radiation therapy causes depression of the marrow cellularity and vascular sinusoid injury with edema and hemorrhage.85 In the chronic phase, the vascular sinusoids are obliterated, and hematopoietic marrow is replaced by fat and fibrosis.86
The process of fatty replacement of the marrow is largely irreversible for doses higher than 30 to 40 Gy, because destruction of the vascular sinusoids prevents migration of hematopoietic cells into the irradiated marrow.6 For doses less than 30 to 40 Gy, the fatty replacement of the marrow is less complete, because regeneration of the hematopoietic marrow may occur. This regeneration of hematopoietic marrow manifests as a mottled or band pattern in the vertebrae of children between 11 and 30 months after spinal irradiation of doses no greater than 40 Gy, and similar findings have been observed in the marrow of the long bones after irradiation.87 Marrow regeneration is more likely to occur with larger volumes of irradiated marrow, suggesting that partial spinal irradiation may not provide enough stimuli for regeneration, because the nonirradiated marrow is sufficient to meet hematopoietic demands.87
Imaging: STIR sequences are the most sensitive conventional MRI technique for depicting early postradiation changes in the marrow, and they can detect the effects of radiation therapy within a few days after initiation of treatment.6 Areas of increased signal intensity in the marrow on STIR sequences peak 9 days after therapy and reflect edema, hemorrhage, and early influx of nonirradiated cells.4,25,84 T1-weighted sequences in the acute phase show a corresponding decrease in the signal intensity of the bone marrow and a corresponding increased signal intensity on STIR sequences indicative of marrow edema. From 2 to 6 weeks after irradiation, the signal intensity of the bone marrow begins to increase on T1-weighted sequences and decrease on STIR sequences (Fig. 142-32).84 After 6 weeks, the marrow pattern either becomes more homogeneous, with high signal intensity on T1-weighted sequences and low signal intensity on STIR sequences, or it develops a band pattern of peripheral intermediate signal intensity surrounding central high signal intensity on T1-weighted sequences and produces reciprocal changes on STIR sequences.84,87 In the chronic phase, the marrow also shows a marked decrease in contrast enhancement, reflecting vascular obliteration.25,85
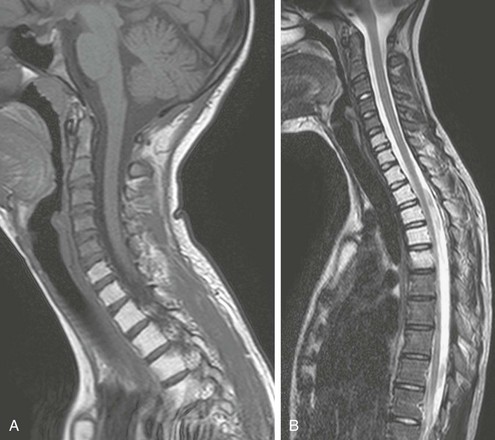
Figure 142-32 Fifteen-year-old girl with a history of local radiation therapy for an extraosseous Ewing sarcoma of the left supraclavicular region.
Sagittal T1-weighted (A) and turbo spin echo T2-weighted (B) magnetic resonance imaging of the upper spine reveals sharply demarcated, homogeneous high signal intensity of the marrow of the lower cervical spine, upper thoracic spine, and upper sternum that corresponds to fatty transformation of the marrow within the irradiated field.
Marrow regeneration after radiation usually occurs when less than 40 Gy is administered.87 Marrow fibrosis is more likely to occur when more than 40 Gy is administered. Additional late changes after radiation therapy include osteonecrosis and radiation-induced osteochondromas.25
Bone Marrow Transplantation
Etiology, Pathophysiology, and Clinical Presentation: Bone marrow transplantation is used in the treatment of numerous pediatric malignancies, as well as severe aplastic anemia, hereditary hemoglobinopathies, inborn errors of metabolism, and certain immunodeficiency and autoimmune syndromes. In preparation for bone marrow transplantation, the host marrow is ablated and conditioned by chemotherapy and possibly also by fractionated total-body irradiation to induce immune suppression and eliminate residual malignant cells, if applicable. Stem cells are then infused intravenously and engraft in the marrow within 2 to 4 weeks. Typical fatty and hematopoietic bone marrow is usually seen within 90 days after transplantation.4
Imaging: In the interval following bone marrow transplantation, until the recovery of hematopoiesis, hematopoietic growth factors and multiple blood transfusions may be given, and the appearance of the marrow on MRI during this time will reflect the combined effects of marrow necrosis, early hematopoietic reconstitution, and possibly iron overload.88,89
Within 40 to 90 days after transplantation, a band pattern in the vertebral bodies may develop, consisting of a peripheral zone of intermediate signal intensity and a central zone of high signal intensity on T1-weighted sequences with reciprocal signal intensities on STIR sequences.88 This pattern corresponds to regenerating hematopoietic marrow peripherally and fatty marrow centrally. The band pattern may gradually evolve into a homogeneous appearance of the marrow.6 However, the hematopoietic marrow recovery after bone marrow transplantation may not achieve full reconstitution, corroborated by the observation that the fat fraction in the vertebral and pelvic marrow determined by chemical-shift MRI is higher in transplanted patients for several years after transplantation.25
 What the Clinician Needs to Know
Burdiles, A, Babyn, PS. Pediatric bone marrow MR imaging. Magn Reson Imaging Clin N Am. 2009;17(3):391–409.
Fletcher, BD. Effects of pediatric cancer therapy on the musculoskeletal system. Pediatr Radiol. 1997;27(8):623–636.
Foster, K, Chapman, S, Johnson, K. MRI of the marrow in the paediatric skeleton. Clin Radiol. 2004;59(8):651–673.
Jaramillo, D, Kasser, JR, Villegas-Medina, OL, et al. Cartilaginous abnormalities and growth disturbances in Legg-Calvé-Perthes disease: evaluation with MR imaging. Radiology. 1995;197(3):767–773.
Saini, A, Saifuddin, A. MRI of osteonecrosis. Clin Radiol. 2004;59(12):1079–1093.
Vande Berg, BC, Malghem, J, Lecouvet, FE, et al. Magnetic resonance imaging of normal bone marrow. Eur Radiol. 1998;8(8):1327–1334.
References
1. Vande Berg, BC, Malghem, J, Lecouvet, FE, et al. Magnetic resonance imaging of normal bone marrow. European radiology. 1998;8(8):1327–1334.
2. Richardson, ML, Patten, RM. Age-related changes in marrow distribution in the shoulder: MR imaging findings. Radiology. 1994;192(1):209–215.
3. Okada, Y, Aoki, S, Barkovich, AJ, et al. Cranial bone marrow in children: assessment of normal development with MR imaging. Radiology. 1989;171(1):161–164.
4. Foster, K, Chapman, S, Johnson, K. MRI of the marrow in the paediatric skeleton. Clin Radiol. 2004;59(8):651–673.
5. Moore, SG, Dawson, KL. Red and yellow marrow in the femur: age-related changes in appearance at MR imaging. Radiology. 1990;175(1):219–223.
6. Moulopoulos, LA, Dimopoulos, MA. Magnetic resonance imaging of the bone marrow in hematologic malignancies. Blood. 1997;90(6):2127–2147.
7. Baur, A, Stabler, A, Bartl, R, et al. MRI gadolinium enhancement of bone marrow: age-related changes in normals and in diffuse neoplastic infiltration. Skeletal Radiol. 1997;26(7):414–418.
8. Dwek, JR, Shapiro, F, Laor, T, et al. Normal gadolinium-enhanced MR images of the developing appendicular skeleton: Part 2. Epiphyseal and metaphyseal marrow. AJR. 1997;169(1):191–196.
9. Mirowitz, SA, Apicella, P, Reinus, WR, et al. MR imaging of bone marrow lesions: relative conspicuousness on T1-weighted, fat-suppressed T2-weighted, and STIR images. AJR. 1994;162(1):215–221.
10. Ghanem, N, Uhl, M, Brink, I, et al. Diagnostic value of MRI in comparison to scintigraphy, PET, MS-CT and PET/CT for the detection of metastases of bone. Eur J Radiol. 2005;55(1):41–55.
11. Schmidt, GP, Schoenberg, SO, Reiser, MF, et al. Whole-body MR imaging of bone marrow. Eur J Radiol. 2005;55(1):33–40.
12. Schmidt, GP, Reiser, MF, Baur-Melnyk, A. Whole-body imaging of bone marrow. Semin Musculoskelet Radiol. 2009;13(2):120–133.
13. Goo, HW, Choi, SH, Ghim, T, et al. Whole-body MRI of paediatric malignant tumours: comparison with conventional oncological imaging methods. Pediatr Radiol. 2005;35(8):766–773.
14. Jaramillo, D. Whole-body MR imaging, bone diffusion imaging: how and why? Pediatr Radiol. 2010;40(6):978–984.
15. Kwee, TC, Takahara, T, Vermoolen, MA, et al. Whole-body diffusion-weighted imaging for staging malignant lymphoma in children. Pediatr Radiol. 2010;40(10):1592–1602. [quiz 1720-1591].
16. Raya, JG, Dietrich, O, Reiser, MF, et al. Techniques for diffusion-weighted imaging of bone marrow. Eur J Radiol. 2005;55(1):64–73.
17. Nonomura, Y, Yasumoto, M, Yoshimura, R, et al. Relationship between bone marrow cellularity and apparent diffusion coefficient. J Magn Reson Imaging. 2001;13(5):757–760.
18. Herneth, AM, Friedrich, K, Weidekamm, C, et al. Diffusion weighted imaging of bone marrow pathologies. Eur J Radiol. 2005;55(1):74–83.
19. Daldrup-Link, HE, Franzius, C, Link, TM, et al. Whole-body MR imaging for detection of bone metastases in children and young adults: comparison with skeletal scintigraphy and FDG PET. AJR. 2001;177(1):229–236.
20. Fritz, J, Tzaribatchev, N, Claussen, CD, et al. Chronic recurrent multifocal osteomyelitis: comparison of whole-body MR imaging with radiography and correlation with clinical and laboratory data. Radiology. 2009;252(3):842–851.
21. Goo, HW, Yang, DH, Ra, YS, et al. Whole-body MRI of Langerhans cell histiocytosis: comparison with radiography and bone scintigraphy. Pediatr Radiol. 2006;36(10):1019–1031.
22. Mayani, H, Alvarado-Moreno, JA, Flores-Guzman, PF. Biology of human hematopoietic stem and progenitor cells present in circulation. Archies of Medical Research. 2003;34:476–488.
23. Ricci, C, Cova, M, Kang, YS, et al. Normal age-related patterns of cellular and fatty bone marrow distribution in the axial skeleton: MR imaging study. Radiology. 1990;177(1):83–88.
24. Waitches, G, Zawin, JK, Poznanski, AK. Sequence and rate of bone marrow conversion in the femora of children as seen on MR imaging: are accepted standards accurate? AJR. 1994;162(6):1399–1406.
25. Fletcher, BD. Effects of pediatric cancer therapy on the musculoskeletal system. Pediatr Radiol. 1997;27(8):623–636.
26. Jaramillo, D, Laor, T, Hoffer, FA, et al. Epiphyseal marrow in infancy: MR imaging. Radiology. 1991;180(3):809–812.
27. Zawin, JK, Jaramillo, D. Conversion of bone marrow in the humerus, sternum, and clavicle: changes with age on MR images. Radiology. 1993;188(1):159–164.
28. Mirowitz, SA. Hematopoietic bone marrow within the proximal humeral epiphysis in normal adults: investigation with MR imaging. Radiology. 1993;188(3):689–693.
29. Shabshin, N, Schweitzer, ME, Morrison, WB, et al. High-signal T2 changes of the bone marrow of the foot and ankle in children: red marrow or traumatic changes? Pediatr Radiol. 2006;36(7):670–676.
30. Dawson, KL, Moore, SG, Rowland, JM. Age-related marrow changes in the pelvis: MR and anatomic findings. Radiology. 1992;183(1):47–51.
31. Sebag, GH, Dubois, J, Tabet, M, et al. Pediatric spinal bone marrow: assessment of normal age-related changes in the MRI appearance. Pediatr Radiol. 1993;23(7):515–518.
32. Simonson, TM, Kao, SC. Normal childhood developmental patterns in skull bone marrow by MR imaging. Pediatr Radiol. 1992;22(8):556–559.
33. Nobauer, I, Uffmann, M. Differential diagnosis of focal and diffuse neoplastic diseases of bone marrow in MRI. Eur J Radiol. 2005;55(1):2–32.
34. Kan, JH, Hernanz-Schulman, M, Frangoul, HA, et al. MRI diagnosis of bone marrow relapse in children with ALL. Pediatr Radiol. 2008;38:76–81.
35. Haidar, R, Musallam, KM, Taher, AT. Bone disease and skeletal complications in patients with beta thalassemia major. Bone. 2011;48:425–432.
36. Tyler, PA, Madani, G, Chaudhuri, R, et al. The radiological appearances of thalassaemia. Clin Radiol. 2006;61:40–52.
37. Levin, TL, Sheth, SS, Ruzal-Shapiro, C, et al. MRI marrow observations in thalassemia: the effects of the primary disease, transfusional therapy, and chelation. Pediatr Radiol. 1995;25(8):607–613.
38. Aflalo-Hazan, V, Gutman, F, Kerrou, K, et al. Increased FDG uptake by bone marrow in major beta-thalassemia. Clin Nucl Med. 2005;30(11):754–755.
39. Manci, EA, Culberson, DE, Gardner, JM, et al. Perivascular fibrosis in the bone marrow in sickle cell disease. Arch Pathol Lab Med. 2004;128(6):634–639.
40. Mankad, VN, Williams, JP, Harpen, MD, et al. Magnetic resonance imaging of bone marrow in sickle cell disease: clinical, hematologic, and pathologic correlations. Blood. 1990;75(1):274–283.
41. Ejindu, VC, Hine, AL, Mashayekhi, M, et al. Musculoskeletal manifestations of sickle cell disease. Radiographics. 2007;27:1005–1021.
42. Bonnerot, V, Sebag, G, de Montalembert, M, et al. Gadolinium-DOTA enhanced MRI of painful osseous crises in children with sickle cell anemia. Pediatr Radiol. 1994;24(2):92–95.
43. Jain, R, Sawhney, S, Rizvi, SG. Acute bone crises in sickle cell disease: the T1 fat-saturated sequence in differentiation of acute bone infarcts from acute osteomyelitis. Clin Radiol. 2008;63(1):59–70.
44. Field, JJ, Knight-Perry, JE, Debaun, MR. Acute pain in children and adults with sickle cell disease: management in the absence of evidence-based guidelines. Curr Opin Hematol. 2009;16:173–178.
45. Scherer, A, Engelbrecht, V, Neises, G, et al. MR imaging of bone marrow in glycogen storage disease type IB in children and young adults. AJR. 2001;177(2):421–425.
46. Preger, L, Sanders, GW, Gold, RH, et al. Roentgenographic skeletal changes in the glycogen storage diseases. Am J Roentgenol Radium Ther Nucl Med. 1969;107(4):840–847.
47. Miller, JH, Stanley, P, Gates, GF. Radiography of glycogen storage diseases. AJR. 1979;132(3):379–387.
48. Bali, DS, Chen, YT, Goldstein, JL. Glycogen Storage Disease Type I. GeneReviews. 2006.
49. Wenstrup, RJ, Roca-Espiau, M, Weinreb, NJ, et al. Skeletal aspects of Gaucher disease: a review. Br J Radiol. 2002;75(Suppl 1):A2–12.
50. Katz, R, Booth, T, Hargunani, R, et al. Radiological aspects of Gaucher disease. Skeletal Radiol. 2011;40(12):1505–1513.
51. Maas, M, Poll, LW, Terk, MR. Imaging and quantifying skeletal involvement in Gaucher disease. Br J Radiol. 2002;75(Suppl 1):A13–A24.
52. Allison, JW, James, CA, Arnold, GL, et al. Reconversion of bone marrow in Gaucher disease treated with enzyme therapy documented by MR. Pediatr Radiol. 1998;28(4):237–240.
53. Guillerman, RP, Voss, SD, Parker, BR. Leukemia and lymphoma. Radiologic clinics of North America. 2011;49(4):767–797. [vii].
54. Greaves, M. In utero origins of childhood leukaemia. Early Hum Dev. 2005;81(1):123–129.
55. Altekruse, SF, Kosary, CL, Krapcho, M. SEER cancer statistics review, 1975–2007, National Cancer Institute. Bethesda (MD), based on November 2009 SEER data submission, posted to the SEER Web site, 2010. Available at http://seer.cancer.gov/csr/1975_2007/. [Accessed September 7, 2010].
56. Dainiak, N. Hematologic consequences of exposure to ionizing radiation. Exp Hematol. 2002;30(6):513–528.
57. Pearce, MS, Salotti, JA, Little, MP, et al. Radiation exposure from CT scans in childhood and subsequent risk of leukaemia and brain tumours: a retrospective cohort study. Lancet. 2012.
58. Moore, SG, Gooding, CA, Brasch, RC, et al. Bone marrow in children with acute lymphocytic leukemia: MR relaxation times. Radiology. 1986;160(1):237–240.
59. Jensen, KE, Thomsen, C, Henriksen, O, et al. Changes in T1 relaxation processes in the bone marrow following treatment in children with acute lymphoblastic leukemia. A magnetic resonance imaging study. Pediatr Radiol. 1990;20(6):464–468.
60. Vande Berg, BC, Michaux, L, Scheiff, JM, et al. Sequential quantitative MR analysis of bone marrow: differences during treatment of lymphoid versus myeloid leukemia. Radiology. 1996;201(2):519–523.
61. Takagi, S, Tanaka, O, Miura, Y. Magnetic resonance imaging of femoral marrow in patients with myelodysplastic syndromes or leukemia. Blood. 1995;86(1):316–322.
62. Sinigaglia, R, Gigante, C, Bisinella, G, et al. Musculoskeletal manifestations in pediatric acute leukemia. J Pediatr Orthop. 2008;28:20–28.
63. Vora, A. Management of osteonecrosis in children and young adults with acute lymphoblastic leukaemia. Br J Haematol. 2011;155(5):549–560.
64. Rayar, MS, Nayiager, T, Webber, CE, et al. Predictors of bony morbidity in children with acute lymphoblastic leukemia. Pediatr Blood Cancer. 2012;59(1):77–82.
65. Kan, JH, Hernanz-Schulman, M, Frangoul, HA, Connolly, SA. MRI diagnosis of bone marrow relapse in children with ALL. Pediatr Radiol. 2008;38(1):76–81.
66. Fletcher, BD, Wall, JE, Hanna, SL. Effect of hematopoietic growth factors on MR images of bone marrow in children undergoing chemotherapy. Radiology. 1993;189(3):745–751.
67. Vande Berg, BC, Lecouvet, FE, Michaux, L, et al. Magnetic resonance imaging of the bone marrow in hematological malignancies. European radiology. 1998;8(8):1335–1344.
68. Benz-Bohm, G, Gross-Fengels, W, Bohndorf, K, et al. MRI of the knee region in leukemic children. Part II. Follow up: responder, non-responder, relapse. Pediatr Radiol. 1990;20(4):272–276.
69. Miles, RR, Arnold, S, Cairo, MS. Risk factors and treatment of childhood and adolescent Burkitt lymphoma/leukaemia. Br J Haematol. 2012;156(6):730–743.
70. Krishnan, A, Shirkhoda, A, Tehranzadeh, J, et al. Primary bone lymphoma: radiographic-MR imaging correlation. Radiographics. 2003;23(6):1371–1383. [discussion 1384-1377].
71. Mulligan, ME, McRae, GA, Murphey, MD. Imaging features of primary lymphoma of bone. AJR. 1999;173(6):1691–1697.
72. Even-Sapir, E. Imaging of malignant bone involvement by morphologic, scintigraphic, and hybrid modalities. J Nucl Med. 2005;46(8):1356–1367.
73. Beal, K, Allen, L, Yahalom, J. Primary bone lymphoma: treatment results and prognostic factors with long-term follow-up of 82 patients. Cancer. 2006;106(12):2652–2656.
74. Saini, A, Saifuddin, A. MRI of osteonecrosis. Clin Radiol. 2004;59(12):1079–1093.
75. Barker, DJ, Hall, AJ, The epidemiology of Perthes’ disease. Clin Orthop Relat Res, 1986;209:89–94.
76. Wiig, O, Terjesen, T, Svenningsen, S, et al. The epidemiology and aetiology of Perthes’ disease in Norway. A nationwide study of 425 patients. J Bone Joint Surg Br. 2006;88(9):1217–1223.
77. Caffey, J. The early roentgenographic changes in essential coxa plana: their significance in pathogenesis. Am J Roentgenol Radium Ther Nucl Med. 1968;103(3):620–634.
78. Jaramillo, D, Galen, TA, Winalski, CS, et al. Legg-Calve-Perthes disease: MR imaging evaluation during manual positioning of the hip—comparison with conventional arthrography. Radiology. 1999;212(2):519–525.
79. Frick, SL. Evaluation of the child who has hip pain. Orthop Clin North Am. 2006;37(2):133–140. [v].
80. Jaramillo, D, Kasser, JR, Villegas-Medina, OL, et al. Cartilaginous abnormalities and growth disturbances in Legg-Calve-Perthes disease: evaluation with MR imaging. Radiology. 1995;197(3):767–773.
81. Herring, JA, Kim, HT, Browne, R. Legg-Calve-Perthes disease. Part II: Prospective multicenter study of the effect of treatment on outcome. J Bone Joint Surg Am. 2004;86-A(10):2121–2134.
82. van de Laar, L, Coffer, PJ, Woltman, AM. Regulation of dendritic cell development by GM-CSF: molecular control and implications for immune homeostasis and therapy. Blood. 2012;119:3383–3393.
83. Held, TK, Gundert-Remy, U. Pharmacodynamic effects of haematopoietic cytokines: the view of a clinical oncologist. Basic Clin Pharmacol Toxicol. 2010;106:210–214.
84. Kazama, T, Swanston, N, Podoloff, DA, et al. Effect of colony-stimulating factor and conventional- or high-dose chemotherapy on FDG uptake in bone marrow. Eur J Nucl Med Mol Imaging. 2005;32(12):1406–1411.
85. Otake, S, Mayr, NA, Ueda, T, et al. Radiation-induced changes in MR signal intensity and contrast enhancement of lumbosacral vertebrae: do changes occur only inside the radiation therapy field? Radiology. 2002;222(1):179–183.
86. Stevens, SK, Moore, SG, Kaplan, ID. Early and late bone-marrow changes after irradiation: MR evaluation. AJR. 1990;154(4):745–750.
87. Reference deleted in proofs.
88. Stevens, SK, Moore, SG, Amylon, MD. Repopulation of marrow after transplantation: MR imaging with pathologic correlation. Radiology. 1990;175(1):213–218.
89. Kornreich, L, Horev, G, Yaniv, I, et al. Iron overload following bone marrow transplantation in children: MR findings. Pediatr Radiol. 1997;27(11):869–872.
[/level-membership-for-pediatrics-category][not-level-membership-for-pediatrics-category]Chapter 142
Skeletal Manifestations of Systemic Disease
Normal Bone Marrow
Bone marrow is one of the largest and most dynamic tissues in the body. Its functions include the production of red and white blood cells and platelets for tissue oxygenation, cellular immunity, and blood coagulation, respectively. Bone marrow occupies approximately 85% of the medullary cavity and is supported by a network of trabecular bone.1 In addition to hematopoietic elements, it contains stromal cells, collagen, nerves, and a variable amount of fat.
Function and Composition
Physiology: On gross examination, bone marrow may be red because of hemoglobin in the erythrocytes and their precursors, indicating active hematopoietic marrow, or it may be yellow as a result of the presence of carotenoid derivatives dissolved in fat droplets within adipocytes.1 Hematopoietic marrow is rich in vascular sinusoids, whereas fatty marrow is considerably less vascular. During periods of decreased hematopoiesis, the fat cells increase in size and number. During periods of increased hematopoiesis, the fat cells atrophy.
The cellularity of bone marrow diminishes most rapidly in the first two decades of life. The cellularity of hematopoietic marrow is near l00% at birth and decreases to 50% to 75% by 15 years of age. By adulthood, the hematopoietic marrow is composed of approximately 40% fat, 40% water, and 20% protein, with 60% of cells being hematopoietic and 40% being adipocytes.1 In contrast, the fatty marrow is composed of 80% fat, 15% water, and 5% protein, with 95% of cells being adipocytes (e-Fig. 142-1).1,2
e-Figure 142-1 Histologic sections of normal bone marrow (hematoxylin-eosin, ×75).
A, Hematopoietic elements and bony trabeculae of hematopoietic marrow with few adipocytes (arrow). B, Fatty marrow contains numerous adipocytes. (From Babyn PS, Ranson M, McCarville ME. Normal bone marrow: signal characteristics and fatty conversion. Magn Reson Imaging Clin N Am. 1998;6:474.)
Imaging: Conventional radiography, computed tomography, and ultrasonography are of limited value in the assessment of bone marrow.3 Since the first reports of magnetic resonance imaging (MRI) of the marrow in children were published in 1984, MRI has emerged as the primary imaging modality to evaluate the bone marrow. It provides a noninvasive method for visualizing the gross anatomic structure of a large sample of the bone marrow and for inferring alterations in its chemical and cellular composition related to a variety of physiologic and pathologic processes. Furthermore, MRI can provide valuable information about regions of the bone marrow that may be inaccessible or difficult to biopsy.
The constituents of bone marrow that contribute to the signal characteristics on MRI are fat, water, and, to a lesser extent, mineralized matrix.3 Fat is the dominant contributor to both hematopoietic and fatty marrow signal intensity patterns. Most fat protons are in hydrophobic methylene (−CH2-) groups of relatively heavy molecular complexes, conferring very efficient spin-lattice relaxation; this results in a short T1 relaxation time, which results in high signal intensity on T1-weighted sequences.1 The T2 relaxation time of fat is much shorter than that of free water protons, and water contributes much more to the signal intensity of hematopoietic marrow than fatty marrow.1 The mineralized matrix of bone has a low density of hydrogen protons that lack mobility within the crystalline structure of bone, accounting for very long T1 and short T2 relaxation times and low signal intensity of mineralized matrix on T1- and T2-weighted sequences. In addition, local field gradients at the trabecular surface are generated by the fixed dipole from the immobile protons and cause magnetic field inhomogeneity. This magnetic susceptibility effect, as well as that resulting from iron deposition, can play a large role in the signal characteristics of hematopoietic and fatty marrow on gradient echo (GRE) images.1
The normal intervertebral disks, skeletal muscle, and subcutaneous fat have little interindividual and intraindividual variation in signal intensity on T1-weighted sequences during childhood and consequently serve as convenient internal reference standards for comparison with the signal intensity of the marrow.1,4 Fatty marrow has high signal intensity on conventional spin echo T1-weighted sequences. The relative amounts of fat, water, and protein contribute in a complex fashion to produce a longer T1 relaxation time in hematopoietic marrow, with signal intensity that ranges from intermediate to low (less than that of muscle or intervertebral disks) in fat-poor hematopoietic marrow to intermediate to high (greater than that of muscle or the intervertebral disks but less than that of subcutaneous fat) in hematopoietic marrow with larger proportions of fat.1,5 In neonates, hematopoietic marrow contains minimal fat and has low signal intensity on T1-weighted sequences. With aging, hematopoietic marrow signal intensity progressively increases on T1-weighted sequences, reflecting a progressive increase in fat content. After the neonatal period, hematopoietic marrow has signal intensity equal to or slightly greater than muscle and the intervertebral disks but much less than subcutaneous fat on T1-weighted sequences, whereas fatty marrow approaches the signal intensity of subcutaneous fat on T1-weighted sequences.5 Because of the similar proton densities of hematopoietic and fatty marrow, proton density sequences without fat suppression are less useful than T1-weighted sequences.6
The signal characteristics of marrow are highly variable on GRE sequences, with which images that exploit chemical shift can be obtained by choosing an echo time in which the phases of relaxing water and fat protons are either opposed 180° (out-of-phase or opposed-phase sequences) or coincide (in-phase sequences) related to differences in their resonance frequencies.1 When hematopoietic marrow contains approximately equivalent amounts of water and fat, as in normal adults, the signal intensity is markedly diminished on opposed-phase T1-weighted sequences, compared with in-phase T1-weighted sequences, as a result of intravoxel chemical shift effect.1 When the amount of fat and water is no longer balanced, for example, in fatty marrow or in edematous or hypercellular hematopoietic marrow, the marrow signal intensity does not show such a profound difference between the opposed-phase and in-phase T1-weighted images.1 Magnetic susceptibility effect from trabecular bone and iron leads to a lower signal intensity of the marrow on GRE T2*-weighted sequences than on spin echo sequences.
The degree of contrast enhancement of normal marrow varies with the contrast dose, timing of image acquisition following contrast administration, the age of the patient, and the composition of the marrow. Marrow enhancement peaks within a minute of contrast administration and then slowly declines.7 Enhancement is greater in children than in adults, greater in the metaphyses than in the epiphyses, and greater in hematopoietic marrow than in fatty marrow. Enhancement can be imperceptible by visual inspection in the marrow of adults and in the marrow of the epiphyses in patients aged more than 2 years. Interindividual variation in the degree of enhancement is also substantial.7 If gadolinium-enhanced T1-weighted sequences are acquired without fat suppression, contrast between hematopoietic and fatty marrow is decreased, which potentially obscures marrow lesions or age-related marrow conversion changes.8 Image-subtraction and fat-suppression techniques facilitate the detection of abnormal marrow enhancement on postcontrast T1-weighted sequences.6
A combination of T1-weighted and fat-suppressed FSE T2-weighted or STIR sequences is sufficient for the detection and characterization of most marrow lesions.9 Contrast-enhanced T1-weighted sequences increase the cost and duration of the MRI exam while providing only modest incremental added sensitivity; because of this, they should be reserved for cases with unclear findings on the precontrast sequences. GRE sequences are valuable for the assessment of the iron content of the marrow, and chemical-shift techniques are useful to detect subtle changes in the fat and water fractions of the marrow.
Practical time constraints previously limited MRI scanning of the marrow to only sections of the skeleton. This disadvantage has been mitigated by the development of fast, whole-body MRI scanning techniques that include FSE and single-shot sequences, parallel imaging, rolling table platforms with a large field of view, and global matrix coil concepts.10–12 Obscuration of lesions by motion artifact may be overcome to some extent by the use of respiratory triggering or other motion-suppression techniques. The lower signal-to-noise ratios in smaller children on whole-body MRI exams can be ameliorated by using MR systems with a higher field strength.13 Diffusion-weighted whole-body MRI holds particular promise as a technique to globally assess the bone marrow for hematologic disorders and tumor metastases.14,15
Molecular diffusion is a stochastic process characterized by brownian motion.16 Diffusion-weighted imaging (DWI) is based on the MR signal attenuation caused by the brownian motion of water molecules. In biologic tissues, the diffusion of water molecules is influenced by the microstructure of the surrounding environment. Bone marrow is semifluid in consistency and is confined within spaces defined by the bony trabeculae and supported by reticulum cells and adipocytes. DWI is not pure diffusion imaging, and the apparent diffusion coefficient (ADC) reflects both the molecular diffusion of water and the blood perfusion of the microvasculature. At b-values of 30 and 300 seconds/mm2, the ADC values of marrow are more affected by perfusion effect than by diffusion.17
A positive correlation exists between the degree of marrow cellularity and the marrow ADC. Hematopoietic marrow or marrow infiltrated by neoplastic cells has more abundant microvasculature and more intracellular and interstitial free water than fatty marrow, and it exhibits higher ADC values.18
Motion and susceptibility artifacts are especially problematic in DWI of the marrow, which is contained by bone and in proximity to physiologic motions, such as cerebrospinal fluid pulsations in the case of the spine.16 Recent advances have largely overcome these technologic challenges, and diffusion-weighted whole-body MRI is being used to evaluate an increasing number of benign and malignant conditions that include chronic recurrent multifocal osteomyelitis, Langerhans cell histiocytosis, and bony metastases.19–21
Distribution and Conversion
Physiology: Hematopoiesis occurs in the yolk sac in the early stages of fetal development; later in gestation, it shifts to the liver, and to a lesser extent, to the spleen. Bone marrow begins hematopoiesis in the fourth intrauterine month, overtakes the liver in this function by the sixth month, and is entirely responsible for hematopoietic cell production by birth.22 Shortly before birth, conversion from hematopoietic to fatty marrow begins in the distal phalanges of the hands and feet and proceeds in a centripetal fashion from the distal to the more proximal portions of the appendicular skeleton.4 Within the long bones, conversion from hematopoietic to fatty marrow proceeds from the mid diaphyses to the distal metaphyses and then to the proximal metaphyses. Conversion also progresses from the central medullary canal to the endosteum. Fatty transformation in the epiphyses and apophyses begins almost as soon as they begin to ossify. In infants, the skull and limbs contain about half of the total amount of hematopoietic marrow.1,4 By early adulthood, hematopoietic marrow becomes confined to the vertebrae, sternum, ribs, pelvis, skull, proximal humeri, and proximal femurs. Approximately one half of the bone marrow volume is fatty marrow in early adulthood and is located primarily in the appendicular skeleton. The involution of hematopoietic marrow continues throughout adult life, although at a slower pace than during childhood.1,4,23 Unlike skeletal maturation, there are generally no gender differences in the rate of marrow conversion during childhood.2 Knowledge of the normal age-related changes in the distribution of hematopoietic and fatty marrow is necessary for the recognition of abnormal conversion and reconversion patterns and for the detection of marrow infiltration by other pathologic processes.
Imaging: Conversion from hematopoietic to fatty marrow is readily detected by MRI because of the high sensitivity of T1-weighted spin echo sequences to fat (e-Table 142-1).1 In fact, marrow conversion is observed earlier by MRI than by gross pathologic inspection because of the capability of MRI to detect microscopic fat present in marrow.2,4,5,24 Numerous publications detail the temporal and spatial sequence of marrow conversion revealed by MRI. Although there are discrepancies among these publications in the precise ages of transformation, the sequence of conversion is consistent along the long axes of individual bones and in the skeleton as a whole. Conversion occurs at a faster pace in the appendicular skeleton (extremities, shoulders, and pelvic girdle) than in the axial skeleton (skull, spine, ribs, and sternum).1,4
Marrow conversion follows a similar pattern in both the upper and lower limbs. Within the long bones, conversion initially begins within the diaphysis before spreading to the metaphysis.24 In general, low signal intensity on T1-weighted images marrow within the long-bone diaphyses is unusual after 10 years of age.1,5 Long-bone metaphyseal marrow demonstrates high signal intensity on T1-weighted images by 15 to 25 years of age, except for low to intermediate signal intensity hematopoietic marrow that may persist through adulthood in the proximal femoral metaphyses, the metaphyses around the knee, and the proximal humerus, particularly in populations with increased hematopoiesis, such as smokers, endurance athletes, and obese women.1,4,25
Under normal circumstances, the epiphyseal ossification centers do not participate in hematopoiesis to any appreciable degree. Soon after the onset of epiphyseal ossification, the low signal intensity bony trabeculae and hematopoietic marrow begin to be replaced by high signal intensity fatty marrow, with near complete conversion within 6 to 8 months from the onset.26 Fatty marrow appears earlier in the proximal humeral epiphysis, compared with the femur, because of the earlier onset of proximal humeral epiphyseal ossification.1,27 The apophyses and sesamoid bones follow a similar pattern to the epiphyses.
Fatty marrow conversion first occurs within the phalanges and is completed in the fingers and toes by 1 year of age.4 Conversion in the femurs begins in infancy. Fatty marrow is seen in the femoral diaphyses as early as 3 months of age and is commonly observed by 12 months of age.24 At 1 to 5 years of age, the diaphyseal fat signal becomes homogeneous, and the hematopoietic marrow in the distal femoral metaphyses becomes replaced by fatty marrow at 6 to 15 years of age (Fig. 142-2).24 However, a mottled pattern of relatively low to intermediate signal intensity in the proximal femoral metaphyses may remain, related to persistent hematopoietic marrow and bony trabeculae extending from the inferolateral aspect of the femoral neck to the superomedial aspect of the femoral head.
Figure 142-2 Diagrammatic representation of changes in magnetic resonance imaging appearance of the femoral marrow with increasing age.
Black areas represent hematopoietic marrow, black areas represent fatty marrow or cartilage, and stippled areas indicate heterogeneous hematopoietic and fatty marrow. (From Waitches G, Zawin JK, Poznanski AK. Sequence and rate of bone marrow conversion in the femora of children as seen on MR imaging: are accepted standards accurate? AJR Am J Roentgenol. 1994;162:1401.)
Bone marrow conversion in the humerus follows a similar predictable pattern. Conversion to fatty marrow is complete in the proximal humeral epiphyses by 1 year of age, nearly complete in the diaphyses by 5 years of age, and nearly complete in the distal metaphyses by 10 years of age.27 Conversion occurs less rapidly in the proximal humeral metaphyses and is nearly complete by 15 years of age. However, low to intermediate signal intensity hematopoietic marrow is retained in the proximal humeral metaphyses and subchondral medial aspects of the humeral heads into adulthood, particularly in women.2,28 The acromion behaves like an epiphysis in regard to marrow distribution and conversion rate.2
Conversion of marrow in the forearm and leg bones lags slightly behind the proximal arms and thighs. Conversion to fatty marrow begins in the diaphyses between 1 and 5 years of age and is complete in all portions of the forearm and leg bones by 10 to 15 years of age.4 Marrow conversion ensues in the tarsal and carpal bones at 2 to 6 months of age and is complete by 6 years of age, with the possible exception of small foci of residual hematopoietic marrow that persists in the tarsal bones up to 15 years of age.29
In the first year after birth, hematopoietic marrow is present in the pelvis. Conversion to fatty marrow initially occurs in the anterior ilium and acetabulum, beginning as early as 2 years of age (Fig. 142-3). In the second decade of life, the remainder of the pelvic marrow increases to intermediate signal intensity. Except in infancy, heterogeneous signal intensity of the pelvic marrow is a normal finding and is most prominent in adolescents and adults in the acetabulum and anterior ilium because of macroscopic foci of both hematopoietic and fatty marrow.30
Figure 142-3 Coronal T1-weighted magnetic resonance images of the pelvis showing normal marrow changes.
A, In an 11-month-old boy, normal low signal intensity hematopoietic marrow is present in the pelvis and proximal femurs. B, In a 3-year-old girl, normal conversion to fatty marrow has occurred by this age, manifested by increased signal intensity throughout the pelvis and proximal femurs.
Axial Skeleton
During the first month after birth, the vertebral marrow lacks fat and exhibits uniformly lower signal than the adjacent cartilaginous disks on T1-weighted sequences. Later in infancy, as the vertebral ossification center increases in size, and the cartilaginous end plates decrease in prominence, the veterbral body marrow increases in signal intensity on T1-weighted sequences, particularly adjacent to the cartilaginous end plates.4 Compared with the intervertebral disks and cartilaginous end plates, vertebral body marrow is usually hypointense on T1-weighted images up to the age of 1 year.31 Vertebral body marrow is commonly isointense or hyperintense on T1-weighted images compared with the intervertebral disks from 1 to 5 years of age. After the age of 5 years, vertebral body marrow signal on T1-weighted images is typically greater than that of the intervertebral disks, and a band of fatty marrow may be conspicuous in the vertebral body centrally or along the basivertebral venous plexus (e-Fig. 142-4).4,31 The spine continues as a site of hematopoietic marrow throughout life, although the proportion of fatty marrow gradually rises approximately 7% per decade.
e-Figure 142-4 Sagittal T1-weighted magnetic resonance images of the lumbar spine show increase in signal intensity of vertebral body marrow with age.
A, In a 2-day-old infant girl, the paucity of marrow fat accounts for the low signal intensity of the marrow of the vertebral body (arrow) relative to the that of intervertebral disks. B, In a 2-year-old girl, vertebral body marrow is hyperintense compared with that of the intervertebral disks. C, In a 7-year-old girl, marrow signal intensity is greater than the signal intensity of the intervertebral disks, and there is a central band of more fatty, higher signal intensity marrow in the vertebral bodies.
The skull is where the bone marrow is most frequently imaged by MRI in childhood, typically incidentally in studies obtained to evaluate the brain.32 The skull contains 25% of the active hematopoietic marrow at birth, and conversion to fatty marrow begins by 2 years of age within the facial bones and skull base before proceeding to the calvarium.4 Marrow at the site of the future paranasal sinuses becomes fatty before pneumatization.32 By 3 to 4 years of age, foci of high signal intensity on T1-weighted sequences are seen in the clivus, and complete conversion is typical by 15 years of age. In the calvarium, conversion begins earlier in the frontal and occipital bones than in the parietal bones.23 Conversion in the calvarium should be obvious by 7 years of age, and it is complete in the great majority by 15 years of age.4 The conversion to fatty marrow in the calvarium may occur more slowly in females, an exception to the rule of no gender differences.3
Marrow conversion in the sternum precedes that in the ribs. Development of foci of intermediate to high signal intensity on T1-weighted sequences occurs in the sternum after 5 years of age and in the ribs by 10 years of age.4 The sternum and, to a lesser extent, the ribs remain hematopoietic into adulthood.
Detection of primary or systemic pathology that affects the marrow is usually easier in fatty marrow than in hematopoietic marrow.33 This includes processes associated with hematopoietic hypercellularity (hemolytic anemia, hematopoietic growth factor treatment, leukemoid reaction, glycogen storage disease type 1b [GSD1b], myelodysplastic syndrome, leukemia), marrow infiltration (metastatic tumor cells, inflammatory cells, Gaucher cells), iron overload, and myelofibrosis.7 Some of these processes are also associated with an increase in free water in the marrow and manifest as signal intensity higher than that of normal hematopoietic or fatty marrow on fat-suppressed FSE T2-weighted or STIR sequences.
Features that favor normal hematopoietic marrow include signal intensity equal to or only slightly higher than that of muscle on fat-suppressed FSE T2-weighted or STIR sequences, dropout of signal intensity on opposed-phase GRE sequences, a “flame” or “paintbrush” shape (Fig. 142-5), no underlying trabecular disruption, symmetry with the contralateral side, and no associated abnormalities of the cortical bone or extraosseous soft tissues. Residual red marrow may sometimes have a globular appearance on T1-weighted sequences, and this is a normal finding (Fig. 142-6). However, a low-grade infiltrative or edematous process of the marrow can be difficult or impossible to distinguish from hematopoietic marrow on MRI, particularly when the hematopoietic marrow is relatively hypercellular, such as in very young children and in states of marrow reconversion in patients on granulocyte colony-stimulating factor (G-CSF) therapy (Fig 142-7). Normal red marrow should never have a round, well-circumscribed configuration, which suggests a neoplastic process (Fig. 142-8).34
Figure 142-5 An 8-year-old boy with normal marrow.
T1-weighted coronal magnetic resonance image demonstrates paintbrush-like pattern of hypointensity (arrows) in the femoral metaphysis without underlying trabecular disruption, consistent with normal residual red marrow.
Figure 142-6 A 15-year-old girl with normal marrow.
T1-weighted coronal image demonstrates globular areas of decreased signal throughout the proximal femurs and throughout the innominate bones, consistent with normal, residual red marrow.
Figure 142-8 Magnetic resonance images of the left knee of a 6-year-old boy with knee pain.
A, Coronal T1-weighted image. B, Short tau inversion recovery (STIR) image. Multiple round, sharply defined masses identified on T1-weighted images are hyperintense on STIR images because of marrow involvement by Burkitt lymphoma.
Marrow Hyperplasia and Reconversion
Overview: Reconversion is a process by which established fatty marrow is replaced by hyperplastic hematopoietic marrow in response to conditions that create a demand for increased hematopoiesis. In children, reconversion is commonly encountered in patients with chronic anemia—such as from sickle cell disease, thalassemia, and spherocytosis—and in those administered hematopoietic growth factors, such as G-CSF, granulocyte-macrophage colony-stimulating factor (GM-CSF), and erythropoietin.
Etiology, Pathophysiology, and Clinical Presentation: The stimulus for increased oxygen-carrying capacity of the blood in cyanotic congenital heart disease patients, endurance athletes, heavy smokers, and high-altitude dwellers also induces hematopoietic marrow hyperplasia and reconversion. Because marrow conversion is a process that occurs throughout childhood, some of what is construed as reconversion in children actually represents an arrest or delay in conversion from hematopoietic to fatty marrow and is attributable to increased hematopoietic demands (e-Fig. 142-9).4
e-Figure 142-9 Sagittal T1-weighted magnetic resonance image of the lumbar spine in a 5-year-old girl with homozygous sickle cell disease.
The marrow signal intensity is lower than the adjacent intervertebral disks because of the hematopoietic marrow hyperplasia associated with chronic hemolytic anemia.
Reconversion occurs in the reverse order of normal marrow conversion, beginning in the axial skeleton and proceeding sequentially to the proximal metaphyses, distal metaphyses, and diaphyses of the long bones of the appendicular skeleton.4,6 The more distal long bones are the last to undergo this process. The epiphyses are usually spared but can undergo reconversion in response to very high hematopoietic demands.
Imaging: Positron-emission tomography (PET) with 18-fluorodeoxyglucose (FDG) may reveal increased FDG uptake in areas of marrow hyperplasia because of the metabolic demands of increased hematopoiesis. The marrow reconversion revealed by MRI is far more extensive than that suggested by technetium-99m (99mTc) phosphonate bone scintigraphy. Marrow reconversion usually begins in the metaphysis. On MRI, reconverted marrow follows the signal intensity of hematopoietic marrow and tends to involve the appendicular skeleton in a symmetric fashion.1,4 The reconverted hematopoietic marrow may be distributed in either a homogeneous or patchy pattern and may have an appearance overlapping with that of pathologic processes, such as leukemia and storage disorders. Although MRI is very sensitive to changes in marrow fat content, disease specificity is low, and the distinction between reconverted and diseased marrow often requires clinical correlation. Also, some of the conditions that exhibit marrow reconversion have additional superimposed marrow processes that complicate MRI interpretation, such as transfusion hemosiderosis in thalassemia and marrow infarction and fibrosis in sickle cell disease.
Etiology, Pathophysiology, and Clinical Presentation: Thalassemia is an inherited hemoglobinopathy characterized by ineffective erythropoiesis, intramedullary hemolysis, and anemia. With effective transfusion therapy, hematopoietic to fatty marrow conversion may proceed in the extremities by puberty. However, hematopoietic marrow hyperplasia in the skull, spine, and pelvis can remain pronounced. The paranasal sinuses often fail to develop, in part as a result of abrogation of the normal fatty conversion of marrow that precedes sinus pneumatization (see Chapter 8).32
Thalassemia patients have an increased risk of pathologic fractures because of osteopenia, arthralgias that are believed to be related to iron overload or the use chelation therapy, and back pain as a result of the high incidence of scoliosis and early intervertebral disk degeneration.35
Imaging: The radiographic changes of thalassemia are due to chronic hematopoietic marrow hyperplasia. These include diffuse osteopenia, undertubulization of bone, premature physeal fusion, “hair-on-end” appearance of the calvarium with widening of the diploic space (Fig. 142-10), decreased pneumatization of the paranasal sinuses, coarse trabeculation of appendicular bones, expansion of costochondral junctions, scoliosis, and soft tissue masses related to extramedullary hematopoiesis.36
Figure 142-10 Child with thalassemia with diffuse “hair-on-end” appearance of the calvarium. (Courtesy Edward Singleton, MD.)
The appearance of the bone marrow on MRI is a reflection of the diffuse erythroid marrow hyperplasia, chronic transfusions, and iron chelation therapy.4 Iron deposition in the marrow results in lowered signal intensity on T1-, T2-, and especially T2*-weighted images because of T2 relaxation-time shortening and magnetic susceptibility effects.37
[/not-level-membership-for-pediatrics-category]
