[level-membership-for-emergency-medicine-category]
4 Shock
 Key Points
• Circulatory dysfunction can occur at three levels—the central circulation, the peripheral circulation, and the microcirculation—sometimes with subtle clinical findings.
• The initial history and physical examination should focus on identifying signs of hypoperfusion and detecting any immediately life-threatening circulatory disorders.
• Bedside ultrasonography can be helpful in assessing intravascular volume status and cardiac function and in detecting vascular catastrophes.
• Circulatory support is aimed at restoring adequate oxygen delivery.
• End points of circulatory resuscitation include clinical signs, mean arterial blood pressure, serum lactate level, and central venous oxygenation.
Pathophysiology of Circulatory Dysfunction
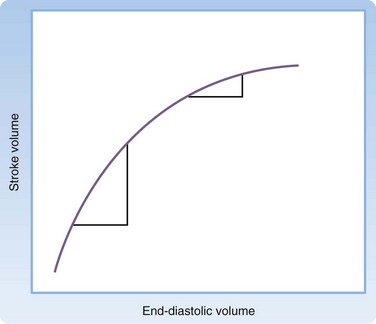
Cardiac output can be affected by the heart rate, arrhythmias, and alterations in ventricular loading. Preload, afterload, and contractility each affect ventricular loading. The Frank-Starling law (Fig. 4.2) states that the principal force governing the strength of ventricular contraction is the length of muscle fibers.1 In a normal heart, muscle fiber length is determined by intravascular volume, often termed preload. As preload increases, myocardial fibers increase in length, which results in increased force of contraction. Increased force of ventricular contraction increases stroke volume and cardiac output. In contrast, depletion of intravascular volume results in muscle fiber shortening, less forceful cardiac contractions, lower stroke volume, and decreased cardiac output.
Circulatory dysfunction exists as a spectrum ranging from mild impairment to shock with overt circulatory collapse. Shock is defined as the inability of the circulatory system to provide adequate tissue perfusion, which potentially leads to cellular dysfunction.1 Four categories of shock have been differentiated and defined by the underlying patho-physiology of the circulatory dysfunction: hypovolemic, cardiogenic, distributive, and obstructive (Box 4.1).2 Because each category requires specialized management, every attempt must be made to determine the exact cause of the shock.
Initial Assessment
Vital Signs
For nearly all ED patients, circulatory assessment begins with the noninvasive measurement of vital signs. Although blood pressure and heart rate are central to the initial assessment, it is important to note the respiratory rate and oxygen saturation. Any abnormality in the respiratory rate or oxygen saturation may affect arterial oxygen content and impair oxygen delivery. Noninvasive measurement of vital signs correlates poorly with organ perfusion in critically ill patients but serves as an important component of the initial ED assessment of the circulatory system.3
Blood Pressure
Blood pressure, the driving force for organ perfusion, is determined by cardiac output and arterial tone.1 It is important to understand that no blood pressure value is considered normal for every patient. Normal blood pressure values do not always indicate sufficient oxygen delivery. Blood pressure values should be interpreted in the context of the patient’s clinical findings, medical history, and treatment received.
Blood pressure is one of the most common measurements in all of clinical medicine, yet it is often measured incorrectly.4 In the ED, blood pressure is initially obtained during triage with automated blood pressure devices that apply the oscillometric method. These devices can be adversely affected by ambient noise and cuff position. In addition, automated devices typically overestimate true arterial blood pressure in patients with low-flow states. These limitations, combined with activity in the triage environment and patient anxiety, often result in inaccurate measurements of blood pressure. Understandably, triage values can be an unreliable indicator of true blood pressure. Blood pressure measurements should be repeated serially at the bedside in patients demonstrating any evidence of circulatory insufficiency.
1. Remove all clothing from the arm and place the blood pressure cuff so that the middle of the cuff is approximately at the level of the right atrium. The lower edge of the cuff should be 2 to 3 cm above the antecubital fossa to allow easy palpation and auscultation of the brachial artery.
2. Locate the radial artery and inflate the blood pressure cuff to approximately 30 mm Hg above the point at which the radial arterial pulse disappears.
3. Place the bell of the stethoscope over the brachial artery and deflate the cuff at a rate of 2 to 3 mm Hg per second. The appearance of faint, repetitive sounds for at least two consecutive beats is phase I of the Korotkoff sounds. Phase I is systolic blood pressure. The point at which all sounds disappear is phase V, or diastolic blood pressure.
Measure blood pressure bilaterally during the initial circulatory examination. A difference of more than 10 mm Hg is significant and may indicate an aortic emergency. Unfortunately, up to 20% of individuals have significant blood pressure differences between their arms.5 Nevertheless, an aortic emergency must be ruled out in any patient with evidence of circulatory insufficiency and blood pressure discrepancies.
Though considered the gold standard, the auscultatory method has several pitfalls. Box 4.2 lists errors commonly made during measurement of blood pressure with the auscultatory method.
Heart Rate
The heart rate is an integral component of cardiac output. Tachycardia or bradycardia can impair circulatory function. As with blood pressure, triage measurements of the heart rate can be inaccurate and unreliable. Therefore, heart rate measurement should be repeated in every patient on initial examination. In addition to the rate, irregularities in rhythm should be noted. Arrhythmias can severely compromise circulatory function and organ perfusion. Furthermore, heart rate variability may be an early indication of circulatory dysfunction.6 Methods to determine heart rate variability remain investi-gational and require additional research before clinical application.
Orthostatic Blood Pressure
A positive orthostatic blood pressure response is defined as a reduction in systolic blood pressure of at least 20 mm Hg or a reduction in diastolic blood pressure of at least 10 mm Hg within 3 minutes after standing in a patient with symptoms of volume depletion.7 Orthostatic blood pressure should be measured with the patient in the supine and standing positions. For patients who are unable to stand or who are markedly unsteady, a sitting position may be used. Wait at least 2 minutes before obtaining a standing blood pressure measurement because nearly all patients have a brief orthostatic response immediately on standing. Always measure the heart rate with orthostatic blood pressure. In normal patients, the heart rate increases from 5 to 12 beats/min with standing. Increases greater than 30 beats/min are abnormal and indicate significant volume depletion.
Orthostatic blood pressure measurements have several limitations. Numerous conditions in addition to volume depletion impair the postural hemodynamic response and result in orthostatic hypotension. Most notable are the effects of aging and medications. Up to 30% of elderly patients demonstrate an orthostatic response in the absence of volume depletion.8 Many elderly patients take medications that alter the postural response to changes in position; such medications include antiadrenergics, antidepressants, antihypertensives, neuroleptics, anticholinergics, and antiparkinsonian drugs. In addition, any disorder causing primary or secondary autonomic dysfunction can lead to orthostatic hypotension.
Physical Examination
Physical examination of the circulatory system begins with the general appearance of the patient. Observe the patient’s positioning, mental status, skin color, and respiratory pattern. Suspect circulatory abnormalities in restless, diaphoretic, delirious, pale, mottled, or tachypneic patients. In addition, note any distinct clinical features implying an underlying medical condition. Table 4.1 lists the characteristic features of disorders that can affect the circulatory system.
Table 4.1 Characteristics of Conditions That Affect the Circulatory System
| CONDITION | CLINICAL APPEARANCE | POTENTIAL CIRCULATORY IMPLICATIONS |
|---|---|---|
| Marfan syndrome | Arachnodactyly Arm span greater than height Longer pubis-to-foot length than pubis-to-head length |
Aortic dissection |
| Osteogenesis imperfecta | Blue sclera | Aortic dissection Aortic aneurysm Aortic valve insufficiency Mitral valve prolapse |
| Hyperthyroidism | Exophthalmos | Congestive heart failure |
| Hypothyroidism | Expressionless face Periorbital edema Loss of lateral third of the eyebrows Dry, sparse hair |
Congestive heart failure Pericardial effusion |
| Hemochromatosis | Bronze pigmentation of skin Loss of axillary and pubic hair |
Cardiomyopathy |
| Turner syndrome | Short stature Webbed neck “Shield” chest Medial deviation of the extended forearm |
Aortic coarctation |
| Aortic insufficiency | Bobbing of the head with heartbeat Systolic flushing of the nail beds |
— |
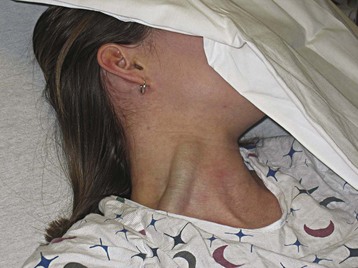
Examine the head and neck for abnormalities suggesting circulatory disease. Facial edema implies impaired venous return resulting from conditions such as superior vena cava thrombosis and constrictive pericarditis. Examination of the jugular venous pulse provides important information about central venous pressure (CVP) and the dynamics of the right side of the heart.9 Place the patient in a 45-degree recumbent position and shine a light tangentially across the neck. The right side is preferred because of its anatomic alignment with the superior vena cava and right atrium. Beginning at the sternal notch, measure the height (in centimeters) of the internal jugular vein pulsations. Pulsations more than 4 cm above the sternal notch are abnormal and a sign of elevated CVP.9 Figure 4.3 illustrates jugular venous distention in a young woman with pericardial effusion.
Emergency Ultrasonography
Over the past 3 decades, ultrasonography has become essential in the initial assessment of patients with circulatory dysfunction. Ultrasonography is easily performed at the bedside and provides a noninvasive, real-time assessment of causes of circulatory dysfunction. Because ultrasonography may identify the cause of circulatory dysfunction faster than traditional diagnostic testing can, definitive interventions can be initiated rapidly, thereby potentially minimizing end-organ damage.10
Many ultrasonography algorithms and approaches for assessing circulatory dysfunction have been published. For the purposes of this discussion, we will use the RUSH (Rapid Ultrasound in SHock) protocol to illustrate the utility of ultrasonography in evaluating circulatory dysfunction.11 In three systematic steps, the RUSH protocol evaluates circulatory dysfunction as follows:
Step 1: Evaluate the heart (the “pump”).
Step 2: Assess intravascular volume status (the “tank”).
Step 3: Evaluate the major vascular structures (the “pipes”).
Step 1: Evaluate the Pump
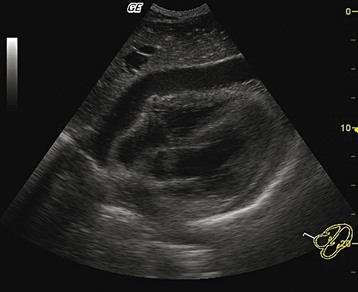
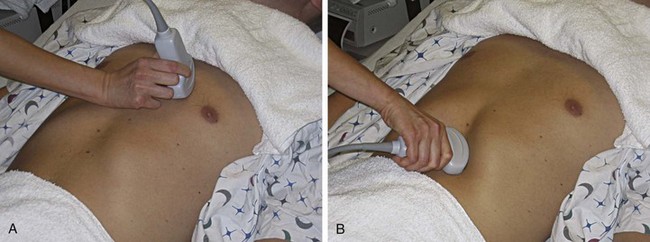
Evaluation of the heart with the RUSH protocol is different from a formal echocardiogram obtained by cardiologists. Formal echocardiography examines the heart from multiple views, comments on segmental wall motion abnormalities, and evaluates valvular function and structure. The cardiac component of the RUSH protocol is limited to the following: (1) global left ventricular function, (2) relative size of the left ventricle (LV) to the right ventricle (RV), and (3) evaluation of the pericardial sac for tamponade (Fig. 4.4). To perform the assessment, a 3.5-MHz probe is placed on the left anterior aspect of the chest (i.e., parasternal view) (Fig. 4.5, A) or below the costal margin (i.e., subcostal view) (Fig. 4.5, B). Once an adequate view is obtained, global left ventricular function can be described as normal, hyperkinetic, reduced, or severely reduced.
Step 2: Evaluate the Tank
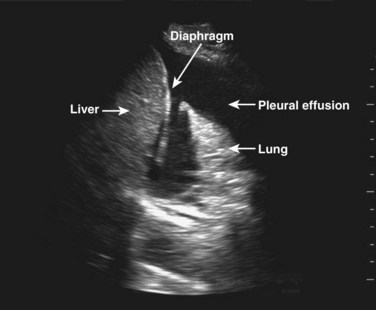
Following determination of intravascular volume, assess the “leakiness” of the tank; that is, examine major body compartments where fluid may have “leaked.” Examination of the abdominal compartment and the thoracic space for free fluid may reveal the source of leakiness (Fig. 4.6). Finally, evaluation for the presence of pneumothorax is critical in assessment of the tank because tension pneumothorax can cause obstructive shock secondary to compression of the major vessels and relative hypovolemia and shock.
Step 3: Evaluate the Pipes
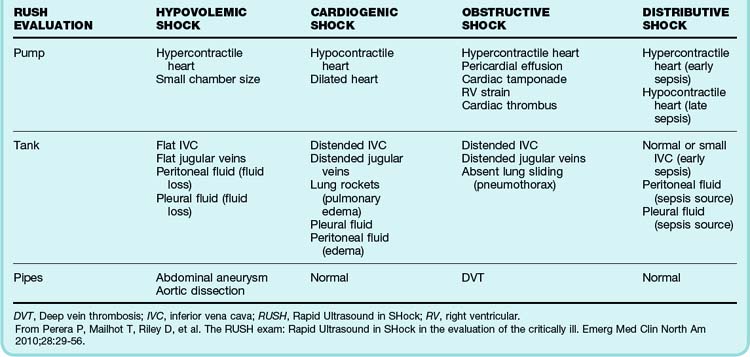
All three steps of the RUSH protocol should be completed sequentially and thoroughly. If an abnormality is found, the temptation to terminate the study early should be avoided because of the potential for additional findings. Once the examination has been completed, positive and negative findings should be clinically integrated and interpreted to determine the cause of the shock. Combined findings from the RUSH evaluation and their indication of the type of shock are listed in Table 4.2.
Additional Uses of Emergency Ultrasonography
Ultrasonography can be used for emergency procedures such as establishment of intravenous access, pericardiocentesis, and transvenous cardiac pacing.12 It can also be used for hemodynamic monitoring (e.g., volume responsiveness, CVP, pulmonary artery occlusion pressure [PAOP], cardiac output).13,14
Procedures and Circulatory Monitoring
Intravenous Access
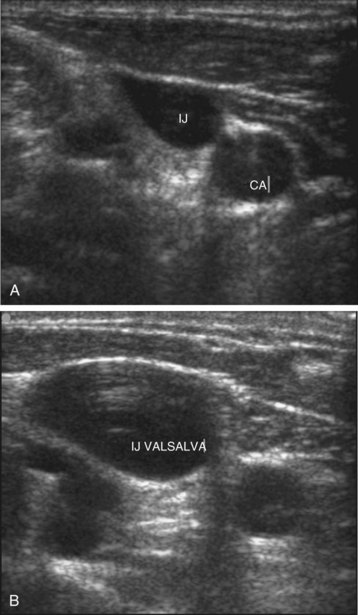
Central venous catheterization has become a common bedside procedure in emergency medicine. In the United States, more than 5 million central venous catheters are placed each year. Table 4.3 lists several indications for and contraindications to establishing central venous access. The procedure presents a risk for a number of complications (see the Red Flags box), but their occurrence can be minimized by following the basic rules of good practice (see the Tips and Tricks box). For catheterization of the internal jugular vein, the ultrasonography probe should be positioned on the anterior aspect of the neck, as demonstrated in Figure 4.7. Identification of the vein can be facilitated by asking the patient to perform the Valsalva maneuver, which causes engorgement of the neck veins (Fig. 4.8, A and B).
Table 4.3 Central Line Placement: Indications and Contraindications
| Indications |
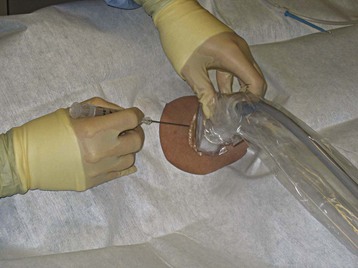
Fig. 4.7 Proper positioning of the ultrasonography probe for catheterization of the internal jugular vein.
 Red Flags
Tips and Tricks
Tips for Decreasing the Rate of Complications with Central Venous Catheterization
Use maximal sterile barrier precautions—cap, mask, gown, gloves, and sterile drapes.
Use chlorhexidine-based solutions if available.
Do not allow inexperienced operators (<50 catheterizations) more than three attempts.
Whenever possible, place a subclavian central venous catheter, which is associated with the lowest rate of mechanical, infectious, and thrombotic complications.
Use ultrasonographic guidance routinely for internal jugular venous catheterization.
Do not use topical antibiotic ointments; they have not been shown to decrease the risk for catheter-related infections.
Arterial Blood Pressure Monitoring
Invasive arterial blood pressure monitoring is required for patients with persistent circulatory dysfunction despite initial resuscitative measures. Primary indications for placement of an arterial line include continuous blood pressure monitoring, the need for frequent blood sampling, and serial measurements of PaO2. When possible, the radial artery should be used for this purpose. It offers the advantages of a peripheral position and easy compressibility in the event of unsuccessful cannulation. Additionally, the nearby ulnar artery supplies collateral blood flow to the hand while the radial artery is cannulated. If the radial artery cannot be used, a line can be placed in other arteries, as listed in Box 4.3.
Box 4.3 Arterial Cannulation
Insertion Sites, Possible Complications, Procedure Tips
Tips
Avoid cannulation of the brachial artery, complications of which can be severe:
A femoral arterial line has a lower rate of catheter malfunction and greater longevity but higher risk for infection.
Wear a sterile gown, gloves, and mask and place a drape.
Administer lidocaine without epinephrine for local anesthesia.
Flush the line frequently to maintain patency and prevent thrombosis.
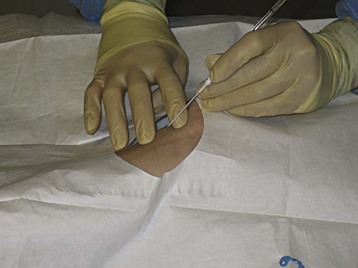
Catheter placement is guided by palpation of the artery. When the pulse is difficult to detect, ultrasound becomes an important aid for visualization of the target artery. Cannulation of the radial artery under ultrasound guidance is faster, requires fewer attempts, and is associated with fewer complications than the palpation method is.15 Proper patient positioning for radial artery cannulation is illustrated in Figure 4.9.
Central Venous Pressure
CVP is intravascular pressure in the central vena cava system, near its junction with the right atrium. Clinically, CVP is used as a marker of volume status and cardiac preload. Normal values for CVP range from 8 to 12 mm Hg. CVP can be estimated noninvasively by examining the internal jugular vein (as described in the physical examination section of this chapter), but bedside determinations have been shown to be inaccurate and unreliable.16 Direct measurements, through a subclavian or internal jugular vein catheter, provide more reliable results. CVP can be measured via a femoral central venous catheter; however, values typically differ by 0.5 to 3 mm Hg from those obtained from the superior vena cava. In a patient who is not mechanically ventilated, CVP can be estimated noninvasively by visualizing the IVC with ultrasound (Table 4.4). For example, a normally sized IVC that collapses more than 50% correlates with a CVP between 0 and 5 mm Hg.17
Table 4.4 Estimation of Right Atrial Pressure from Measurement of the Inferior Vena Cava
| SIZE OF IVC | IVC SIZE ON INSPIRATION | RA PRESSURE (mm Hg) |
|---|---|---|
| <1.5 cm (small) | Nearly total collapse | 0-5 |
| 1.5-2.5 cm (normal) | Decrease >50% | 5-10 |
| 1.5-2.5 cm | Decrease <50% | 10-15 |
| >2.5 cm | Decrease <50% | 15-20 |
| IVC and hepatic vein dilation | No change | >20 |
IVC, Inferior vena cava; RA, right atrial.
Pulmonary Artery Catheterization
First described by Swan and colleagues in the early 1970s, pulmonary artery catheterization is considered the gold standard for circulatory monitoring in the critically ill. Circulatory measurements obtained with pulmonary artery catheterization include cardiac output, right ventricular ejection fraction, mixed venous oxygen saturation, and intrapulmonary vascular pressure. From these measurements, oxygen delivery, oxygen consumption, systemic vascular resistance, and left ventricular stroke index can be calculated. Because a pulmonary artery catheter gives clinicians the ability to measure oxygen delivery directly, it would seem to be an invaluable tool for circulatory monitoring. Unfortunately, routine use of this type of catheter remains controversial. Use of a pulmonary artery catheter has not been shown to decrease patient morbidity or mortality rates.18 In fact, use of a pulmonary artery catheter may be detrimental. Complications of insertion include pneumothorax, ventricular arrhythmias, ventricular perforation, and pulmonary artery rupture. Until further evidence is published, pulmonary artery catheters should not be used in the ED for assessment and support of the circulatory system.
Additional Circulatory Monitoring Modalities
The circulatory system can also be assessed with global, or tissue, markers of hypoperfusion. Methods of assessing global hypoperfusion in the ED include central venous oxygen saturation and serum lactate values. Under normal circumstances, cells extract 25% to 30% of the oxygen from the circulation. Therefore, blood returning to the central circulation has an oxygen saturation ranging from 70% to 75%. When the circulation fails to deliver adequate oxygen, cellular oxygen extraction is increased. This increase is reflected as decreased mixed venous oxygen saturation, measured via a pulmonary artery catheter. Mixed venous oxygen saturation values of less than 65% are associated with decreased perfusion and oxidative impairment of some vascular beds. Central venous oxygen saturation of less than 70%, measured intermittently or continuously via a central venous catheter, is a reliable surrogate for mixed venous oxygen saturation. Central venous oxygen saturation, as a global marker of hypoperfusion, was used in a landmark study that demonstrated a significant decrease in mortality rate in ED patients with sepsis in whom that marker was used.19 Central venous oxygen saturation values should be obtained from either subclavian or internal jugular central venous catheters.
The trend in lactate values is the most clinically useful information. Increasing serial lactate levels portend a worse prognosis and indicate a persistent circulatory dysfunction. A 10% reduction in lactate concentration in serial samples may be a more clinically useful marker of resuscitation than central venous oxygen concentration.20
Treatment of Circulatory Dysfunction
Treatment goals for circulatory support are based on restoring adequate oxygen delivery. Methods of restoration consist of improving cardiac output, arterial oxygen content, and peripheral perfusion pressure. General ED therapies include supplemental oxygen, endotracheal intubation, intravenous fluids, vasoactive medications, and the use of mechanical support devices such as cardiac pacemakers. Regardless of the therapy chosen, it is important to recognize established end points of circulatory resuscitation. First and foremost, patients should exhibit clinical signs of improvement, such as improving mental status, increasing urine output, and normalization of vital signs. Additional end points of resuscitation are mean arterial blood pressure, serum lactate level, and central venous oxygen saturation. Mean arterial pressure represents true perfusion pressure; its measurement is superior to systolic blood pressure monitoring. Mean arterial pressure in patients with sepsis should be at least 65 mm Hg. There is no survival benefit to raising it beyond that level. As discussed earlier, serum lactate values should show a decreasing trend over serial measurements. Persistently elevated lactate values indicate inadequate and incomplete circulatory resuscitation. For patients with a central venous catheter, CVP and central venous oxygen saturation can be monitored. CVP should range from 8 to 12 mm Hg, whereas central venous oxygen saturation values should exceed 70%. The goals of resuscitation are summarized in Box 4.4.
General Treatment Principles
Patients with circulatory dysfunction require rapid assessment and simultaneous treatment:
1. Begin cardiac monitoring immediately to determine the patient’s heart rate and rhythm regularity.
2. Provide supplemental oxygen to improve arterial oxygen saturation.
3. Maintain a low threshold for intubation. The respiratory muscles are avid consumers of oxygen, thereby limiting oxygen delivery to other vital organs. Early intubation and paralysis of respiratory muscles may be required in patients with ongoing circulatory compromise.
4. Establish peripheral intravenous access rapidly.
5. Obtain an electrocardiogram and a portable chest radiograph within the first minutes to evaluate for acute myocardial infarction and pneumothorax.
6. Perform ultrasonography early to look for myocardial dysfunction, pericardial effusion, hemoperitoneum, and abdominal aortic aneurysm in patients with persistent hypotension.
Intravenous Fluid Administration
The administration of colloid fluids during the initial circulatory resuscitation confers no mortality benefit.21 An isotonic crystalloid solution should be the first-line intravenous fluid. Fluid therapy is continued until the end points of resuscitation are achieved or the patient demonstrates pulmonary edema or evidence of right heart dysfunction.
Preload Responsiveness
Static Versus Dynamic Measurements
Several studies have demonstrated that static measures are inaccurate in predicting preload responsiveness.22,23 Nonetheless, the most recent Surviving Sepsis Campaign consensus guidelines recommend using static measurements such as CVP and PAOP to assess preload responsiveness and guide fluid resuscitation in septic patients.24
• Patients with low CVP who are given a fluid challenge and show at least a 2–mm Hg increase in pressure probably have intravascular depletion and are preload responsive. Such patients require additional fluid administration to optimize preload and cardiac output.
• Normal or elevated CVP should not be interpreted as indicating adequate circulatory volume and cardiac preload. A method other than measurement of CVP should be used to assess preload responsiveness.
Dynamic assessments of preload responsiveness are believed to be more accurate than static assessments. Dynamic measures are derived from the interaction between the respiratory and cardiac systems during mechanical ventilation. Mechanical ventilation elevates intrathoracic pressure, which affects left ventricular preload and changes stroke volume in patients who are preload responsive. Patients who are not preload responsive do not have variations in stroke volume with mechanical ventilation. Stroke volume can be assessed with an arterial catheter or noninvasively by pulse oximeter plethysmographic waveform amplitude.25
Distensbility Index
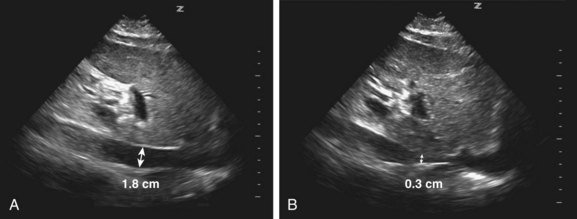
The IVC is measured easily and reliably with ultrasound via the subcostal view. In mechanically ventilated patients, variations in intrathoracic pressure cause changes in IVC diameter; that is, increased diameter with a positive pressure breath and decreased diameter with expiration (Fig. 4.10, A and B). This variability in diameter (the DI) is most pronounced when a patient is preload responsive. DI is defined as the difference between the maximum and minimum diameters divided by the minimum diameter × 100. A DI greater than 18% has 90% sensitivity and specificity for predicting preload responsiveness.26 Because the IVC is easy to visualize and measure, the DI can be assessed following each fluid bolus. By continuously reassessing the DI, volume can be given up to the point at which a patient is no longer preload responsive.
Pulse Pressure Variation
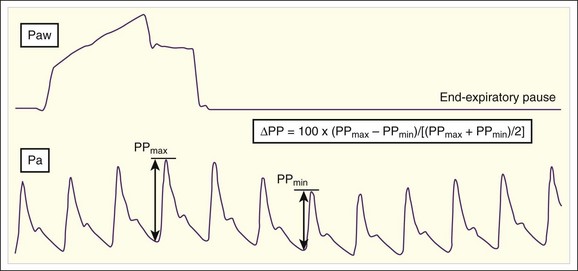
PPV is another dynamic measure of preload responsiveness. PPV can be calculated with an arterial catheter or via pulse oximeter plethysmographic waveform analysis. PPV is calculated by taking the difference between the maximum and minimum pulse pressures during one respiratory cycle, dividing by the average of the two values (maximum and minimum), and then multiplying by 100 (Fig. 4.11). Values higher than 18% predict a hypotensive patient to be preload responsive; a volume challenge would probably increase stroke volume and cardiac output.27 As mentioned previously, PPV has limitations when used to predict preload responsiveness (e.g., ventilation must be at a set tidal volume [6 to 8 m L/kg], no spontaneous breaths, sinus rhythm).
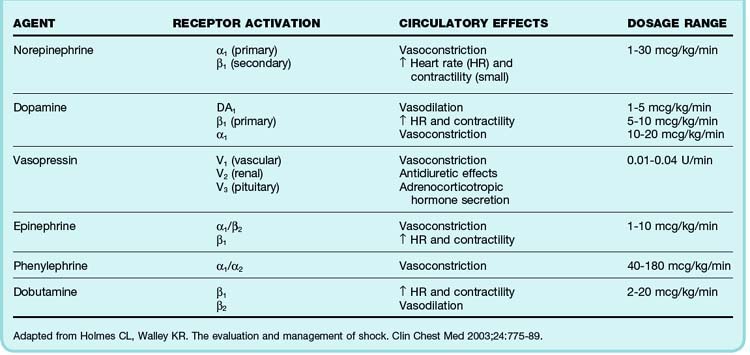
Vasoactive Therapy
Vasoactive medications are indicated when mean arterial pressure remains below 65 mm Hg despite a fluid challenge of 20 to 40 mL/kg and there is evidence that a patient is not preload responsive. Vasopressor agents help restore perfusion pressure and maintain cardiac output. These agents typically exert their effects through stimulation of α- and β-adrenergic receptors. The degree to which these receptors are stimulated depends on the agent. Common vasopressor agents used in emergency medicine are norepinephrine, dopamine, and vasopressin. Less commonly used agents are phenylephrine, epinephrine, and milrinone. The hemodynamic dose responses and dosage ranges of these agents are listed in Table 4.5. An important caveat is that a rise in blood pressure after administration of one of these drugs may not correlate with clinical improvement. Additional markers of hypoperfusion, such as the serum lactate level and central venous oxygen saturation, must be considered in the overall circulatory assessment. No studies have clearly supported the superiority of any vasopressor agent. The choice depends on the acute disease process and underlying comorbid conditions.
Mechanical Circulatory Support
Support of the circulatory system may require cardiac pacing (Box 4.5), which can be performed transcutaneously or transvenously. Transcutaneous pacing is noninvasive and more commonly used in the ED. Proper pacer pad placement is crucial in this modality. The anterior pacer pad is placed close to the heart, typically at the location of the V3 lead on an electrocardiogram; the posterior pad is placed between the spine and the inferior border of the left or right scapula. The subsequent steps in transcutaneous pacing are listed in Box 4.6.
Transvenous pacers are placed through a central venous catheter. The right internal jugular vein and the left subclavian vein are the preferred sites of cannulation. Attaining the proper position in the right ventricle can be difficult. Ultrasonography should be used to guide placement of the pacer. If ultrasonography is not available, the V1 lead of an electrocardiograph machine should be attached to the cathode. Contact with the right ventricle is characterized by prominent ST-segment elevation. The ventricular rate is set the same as for transcutaneous pacing. When pacer output is adjusted, the pacing threshold for transvenous pacing is much less than that required for transcutaneous pacing, typically ranging between 1 and 2 mA. When the right ventricle is paced, the electrocardiogram should demonstrate a pacer spike followed by a QRS complex displaying a left bundle branch block pattern. Potential complications of emergency transvenous pacing are listed in Box 4.7.
Summary
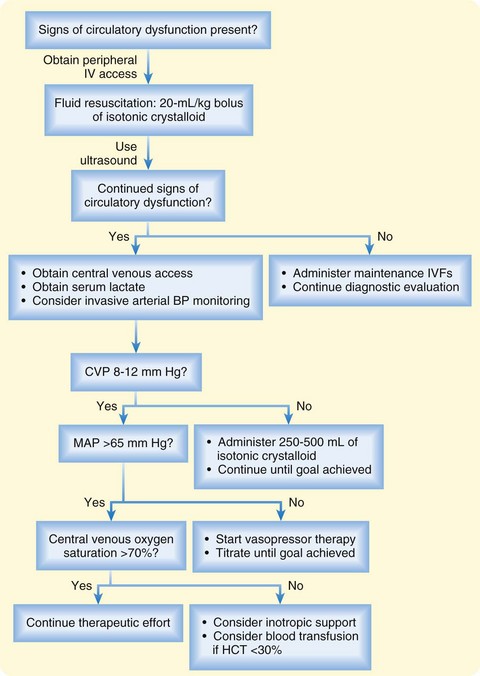
Assessment of the circulatory system is central to the evaluation of every ED patient. Assessment begins with a focused history, physical examination, noninvasive measurements of blood pressure and heart rate, and focused ultrasonography to identify causes of circulatory dysfunction. For many ED patients, additional circulatory assessment and monitoring are not needed. However, patients with evidence of circulatory dysfunction require rapid evaluation and support, as summarized in the following list (Fig. 4.12):
• Obtain peripheral venous access and administer isotonic crystalloid fluid boluses followed by frequent reassessment of blood pressure and preload responsiveness.
• Perform ultrasonography early in the evaluation of patients with severe circulatory compromise to exclude acute life-threatening conditions such as pericardial effusion, hemoperitoneum, and abdominal aortic aneurysm.
• Insert an arterial line for continuous blood pressure monitoring in patients who remain hypotensive despite initial administration of intravenous fluids.
• Use global markers of hypoperfusion, such as the serum lactate level and central venous oxygen saturation, to detect persistently impaired oxygen delivery.
• Begin a vasopressor agent in any patient with a mean arterial pressure of less than 65 mm Hg despite an adequate fluid challenge.
1 Marino PL. The ICU book, 3rd ed. Baltimore: Williams & Wilkins; 2007.
2 Irwin RS, Rippe JM. Intensive care medicine. Philadelphia: Lippincott Williams & Wilkins; 2003.
3 Rady MY, Rivers EP, Nowak RM. Resuscitation of the critically ill in the ED: responses of blood pressure, heart rate, shock index, central venous oxygen saturation, and lactate. Am J Emerg Med. 1996;14:218–225.
4 Pickering TG, Hall JE, Appel LJ, et al. Recommendations for blood pressure measurement in humans and experimental animals. Part 1: blood pressure measurement in humans: a statement for professionals from the Subcommittee of Professional and Public Education of the American Heart Association Council on High Blood Pressure Research. Circulation. 2005;111:697–716.
5 Rogers RL, McCormack R. Aortic disasters. Emerg Med Clin North Am. 2004;22:887–908.
6 Barnaby D, Ferrick K, Kaplan DT, et al. Heart rate variability in emergency department patients with sepsis. Acad Emerg Med. 2002;9:661–670.
7 Consensus statement on the definition of orthostatic hypotension, pure autonomic failure, and multiple system atrophy. The Consensus Committee of the American Autonomic Society and the American Academy of Neurology. Neurology. 1996;46:1470.
8 Carlson JE. Assessment of orthostatic blood pressure: measurement technique and clinical applications. South Med J. 1999;92:167–173.
9 Zipes DP, Braunwald E. Braunwald’s heart disease: a textbook of cardiovascular medicine, 7th ed. Philadelphia: Saunders; 2005.
10 Jones AE, Tayal VS, Sullivan DM, et al. Randomized controlled trial of immediate versus delayed goal directed ultrasound to identify the cause of nontraumatic hypotension in emergency department patients. Crit Care Med. 2004;32:1703–1708.
11 Perera P, Mailhot T, Riley D, et al. The RUSH exam: Rapid Ultrasound in SHock in the evaluation of the critically ill. Emerg Med Clin North Am. 2010;28:29–56.
12 Tibbles CD, Porcaro W. Procedural applications of ultrasound. Emerg Med Clin North Am. 2004;22:797–815.
13 Tang A, Euerle B. Emergency department ultrasound and echocardiography. Emerg Med Clin North Am. 2005;23:1179–1194.
14 Ciccone TJ, Grossman SA. Cardiac ultrasound. Emerg Med Clin North Am. 2004;22:621–640.
15 Shiver S, Blaivas M, Lyon M. A prospective comparison of ultrasound-guided and blindly placed radial arterial catheters. Acad Emerg Med. 2006;13:1275–1279.
16 McGee SR. Physical examination of venous pressure: a critical review. Am Heart J. 1998;136:10–18.
17 Kircher BJ, Himelman RB, Schiller NB. Noninvasive estimation of right atrial pressure from the inspiratory collapse of the inferior vena cava. Am J Cardiol. 1990;66:493–496.
18 Shah MR, Hasselblad V, Stevenson LW, et al. Impact of the pulmonary artery catheter in critically ill patients: meta-analysis of randomized clinical trials. JAMA. 2005;294:1664–1670.
19 Rivers E, Nguyen B, Havstad S, et al. Early goal-directed therapy in the treatment of severe sepsis and septic shock. N Engl J Med. 2001;345:1368–1377.
20 Jones AE, Shapiro NI, Trzeciak S, et al. Lactate clearance vs central venous oxygen saturation as goals of early sepsis therapy: a randomized clinical trial. JAMA. 2010;303:739–746.
21 Roberts I, Alderson P, Bunn F, et al. Colloids versus crystalloids for fluid resuscitation in critically ill patients. Cochrane Database Syst Rev. 4, 2004. CD000567
22 Michard F, Teboul JL. Predicting fluid responsiveness in ICU patients: a critical analysis of the evidence. Chest. 2002;121:2000–2008.
23 Marik PE, Baram M, Vahid B. Does central venous pressure predict fluid responsiveness? A systematic review of the literature and the tale of seven mares. Chest. 2008;134:172–178.
24 Dellinger RP, Levy MM, Carlet JM, et al. Surviving Sepsis Campaign: international guidelines for management of severe sepsis and septic shock: 2008. Crit Care Med. 2008;36:296–327.
25 Cannesson M, Aboy M, Hofer CK, et al. Pulse pressure variation: where are we today? J Clin Monit Comput. 2011;25:45–56.
26 Barbier C, Loubières Y, Schmit C, et al. Respiratory changes in inferior vena cava diameter are helpful in predicting fluid responsiveness in ventilated septic patients. Intensive Care Med. 2004;30:1740–1746.
27 De Backer D, Heenen S, Piagnerelli M, et al. Pulse pressure variations to predict fluid responsiveness: influence of tidal volume. Intensive Care Med. 2005;31:517–523.
[/level-membership-for-emergency-medicine-category][not-level-membership-for-emergency-medicine-category]
4 Shock
• Circulatory dysfunction can occur at three levels—the central circulation, the peripheral circulation, and the microcirculation—sometimes with subtle clinical findings.
• The initial history and physical examination should focus on identifying signs of hypoperfusion and detecting any immediately life-threatening circulatory disorders.
• Bedside ultrasonography can be helpful in assessing intravascular volume status and cardiac function and in detecting vascular catastrophes.
• Circulatory support is aimed at restoring adequate oxygen delivery.
• End points of circulatory resuscitation include clinical signs, mean arterial blood pressure, serum lactate level, and central venous oxygenation.
Pathophysiology of Circulatory Dysfunction
Cardiac output can be affected by the heart rate, arrhythmias, and alterations in ventricular loading. Preload, afterload, and contractility each affect ventricular loading. The Frank-Starling law (Fig. 4.2) states that the principal force governing the strength of ventricular contraction is the length of muscle fibers.1 In a normal heart, muscle fiber length is determined by intravascular volume, often termed preload. As preload increases, myocardial fibers increase in length, which results in increased force of contraction. Increased force of ventricular contraction increases stroke volume and cardiac output. In contrast, depletion of intravascular volume results in muscle fiber shortening, less forceful cardiac contractions, lower stroke volume, and decreased cardiac output.
Circulatory dysfunction exists as a spectrum ranging from mild impairment to shock with overt circulatory collapse. Shock is defined as the inability of the circulatory system to provide adequate tissue perfusion, which potentially leads to cellular dysfunction.1 Four categories of shock have been differentiated and defined by the underlying patho-physiology of the circulatory dysfunction: hypovolemic, cardiogenic, distributive, and obstructive (Box 4.1).2 Because each category requires specialized management, every attempt must be made to determine the exact cause of the shock.
Initial Assessment
Vital Signs
For nearly all ED patients, circulatory assessment begins with the noninvasive measurement of vital signs. Although blood pressure and heart rate are central to the initial assessment, it is important to note the respiratory rate and oxygen saturation. Any abnormality in the respiratory rate or oxygen saturation may affect arterial oxygen content and impair oxygen delivery. Noninvasive measurement of vital signs correlates poorly with organ perfusion in critically ill patients but serves as an important component of the initial ED assessment of the circulatory system.3
Blood Pressure
Blood pressure, the driving force for organ perfusion, is determined by cardiac output and arterial tone.1 It is important to understand that no blood pressure value is considered normal for every patient. Normal blood pressure values do not always indicate sufficient oxygen delivery. Blood pressure values should be interpreted in the context of the patient’s clinical findings, medical history, and treatment received.
Blood pressure is one of the most common measurements in all of clinical medicine, yet it is often measured incorrectly.4 In the ED, blood pressure is initially obtained during triage with automated blood pressure devices that apply the oscillometric method. These devices can be adversely affected by ambient noise and cuff position. In addition, automated devices typically overestimate true arterial blood pressure in patients with low-flow states. These limitations, combined with activity in the triage environment and patient anxiety, often result in inaccurate measurements of blood pressure. Understandably, triage values can be an unreliable indicator of true blood pressure. Blood pressure measurements should be repeated serially at the bedside in patients demonstrating any evidence of circulatory insufficiency.
1. Remove all clothing from the arm and place the blood pressure cuff so that the middle of the cuff is approximately at the level of the right atrium. The lower edge of the cuff should be 2 to 3 cm above the antecubital fossa to allow easy palpation and auscultation of the brachial artery.
2. Locate the radial artery and inflate the blood pressure cuff to approximately 30 mm Hg above the point at which the radial arterial pulse disappears.
3. Place the bell of the stethoscope over the brachial artery and deflate the cuff at a rate of 2 to 3 mm Hg per second. The appearance of faint, repetitive sounds for at least two consecutive beats is phase I of the Korotkoff sounds. Phase I is systolic blood pressure. The point at which all sounds disappear is phase V, or diastolic blood pressure.
Measure blood pressure bilaterally during the initial circulatory examination. A difference of more than 10 mm Hg is significant and may indicate an aortic emergency. Unfortunately, up to 20% of individuals have significant blood pressure differences between their arms.5 Nevertheless, an aortic emergency must be ruled out in any patient with evidence of circulatory insufficiency and blood pressure discrepancies.
Though considered the gold standard, the auscultatory method has several pitfalls. Box 4.2 lists errors commonly made during measurement of blood pressure with the auscultatory method.
Heart Rate
The heart rate is an integral component of cardiac output. Tachycardia or bradycardia can impair circulatory function. As with blood pressure, triage measurements of the heart rate can be inaccurate and unreliable. Therefore, heart rate measurement should be repeated in every patient on initial examination. In addition to the rate, irregularities in rhythm should be noted. Arrhythmias can severely compromise circulatory function and organ perfusion. Furthermore, heart rate variability may be an early indication of circulatory dysfunction.6 Methods to determine heart rate variability remain investi-gational and require additional research before clinical application.
Orthostatic Blood Pressure
A positive orthostatic blood pressure response is defined as a reduction in systolic blood pressure of at least 20 mm Hg or a reduction in diastolic blood pressure of at least 10 mm Hg within 3 minutes after standing in a patient with symptoms of volume depletion.7 Orthostatic blood pressure should be measured with the patient in the supine and standing positions. For patients who are unable to stand or who are markedly unsteady, a sitting position may be used. Wait at least 2 minutes before obtaining a standing blood pressure measurement because nearly all patients have a brief orthostatic response immediately on standing. Always measure the heart rate with orthostatic blood pressure. In normal patients, the heart rate increases from 5 to 12 beats/min with standing. Increases greater than 30 beats/min are abnormal and indicate significant volume depletion.
Orthostatic blood pressure measurements have several limitations. Numerous conditions in addition to volume depletion impair the postural hemodynamic response and result in orthostatic hypotension. Most notable are the effects of aging and medications. Up to 30% of elderly patients demonstrate an orthostatic response in the absence of volume depletion.8 Many elderly patients take medications that alter the postural response to changes in position; such medications include antiadrenergics, antidepressants, antihypertensives, neuroleptics, anticholinergics, and antiparkinsonian drugs. In addition, any disorder causing primary or secondary autonomic dysfunction can lead to orthostatic hypotension.
Physical Examination
Physical examination of the circulatory system begins with the general appearance of the patient. Observe the patient’s positioning, mental status, skin color, and respiratory pattern. Suspect circulatory abnormalities in restless, diaphoretic, delirious, pale, mottled, or tachypneic patients. In addition, note any distinct clinical features implying an underlying medical condition. Table 4.1 lists the characteristic features of disorders that can affect the circulatory system.
Table 4.1 Characteristics of Conditions That Affect the Circulatory System
| CONDITION | CLINICAL APPEARANCE | POTENTIAL CIRCULATORY IMPLICATIONS |
|---|---|---|
| Marfan syndrome | Arachnodactyly Arm span greater than height Longer pubis-to-foot length than pubis-to-head length |
Aortic dissection |
| Osteogenesis imperfecta | Blue sclera | Aortic dissection Aortic aneurysm Aortic valve insufficiency Mitral valve prolapse |
| Hyperthyroidism | Exophthalmos | Congestive heart failure |
| Hypothyroidism | Expressionless face Periorbital edema Loss of lateral third of the eyebrows Dry, sparse hair |
Congestive heart failure Pericardial effusion |
| Hemochromatosis | Bronze pigmentation of skin Loss of axillary and pubic hair |
Cardiomyopathy |
| Turner syndrome | Short stature Webbed neck “Shield” chest Medial deviation of the extended forearm |
Aortic coarctation |
| Aortic insufficiency | Bobbing of the head with heartbeat Systolic flushing of the nail beds |
— |
Examine the head and neck for abnormalities suggesting circulatory disease. Facial edema implies impaired venous return resulting from conditions such as superior vena cava thrombosis and constrictive pericarditis. Examination of the jugular venous pulse provides important information about central venous pressure (CVP) and the dynamics of the right side of the heart.9 Place the patient in a 45-degree recumbent position and shine a light tangentially across the neck. The right side is preferred because of its anatomic alignment with the superior vena cava and right atrium. Beginning at the sternal notch, measure the height (in centimeters) of the internal jugular vein pulsations. Pulsations more than 4 cm above the sternal notch are abnormal and a sign of elevated CVP.9 Figure 4.3 illustrates jugular venous distention in a young woman with pericardial effusion.
