Prevalence of Sensitive Skin by Continent
|
Europe(%) |
North America (%) |
South America (%) |
Asia (%) |
|
|
Very sensitive |
13.1 |
9.3 |
9.9 |
6.8 |
|
Rather sensitive |
27.9 |
35.3 |
24.3 |
26.8 |
|
Slightly sensitive |
35.6 |
34.7 |
32.6 |
37.2 |
|
Not sensitive |
23.4 |
20.7 |
33.2 |
28.9 |
TABLE 2.2
Prevalence of Sensitive Skin by Country
|
Very Sensitive (%) |
Sensitive (%) |
Slightly Sensitive (%) |
Not Sensitive (%) |
|
|
Belgium |
10.46 |
16.53 |
33.26 |
39.75 |
|
Brazil |
9.93 |
24.30 |
32.55 |
33.24 |
|
France |
12.00 |
40.10 |
28.70 |
19.20 |
|
Germany |
16.23 |
19.44 |
23.25 |
41.08 |
|
Greece |
8.83 |
21.77 |
39.43 |
29.98 |
|
India |
6.30 |
23.70 |
37.10 |
32.80 |
|
Italy |
17.65 |
36.92 |
35.90 |
9.53 |
|
Japan |
8.47 |
46.00 |
40.13 |
5.40 |
|
Korea |
14.20 |
42.60 |
32.60 |
9.60 |
|
Portugal |
14.03 |
13.43 |
56.51 |
16.03 |
|
Russia |
10.35 |
29.37 |
38.18 |
22.10 |
|
Spain |
12.65 |
19.08 |
54.82 |
13.45 |
|
Switzerland |
12.75 |
18.42 |
28.74 |
40.08 |
|
United States |
9.26 |
35.31 |
34.71 |
20.72 |
Concerning China, a community-based study was undertaken in three major cities in China—Beijing, Shanghai, and Guangzhou—from November 2009 to January 2010. A total of 9154 questionnaires were completed (3931 men and 5223 women). The mean prevalence of very sensitive and sensitive skins in the three cities was 13% (17.12% in Beijing, 9.10% in Shanghai, and 22.39% in Guangzhou). The mean prevalence was 8.62% in men and 15.93% in women, with significant difference between men and women in three selected cities (P < .001). The total prevalence of very sensitive and sensitive skins was 16.44% in the <25 years group, 14.14% in the 25–49 years group, and 9.73% in the ≥50 years group. Moreover, 18.54% of participants claimed to have dry skin, 16.70% claimed to have greasy skin, and 8.04% with normal skin claimed to have the symptoms of sensitive skin.
TABLE 2.3
Prevalence of Sensitive Skin by Continent in Men
|
Europe (%) |
North America (%) |
South America (%) |
Asia (%) |
|
|
Sensitive |
32.4 |
38.0 |
22.5 |
30.0 |
|
Not sensitive |
67.6 |
62.0 |
77.5 |
70.0 |
TABLE 2.4
Prevalence of Sensitive Skin by Continent in Women
|
Europe (%) |
North America (%) |
South America (%) |
Asia (%) |
|
|
Sensitive |
48.2 |
50.9 |
45.9 |
37.3 |
|
Not sensitive |
51.8 |
49.1 |
54.1 |
62.7 |
TABLE 2.5
Prevalence of Sensitive Skin according to Sex
|
Men (%) |
Women (%) |
Global (%) |
|
|
Belgium |
22.2 |
31.2 |
26.9 |
|
Brazil |
22.5 |
45.9 |
34.5 |
|
France |
44.1 |
59.4 |
52.0 |
|
Germany |
27.5 |
43.5 |
35.7 |
|
Greece |
23.0 |
37.7 |
30.5 |
|
India |
26.2 |
33.7 |
29.9 |
|
Italy |
51.5 |
57.5 |
54.6 |
|
Japan |
52.9 |
56.0 |
54.5 |
|
Korea |
54.4 |
59.2 |
56.8 |
|
Portugal |
28.5 |
26.5 |
27.5 |
|
Russia |
25.4 |
50.1 |
38.9 |
|
Spain |
27.9 |
35.4 |
31.7 |
|
Switzerland |
22.5 |
38.8 |
30.8 |
|
United States |
38.0 |
50.9 |
44.6 |
We can see that the prevalence data of sensitive skin in the three cities of China are much lower than those in Europe and the United States. There was significant difference in the prevalence of sensitive skin among the three cities, which are located in different climatic and latitude regions, and between men and women. The prevalence gradually decreased with increasing age.
From these studies, we can conclude that there are differences between countries. However, there is consistency among the data:
• Sensitive skin is very common.
• The prevalence of sensitive skin is higher in women than in men.
• Skin sensitivity occurs in people with or without any skin disease, but it is more common in individuals with a history of atopic dermatitis or other skin diseases.
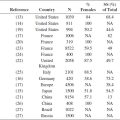
Some other studies performed by other methodologies confirm these data. To our knowledge, the first one was conducted in England (11). Because several studies were performed in the United States, this allows some comparisons. Hence, the comparison of four studies (with different methodologies) suggests that the frequency of sensitive skin might increase (12).
REFERENCES
1. Misery L, Myon E, Martin N, Verrière F, Nocera T, Taïeb C. Sensitive skin in France: An epidemiological approach. Ann Dermatol Venereol. 2005; 132: 425–9.
2. Misery L, Boussetta S, Nocera T, Perez-Cullell N, Taïeb C. Sensitive skin in Europe. J Eur Acad Dermatol Venereol. 2009; 23: 376–81.
3. Misery L, Myon E, Martin N et al. Sensitive skin: Psychological effects and seasonal changes. J Eur Acad Dermatol Venereol. 2007; 21: 620–6.
4. Misery L, Sibaud V, Taïeb C. Sensitive skin in the American population: Prevalence, clinical data and role of the dermatologist. Int J Dermatol 2011; 50: 961–7.
5. Kamide R, Misery L, Perez-Cullell N, Sibaud V, Taïeb C. Sensitive skin evaluation in the Japanese population. J Dermatol 2013; 40: 177–81.
6. Taïeb C, Auges M, Georgescu V, Perez-Cullell N, Misery L. Sensitive skin in Brazil and Russia: An epidemiological and comparative approach. Eur J Dermatol 2014; 24: 372–6.
7. Brenaut E, Misery L, Taïeb C, Sheth R. Sensitive skin in India: An epidemiological and comparative approach. In press.
8. Misery L, Taïeb C. Sensitive Skin in Korea: An Epidemiological and Comparative Approach. San Francisco: American Academy of Dermatology. 2015.
9. Xu F, Yan S, Wu M, Li F, Sun Q, Lai W, Shen X, Rahhali N, Taïeb C, Xu J. Self-declared sensitive skin in China: A community-based study in three top metropolises. J Eur Acad Dermatol Venereol. 2013; 27: 370–5.
10. Hansen MH, Hurwitz WN, Madow WG. Sample Survey Methods and Theory, Volume 1: Methods and Applications. New York: Wiley. 1993.
11. Willis CM, Shaw S, de Lacharrière O, Baverel M, Reiche L, Jourdrain R, Bastien P, Wilkinson JD. Sensitive skin: An epidemiological approach. Br J Dermatol. 2001; 145: 258–63.
12. Farage MA, Miller KW, Wippel AM, Berardesca E, Misery L, Maibach H. Sensitive skin in the United States: Surveys of regional differences. Family Med Medical Sci Res 2013; 2: 112.