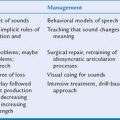
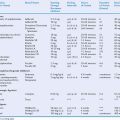
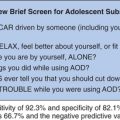
CHAPTER 7 Screening and Assessment Tools
7A. Measurement and Psychometric Considerations
In a general pediatric population, practitioners can expect 8% of their patients to experience significant developmental or behavioral problems between the ages of 24 and 72 months, this rate increasing to 12% to 25% during the first 18 years.1,2 Therefore, consideration and interpretation of tests and rating scales are part of the clinician’s day-to-day experience, regardless of whether the choice is made to administer evaluations or review test or rating scale data obtained by other professionals.
This chapter is an introduction to the section on assessment and tools. It contains topics such as: discussion of descriptive statistics (e.g., mean, median, mode), distributions of scores and standard deviations, transformation of scores (percentiles, z-scores, T-scores), psychometric concerns (sensitivity, specificity, positive and negative predictive values), test characteristics (reliability, validity), and age and grade equivalents. Many of these topics are also elaborated in greater detail in subsequent chapters of this text. A more thorough discussion of psychological assessment methods can be found in Sattler’s text.3
Developmental and psychological evaluations usually include measurement of a child’s development, behavior, cognitive abilities, or levels of achievement. Comprehensive child assessments involve a multistage process that incorporates planning, collecting data, evaluating results, formulating hypotheses, developing recommendations, and conducting follow-up evaluations.3 Test data provide samples of behavior, with scores representing measurements of inferred attributes or skills. These scores are relative and not absolute measures, and rating scales and test instruments are typically used to compare a child to a standardized, reference group of other children. Approximately 5% of the general population obtains scores that fall outside the range of “normal.” However, the range of normal is descriptive, not diagnostic: it describes problem-free individuals, but does not provide a diagnosis for them.3 No test is without error, and scores may fall outside the range of normal simply as a result of chance variation or issues such as refusal to take a test. Three major sources of variation that may affect test data include characteristics of a given test, the range of variation among normal children, and the range of variation among children who have compromised functioning.
In general, regardless of whether a measurement tool is designed to be used as an assessment or a screening instrument, the normative sample on which the test is based is critical. Test norms that are to be applied nationally should be representative of the general population. Demographics must proportionately reflect characteristics of the population as a whole, taking into account factors such as region (e.g., West, Midwest, South, Northeast), ethnicity, socioeconomic status, and urban/rural setting. If a test is developed with a nonrepresentative population, characteristics of that specific sample may bias norms and preclude appropriate application to other populations. Adequate numbers of children need to be included at each age across the age span evaluated by a given test so as to enhance stability of test scores. Equal numbers of boys and girls should be included. Clinical groups should also be included for comparison purposes. Convenience samples, or those obtained from one geographic location are not appropriate for development of test norms.
Tests generally need to be reduced and refined by eliminating psychometrically poor items during the development phase. Conventional item analysis is one such approach and involves evaluation of an item difficulty statistic (percentage of correct responses) and patterns of responses. The use of item discrimination indexes (item-total correlations) and item validity (discrimination between normative and special groups, by T-tests or chi square analyses) is routine. More recent tests such as the Bayley Scales of Infant and Toddler Development—Third Edition (BSID-III)4 or the Stanford-Binet V5 employ inferential norming6 or item response theory.7 Item response theory analyses involve difficulty calibrations for dichotomous items and step differences for polychotomous items, the goal being a smooth progression of difficulty across each subtest (e.g., as in the Rasch probabilistic model8). Item bias and fairness analysis are also components; this procedure is called differential item functioning.9 See Roid5 or Bayley4 for a more detailed description of these procedures.
STANDARDIZED ASSESSMENTS
Standardized normreferenced assessments (SNRAs) are the tests most typically administered to infants, children, and adolescents. The most parsimonious definition of SNRAs is that they compare an individual child’s performance on a set of tasks presented in a specific manner with the performance of children in a reference group. This comparison is typically made on some standard metric or scale (e.g., scaled score).10 Although there may be some allowance for flexibility in rate and order of administration procedures (particularly in the case of infants), administration rules are precisely defined. The basis for comparison of scores is that tasks are presented in the same manner across testings, and there are existing data that represent how similar children have performed on these tasks. However, if this format is modified, additional variability is added, precluding accurate comparison of the child’s data and those of the normative group.
Use of SNRAs is not universally endorsed, particularly with regard to infant assessment, because of concerns regarding one-time testing in an unfamiliar environment, different objectives for testing, and linkage to intervention, instead of diagnosis. Therefore, emphasis is placed on alternative assessments that rely on criterion-referenced and curriculum-based approaches. In actuality, curriculum-based assessment is a type of a criterion-referenced tool. These assessments can help to answer the second question posed previously and could also better delineate the child’s strengths. Both provide an absolute criterion against which a child’s performance can be evaluated. In criterion-referenced tests, the score a child obtains on a measurement of a specific area of development reflects the proportion of skills the child has mastered in that particular area (e.g., colors, numbers, letters, shapes). For example, in the Bracken Basic Concepts Scale—Revised,11 in addition to normreferenced scores, examiners can also determine the percentage of mastery of skills in the six areas included in the School Readiness Composite. More specifically, in the colors subtest, the child is asked to point to colors named by the examiner. This raw score can be converted to a percentage of mastery, which is computed regardless of age. Similarly, other skills such as knowledge of numbers and counting or letters can be gauged. In curriculum-based evaluations, the emphasis is on specific objectives that are to be achieved, the potential goal being intervention planning.12,13 The Assessment, Evaluation, and Programming System for Infants and Children14 and the Carolina Curricula for Infants and Toddlers with Special Needs15 are examples of curriculum-based assessments. Therefore, SNRAs, criterion-referenced tests, and curriculum-based tests each have a role, depending on the intended purpose of the evaluation.
PRIMER OF TERMINOLOGY USED TO DETECT DYSFUNCTION
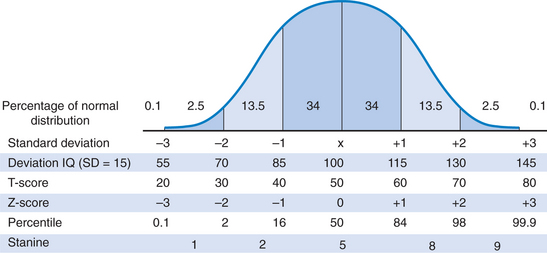
The normal range is a statistically defined range of developmental characteristics or test scores measured by a specific method. Figure 7A-1 depicts a normal distribution or bell-shaped curve. This concept is critical in the development of test norms and provides a basis for the following discussion.
Descriptive Statistics
The mean (M) is a measure of central tendency and is the average score in a distribution. Because it can be affected by variations caused by extreme scores, the mean can be misleading in scores obtained from a highly variable sample. In Figure 7A-1, the mean score is 100.
The median is defined as the middle score that divides a distribution in half when all the scores have been arranged in order of increasing magnitude. It is the point above and below which 50% of the scores fall. This measure is not affected by extreme scores and therefore is useful in a highly variable sample. In the case of an even number of data points in a distribution, the median is considered to be halfway between two middle scores. Noteworthy is the fact that in the normal distribution depicted in Figure 7A-1, the mean, mode, and median are equal (all scores = 100), and the distribution is unimodal.
The range is a measure of dispersion that reflects the difference between the lowest and highest scores in a distribution (highest score − the lowest score +1). However, the range does not provide information about data found between two extreme values in the test distribution, and it can be misleading when the clinician is dealing with skewed data. In this situation, the interquartile range may be more useful: The distribution of scores is divided into four equal parts, and the difference between the score that marks the 75th percentile (third quartile) and the score that marks the 25th percentile (first quartile) is the interquartile range.16
The standard deviation (SD) is a measure of variability that indicates the extent to which scores deviate from the mean. The standard deviation is the average of individual deviations from the mean in a specified distribution of test scores. The greater the standard deviation, the more variability is found in test scores. In Figure 7A-1, SD = 15 (the typical standard deviation in normreferenced tests). In a normal distribution, the scores of 68% of the children taking a test will fall between +1 and −1 standard deviation (square root of the variance). In general, most intelligence and developmental tests that employ deviation quotients have a mean of 100 and a standard deviation of 15. Scaled scores, such as those found in the Wechsler tests, have a mean of 10 and a standard deviation of 3 (7 to 13 being the average range). If a child’s score falls less than 2 standard deviations below average on an intelligence test (i.e., IQ < 70), he or she may be considered to have a cognitive-adaptive disability (if adaptive behaviors are also impaired).
Skewness refers to test scores that are not normally distributed. If, for example, an IQ test is administered to an indigent population, the likelihood that more children will score below average is increased. This is a positively skewed distribution (the tail of the distribution approaches high or positive scores, i.e. the right portion of the x-axis). Here, the mode is a lower score than the median, which, in turn is lower than the mean. Probabilities based on a normal distribution will yield an underestimate of the scores at the lower end and an overestimate of the scores at the higher end. Conversely, if the test is administered to children of high socioeconomic status, the distribution might be negatively skewed, which means that most children will do well (the tail of the distribution trails toward lower scores or the left portion of the x-axis). In negatively skewed distributions, the value of the median < mean < mode scores at the lower end will be overestimated, and those at the upper end will be underestimated. Skewness has significant ramifications in interpretation of test scores. In fact, the meaning of a score in a distribution depends on the mean, standard deviation, and the shape of the distribution.
Transformations of Raw Scores
LINEAR TRANSFORMATIONS
Linear transformations provide information regarding a child’s standing in comparison to group means. The z-score is a standard score (standardization being the process of converting each raw score in a distribution into a z-score: raw score − the mean of the distribution, divided by the standard deviation of the distribution) that corresponds to a standard deviation; that is, a z-score of +1 is 1 standard deviation above average and a z-score of −1 is 1 standard deviation below average. The mean equals a z-score of 0; therefore scores between z-scores of −1 and +1 are in the average range. Stated differently, if a child receives a z-score of +1, he or she obtained a score higher than those of 84% of the population (see Fig. 7A-1).
AREA TRANSFORMATIONS
The stanine is short for standard nine, and this metric divides a distribution into nine parts. The mean = 5, and the SD = 2, with the third to seventh stanine being considered the average range. Approximately 20% of children score in the fifth stanine, 17% each in the fourth and sixth stanines, and 12% each in the third and seventh stanines (78% in total). Stanines are frequently encountered with group administered tests such as the Iowa Tests of Basic Skills, the Metropolitan Achievement Tests, or the Stanford Achievement Tests. The interrelatedness of these scores is depicted in Figure 7A-1.
PSYCHOMETRIC CONCERNS
Sensitivity and Specificity
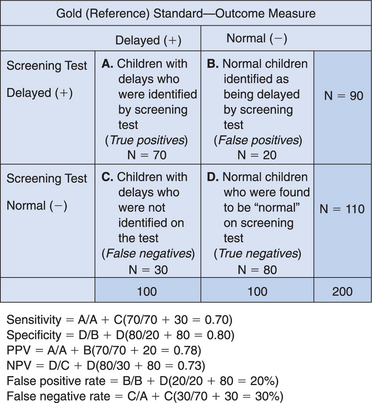
Frequently, interpretation of test results must take into account how well the instrument performs with set cutoff scores. Sensitivity is a measure of the proportion of children with a specific problem who are positively identified by a test, with a specific cutoff score. Children who have a disorder but are not identified by the test are considered to have false-negative scores. In developmental/behavioral pediatrics, the “gold standard” (criterion used to determine the presence of a given problem) often is not definitive but rather is a reference standard. Comparison with an imperfect “gold standard” may lead to erroneous conclusions that a screening test is inaccurate. As a result, sensitivity may be better conceptualized as copositivity. Desired sensitivity rates are 70% to 80%, and sensitivity is the true positive rate of a test.
Cutoff scores can be adjusted to enhance sensitivity. By making criteria more inclusive, fewer children with true abnormalities will be missed; however, a more restrictive cutoff will also increase the probability of false-positive findings (overidentifying “normal” children as being abnormal). Conversely, if the cutoff score is made more exclusive to enhance specificity, the number of normal children inaccurately identified as abnormal is decreased, but some of those who are truly abnormal will be erroneously called normal (false-negative findings). Sensitivity and specificity are described in Figure 7A-2.
Frequency of a Disorder/Problem
Base rate is the naturally occurring rate of a given disorder. For example, the base rate of learning disabilities would be much higher in children referred to a learning and attention disorders clinic than in the general population. If a screening instrument were used to detect learning disabilities for this group, sensitivity and specificity values would differ from those found in the general pediatric population. For example, in the follow-up of low-birth-weight infants, the base rate for major handicaps (moderate to severe mental retardation; cerebral palsy; epilepsy; deafness or blindness) is 15%; therefore, in 85% of this population, the findings would be true negative. Low base rates increase the possibility of false-positive results. High base rates do not leave much room for improvement in terms of locating true-positive scores and result in an increase in false-negative findings. Tests can be most helpful in decision making when the base rate is in the vicinity of 0.50. Therefore, particularly in the case of screening, the relatively low base rates of developmental problems in very young children may increase the probability of false positive findings. However, in such situations, this scenario is more desirable than the converse: false negative findings.
Relative risk provides an alternative strategy for evaluating test accuracy.17,18 This approach involves use of the likelihood ratio, which indicates the increased probability that the child will display a developmental problem, if the results of an earlier screening test were abnormal or suspect. This approach recognizes that not all children at early risk will later manifest a developmental problem, but there is a greater likelihood that they will. If a problem or disorder is rare, relative risk and odds ratios are nearly equal.
Test Characteristics
RELIABILITY
Reliability is affected by test length (longer tests are more reliable), test-retest interval (longer interval lessens reliability), variability of scores (greater variance increases reliability estimate), guessing (increased guessing decreases reliability), variations in test situation, and practice effects.3
VALIDITY
Content validity determines whether the items in the test are representative of the domain the test purports to measure: that is, whether the test does cover the material it is supposed to cover. Construct validity concerns whether the test measures a particular psychological construct or trait (e.g., intelligence). Criterion-related validity involves the current relationship between test scores and some criterion, such as results of another test. Criterion-related validity can be concurrent (convergent) or predictive. In both instances, the results of a test under consideration are compared to an established reference standard to determine whether findings are comparable. In concurrent validity, the two tests (e.g., a screen such as the Bayley Infant Neurodevelopmental Screener and a “reference standard” such as the BSID-II) are administered at the same time, and the results are correlated. With predictive validity, a screening test might be given at one time, followed by administration of the reference standard at a later date (e.g., the BSID-II is given to children aged 36 months, and the Wechsler Preschool and Primary Scales of Intelligence—III at age 4½ years). Discriminant validity shows how well a screening test detects a specific type of problem. For example, autism might be the condition of concern, and a screening test such as the Modified Checklist for Autism in Toddlers (M-CHAT) is used to distinguish children with this disorder from those with mental retardation without autism. Face validity involves whether the test appears to measure what it is supposed to measure. Test-related factors (examiner-examinee rapport, handicaps, motivation), criterion-related factors, or intervening events could affect validity.
With regard to the interrelatedness among reliability and validity, reliability essentially sets the upper limit of a test’s validity, and reliability is a necessary but not sufficient condition for valid measurement. A specific test can be reliable, but it may be invalid when used to evaluate a function that it was not designed to measure. However, if a test is not reliable, it cannot be valid. Stated differently, all valid tests are reliable, unreliable tests are not valid, and reliable tests may or may not be valid.19
Age and Grade Equivalents
The IQ/DQ ratio (developmental quotient) is computed as mental age (obtained by the use of a test score) ÷ the child’s chronologic age and then multiplied by 100. Although developmental age refers to a level of functioning, DQ reflects the rate of development.19 IQ/DQ ratio scores are not comparable at different age levels because the standard deviation (variance) of the ratio does not remain constant. As a result, interpretation is difficult, and these scores generally are not used very much in contemporary standardized testing. Instead, the deviation IQ/DQ is employed. The deviation IQ is a method of estimation that allows comparability of scores across ages and is used with most major psychological and developmental test instruments. The deviation IQ/DQ is norm referenced and normally distributed, with the same standard deviation; typically, M = 100 and SD = 15. Therefore, a deviation IQ of 85 obtained at age 6 should have the same meaning as a score of 85 obtained at age 9.
A final concern is the Flynn effect,20 in which test norms increase approximately 0.3 to 0.5 points per year, which is equivalent to a 3- to 5-point increment per decade. This finding has ramifications in comparisons of scores obtained on earlier versions of tests to more contemporary scores (e.g., WISC-Revised to the WISC—Third Edition or WISC-IV; BSID to BSID-II; Stanford-Binet form LM to the 5th edition). Caution is warranted when the practitioner attributes a decline in scores to a loss of cognitive ability, because in actuality this decline may be attributable to the fact that a newer test has mean scores that are considerably lower than those of an earlier version of the test (e.g., 5-8 points).20 This issue would also have ramifications for children whose IQ score on an older version of a test is in the low 70s but decreases to below the cutoff for mild mental retardation on a newer version.
Although some practitioners may administer tests, all have occasion to respond to inquiries from parents about their child’s test performance or diagnosis derived from testing. The physician’s role includes explaining test results to parents, acknowledging parental concerns and advocating for the child, providing additional evaluation, or referring to other professionals.21
1 Costello EJ, Edelbrock C, Costello AJ, et al. Psychopathology in pediatric primary care: The new hidden morbidity. Pediatrics. 1988;82:415-424.
2 Lavigne JV, Binns HJ, Christoffel KK, et al. Behavioral and emotional problems among preschool children in pediatric primary care: Prevalence and pediatricians’ recognition. Pediatrics. 1993;91:649-657.
3 Sattler JM. Assessment of Children, 4th ed. San Diego: Jerome M. Sattler, 2001.
4 Bayley N. Bayley Scales of Infant and Toddler Development, Third Edition: Technical Manual. San Antonio, TX: PsychCorp, 2005.
5 Roid GH. Stanford-Binet Intelligence Scales for Early Childhood, Fifth Edition: Manual. Itasca, IL: Riverside, 2005.
6 Wilkins C, Rolfhus E, Weiss L, et al: A Simulation Study Comparing Inferential and Traditional Norming with Small Sample Sizes. Paper presented at annual meeting of the American Educational Research Association, Montreal, Canada, 2005.
7 Wright BD, Linacre JM. WINSTEPS: Rasch Analysis for All Two-Facet Models. Chicago: MESA, 1999.
8 Rasch G. Probabilistic Models for Some Intelligence and Attainment Tests. Chicago: University of Chicago Press, 1980.
9 Dorans NJ, Holland PW. DIF detection and description: Mantel-Haenszel and standardization. In: Holland PW, Wainer H, editors. Differential Item Functioning. Mahwah, NJ: Erlbaum; 1993:35-66.
10 Gyurke JS, Aylward GP. Issues in the use of normreferenced assessments with at-risk infants. Child Youth Fam Q. 1992;15:6-8.
11 Bracken BA. Bracken Basic Concepts Scale-Revised. San Antonio, TX: The Psychological Corporation, 1998.
12 Greenspan SI, Meisels SJ. Toward a new vision for the developmental assessment of infants and young children. In: Meisels SJ, Fenichel E, editors. New Visions for the Developmental Assessment of Infants and Young Children. Washington, DC: Zero to Three: National Center for Infants Toddlers and Families; 1996:11-26.
13 Meisels S. Charting the continuum of assessment and intervention. In: Meisels SJ, Fenichel E, editors. New Visions for the Developmental Assessment of Infants and Young Children. Washington, DC: Zero to Three: National Center for Infants Toddlers and Families; 1996:27-52.
14 Bricker D. Assessment, Evaluation and Programming System for Infants and Children, Volume 1: AEPS Measurement for Birth to Three Years. Baltimore: Paul H. Brookes, 1993.
15 Johnson-Martin N, Jens K, Attermeir S, et al. The Carolina Curriculum, 2nd ed. Baltimore: Paul H. Brookes, 1991.
16 Urdan T. Statistics in Plain English. Mahwah, NJ: Erlbaum, 2001.
17 Frankenburg WK, Chen J, Thornton SM. Common pitfalls in the evaluation of developmental screening tests. J Pediatr. 1988;113:1110-1113.
18 Frankenburg WK. Preventing developmental delays: Is developmental screening sufficient? Pediatrics. 1994;93:586-593.
19 Salvia J, Ysseldyke JE. Assessment, 8th ed. New York: Houghton Mifflin, 2001.
20 Flynn JR. Searching for justice. The discovery of IQ gains over time. Am Psychol. 1999;54:5-20.
21 Aylward GP. Practitioner’s Guide to Developmental and Psychological Testing. New York: Plenum Medical, 1994.
7B. Surveillance and Screening for Development and Behavior
More than three decades have elapsed since the identification of developmental, behavior, and psychosocial problems as the so-called “new morbidity” of pediatric practice.1 During the ensuing years, profound societal change, with public policy mandates for deinstitutionalization and mainstreaming, has further influenced the composition of pediatric practice. Studies have documented the high prevalence of developmental and behavioral issues within the practice setting, including disorders of high prevalence and lower severity such as specific learning disability, attention-deficit/hyperactivity disorder, and speech and language impairment, as well as problems of higher severity and lower prevalence such as mental retardation, autism, cerebral palsy, hearing impairment, and serious emotional disturbance.2
The critical influence of the early childhood years on later school success and the well-documented benefits of early intervention provide a strong rational for the early detection of children at risk for adverse developmental and behavioral outcomes. Neurobiological, behavioral, and social science research findings from the 1990s, the so-called decade of the brain, have emphasized the importance of experience on early brain development and on subsequent development and behavior and the extent to which the less differentiated brain of the younger child is particularly amenable to intervention.3
BACKGROUND
Early identification and intervention affords the opportunity to avert the inevitable secondary problems with loss of self-esteem and self-confidence that result from years of struggle with developmental dysfunction. Federal legislation, the Individuals with Disabilities Education Act (IDEA) of 2004, and related state legislation mandate early detection and intervention for children with developmental and behavioral disabilities. Surveys indicate that parents have strong interest in promoting children’s optimal development.4,5
Perhaps the most compelling rationale for early detection is the effectiveness of early intervention. Researchers have documented the benefits of early intervention in children with mental retardation and physical handicaps, particularly when improved family functioning is a measured outcome.6 More recently, the benefits of early intervention for children at environmental risk has also been demonstrated. For example, enrollment and participation of disadvantaged children in Head Start programs contribute to a decreased likelihood of grade repetition, less need for special education services, and fewer school dropouts.7 Detection is also supported by the clearer delineation of adverse influences on children’s development. For example, the effect of such diverse factors as low-level lead exposure and adverse parent-infant interaction on child development has implications for early identification.
By virtue of their access to young children and their families, child health providers are particularly well positioned to participate in early identification of children at risk for adverse outcomes through ongoing monitoring of development and behavior. Clinicians’ knowledge of medical and genetic factors also facilitates early identification of conditions associated with developmental problems. Furthermore, through their relationships with children and their families, pediatricians and other child health providers are familiar with the social and familial factors that place children at environmental risk. Professional guidelines emphasize the importance of early detection by child health providers. The American Academy of Pediatrics’ Committee on Children with Disabilities; Medicaid’s Early Periodic Screening, Diagnosis, and Treatment (EPSDT) program; and Bright Futures (guidelines for health supervision of infants, children, and adolescents developed by the American Academy of Pediatrics and the Maternal and Child Health Bureau) all encourage the effective monitoring of children’s development and behavior and the prompt identification of children at risk for adverse outcomes.8,9 The emphasis on the primary care practice as a comprehensive medical home for all children also supports the office as the ideal medical setting for developmental and behavioral monitoring.10
Despite this strong rationale, results of surveys of parents and child health providers demonstrate that current practices widely vary and suggest the need to strengthen developmental monitoring and early detection. Only about half of parents of children aged between 10 and 35 months recall their children’s ever having received structured developmental assessments from their child health providers.11 Parents also report gaps in the discussion of development and related issues with pediatric providers.12 Most pediatricians employ informal, nonvalidated approaches to developmental screening and assessment. The majority of pediatricians do not incorporate within their practice such tools as those recommended by Bright Futures to aid in early detection.13
Not surprisingly, the early detection of children at risk for adverse developmental and behavioral outcomes has proved elusive. Fewer than 30% of children with such disabilities as mental retardation, speech and language impairments, learning disabilities, and serious emotional/behavioral disturbances are identified before school entry.13 This lack of detection precludes the opportunity and benefits of timely, early intervention. Although nearly half of parents have some concerns for their child’s development or behavior, such concerns are infrequently elicited by child health providers.14
DEVELOPMENTAL SURVEILLANCE
Currently, child health providers employ a variety of techniques to monitor children’s development and behavior. History taking during a health supervision visit typically includes a review of age-appropriate developmental milestones. Unfortunately, recall of such milestones is notoriously unreliable and typically reflects parents’ prior conceptions of children’s development.15 Although the accuracy in determining the age of performing certain tasks is certainly improved by the use of diaries and records, the wide range of normal acquisition for such milestones limits their value in assessing children’s developmental progress. Child health providers may also question parents as to their predictions for their child’s development. Predictions (typically elicited with questions such as “when your child becomes an adult, do you think he or she will be above average, average, or below average?”) are also unhelpful in developmental monitoring, because parents are likely to expect average functioning for children with delays and predict overachievement for children developing at an average pace, a phenomenon dubbed the presidential syndrome.15
During the physical examination, child health providers may interact with children by using an informal collection of age-appropriate tasks. The lack of a standardized approach to measuring developmental progress makes interpretation of children’s performance on such tasks difficult. The reliance of child health providers on “clinical judgment,” based on subjective impressions during the performance of the history and physical examination, are also fraught with hazard. Such impressions are unduly influenced by the extent to which a child is verbal and sociable in a setting that may be frightening, an effect likely to restrict affect and deter spontaneous demonstrations of pragmatic language skills. Studies have documented the poor correlation between provider’s subjective impressions of children’s development and the results of formal assessments. Clinical judgment identifies fewer than 30% of children with developmental disabilities.15 The reliance on subjective impressions undoubtedly contributes to the late identification of children with such developmental issues as mild mental retardation.
According to research findings and expert opinion, surveillance and screening constitute the optimal approach to developmental monitoring.16 As originally described by British investigators, surveillance encompasses all activities relating to the detection of developmental problems and the promotion of development through anticipatory guidance during primary care.17 Developmental surveillance is a flexible, longitudinal, continuous process in which knowledgeable professionals perform skilled observations during child health care.17 Although surveillance is most typically performed during health supervision visits, clinicians may perform opportunistic surveillance during sick visits by exploring the child’s understanding of illness and treatment.18a
The emphasis of developmental surveillance is on skillfully observing children and identifying parental concerns. Components include eliciting and attending to parents’ opinions and concerns, obtaining a relevant developmental history, skillfully and accurately observing children’s development and parent-child interaction, and sharing opinions and soliciting input from other professionals (e.g., visiting nurse, child care provider, preschool and school teacher), particularly when concerns arise. Developmental history should include an exploration of both risk and protective factors, including environmental, genetic, biological, social, and demographic influences, and observations of the child should include a careful physical and neurological examination. Surveillance stresses the importance of viewing the child within the context of overall well-being and circumstance.17
The most critical component of surveillance is eliciting and attending to parents’ opinions and concerns. Research has elucidated the value of information available from parents. Although there are several ways to obtain quality information, research on parents’ concerns is voluminous. Concerns are particularly important indicators of developmental problems, particularly for speech and language function, fine motor skills, and general functioning (e.g., “He’s just slow”).15,18 Although concerns about self-help skills, gross motor skills, and behavior are less sensitive indicators of developmental functioning, such opinions should serve as clinical “red flags,” mandating closer clinical assessment and developmental promotion.15,18 The manner in which parental concerns are elicited is important. Asking parents whether they have worries about their children’s development is unlikely to be useful, because they may be reluctant to acknowledge fears and interpret “development” as merely reflecting physical growth. In contrast, asking parents whether they have any concerns about the way their child is behaving, learning, and developing, followed by more specific inquiry about functioning in specific developmental domains, is more likely to yield valid and clinically useful responses.18,19 Clinicians must be mindful of the complex relationship between concerns and disability (some concerns are predictors of developmental status only at certain ages), the critical importance of eliciting concerns rather than relying on parents to volunteer, and the value of an evidence-based approach to interpreting concerns.18,21
Parents’ estimations are also accurate indicators of developmental status. For example, a study conducted in primary care demonstrated the extent to which parents’ estimates of cognitive, motor, self-help, and academic skills correlate with findings on developmental assessments.22 Parental responses to the question, “Compared with other children, how old would you say your child now acts?” are important indicators of developmental delay, although such questions are more challenging for parents than elicitations of concerns.22
Parents’ opinions and concerns must be considered within the context of cultural influences. Parents’ appraisals and descriptions are influenced by expectations for children’s normal development, and such expectations vary among different ethnic groups. For example, in a study of Latino (primarily Puerto Rican), African American, and European American mothers, Puerto Rican mothers expected personal and social milestones to be normally achieved at a later age than did the other groups, whereas first steps and toilet training were expected at an older age by European American mothers.23 Such differences were often explained by underlying cultural beliefs, values, and childrearing practices. For example, the older age for achievement of self-help skills is consistent with the Puerto Rican concept of familismo and its emphasis on caring for children.
USE OF SCREENING TOOLS
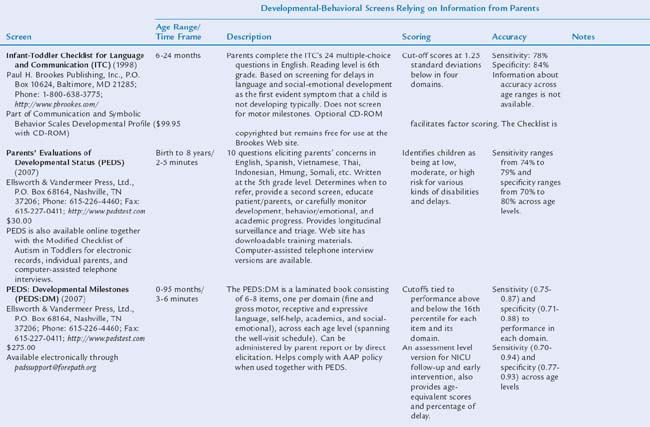
Table 7B-1 includes descriptions of screening tools that are highly accurate: that is, based on nationally representative samples, fulfilling psychometric criteria (see Chapter 7A), and having both sensitivity and specificity of at least 70% to 80%. Two types of tools are presented: those relying on information from parents and those requiring direct elicitation of children’s skills. The latter are useful in practices with staff (e.g., nurses, pediatric nurse practitioners) who have the time and skill to administer relatively detailed screens. Such measures are also useful in early intervention programs. Information is included on purchasing, cost, time to administer, scores produced, and age ranges of the children tested.
COMBINING SCREENING AND SURVEILLANCE
We now present an algorithm for combining surveillance and screening into an effective, evidence-based process for detecting and addressing developmental and behavioral issues. The American Academy of Pediatrics recently revised its policy statement on early detection.8 We include the elements of the statement, as follows.
SYSTEMWIDE APPROACHES TO SURVEILLANCE AND SCREENING
State wide and countywide efforts to enhance collaboration among medical and nonmedical providers offer some of the most promising evidence for the effectiveness of surveillance and screening. Documented outcomes include large increases in screening rates during EPSDT visits;25 a fourfold increase in early intervention enrollment, resulting in a match between the prevalence of disabilities and receipt of services26; a 75% increase in identification of children from birth to age 3 with autism spectrum disorder27; improvement in reimbursement for screening28; and, interestingly, increased attendance at well-child visits when parents’ concerns are elicited and addressed.25
The Assuring Better Child Health and Development (ABCD) Program
Created by The Commonwealth Fund, the ABCD Program has identified policy strategies for state Medicaid agencies to strengthen the delivery and financing of early childhood services for low-income families. The emphasis is on assisting participating states in developing care models that promote healthy development, including the mental development of young children. Models include developmental screening, referral, service coordination, and educational materials and resources for families and clinical providers. The program has resulted in improvements in screening, surveillance, and assessment. Most notably, work in North Carolina facilitated a 75% increase in screening, increased enrollment rates in early intervention from 2.6% to 8% (in line with the Centers for Disease Control and Prevention’s prevalence projections), while simultaneously lowering referral age26 (http://www.nashp.org; http://www.cdc.gov/ncbdd/child/interventions.htm).
Help Me Grow
A program of the Connecticut Children’s Trust Fund, Help Me Grow links children and families to community programs and services by using a comprehensive statewide network. Components of the program include the training of child health providers in effective developmental surveillance; the creation of a triage, referral, and case management system that facilitates access for children and families to services through Child Development Infoline; the development and maintenance of a computerized inventory of regional services that address developmental and behavioral needs of children and their families; and data gathering to systematically document capacity issues and gaps in services. The program has increased identification rates of at-risk children by child health providers and increased referral rates of such children to programs and services. For example, chart reviews conducted in participating practices noted an increase in documented developmental or behavioral concerns from 9% before training to 18% after training. Furthermore, training resulted in significant differences in referral rates for certain conditions. Behavioral conditions were involved in 4% of referrals from trained practices, in comparison with 1% from untrained practices. Four percent of referrals from trained practices were for parental support and guidance, in comparison with fewer than 1% from untrained practices29 (http://www.infoline.org/Programs/helpmegrow.asp).
Promoting Resources in Developmental Education (PRIDE)
Not surprisingly, increasing rates of referral raised the likelihood of even longer waiting lists for tertiary-level developmental-behavioral pediatric evaluations. To address this challenge, the PRIDE staff sought funding from The Commonwealth Fund to study the feasibility and cost effectiveness of a model of “midlevel” developmental-behavioral pediatrics assessment (as a step between telephone triage/record review and comprehensive diagnostic evaluation) for children younger than 6 years.30
First Signs
This national and international training effort is devoted to early detection of children with disabilities, with a particular focus on autism spectrum disorders. This detection is accomplished through a mix of print materials and broadcast press, direct mail, public service announcements, presentations (to medical and nonmedical professionals), a richly informative website (www.firstsigns.org), and detailed program evaluation. Although First Signs initiatives have been conducted in several states, including New Jersey, Alabama, Delaware, and Pennsylvania, the Minnesota campaign is highlighted here because of that state’s assistance in program evaluation. Minnesota is divided into discrete service regions. Centralized train-the-trainers forums were conducted to prepare 130 professionals as outreach trainers. These individuals were from all regions of the state, and most were early interventionists, family therapists, and other nonmedical service providers. They then provided more than 165 workshops to 686 medical providers, to whom they offered individualized training tailored for health care clinics, as well as training for more than 3000 early childhood specialists. First Signs Screening Kits (which include video, information about and in some cases copies of appropriate screening tools, wall charts and parent handouts on warning signs) were distributed to more than 900 practitioners and clinics. In addition, public service announcements were aired across the state in collaboration with the Autism Society of Minnesota. Within 12 months, there was a 75% increase in the number of young children identified in the 0- to 2-year age group and an overall increase of 23% in detection of autism spectrum disorders among all children aged 0 to 21 years in that same period. The state has now expanded the initiative to include childcare providers and is educating them about red flags and warning signs. In addition, physicians with the Minnesota Chapter of the American Academy of Pediatrics Committee for Children with Disabilities have begun incorporating First Signs information into physician training program at the University of Minnesota.27
Blue Cross/Blue Shield of Tennessee
Blue Cross/Blue Shield of Tennessee requested that child health providers use standardized, validated screening at all EPSDT visits. To facilitate compliance, Blue Cross/Blue Shield of Tennessee piloted a program in 34 high-volume, Medicaid-managed care practices. Outreach nurses, called regional clinical network analysts, trained providers on site how to administer, score, interpret, and submit reimbursement for the Parents’ Evaluation of Developmental Status questionnaire (the standardized developmental-behavioral surveillance and screening instrument that elicits parents’ concerns about their children). After training, screening rates increased from 0% to 43.5% during the pilot phase. At the same time, the practices experienced a 16% increase in attendance at scheduled well-child visits, which suggests that focusing on parents’ concerns may increase their adherence to visit schedules. Blue Cross/Blue Shield of Tennessee, together with the Tennessee Chapter of the American Academy of Pediatrics, is now providing training across the state.25 More information can be found through the Center for Health Care Strategies, “Best Clinical and Administrative Practices for Statewide” developmental and behavioral screening initiatives as established by the Center for Health Care Strategies [http://www.chcs.org/]
Healthy Steps for Young Children
This a national initiative improves traditional pediatric care with the assistance of an in-office child development specialist, whose duties include expanded discussions of preventive issues during well-child and home visits, staffing a telephone information line, disseminating patient education materials, and networking with community resources and parent support groups. Now in its 12th year, Healthy Steps followed its original cohort of 3737 intervention and comparison families from 15 pediatric practices in varied settings. In comparison with controls, Healthy Steps families received significantly more preventive and developmental services, were less likely to be dissatisfied with their pediatric primary care, and had improved parenting skills in many areas, including adherence to health visits, nutritional practices, developmental stimulation, appropriate disciplinary techniques, and correct sleeping position. In practices serving families with incomes below $20,000, use of telephone information lines increased from 37% before the intervention to 87% after; office visits with someone who teaches parents about child development increased from 39% to 88%; and home visits increased from 30% to 92%. Low-income families receiving Healthy Steps services were as likely as high-income parents to adhere to age-appropriate well-child visits at 1, 2, 4, 12, 18, and 24 months.31,32 One program evaluation suggests that Healthy Steps offers a benefit comparable with that of Head Start at about one-tenth the cost,33 although this claim is somewhat premature because Head Start data now extend to more than 35 years of follow-up research with a proven return rate of $17.00 for each $1.00 spent on early intervention, with savings realized through reductions in teen pregnancy, increases in high school graduation and employment rates, and decreased adjudication and violent crime.7 Nevertheless, Healthy Steps is extremely promising and inexpensive and includes a strong evaluation component that will answer questions about its long-term effect.
CONCLUSION
Establishing effective surveillance and screening in primary care is nevertheless challenging.13 Effective initiatives consistently offer training to providers, office staff, and nonmedical professionals. Implementation details are numerous (e.g., incorporation into existing office workflow, ordering and managing screening materials, gathering and organizing lists of referral resources and patient education handouts, identifying measures that work well with available personnel, and determining how best to communicate with nonmedical providers).18,18a,26,34 Ultimately, helping health care providers recognize the need to adopt effective detection methods is the critical first step.
1 Haggerty RJ, Roughman KJ, Pless IB. Child Health and the Community. New York: Wiley, 1975.
2 Dobos AE, Dworkin PH, Bernstein BA. Pediatricians’ approaches to developmental problems: Has the gap been narrowed? J Dev Behav Pediatr. 1994;15:34-38.
3 Institute of Medicine. From Neurons to Neighborhoods: The Science of Early Childhood Development. Washington, DC: National Academies Press, 2000.
4 Blumberg SJ, Halfon N, Olson LM. The national survey of early childhood health. Pediatrics. 2004;113:1899-1906.
5 Young KT, Davis K, Schoen C, et al. Listening to parents. A national survey of parents with young children. Arch Pediatr Adolesc Med. 1998;152:255-262.
6 Shonkoff JP, Hauser-Cram P. Early intervention for disabled infants and their families: a quantitative analysis. Pediatrics. 1987;80:650-658.
7 Shonkoff JP, Meisels SJ. Handbook of Early Childhood Intervention, 2nd ed. New York: Cambridge University Press, 2000.
8 American Academy of Pediatrics, Council on Children with Disabilities. Identifying infants and young children with developmental disorders in the medical home: An algorithm for developmental surveillance and screening. Pediatrics. 2006;118:403-420.
9 Green M, Palfrey JS, editors. Bright Futures: Guidelines for Health Supervision of Infants, Children, and Adolescents, 2nd ed., Arlington, VA: National Center for Education in Maternal and Child Health, 2002.
10 American Academy of Pediatrics, Medical Home Initiatives for Children with Special Needs Project Advisory Committee. The medical home. Pediatrics. 2002;110:184-186.
11 Halfon N, Regalado M, Sareen H, et al. Assessing development in the pediatric office. Pediatrics. 2004;113:1926-1933.
12 Bethell C, Reuland CHP, Halfon N, et al. Measuring the quality of preventive and developmental services for young children: National estimates and patterns of clinicians’ performance. Pediatrics. 2004;113:1973-1983.
13 Silverstein M, Sand N, Glascoe FP, et al. Pediatricians’ reported practices regarding developmental screening: Do guidelines work? And do they help? Pediatrics. 2005;116:174-179.
14 Inkelas M, Glascoe FP, Regalado M, et al: National Patterns and Disparities in Parent Concerns about Child Development. Paper presented at the annual meeting of the Pediatric Academic Societies, Baltimore, 2002.
15 Glascoe FP, Dworkin PH. The role of parents in the detection of developmental and behavioral problems. Pediatrics. 1995;95:829-836.
16 Regalado M, Halfon N. Primary care services promoting optimal child development from birth to age 3 years: review of the literature. Arch Pediatr Adolesc Med. 2001;12:1311-1322.
17 Dworkin PH. British and American recommendations for developmental monitoring: The role of surveillance. Pediatrics. 1989;84:1000-1010.
18 Glascoe FP. Collaborating with Parents: Using Parents’ Evaluations of Developmental Status to Detect and Address Developmental and Behavioral Problems. Nashville: Ellsworth & Vandermeer, 1998.
18a Houston HL, Davis RH. Opportunistic surveillance of child development in primary care: is it feasible? (Comparative Study Journal Article). J R Coll Gen Pract. 1985;35(271):77-79.
19 Glascoe FP. Toward a model for an evidenced-based approach to developmental/behavioral surveillance, promotion and patient education. Ambul Child Health. 1999;5:197-208.
20 Rydz D, Shevell MI, Majnemer A, et al. Developmental screening. Child Neurol. 2005;20:4-21.
21 Glascoe FP. Do parents’ discuss concerns about children’s development with health care providers? Ambul Child Health. 1997;2:349-356.
22 Glascoe FP, Sandler H. The value of parents’ age estimates of children’s development. J Pediatr. 1995;127:831-835.
23 Pachter LM, Dworkin PH. Maternal expectations about normal child development in four cultural groups. Arch Pediatr Adolesc Med. 1997;151:1144-1150.
24 Glascoe FP. A re over-referralson developmental screening tests really a problem? Arch Pediatr Adolesc Med. 2001;155:54-59.
25 Smith PK: BCAP Toolkit: Enhancing Child Development Services in Medicaid Managed Care. Center for Health Care Strategies, 2005. (Available at: http://www.chcs.org/; accessed 10/13/06.)
26 Pinto-Martin J, Dunkle M, Earls M, et al. Developmental stages of developmental screening: Steps to implementation of a successful program. Am J Public Health. 2005;95:6-10.
27 Glascoe FP, Sievers P, Wiseman N: First Signs Model Program makes great strides in early detection in Minnesota: Clinicians and educators play major role in increased screenings. American Academy of Pediatrics’ Section on Developmental and Behavioral Pediatrics Newsletter. August, 2004. (Available at: www.dbpeds.org; accessed 10/13/06.)
28 Inkelas M, Regalado H, Halfon N: Strategies for integrating developmental services and promoting medical homes. National Center for Infant and Early Childhood Health Policy, 2005. (Available at: http://www.healthychild.ucla.edu; accessed 10/13/06.)
29 McKay K. Evaluating model programs to support dissemination. An evaluation of strengthening the developmental surveillance and referral practices of child health providers. J Dev Behav Pediatr. 2006;27(1 Suppl):S26-S29.
30 Kelly D: PRIDE. American Academy of Pediatrics’ Section on Developmental and Behavioral Pediatrics Newsletter. March, 2006 (Available at: www.dbpeds.org; accessed 10/13/06.)
31 McLearn KT, Strobino DM, Hughart N, et al. Narrowing the income gaps in preventive care for young children: Families in Healthy Steps. J Urban Health. 2004;81:206-221.
32 McLearn KT, Strobino DM, Minkovitz CS, et al. Developmental services in primary care for low-income children: Clinicians’ perceptions of the Healthy Steps for Young Children Program. J Urban Health. 2004;81:556-567.
33 Zuckerman B, Parker S, Kaplan-Sanoff M, et al. Healthy Steps: A case study of innovation in pediatric practice. Pediatrics. 2004;114:820-826.
34 Hampshire A, Blair M, Crown N, et al. Assessing the quality of child health surveillance in primary care. A pilot study in one health district. Child Health Care Dev. 2002;28:239-249.
7C. Assessment of Development and Behavior
Assessment of child development and behavior involves a process in which information is gathered about a child so that judgments can be made. This process generally includes a multistage approach, designed to gain sufficient understanding of a child so that informed decisions can be made.1 In contrast to psychological testing (which includes the administration of tests), assessment is the process in which data from clinical sources and tools (including history, interviews, observations, formal and informal tests), preferably obtained from multiple perspectives, are interpreted and integrated into relevant clinical decisions.
Developmental and behavioral assessments may be conducted for several purposes.1,2 Screening involves procedures to identify children who are at risk for a particular problem and for whom there are available effective interventions. Diagnosis and case formulation procedures help determine the nature, severity, and causes of presenting concerns and often result in classification or a label. Prognosis and prediction methods result in generating recommendations for possible outcomes. Treatment design and planning assessment strategies aid in selecting and implementing interventions to address concerns. Treatment monitoring methods track changes in symptoms and functioning targeted by interventions. Finally, treatment evaluation procedures help investigators examine consumer satisfaction and the effectiveness of interventions.
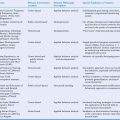
The purpose of this chapter is to describe methods and tools for assessing children’s development and behavior. In accordance with current discussions within the child psychology literature,2 we advocate the development of integrated evidence-based assessment strategies for childhood problems with emphasis placed on research concerning the reliability, validity, and clinical utility of commonly used measures in assessment and treatment planning of developmental and behavioral problems (i.e., what methods have been shown to be useful and valid for what purpose). We describe general information about clinical interviewing and observational methods required to conduct comprehensive child assessments (for more extensive discussions, see McConaughy3). To help guide the pediatric practitioner’s and researcher’s appropriate use of assessment results, we provide information on the range of methods used for assessing developmental abilities, intelligence and cognitive abilities, behavioral and emotional functioning, and specialized testing, including neuropsychological testing and measures of functional outcome. However, we do not attempt to address the complex manner in which information, obtained from different assessment data sources, is weighted and synthesized in the formulation of clinical judgments. The discussions of assessment tools is not meant to be all-inclusive—there are literally thousands of developmental and behavioral assessment measures in the literature—nor an endorsement of one instrument over others. Rather, it is a sampling the array of instruments available to clinicians and researchers (Table 7C-1). We present implications and recommendations for future research concerning measures of psychological assessment as they pertain to the field of developmental behavioral pediatrics.
TABLE 7C-1 Illustrative Behavioral and Developmental Assessment Methods
| Method | Applications | Illustrative Methods |
|---|---|---|
| Structured/sem ¡structured interviews | Diagnostic assessments | |
| Assessment and treatment planning | ||
| Standardized cognitive methods | Developmental assessments | |
| Intelligence assessment | ||
| Achievement | ||
| Neuro psychological assessments | ||
| Global behavior rating scales | Broad measures of pathology | |
| Peer reports | Broad measure of pathology | Peer-Report Measure of Internalizing and Externalizing Behavior (PMIEB)81 |
| Observational coding methods | Assessment of parent child interactions | Dyadic Parent-Child Interaction Coding System (DPICS)83 |
| Problem-specific questionnaires and rating scales | Depression | |
| Anxiety | ||
| Attention-deficit/hyperactivity disorder (ADHD) | ||
| Autism spectrum disorders | ||
| Family assessment methods | Parent and family assessment | Parenting Stress Index (PSI) 3rd ed113 |
| Functional outcome methods | Global functioning | |
| Adaptive behavior | Vineland Adaptive Behavior Scales (Vineland–II)117 | |
| Health-related quality of life | PedsQL 4.0118 |
CASE ILLUSTRATIONS
The following case examples are referred to throughout the discussion of assessment methods:
 Case 1: Jane is a 21-month-old (corrected age) girl who was born at 27 weeks’ gestation, with a birth weight of 850 g, having a grade III intraventricular hemorrhage, bronchopulmonary dysplasia, and hyperbilirubinemia. Her young, single mother resides in low-income housing and may have used cocaine during pregnancy. Her score on the revised Bayley Scales of Infant Development (BSID-II) Mental Developmental Index (MDI) was 90 at age 12 months (corrected age). Her developmental status is being evaluated at a high-risk infant follow-up clinic at this time to determine need for early intervention services.
 Case 2: Rachel is a 15-year-old girl with mild cerebral palsy with no identified learning disorders who presents with depressed mood and falling grades in her ninth grade placement. Academic strengths have been language arts, but she has always been weak in math. Historically she has been a B and C student, but in her freshman year, she is in danger of failing math. Rachel complains about trouble getting work done this year, especially in algebra. Her mother is puzzled that Rachel has requested counseling.
“WHAT MEASURE SHOULD I USE?”
Kazdin4 noted that in clinical situations, this question suggests a misunderstanding of the assessment process, because it is unlikely that any one measure or method can suitably capture child functioning. Although some measures have been shown to be perform better than others, a single “gold standard” tool does not exist for assessing most aspects of children’s functioning. Valid child assessment often requires data from multiple sources, including interviews, direct observations, standardized parents’ and teachers’ rating scales, self-reports, background questionnaires, and standardized tests. Multiple methods are needed not only to evaluate different facets of problems but also because of the high rate of comorbidity in children with developmental and behavioral conditions. In clinical settings, methods should be tailored to address the specific referral questions and assessment goals; therefore, preordained “assessment batteries” should be avoided. Moreover, clinical assessments often have multiple goals, such both diagnosis and treatment planning. Diagnostic methods, shown to be evidenced-based (e.g., structured diagnostic interviews or rating scales), are often not helpful in treatment planning, whereas a functional analysis of impairment (i.e., identification of environmental contexts and socially valid target behaviors) are more useful.5 Different methods of data collection yield different information, and one is not inherently better than the other; each method contributes unique elements. Moreover, assessments must adopt a framework that maintains a correct developmental perspective, including use of methods and procedures that fit a child’s developmental stage.
INTERVIEWS
Clinical assessment interviews are face-to-face interactions with bidirectional influence for the purpose of planning, implementing, or evaluating treatment.3 The interview is a fundamental technique for gathering assessment data for clinical purposes and is considered by many clinicians to be an essential component. Interviews provide respondents the opportunity to offer personal reflections of concerns and historical events. Thoughts, feelings, and other private experiences are conveyed in conversation that is not readily obtainable in any other format. The interview often serves a dual purpose. Not only does a clinical interview provide valuable assessment data, but it also is probably the first opportunity for a clinician to begin to build a positive therapeutic relationship that is the foundation for effective behavioral change. In practice, most clinical assessment interviews use unstructured or semistructured formats in order to obtain detailed information about a particular presenting problem. Greater flexibility in interview formats is often desirable when the clinical goals include not just reaching a diagnosis but also establishing a therapeutic relationship with a family and developing a treatment plan.
An effective clinical interview needs to establish a condition of trust and rapport so that the interviewee can feel comfortable in divulging personal information.6 It is important to outline the purpose and nature of the interview at the outset and to discuss issues and limits of confidentiality. Effective interviewing requires listening skills, strategic use of open-ended and direct questions, and verbal and nonverbal empathic communications. The clinician needs to offer careful statements that reflect, paraphrase, reframe, summarize, and restate to verify accurate interpretation of client statements.6 At the same time, the clinician is gathering verbal and nonverbal information conveyed by the client. Most interviewers take notes during interviews.
Most clinical assessments of children begin with a parent interview, the content of which depends on its purpose. Interviewing in the context of a developmental-behavioral problem usually focuses on identification and analysis of parental concerns so that an intervention plan can be developed and implemented. Psychosocial interviews typically elicit parent perceptions about the specific nature of the problem (including antecedents and consequences of the problem), family relations and home situation, social and school functioning, developmental history, and medical history. A practical interview format that is well suited for primary care settings is the Comprehensive Assessment to Intervention System, developed by Schroeder and Gordon.7 This behaviorally oriented format clusters information in six areas for quick response: referral question, social context of question, general information about the child’s development and family, specifics of the concern and functional analysis of behavior, effects of the problem, and areas for intervention. Schroeder and Gordon used this system both in their telephone call-in service and in their pediatric psychology office practices.
Child interviews are generally viewed as an essential component of clinical assessments and can be conducted with children as young as age 3 years.3 Child clinical interviews are useful for establishing rapport, learning the child’s perspective of functioning, selecting targets for interventions, identification of the child’s strengths and competencies, and assessing the child’s view of intervention options. Moreover, child interviews offer an opportunity to observe the child’s behavior, affect, and interaction style directly. However, competent interviewing of children and adolescents interviews requires considerable skills and knowledge of development. For example, preschool children often respond better in interviews that the interviewer conducts while sitting at the child’s level on the floor or at a small table and with toys, puppets, and manipulative items. School-age children may end communication if they feel barraged by too many direct questions, especially if asked “why” about motives, or if questions are abstract or rhetorical. Adolescent interviews may require additional attention to matters of confidentiality, trust, and respect.
Structured and Semistructured Diagnostic Interviews
An example of a structured interview is the National Institute of Mental Health Diagnostic Interview for Children—IV.8 This instrument is a highly structured interview with nearly 3000 questions designed to assess more than 30, psychiatric disorders and symptoms listed in the American Psychiatric Association’s Diagnostic and Statistical Manual of Mental Disorders, Fourth Edition (DSM-IV)8a in children and adolescents aged 9 to 17 years. Parent and child versions in English and Spanish are available, and lay interviewers can administer it for epidemiological research. The Diagnostic Interview for Children and Adolescents9 is another structured diagnostic interview for children ages 6 to 17. This instrument consists of nearly 1600 questions that address 28 DSM-IV diagnoses relevant to children. Interrater reliability estimates of individual diagnoses range from poor to good, and diagnoses are moderately correlated with clinicians’ diagnoses and self-rated measures.
Semistructured interviews combine aspects of traditional and behavioral interviewing techniques. Specific topic areas and questions are presented, but, in contrast to structured interviews, more detailed responses are encouraged. Semistructured formats also support use of empathic communication described previously (e.g., reflecting, paraphrasing). For example, the Semistructured Parent Interview3 contains sample questions organized around six topic areas: concerns about the child (open ended), behavioral or emotional problems (eliciting elaboration to begin a functional analysis of behavior), social functioning, school functioning, medical and developmental history, and family relations and home situations. Like other semistructured formats, the Semistructured Parent Interview encourages parent interviews built around a series of open-ended questions to introduce a topic, followed by more focused questions about specific areas of concern.
The Semistructured Clinical Interview for Children and Adolescents (SCICA)10 is an interview designed for children aged 6 to 16. It is part of the Achenbach System of Empirically Based Assessment (ASEBA)11 and was designed to be used separately or in conjunction with other ASEBA instruments (e.g., Child Behavior Checklist [CBCL], Teacher Report Form). The SCICA contains a protocol of questions and procedures assessing children’s functioning across six broad areas: (1) activities, school, and job; (2) friends; (3) family relations; (4) fantasies; (5) self-perception and feelings; and (6) problems with parent/teacher. There are additional optional sections pertaining to achievement tests, screening for motor problem, and adolescent topics (e.g., somatic complaints, alcohol and drug abuse, trouble with the law). Interview information (observations and self-report) are scored on standardized rating forms and aggregated into quantitative syndrome scales and DSM-IV—oriented scales. Test-retest, interrater, and internal consistency evaluations indicate excellent to moderate estimates of reliability. Accumulating evidence for validity of the SCICA includes content validity, as well as criterion-related validity (ability to differentiate matched samples of referred and nonreferred children).
The Child and Adolescent Psychiatric Assessment12 is another semistructured diagnostic interview for children and adolescents aged 9 to 17. One interesting feature of this instrument is the inclusion of sections assessing functional impairment in a number of areas (e.g., family, peers, school, and leisure activities), family factors, and life events.
Motivational Interviewing
Motivational interviewing is an empirically supported interviewing approach gaining considerable attention in medical and mental health settings. More than an assessment strategy, motivational interviewing is a brief, client-centered directive intervention designed to enhance intrinsic motivation for behavior change through the exploration and reduction of patient ambivalence.13 Based on a number of social and behavioral principles, including decisional balance, self-perception theory, and the transtheoretical model of change,14 motivational interviewing combines rogerian and strategic techniques into a directive and yet patient-centered and collaborative encounter. Assessment from a motivational interviewing perspective involves addressing the patient’s ambivalence about making a change in behavior, exploring the negative and positive aspects of this choice, and discussing the relationship between the proposed behavior change (e.g., compliance with mediations) and personal values (e.g., health). This information is elicited in an empathic, accepting, and nonjudgmental manner and is used by the patient to select goals and create a collaborative plan for change with the provider.
The effectiveness of motivational interviewing with children and young adolescents has not been established. However, there is emerging evidence of its utility with adolescents and young adults, particularly in the areas of risk behavior, program retention, and substance abuse.15,16
TESTING METHODS: DEVELOPMENTAL AND COGNITIVE
Infancy and Early Childhood
Since the 1980s, there has been increased interest in the developmental evaluation of infants and young children.17,18 This began with the 1986 Education of the Handicapped Act Amendments (Public Law 99-457) and continues with the Individuals with Disabilities Education Improvement Act of 2004 (Public Law 108-446), a revision of the Individuals with Disabilities Education Act (IDEA). These laws involve provision of early intervention services and early childhood education programs for children from birth through 5 years of age. Developmental evaluation is necessary to determine whether children qualify for such intervention services. Part C of the IDEA revision (Section 632) delineates five major areas of development: cognitive, communication, physical, social-emotional, and adaptive. However, definitions of delay vary, criteria being set on a state by state basis. These can included a 25% delay in functioning in comparison with same-aged peers, 1.5 to 2.0 standard deviations below average in one or more areas of development, or performance on a level that is a specific number of months below a given child’s chronological age. However, pressure to quantify development has caused professionals working with infants and young children to attribute a degree of preciseness to developmental screening and assessment that is neither realistic nor attainable. Additional problems include test administration by examiners who are not adequately trained and use of instruments that have varying degrees of psychometric rigor.19 Nonetheless, developmental evaluation is critical, because timely identification of children with developmental problems affords the opportunity for early intervention, which enhances skill acquisition or prevents additional deterioration.
Again, choice of the type of developmental assessment that is administered is driven by the purposes of the evaluation: for example, determination of eligibility for early intervention or early childhood education services, documentation of developmental change after provision of intervention, evaluation of children who are at risk for developmental problems because of established biomedical or environmental issues, documentation of recovery of function, or prediction of later outcome. Assessment of infants and young children is in many ways unique, because it occurs against a backdrop of qualitative and quantitative developmental, behavioral, and structural changes, the velocity of change being greater during infancy and early childhood than at any other time. The rapidly expanding behavioral repertoire of the infant and young child and the corresponding divergence of cognitive, motor, and neurological functions pose distinct evaluation challenges.18,19
Another significant testing concern in this age range is test refusal.20 Test refusal, where a child either declines to respond to any items, or eventually stops responding when items become increasingly difficult, occurs in 15% to 18% of preschoolers.21–24 Occasional refusals occur in 41% of young children. In addition to the immediate ramifications problematic test-taking behaviors have on actual test scores, there is evidence that early high rates of refusals are associated with similar behaviors at later ages, and with lower intelligence, visual perceptual, neuropsychological, or behavioral scores in middle childhood.22–25 Non-compliance has been reported to occur in verbal production tasks, gross motor activities, or toward the end of the testing session, and it occurs more in children born at biologic risk or those from lower socioeconomic households. Children who refuse any aspect of testing differ from those who refuse some items, or who are compliant and cooperative to a certain point and then refuse more difficult items. This situation prompted inclusion of the Test Observation Checklist (TOC) in the Stanford-Binet Scales for Early Childhood, 5th Edition (SB5).26
A distinction is often made between developmental tests and intelligence tests,27 and both are used in the age range under discussion. The assessment of intelligence originated from the need to determine which children would be able to learn in a classroom and which would be mentally deficient. In fact, this was the original purpose of the Binet test. Intelligence tests have become more psychometrically sophisticated but still assess different facets of primary cognitive abilities such as reasoning, knowledge, quantitative reasoning, visual-spatial processing, and working memory. In contrast, the purpose of early developmental measures such as the Bayley Scales of Infant Development (BSID)28 or the Gesell Developmental Schedules29 was to be diagnostic of developmental delays, providing a benchmark of developmental acquisitions (or lack thereof) in comparison to same-aged peers. Nonetheless, this distinction is often blurred, perhaps because there is no specific age at which a child shifts from “development” to “intelligence” (although the culmination of the infancy period is often indicated), nor is there a clear-cut transformation from a delay to a deficit. Developmental tests also tend to include motor and social-adaptive skills. Both tests of development and intelligence are driven by the theoretical model of the test developer and the constructs measured by the test. Those that assess the former are considered more dynamic or fluid; those that assess intelligence are more consistent and predictive. Herein, we discuss both developmental and intelligence tests that are used in children in this age level.
Developmental Assessment Instruments
GESELL DEVELOPMENTAL SCHEDULES/CATTELL INFANT INTELLIGENCE TEST
The Gesell Developmental Schedules29,30 and the Cattell Infant Intelligence Test31 are the oldest developmental test instruments and exemplify the blurring of developmental and intelligence testing boundaries. The most recent version of the former is Knobloch and associates’ Manual of Developmental Diagnosis (for children aged 1 week to 36 months).32 Gesell specified key ages at which major developmental acquisitions occur: 4, 16, 28, and 40 weeks and 12, 18, 36, and 48 months. Gross motor, fine motor, adaptive, language, and personal-social areas are assessed, with 1 to 12 items at each age. A developmental quotient is computed for each area with the formula maturity age level/chronological age ×100. The Cattell test is essentially an upward extension of the Gesell schedule over the first 21 months and a downward extension of early versions of the Stanford-Binet tests from age 22 months and older (the Cattell age range is 2 to 36 months). A major drawback of both instruments is the limited standardization sample size (e.g., 107 for the Gesell schedule, 274 for the Cattell test). As a result, neither is used frequently at this time, although the Cattell test does yield so-called IQ scores below 50 (the floor of the BSID).
BAYLEY SCALES OF INFANT DEVELOPMENT27,28,33
The original BSID28 evolved from versions administered to infants enrolled in the National Collaborative Perinatal Project. It was the reference standard for the assessment of infant development, administered to infants 2-30 months of age. The BSID was theoretically eclectic and borrowed from different areas of research and test instruments. It contained three components—the MDI, the Psychomotor Developmental Index (PDI), and the Infant Behavior Record (M = 100, SD = 16)—and was applicable for children aged 2 to 30 months. The BSID subsequently was revised as the BSID-II,33 this partly because of the upward drift of approximately 11 points on the MDI and 10 points on the PDI, reflecting the Flynn effect34 (M = 100, SD = 15). As a result, the BSID-II scores were 12 points lower on the MDI and 10 points lower on the PDI in comparison with the original BSID.35 The Behavior Rating Scale was developed to enable assessment of state, reactions to the environment, motivation, and interaction with people. The age range for the BSID-II was expanded to 1 to 42 months. Unfortunately, this instrument had 22 item sets and basal and ceiling rules that differed from the original BSID. These rules were controversial in that if correction is used to determine the item set to begin administration, or if an earlier item set is employed because of developmental problems, scores tend to be somewhat lower, because the child is not automatically given credit for passing the lower item set. It was also criticized because it did not provide area scores compatible with IDEA requirements such as cognitive, motor communication, and social and adaptive function.35
For the newest version of the BSID, the Bayley Scales of Infant and Toddler Development—Third Edition (BSID-III),27 norms were based on responses of 1700 children. The BSID-III assesses development (at ages 1 to 42 months) across five domains: cognitive, language, motor, social-emotional, and adaptive. Like its predecessors, the BSID-III is a power test. Assessment of the first three domains is accomplished by item administration, whereas the latter two are evaluated by means of caregiver’s responses to a questionnaire. A Behavior Observation Inventory is completed by both the examiner and the caregiver. The Language scale includes a Receptive Communication and an Expressive Communication scaled score; the Motor Scales includes a Fine Motor and a Gross Motor score. The BSID-III Social-Emotional Scale is an adaptation of the Greenspan Social-Emotional Growth Chart: A Screening Questionnaire for Infants and Young Children.36 The Adaptive Behavior Scale is composed of items from the Parent/Primary Caregiver Form of the Adaptive Behavior Assessment System—Second Edition;37 it measures areas such as communication, community use, health and safety, leisure, self-care, self-direction, functional preacademic performance, home living, and social and motor skills and yields a General Adaptive Composite score.
The correlation between the BSID-III Language Composite and the BSID-II MDI is 0.71; that between the Motor Composite and the BSID-II PDI is 0.60; and that between the Cognitive Composite and the BSID-II MDI is 0.60. The moderate correlation between the older PDI and MDI and their BSID-III counterparts underscores the significant differences between the old and new BSIDs. However, in contrast to the expected Flynn effect (see Chapter 7A and Flynn34), the BSID-III Cognitive and Motor composite scores are approximately 7 points higher than the corresponding BSID-II MDI and PDI. This phenomenon has also been reported with the Peabody Picture Vocabulary Test—Third Edition,38 and the Battelle Developmental Inventory—Second Edition39 (Box 7C-1).
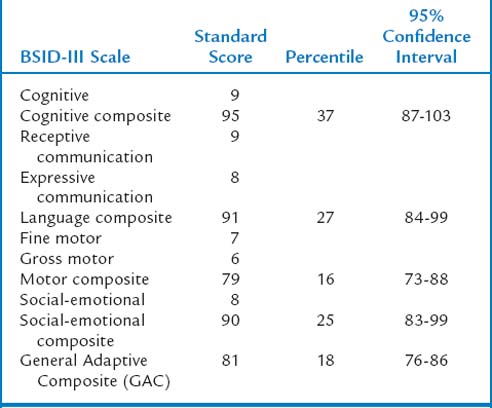
BATTELLE DEVELOPMENTAL INVENTORY—SECOND EDITION (BDI-2)39
The norms of the BDI-2 were based on the performances of 2500 children, and this instrument is applicable to children from birth through age 7 years 11 months. Data are collected through a structured test format, parent interviews, and observations of the child. The scoring system is based on a 3-point scale: 2 if the response met a specified criteria, 1 if the child attempted a task but it was incomplete (emerging skill), and 0 if the response was incorrect or absent. The original Battelle Developmental Inventory40 and the BDI-2 were developed on the basis of milestones: that is, development reflects the child’s attainment of critical skills or behaviors. Five domains are assessed: (1) The Adaptive Domain, which contains the Self-Care (e.g., eating, dressing toileting) and Personal Responsibility subdomains (initiate play, carry out tasks, avoid dangers); (2) the Personal-Social Domain, which contains the Adult Interaction (e.g., identifies familiar people), Peer Interaction (shares toys, plays cooperatively) and Self-Concept and Social Role subdomains (express emotions, aware of gender differences); (3) the Communication Domain, which contains the Receptive Communication and Expressive Communication subdomains; (4) the Motor Domain, which contains the Gross Motor, Fine Motor, and Perceptual Motor subdomains (stacks cubes puts small object in bottle); and (5) the Cognitive Domain, which contains Attention and Memory (follows auditory and visual stimuli), Reasoning and Academic Skills (names colors, uses simple logic), and Perception and Concepts subdomains (compares objects, puzzles, grouping). The BDI-2 full assessment incorporates all five domains, whereas the screening test includes two items at each of 10 age levels for each of the five domains. A developmental quotient is produced for each domain and for a total BDI-2 Composite score (M = 100, SD = 15); scaled scores are applied to the subdomains (M = 10, SD = 3). Noteworthy is the fact that these are normalized standard scores and not ratio scores. Percentiles, age-equivalent scores, and confidence intervals are provided; the domain developmental quotients are the most reliable scores. The correlation between the original Battelle Developmental Inventory and the BDI-2 total developmental quotient is 0.78; the total BDI-2 score is 1.1 points higher than that of the original Battelle Developmental Inventory, with domain differences ranging from 1.4 to 2.8 points. Again, this is in contrast to the Flynn effect.
MULLEN SCALES OF EARLY LEARNING (MSEL)41
The MSEL assess the learning abilities and patterns in various developmental domains in children 2 to 5½ years of age. Particular emphasis is placed on differentiation of visual and auditory learning, thereby enabling measurement of unevenness in learning. The MSEL differentiates receptive or expressive problems in the visual or auditory domain through four scales: Visual Receptive Organization, Visual Expressive Organization, Language Receptive Organization, and Language Expressive Organization. At the receptive level, processing that involves one modality (visual or auditory) is defined as intrasensory reception; processing that involves two modalities (auditory and visual) is termed intersensory reception. This design provides assessment of visual, auditory, and auditory/visual reception and of visual-motor and verbal expression. The MSEL AGS Edition42 combines the Infant MSEL and Preschool MSEL and is applicable to children from birth to age 68 months. A gross motor scale is also included (T-scores, Early Learning Composite [M = 100, SD = 15]). The Early Learning Composite has a correlation of 0.70 with the BSID MDI.
DIFFERENTIAL ABILITY SCALES43
The Differential Ability Scales is applicable to children aged 2½ to 17 years but is most useful in the range from age 2½ to 7 years. Many clinicians consider the Differential Ability Scales an intelligence test, although it yields a range of scores for developed abilities and not an IQ score; it is rich in developmental information of a cognitive nature. On the basis of reasoning and conceptual abilities, a composite score, the General Conceptual Ability score (M = 100, SD = 15; range, 45 to 165), is derived. Subtest ability scores have a mean of 50 and a standard deviation of 10 (T-scores). In addition, verbal ability and nonverbal ability cluster scores are produced for upper preschool-age children (3½ years and older). For ages 2 years 6 months to 3 years 5 months, four core tests constitute the General Conceptual Ability composite (block building, picture similarities, naming vocabulary, and verbal comprehension), and there are two supplementary tests (recall of digits, recognition of pictures). For ages 3 years 6 months to 5 years 11 months, six core tests are included in the General Conceptual Ability composite (copying, pattern construction, and early number concepts in addition to verbal comprehension, picture completion, and naming vocabulary; block building is now optional). The test is unique in that it incorporates a developmental and an educational perspective, and each subtest is homogeneous and can be interpreted in terms of content.
McCARTHY SCALES OF CHILDREN’S ABILITIES (MSCA)44
The MSCA essentially bridges developmental and IQ tests.17 It is most useful in the 3- to 5-year age range (age range, 2½ to 8½ years). Some clinicians would question viewing the MSCA as a developmental test; however the term IQ was avoided initially, with the test considered to measure the child’s ability to integrate accumulated knowledge and adapt it to the tasks of the scales. Eighteen tests in total are divided into Verbal (five tests), Perceptual-Performance (seven tests), Quantitative (three), Memory (four tests), and Motor (five) categories. Several tests are found on two scales. The Verbal, Perceptual-Performance, and Quantitative scales are combined to yield the General Cognitive Index (M = 100, SD = 16; 50 is the lowest score). The mean scale standard score (T-score) for each of the five scales is 50 (SD = 10). The MSCA is attractive because in enables production of a profile of functioning (with age-equivalent scores) and it includes motor abilities; conversely, the test was devised in 1972, and hence there is inflation of scores vis-à-vis the Flynn effect (i.e., increments in test norms over time result in lower scores on newer tests than those obtained on measures with older norms; see Chapter 7A for a discussion of the Flynn effect34). Short forms of the MSCA are available, but these are not useful in the younger age ranges.17
Intelligence Assessment Instruments
STANFORD-BINET INTELLIGENCE SCALES, FIFTH EDITION/STANFORD-BINET INTELLIGENCE SCALES FOR EARLY CHILDHOOD—5 (EARLY SB5)26,46
The 10 subtests of the Early SB5 are drawn from the SB5, and the norms are derived from approximately 1660 children aged 7 years 3 months or younger. The test is applicable from age 2 to 7¼ years (the SB5 extends to adulthood). The 10 subtests constitute the FSIQ, and various combinations of these subtests constitute other scales. An Abbreviated Battery IQ scale consists of two routing subtests: Object Series/Matrices and Vocabulary. Routing subtests enable the examiner to know the level at which to begin subsequent subtests. The Nonverbal IQ scale consists of five subtests measuring the factors of nonverbal fluid reasoning, knowledge, quantitative reasoning, visual-spatial processing, and working memory. The Verbal IQ scale is composed of five subtests measuring verbal ability domains in the same five factor areas as for the Nonverbal IQ scale. The Early SB5 also includes the Test Observation Checklist. The test differs markedly from the fourth edition of the Stanford-Binet Intelligence Tests. Nonverbal IQ, Verbal IQ, and FSIQ scores are obtained (M = 100, SD = 15), as are total factor index scores (sum of verbal and nonverbal scaled scores) for fluid reasoning, knowledge, quantitative reasoning, visual-spatial processing, and working memory; scaled scores (M = 10, SD = 3) can be computed for each of the nonverbal and verbal domains. Optional change-sensitive scores and age-equivalent scores are also computed. The SB5 FSIQ is approximately 3.5 points lower than the that of the fourth edition. The SB5 FSIQ is approximately 5 points lower than the FSIQ for the Wechsler Intelligence Scale for Children—Third Edition (WISC-III).
WECHSLER INTELLIGENCE SCALE FOR CHILDREN—FOURTH EDITION49
The WISC-IV, with norms based on responses from 2200 children, is applicable to ages 6 years 0 months to 16 years 11 months, and contains 15 subtests (10 core, 5 supplementary). The Verbal IQ and Performance IQ scores of the WISC-III are no longer used. Gone also are the Picture Arrangement, Object Assembly, and Mazes subtests from the WISC-III, to decrease the emphasis on performance time. Instead, the WISC-IV contains a Verbal Comprehension Index (Similarities, Vocabulary, Comprehension, Information,* and Word Reasoning*), a Perceptual Reasoning Index (Block Design, Picture Concepts, Matrix Reasoning, Picture Completion*), a Working Memory Index (Digit Span, Letter-Number Sequencing, Arithmetic*), and a Processing Speed Index (Coding, Symbol Search, Cancellation*). In addition to these four index scales, a measure of general intellectual function (FSIQ) is produced. The more narrow domains and emphasis on fluid reasoning reflect contemporary thinking with regard to intelligence per se. For index and FSIQ scores, M = 100 and SD = 15; the mean scaled score is 10 (SD = 3). The WISC-IV is highly correlated with WISC-III indexes (rs = 0.72 to 0.89). The FSIQ score is approximately 2.5 points less than that of its predecessor; the Verbal Comprehension Index score is 2.4 points less than the WISC-III Verbal IQ score; the Perceptual Reasoning Index score is 3.4 points less than the Performance IQ score; the Working Memory Index score is 1.5 points lower than the Freedom from Distractibility Index score; and the Processing Speed Index score is 5.5 points lower than its WISC-III counterpart. In comparison with the Wechsler Abbreviated Scale of Intelligence (WASI) (described next), the WISC-IV FSIQ score is 3.4 points lower, the Verbal Comprehension Index score is 3.5 points lower than the WASI Verbal IQ, and the Perceptual Reasoning Index score is 2.6 points lower. A General Ability Index (containing three verbal comprehension and three perceptual reasoning subtests), can be computed; this is less sensitive to the influence of working memory and processing speed and therefore is useful with children who have learning disabilities or attention-deficit/hyperactivity disorder (ADHD) (Box 7C-2).
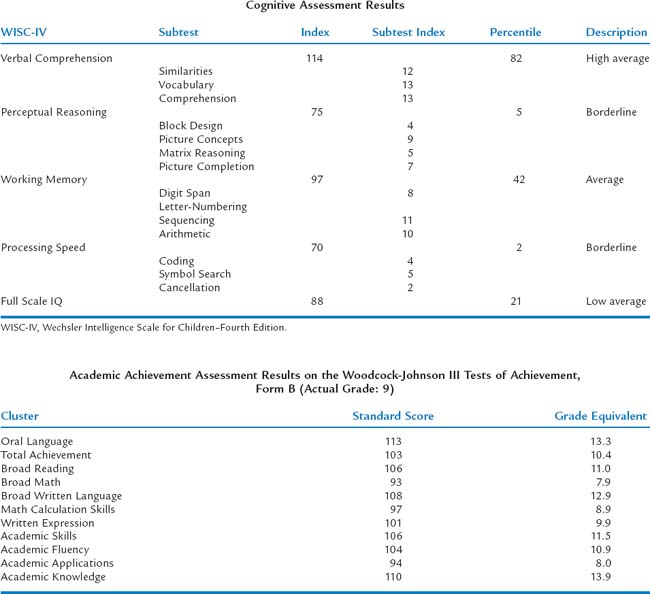
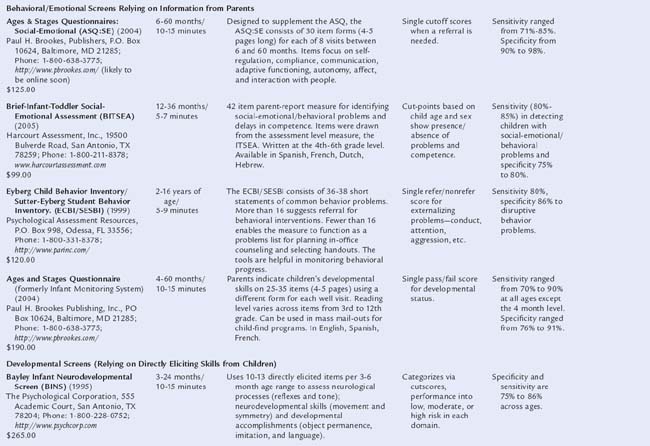
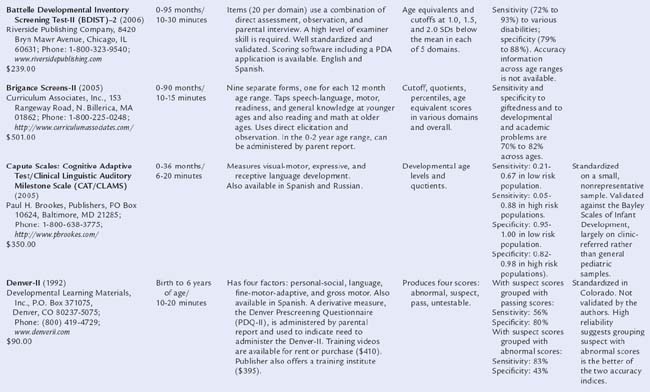
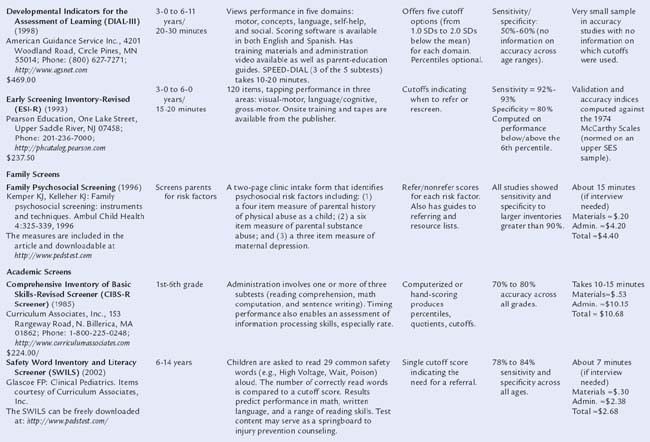
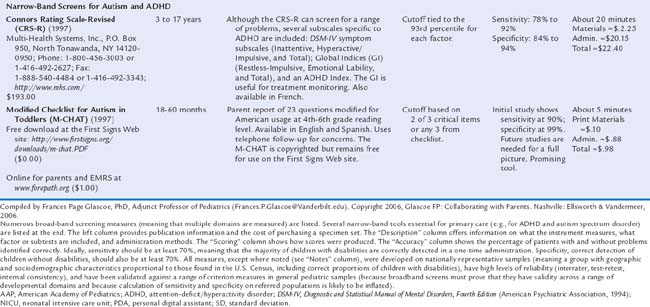
| Academic Achievement Assessment Results on the Woodcock-Johnson III Tests of Achievement, Form B (Actual Grade: 9) | ||
|---|---|---|
| Cluster | Standard Score | Grade Equivalent |
| Oral Language | 113 | 13.3 |
| Total Achievement | 103 | 10.4 |
| Broad Reading | 106 | 11.0 |
| Broad Math | 93 | 7.9 |
| Broad Written Language | 108 | 12.9 |
| Math Calculation Skills | 97 | 8.9 |
| Written Expression | 101 | 9.9 |
| Academic Skills | 106 | 11.5 |
| Academic Fluency | 104 | 10.9 |
| Academic Applications | 94 | 8.0 |
| Academic Knowledge | 110 | 13.9 |
Achievement Testing
Use of individually-administered achievement tests has increased dramatically since the introduction of Public Law 94-142 (Education of All Handicapped Children Act), and these tests continue to be a critical component in the evaluation of children with academic difficulties under the IDEA revision of 2004. The major reason is that achievement tests enable the delineation of aptitude-achievement discrepancies, a hotly debated requirement for establishment of a learning disability (versus response to treatment intervention). It is assumed that such tests identify children who need special instructional assistance; help recognize the nature of a child’s difficulties/deficiencies, thereby clarifying the nature of the learning problem; and assist in planning, instruction, and intervention. Unfortunately, achievement tests do not adequately meet these needs. In general, standard scores (with percentiles) are the most precise metric; age and grade-equivalent scores are least useful. With regard to the Wechsler tests, the Verbal IQ (or Verbal Comprehension Index) and FSIQ are most highly correlated with achievement, particularly reading; the Performance IQ (Perceptual Reasoning Index), with mathematics.51 Achievement tests differ in terms of content and type of response required (e.g., multiple choice vs. recall of information), and these differences sometimes cause one test to produce lower scores than another.
WIDE RANGE ACHIEVEMENT TEST—356
This is the seventh edition of the Wide Range Achievement Test and is applicable for ages 5 to 75 years. There are two equivalent forms (Blue, Tan) and each contains reading (read letters, pronounce words), spelling (write letters, words from dictation) and arithmetic (40 computation problems) tests. The test is based on norms by age and not grade. Critics of this test argue that it is outdated and provides very gross estimates of academic achievement because it contains few items within each content area; conversely, it is easy and quick to administer. An Expanded Version is also available57 that contains a group (G) form with reading/reading comprehension, math, and nonverbal reasoning (some tests are multiple choice), and an individual (I) form that assesses reading, mathematics, listening comprehension, oral expression, and written language. The Expanded Version group form is applicable to grades 2 to 12; the Individual form, to ages 5 to 24.
Neuropsychological Testing
There are three approaches to neuropsychological testing of children, and all involve the assessment of brain-behavior relationships. The first approach entails modification of traditional neuropsychological batteries such as the Halstead-Reitan Neuropsychological Battery or the Luria-Nebraska Neuropsychological Battery, to form corresponding children’s batteries.59 The second approach involves interpretation of standard tests such as those measuring intelligence, with the use of a neuropsychological “mind-set.” In this case, results from standardized tests are tied into neuropsychological constructs and functions (e.g., the Kaufman Assessment Battery for Children—Second Edition). The third approach includes tests or rating scales designed to assess specific areas of neuropsychological function. Neuropsychological testing generally is more specific in terms of pinpointing strengths and deficits, and the results more precisely describe brain-behavior relationships. Neuropsychological testing may elucidate more subtle problems that contribute to cognitive, academic, or social difficulties; these problems may not be apparent from results of more routine measures used to detect learning disabilities. Noteworthy is the fact that standard intellectual assessment is typically part of a neuropsychological workup. Selected tests from this third approach are discussed as follows.
CHILDREN’S MEMORY SCALE60
The Children’s Memory Scale assesses learning and memory function with nine subtests. There are two levels: one for ages 5 to 8 years and one for ages 9 to 16 years. The Children’s Memory Scale includes three domains: Auditory/Verbal, Visual/Nonverbal, and Attention/Concentration, each with two core and one supplemental test. The first two domains have an immediate-memory component and a delayed-memory component (tested 30 minutes later). Eight index scores are produced: verbal immediate, verbal delayed, delayed recognition, learning visual immediate, visual delayed, attention/concentration, and general memory (global memory function). Core subtests include: Stories, Word Pairs, Dot Locations, Faces, Numbers, and Sequences. Word Lists, Family Pictures, and Picture Locations are the supplementary tests. The general memory score is moderately correlated with IQ scores.
NEPSY—A DEVELOPMENTAL NEUROPSYCHOLOGICAL ASSESSMENT (NEPSY)61
The NEPSY is based on Luria’s theoretical model,59 is applicable for ages 3 to 12 years, and consists of 27 subtests that encompass five domains: (1) Attention and Executive Functions (e.g., Tower test, Auditory Attention and Response Set, Visual Attention); (2) Language (Speeded Naming, Comprehension of Instructions, Phonological Processing); (3) Sensorimotor Functions (e.g., Fingertip Tapping, Visuomotor Precision); (4) Visuospatial Functions (Design Copying, Arrows, Block Construction); and (5) Learning and Memory (e.g., Memory for Faces, Names, Sentence Repetition). There is an 18-subtest core assessment. In general, each domain contains five to six subtests. Subtest scaled scores are obtained (M = 10, SD = 3), and these can be combined into summary domain scores (M = 100, SD = 15). Correlations with the Children’s Memory Scale range from 0.36 to 0.60.
TESTING METHODS: BEHAVIORAL AND EMOTIONAL
Assessment of social, emotional, and behavioral adjustment of children typically begins with a parent or caregiver interview regarding the nature, severity, and frequency of concerns. Most child assessment techniques rely on caregiver reports because it is presumed that adults who interact daily with a child are the most knowledgeable informants about a child’s functioning. School-aged children and adolescents should also have the opportunity to provide their own perceptions and information about their symptoms. Younger children (younger than 10 years) can provide assessment information, but their self-descriptions tend to be less reliable; therefore, direct and multiple observations and interviews may be necessary.
A criticism of reliance on caregiver reports in child assessments is that they are subject to reporter bias. However, all reports are subject to “bias,” including those from the child, parents, clinicians, teachers, and other observers. All reports are to some extent limited (or “biased”) by the perspectives, knowledge, recall, and candor of the informants. Because there is no unbiased “gold standard” source of data about children’s problems, data from multiple sources are always needed. Regardless of the child’s age, behavioral and emotional assessment strategies almost always should include information obtained from multiple sources, including parents, teachers, and the child, as well as by direct observation of the child. Data from multiple informants with different perspectives provide critical information about how the child functions in different settings such as at home, at school, and with friends. Even when there is discrepant information obtained from caregivers (as is often true), multiple vantage points are useful in determining the scope and functional effect of behavior problems.65
Assessment of child and adolescent emotional and behavioral problems is further complicated because of the high rate of comorbidity, heterogeneity, and severity of concerns. Children referred for assessments often meet diagnostic criteria for multiple disorders or display symptoms associated with multiple disorders. Thus, it is often important to assess not only a referred problem but also a broad range of social, emotional, and behavioral domains. For example, in their review of evidence-based assessment of conduct problems, McMahon and Frick66 concluded that because of the high rate of comorbid disorders (e.g., ADHD, depressive and anxiety disorders, substance use problems, language impairment, and learning difficulties), initial assessments of youth with conduct problems should include broadband measures to screen for all conditions, followed by disorder-specific scales, interview strategies, and standardized testing of conduct and comorbid disorders.
Behavioral Rating Scales
ACHENBACH SYSTEM OF EMPIRICALLY BASED ASSESSMENT/CHILD BEHAVIOR CHECKLIST11,67–71
The CBCL was one of the first broad-based rating scales of behavior in children to be developed, and it continues to be the most widely used method for behavioral assessments in children. Achenbach began work on what would become the CBCL in the 1960s in an effort to differentiate child and adolescent psychopathology.68 At that time, the DSM provided just two categories for childhood disorders: Adjustment Reaction of Childhood and Schizophrenic Reaction, Childhood Type. Achenbach and collaborators applied an empirically based approach to child psychopathology much like what was used in the development of the Minnesota Multiphasic Personality Inventory. This approach involved recording problems for large samples of children and adolescents, performing multivariate statistical analyses to identify syndromes of problems that co-occur, using reports to assess competencies and adaptive functioning, and constructing age and gender-specific profiles of scales on which to display individuals’ scores.11 These taxonomic procedures revealed that most behavior problems in children could be broadly divided into “internalizing” and “externalizing” conditions. This pioneering work had enormous influence on clinical and research assessment practices and established the empirical foundation for contemporary conceptualizations of child psychopathology.
The CBCL was published first in 1983 as a measure of behavior problems in children aged 4 to 18 years. Currently, there are ASEBA materials for ages 1½ to older than 90 years. There are forms for preschoolers (1½ to 5 years, parent and teacher/daycare versions)69 and school-aged children (parent, teacher versions for children aged 6 to 18 years and youth self-report for ages 11 to 18 years),67 as well as for adults (18 to 59 years)70 and older adults (60 to older than 90 years)71 (both with caregiver and self-report formats). For each problem listed, informants provide ratings on the following scale: 0 = “not true,” 1 = “somewhat or sometimes true,” and 2 = “very true or often true.” Hand-scored and computer-scored profiles are available, as are Spanish-language forms.
The Child Behavior Checklist for Ages 6-18 (CBCL/6-18) similarly obtains reports from parents, close relatives, and/or guardians regarding school-aged children’s competencies and behavioral/emotional problems. The competency scale includes 20 items about a child’s activities, social relations, and school performance. Specific behavioral and emotional problems are described in 118 items that are rated along the 0-to-2 scale described previously, along with two open-ended items for reporting additional problems. A scoring profile provides raw scores, T-scores, and percentiles for three competence scales (Activities, Social, and School); Total Competence; eight crossinformant (clinical scale) syndromes; and Internalizing, Externalizing, and Total Problems (broad scales). The eight clinical scales scored from the CBCL/6-18 Teacher Report Form and Youth Self-Report are Aggressive Behavior; Anxious/Depressed; Attention Problems; Rule-Breaking Behavior; Social Problems; Somatic Complaints; Thought Problems; and Withdrawn/Depressed. Now available are also six DSM-oriented scales associated with affective problems, anxiety problems, somatic problems, attention-deficit/hyperactivity problems, oppositional defiant problems, and conduct problems. The school-age scales are based on new factor analyses of parents’ ratings of nearly 5000 clinically referred children, and norms are based on results from a nationally representative sample of 1753 children aged 6 to 18 years11 (Box 7C-3).
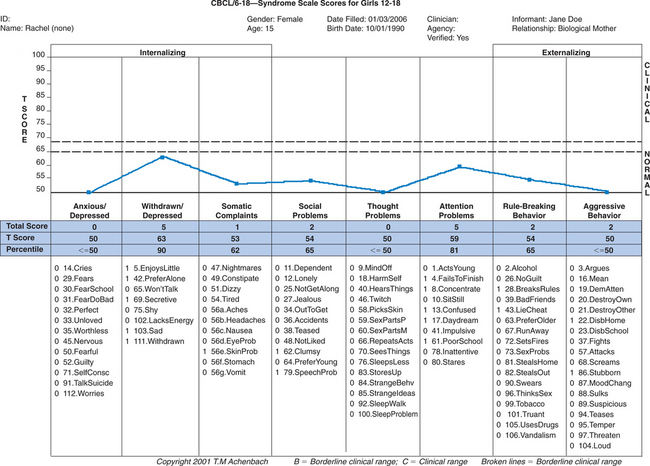
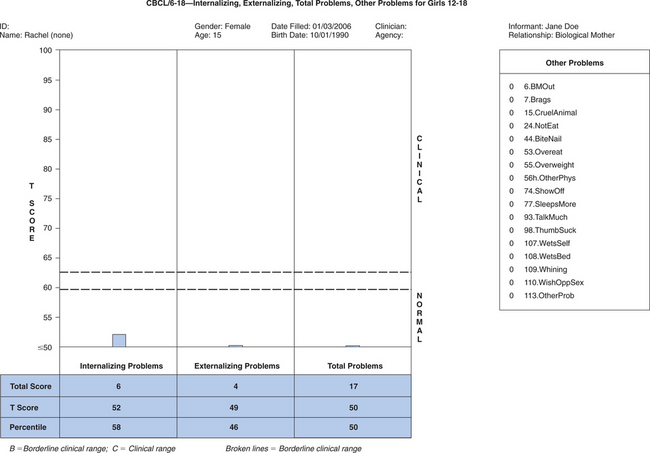
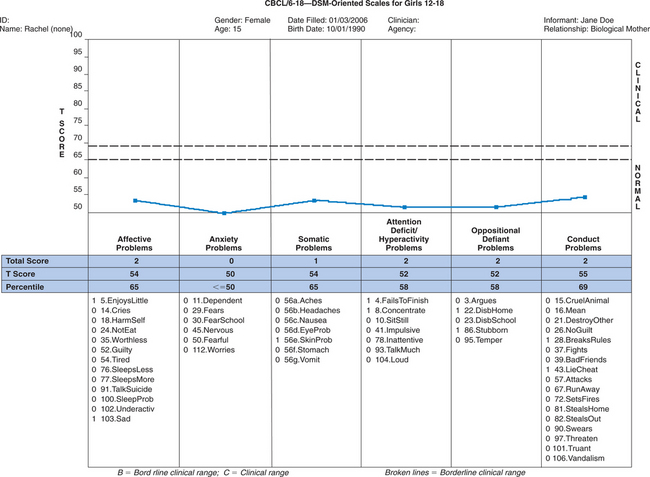
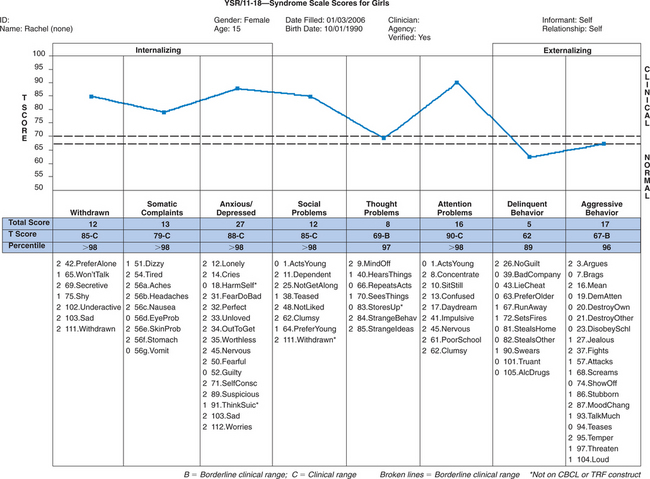
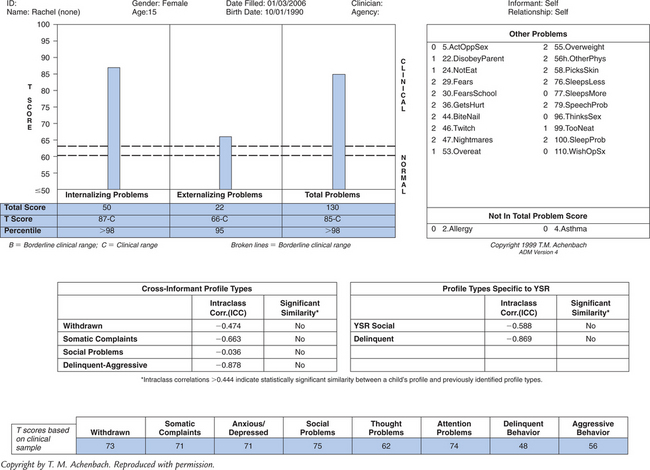
ASEBA materials are backed by extensive research in their development and have been used in more than 6000 studies pertaining to a broad range of behavioral health topics. There is strong support for its use with multidimensional child assessments in pediatric settings, (e.g., Mash and Hunsley2; Riekert et al,72 Stancin and Palermo73), although criticisms have been raised about the validity of the CBCL for populations of chronically ill children.74
INFANT-TODDLER SOCIAL-EMOTIONAL ASSESSMENT SCALE (ITSEA)76
The ITSEA provides a comprehensive analysis of emerging social-emotional development of infants and toddlers aged 12 to 36 months. It includes parallel parent and child care provider forms that contains 166 items focusing on behavioral and emotional problems and competencies. A national normative sample consisted of 600 children, with clinical groups that included children with autism, language delays, prematurity, and other disorders. English and Spanish forms are available with computer or hand scoring that yield T-scores for 4 broad domains, 17 specific subscales, and 3 index scores. An interesting feature of the ITSEA is its companion measure, the Brief Infant-Toddler Social-Emotional Assessment Scale.77 This measure contains 42 items, is completed by a parent or caregiver, and can be used first to screen for possible concerns and then followed with the ITSEA for more comprehensive evaluation.
Projective Techniques
Projective assessment techniques encourage a respondent to “project” issues, concerns, and perceptions onto ambiguous stimuli such as an inkblot or a picture. The basic premise is that when the child is faced with an ambiguous stimulus or one requiring perceptual organization, underlying psychological issues affecting the child will influence interpretation of these stimuli. The most commonly used projective techniques with children include use of child human figure or family drawings, storytelling responses to pictures or photographs, and reactions to Rorschach inkblots. Once the mainstay of personality assessment, projective assessment techniques have fallen out of favor in the era of evidence-based assessment techniques. However, some techniques continue to have clinical utility and validity with specific assessment purposes. They can provide clues that subsequently can be pursued with interviews and other techniques. For example, family drawings can be a helpful source of qualitative information about a child’s view of family relations, especially with younger children with more limited verbal expressions. Responses to incomplete sentences, story cards, and “3 wishes” (“if you could have 3 wishes, what would they be?”) can reveal insights into a child’s internal representations of relationships. In addition, the Rorschach has been shown to be a valid method for examining perceptual accuracy in youth with possible thought disorders when used with validated scoring systems such as John E. Exner’s system for scoring the Rorschach test.79
Assessing Peer Relationships
Peer perspectives contain unique and important information about children but are usually missing in multi-informant clinical assessments. Peers play critical social roles in children’s lives and have access to information that adults may not have and that children may be reluctant to self-report. For example, social acceptance within a peer group is an important aspect of a child’s functional status, but it can be difficult to assess accurately by interview or parent report. Sociometric assessments that use peer nomination methods have been developed as a systematic way of gathering information about the extent to which a child is accepted or rejected within a peer group.80 Strategies may involve asking children by interview or on paper to nominate three classmates with whom they most like to play (positive nominations/peer acceptance) and three classmates with whom they would least like to play (negative nominations/peer rejection). An alternative method is for children to rate how much they like to play with each classmate, for example, on a scale from 1 (“I don’t like to”) to 5 (“I like to a lot”). Using various statistical classification schemes, children can be considered to be popular, accepted, rejected, neglected, or controversial.
Peer nomination assessment instruments have been used to measure specific domains of child functioning besides peer acceptance. Techniques often involve presenting children in a classroom with a list of behavioral descriptions and asking them to select which of their peers best match each descriptor. Peer nomination approaches with acceptable reliability and validity have been developed to obtain peer ratings for a number of specific behavioral or emotional problem domains in children, such as ADHD symptoms, aggression and withdrawal, and depression.81
The Peer-report Measure of Internalizing and Externalizing Behavior81 was developed to assess a broad range of peer-reported externalizing and internalizing child psychopathology. As with other peer-nomination inventories, students are provided with classroom roster sheets that contain listings of all of the children in the classroom. Then, they are asked to select up to three classmates (either gender) who best fit the description read to them (e.g., “worry about things a lot” or “get mad and lose their temper”). Preliminary reports suggest that this measure demonstrates adequate reliability and validity as a broad measure of psychopathology.
Testing for Specific Problems
PARENT-CHILD INTERACTIONS
Parent-child interaction problems contribute significantly to the origin and maintenance of a wide range of behavior problems in children. Therefore, treatment of children in mental health settings, especially children with negative, externalizing behaviors, often focuses on promoting optimal parenting styles and parent-child interactions. For these reasons, assessment of parent-child interactions is essential when treatment interventions are planned for children with a wide range of behavioral problems.82
Parent-child interactions may be assessed through observation, Q-sorts (cards with descriptive labels are “sorted” into piles as to how well they pertain to a child), or rating scales. Qualitative assessments through observations may be conducted in vivo or by using videotape recordings of parent-child interactions. The Dyadic Parent-Child Interaction Coding System83 is widely used in clinical and research settings to code direct observations in a standardized laboratory setting. Observations (through a one-way mirror or videotape) are made during three standard parent-child interaction settings: child-led play, parent-led play, and cleaning up. Parent and child verbalizations and physical behaviors are coded along 25 categories. Reliability and validity studies provide good support for use of the Dyadic Parent-Child Interaction Coding System to evaluate baseline and post treatment behaviors, as well as to measure ongoing treatment progress.83 In addition to this structured method of observation, it is sometimes useful to observe parent-child interactions in more naturalistic settings.84
The classic research method for assessing the quality of parent-child relationships is the laboratory Strange Situation Paradigm developed by Ainsworth (described by Shaddy and Colombo85). Strength and quality of an infant’s attachment to a caregiver are assessed by placing the child in situations in which he or she is alone with the caregiver, separated from caregiver and introduced to a stranger, and then reunited with the caregiver. The infant can be classified as securely attached, ambivalent/resistant, avoidant, or disorganized on basis of reactions in those situations.
Information about parent-child interactions in clinical settings can be obtained from sorting techniques and rating scales. The Attachment Q-Set (as described by Querido and Eyberg)82 is a measure of a child’s attachment related behaviors. Parents sort 90 behavioral dimensions of security, dependency, and sociability into piles according to the extent to which they describe the child. Results of the Q-set are related to results obtained by exposing infants to the Strange Situation Paradigm. In addition, there are a variety of measures by which to assess various dimensions of parent-child relationships and interactions through the use of rating scales and checklists.82
DEPRESSION
Self-report questionnaires and rating scales are usually preferred over parent or teacher rating scales for screening depression in children and teens and for monitoring symptoms during treatment. However, they tend to have limited sensitivity and specificity and therefore should be used cautiously.86 Moreover, they can be influenced by respondent bias if the child does not want to divulge information. The most widely used depression rating scale for children and adolescents is the Children’s Depression Inventory.87 This instrument includes 27 items covering a range of depressive symptoms and associated features and it can be used in youth ages 7-17. Research on the Children’s Depression Inventory has generally shown it to have good internal consistency, test-retest reliability, and sensitivity to change, but the evidence for discriminant validity is more limited.86
The Mood and Feeling Questionnaire88 is a 32-item measure of depression (and there is an even briefer 13-item version) that has been shown to have good estimates of reliability, discriminant validity, and sensitivity to change for children aged 8 to 18 years.86 The Reynolds Child Depression Scale89 and the Reynolds Adolescent Depression Scale90 are 30-item scales for youth aged 8 to 12 and 13 to 18. These scales have also been shown to be internally consistent and stable, although there is more limited evidence of discriminant validity and sensitivity to change.86
The Children’s Depression Rating Scale91 is an interesting hybrid measure that combines separately obtained responses from a child and an informant along with the clinician’s behavioral observations. Seventeen items assess cognitive, somatic, affective, and psychomotor symptoms; cutoff scores provide estimates of level of depression. Moderate reliability, convergent validity, and sensitivity to treatment have been demonstrated, but, as with most measures of depression, it does not distinguish between depression and anxiety very well.86
Assessment of depression in infants and preschool children is very challenging because of the difficulty of eliciting self-report information in a reliable or valid manner. Caregiver reports obtained with broadband measures (such as the CBCL/1½-5 or Teacher Report Form 1-5) may be a useful alternative or adjunctive tool. A new parent report screening measure of preschool depression is the Preschool Feelings Checklist.92 This 20-item checklist of depressive symptoms in young children was shown to have high internal consistency and to be correlated highly with the Diagnostic Interview for Children—IV and the CBCL on a sample of 174 preschool children from a primary care setting. Moreover, preliminary study suggested that it had acceptable sensitivity and specificity when a cutoff score of 3 was used.92
ANXIETY
Screening for anxiety disorders is most often done with rating scales, although data supporting their use are sparse, and several scales have been shown to measure different anxiety constructs.93 The Multidimensional Anxiety Scale for Children94 is a youth self-report rating scale that assesses anxiety in four domains: physical symptoms, social anxiety, harm avoidance, and separation/panic. Children aged 8 to 19 are asked to rate how true 39 items are for them. Internal consistency reliability coefficients of subscales and total scores range from 0.74 to 0.90, although interrater reliability is lower (0.34 to 0.93). The Multidimensional Anxiety Scale for Children has some support for use as a screener for anxiety disorders, as does the Social Phobia and Anxiety Inventory for Children,95 the Social Anxiety Scale for Children96 and the Social Anxiety Scale for Adolescents.97 The Revised Children’s Manifest Anxiety Scale,98 although widely used, does not appear to discriminate between children with anxiety disorders and those with other psychiatric conditions and therefore should be used cautiously as a screening or diagnostic tool.93 However, it does appear to be sensitive to change and therefore may be a useful tool for monitoring treatment effects.
ATTENTION-DEFICIT/HYPERACTIVITY DISORDER
ADHD is one of the most common childhood mental health disorders and a frequent diagnostic consideration in developmental-behavioral pediatric settings. Despite the vast literature on ADHD psychopathology and treatment, considerably less research has been directed toward determining best assessment practices.5 The most efficient empirically based assessment methods for diagnosing ADHD are parent and teacher symptom rating scales based on DSM-IV criteria (e.g., the ADHD Rating Scale99 or the Vanderbilt ADHD Diagnostic Scales100) or derived from a rational or empirical basis (e.g., BASC or CBCL).101 Broadband rating scales (such as the BASC or CBCL) were not recommended for diagnosing ADHD in the American Academy of Pediatrics Diagnostic Guidelines102 because broad domain factors (e.g., externalizing) do not discriminate children referred for ADHD from nonreferred peers.103,104 However, a more recent review5 challenged this recommendation, concluding that the Attention Problems subscales within the CBCL and BASC do accurately identify children with ADHD. Because of their ability to identify other comorbid conditions and impairments, broadband measures (which also have advantages of extensive normative information across gender and developmental ages) are probably more efficient than DSM-IV—based rating scales for diagnosing ADHD.5
As with any disorder, ADHD should not be diagnosed with symptom rating scales alone. Clinical interviews and other sources of data are needed to establish pertinent history, to rule out other disorders that may better account for symptoms (e.g., autism, low intellectual functioning, post-traumatic stress disorder, adjustment problems), and to assess comorbid conditions. Interestingly, DSM-based structured interviews have not been shown to add incremental validity to parent and teacher rating scales.5 Behavioral observation assessment procedures have been shown to be empirically valid in numerous studies but practically impossible in most clinical settings, although parent and teacher proxy observational measures have been developed.5 Measures of child functioning and impairment in key domains including peer relationships, family relationships, and academic settings, should be included in an ADHD assessment and are likely to be more useful for treatment purposes than are global ratings of impairment. Moreover, assessment of ADHD needs to emphasize situational contexts and socially valid target behaviors (i.e., functional analysis of behavior) necessary for treatment planning (Box 7C-4).
AUTISM SPECTRUM DISORDERS
Empirically based procedures for assessing ASDs have emerged since the 1990s, greatly improving the accuracy and validity of the diagnoses and the ability to plan and evaluate interventions. Ozonoff and associates105 summarized the current state of the art with regard to assessment of ASDs and recommended a core assessment battery that includes collecting diagnostic information from parents and by direct observation along with standardized measures of intelligence, language, and adaptive behavior. One ASD-specific measure is the Autism Diagnostic Interview—Revised,106 a comprehensive, semistructured diagnostic parent interview that elicits current behavior and developmental history. It yields three algorithm scores measuring social difficulties, communication deficits, and repetitive behaviors; these scores have been shown to distinguish children with autism from children with other developmental delays. I is very labor intensive in terms of training (3 days) and administration time (3 hours) and therefore has been used more in research than in clinical settings.105
The Autism Diagnostic Observation Schedule (ADOS)107 is a widely used semistructured, interactive assessment of ASD symptoms. It includes four graded modules and can be used with a broad range of patients from the very young and nonverbal to high-functioning, verbal adults. Modules 1 and 2, geared toward developmentally younger children, assess social interest, joint attention, communication behaviors, symbolic play, and atypical behaviors. Modules 3 and 4 assess higher level functioning individuals, with a focus on conversational reciprocity, empathy, insight into social relationships, and special interests. Administration time is typically less than an hour. For either pair of modules there are empirically derived cutoff scores for autistic disorder and for broader ASDs (such as Asperger syndrome). Studies on the psychometric properties of the Autism Diagnostic Observation Schedule indicate excellent reliability (interrater, internal consistency, and test-retest reliability) for each module, as well as excellent diagnostic validity.105
A parent-report alternative to the Autism Diagnostic Interview—Revised for children older than 4 years is the Social Communication Questionnaire.108 This instrument has a lifetime-behavior version helpful for diagnostic purposes, as well as a current-behavior version that can be used for evaluating a person’s change over time.105 Currently, the widely popular Gilliam Autism Rating Scale109 has not been subjected to sufficient psychometric study to recommend its use.105 Several parent report measures have been developed to help diagnose other ASD disorders (e.g., Asperger syndrome), but at present, there is not sufficient empirical study to recommend their use. A clinically practical method of direct observation for children older than 24 months is the Childhood Autism Rating Scale.110 Little training is necessary to rate 15 items on a 7-point scale (from “typical” to “severely deviant”); the results yield a composite score that is correlated highly with that of the Autism Diagnostic Interview—Revised (although it may overidentify children with mental retardation as having ASD).
Family Assessment
Evaluations in developmental and behavioral pediatrics often include a family assessment in order to understand the interpersonal dynamics of the family system.111 Using an unstructured interview format, a clinician may inquire about family structure, roles, and functioning and explore each family member’s perception of a presenting issue or problem. This assessment approach is often useful in family therapy sessions. Structured interviews may be employed to ensure that specific areas or topics are covered. Genograms are graphic representations of families that begin with a family tree and may include additional details about family structure, cohesiveness or conflicts, timelines of events, and family patterns (e.g., domestic violence, substance abuse, divorce, suicides, health conditions, presence of behavioral disorder). Formal, validated observational approaches to family assessment typically involved trained observers who coded ratings during live or videotaped observations of family interactions and are mostly confined to research settings.
There are many family self-report questionnaires targeting different aspects of functioning that may be useful in family assessments, especially in research settings.112 Although questionnaires have psychometric appeal, they carry biases of the individual completing them, which is counter to the spirit of family assessment. Moreover, questionnaires may have limited utility when specific treatment recommendations are developed in clinical settings for a particular family’s set of concerns.111 A popular example of a parent report family questionnaire with research and clinical applications is the Parenting Stress Index.113 This index consists of 120 items about child characteristics, parent personality, and situational variables, and it yields a Total Stress Score, as well as scale scores for child and parent characteristics. It has been translated and validated for use with a variety of international populations and has been shown to be useful in a clinical contexts.
Functional Outcomes
Measures of global functioning are typically ratings of a clinician’s judgment about a child or adolescent’s overall functioning in day-to-day activities at school, at home, and in the community.114 Measures of global functioning are useful for identifying need for treatment, as well as for monitoring treatment effects and predicting treatment outcome. The importance of global functioning is reflected in the placement of the Global Assessment of Functioning—which stipulates that impairment in one of more areas of functioning is necessary in order to meet criteria for a diagnosis—as Axis V on the DSM-IV. The Global Assessment of Functioning is a scale of a mental health continuum from 1 to 100 with 10 anchor descriptions; higher scores reflect better functioning. For example, a score between 31 and 40 would be given for a child with major functional impairment in several areas (frequently beats up younger children, is unruly at home, and is failing in school); a score between 61 and 70 is given to a child with mild symptoms (mild depressed mood) or some difficulties in functioning (disruptive in school) but who generally functions fairly well and who has good social relationships. Shaffer and colleagues modified the anchors of the Global Assessment of Functioning to pertain better to youth, creating the Children’s Global Assessment Scale (CGAS).115 This instrument yields one score and has been used in a large number of psychiatric outcome studies, especially medication-related research.111
A widely used measure of functioning is the Child and Adolescent Functional Assessment Scale.116 This measure is a clinician-rated instrument consisting of behavioral descriptions (e.g., is expelled from school, bullies peers) grouped into levels of impairment for each of five domains: role performance (school/work, home, community), behavior toward others, moods/self-harm, substance use, and thinking. The Child and Adolescent Functional Assessment Scale has been shown to have considerable criterion-related and predictive validity and is widely used to evaluate outcome in clinical settings and in clinical research.111
Adaptive functioning measures such as the Vineland Adaptive Behavior Scales117 are used to assess personal and social skills needed for everyday living and are especially useful for identifying children with mental retardation, developmental delays, and pervasive developmental disorders. The Vineland scales include survey interview and parent/caregiver rating forms that yield domain and adaptive behavior composite standard scores (M = 100, SD = 15), percentile ranks, adaptive levels, and age-equivalent scores for individuals from birth to age 90 years. Domains assessed include Communication, Daily Living Skills, Socialization, Motor Skills, and an optional Maladaptive Behavior Index.
Health-related quality-of-life (HRQOL) measures have been developed to evaluate functional outcomes in clinical and health services research. HRQOL measures differ from more traditional measures of health status and physical functioning by also assessing broader psychosocial dimensions such as emotional, behavioral, and social functioning. The Pediatric Quality of Life Inventory (PedsQL 4.0)118 is an example of an HRQOL measure that has been developed and validated for use in pediatric settings. The PedsQL 4.0 Generic Core Scales assess physical, emotional, social, and school functioning with child self-report (ages 5 to 18) and parallel parent proxy-report formats (for children aged 2 to 18 years). Physical Health and Psychosocial Health summary scores are transformed to a scale of 0 to 100 in which higher scores reflect better health-related quality of life. The PedsQL 4.0 had excellent internal consistency reliability in a large pediatric sample, distinguished healthy children from those with chronic health conditions, and was related to other indicators of health status.118
SUMMARY AND IMPLICATIONS FOR CLINICAL CARE
A psychological evaluation is complete when assessment data have been organized, synthesized, integrated, and presented, usually in the form of a written report.1,17 Reports are usually independent documents written with an intended audience in mind. They should include assessment findings, such as relevant history, current problems, assets, and limitations, as well as behavioral observations and test interpretations. A typical report includes the following sections or elements: identifying information, reason for referral, sources of assessment information (including tests administered if any), behavioral observations, results and impressions, recommendations, and summary.
A major concern in developmental and behavioral assessment has been the misuse of test data.1 For example, deviations from standardized procedures in test administration, disrespect for copyrights, use of tests for purposes without adequate research support, interpretation of results without taking into account appropriate norms or reference groups, and use of a single test score for making decisions about a child are among more common problems with test use. Led by a consortium of professional associations (including the American Educational Research Association, the American Psychological Association, and the National Council on Measurement in Education), the Joint Committee on Testing Practices has ongoing workgroups charged with improving quality of test use. Several documents have been created to guide professionals who might develop or use educational or psychological tests, including Standards for Educational and Psychological Testing119 and the Code of Fair Testing Practices in Education (Revised).120
Another important clinical issue pertains to what qualifications are necessary for psychological test administrators. Although a thorough review of these issues is beyond the scope of this chapter, the Joint Committee on Testing Practices has developed guidelines that address this issue.121,122 Most discussions about user qualifications emphasize knowledge and skills necessary to administer and interpret tests in the context in which a particular measure is being used, as opposed to a particular professional degree or license. Some instruments can be administered with relatively little training in psychometric issues (e.g., clinical rating scales such as the Vanderbilt ADHD Diagnostic Scales), whereas other instruments require extensive training and supervised experience (e.g., individually administered ability tests such as the BSID or Wechsler tests). To be qualified to administer most of the instruments discussed in this chapter, a test user should have extensive knowledge and skills related to psychometrics and measurement, selection of appropriate tests, test administration, and other variables that influence test data. Such knowledge and skills generally require advanced graduate level coursework in psychology and supervised clinical experience. Psychologists (among others) are generally those who are qualified to use psychological tests properly.
Proper use of tests in clinical assessments require high level skills and professional judgments in order to make valid interpretation of scores and data collected from multiple sources, with the use of proper test selection, administration, and scoring procedures.122 When selecting methods, the clinician evaluates whether the construction, administration procedures, scoring, and interpretation of the methods under consideration match the current assessment need, knowing that mismatches may invalidate test interpretation. Instrument selection also is influenced by practical considerations such as training, familiarity, personal preference, and availability of test materials. Cost considerations may also factor into instrument selection. Test development can be very costly, especially if normative samples are broadly developed. Therefore, it may not be financially feasible to purchase test materials for all clinical assessments.
We wish to emphasize the importance of adhering to standardized administration procedures in using psychological tests. Valid interpretation of measurement results cannot be made if there are deviations in administration or scoring procedures. For example, interpretations based on test procedures that have been altered or shortened for convenience or other reasons without accompanying psychometric study are not valid or clinically sound. Likewise, interpretation of assessment results should never rely solely on test scores.1 Clinical judgments should be made by integrating assessment and observational data, taking into consideration whether results are congruent with other pieces of information, discrepancies from different sources, and factors affecting the reliability and validity of results (e.g., motivation of child, language barriers).
Use of standardized ability, achievement, and behavioral tests has come under attack since the 1980s. Critics have argued that intelligence and achievement tests used to allocate limited educational resources penalize children whose family, cultural, and socioeconomic status are different from middle-class European American children.1 Specifically, it has been argued that intelligence and achievement tests are culturally biased and thus harmful to African American children and other ethnic minorities. Other experts have been critical of test use to label children or have argued that normreferenced tests are imperfect in what they measure and therefore have little or no utility in the classroom. Dialog on these criticisms has led to improved test practices, including more representative normative groups, increased availability of tests in languages other than English, increased awareness of cultural factors among clinicians administering and interpreting tests, and use of criterion- or curriculum-based assessments.
Computers are playing more of a role in clinical assessments. They can facilitate administration and scoring of some tests and interview methods, recording of observational data, preparation of reports, and transmittal of assessment information.1 For example, the CBCL’s computer scoring program yields several score profiles, including useful crossinformant comparisons along with a narrative report.67 Computer-administered assessment methods have several advantages, including eliminating human clinicians’ biases, calculation errors, and memory difficulties. Computers will probably be used more extensively in the future to assist in selecting assessment instruments, making diagnoses, designing interventions, and monitoring treatment effects. However, it unlikely that computers will supplant the clinician, who will still be needed to integrate computer-generated results into meaningful recommendations. In fact, there are potential dangers of using computer-generated reports, and knowledgeable professionals understand that these reports should be used cautiously when being incorporated into assessment reports.
SUMMARY AND IMPLICATIONS FOR RESEARCH
Selecting the right measure for a specific research or clinical purpose can be a daunting prospect. It is important to recognize that developmental and behavioral measures are not limited to published tests and that literally thousands of unpublished, noncommercial inventories, checklists, scales, and other instruments exist in the behavioral sciences literature. To avoid the time-consuming task re-creating instruments, researchers are urged to investigate what existing measures are available to suit a particular need. The American Psychological Association Web site (http://www.apa.org/science/faq-findtests.html) provides helpful information about locating both published and unpublished test instruments. For example, the PsycINFO database (usually available at a local library) is an excellent source of information on the very latest behavioral science research, including testing. In addition, the Buros Mental Measurements Yearbooks123 have provided consumer-oriented, critical test reviews since 1938 and can provide evaluative information for informed test selection. The Buros Center for Testing also offers online reviews and information about nearly 4000 measures at www.unl.edu/buros. Fortunately, most commercially available tests can be located and purchased easily by accessing Web sites on the Internet.
Unfortunately, there are as yet no clear guidelines or criteria with which to evaluate measures or to decide what measures are better than others.4 However, with psychometric study and refinement, many research tools can become important clinical measures with evidence to support their use.
Assessment in developmental-behavioral pediatrics is continually evolving in response to new research and clinical problems. This chapter highlights some of the emerging assessment trends being studied such as development of empirically based assessment procedures, expansion of measures appropriate for ethnic minorities and culturally diverse populations (especially children with limited English proficiency), and use of computer-assisted technologies. Internet and Web-based assessment applications are of particular interest, but they also raise concerns about threatened test security, psychometric integrity, and ethical and legal ramifications.124
1 Sattler JM. Assessment of Children: Cognitive Applications, 4th ed. San Diego: Jerome M. Sattler, 2001.
2 Mash EJ, Hunsley J. Evidence-based assessment of child and adolescent disorders: Issues and challenges. J Clin Child Adolesc Psychol. 2005;34:362-379.
3 McConaughy SH. Clinical Interviews for Children and Adolescents: Assessment to Intervention. New York: Guilford, 2005.
4 Kazdin AE. Evidence-based assessment for child and adolescents: Issues in measurement development and clinical applications. J Clin Child Adolesc Psychol. 2005;34:548-558.
5 Pelham WE, Fabiano GA, Massetti GM. Evidence-based assessment of attention deficit hyperactivity disorder in children and adolescents. J Clin Child Adolesc Psychol. 2005;34:449-476.
6 Spence SH. Interviewing. In: Ollendick TH, Schroeder CS, editors. Encyclopedia of Clinical Child and Pediatric Psychology. New York: Kluwer Academic/Plenum; 2003:324-326.
7 Schroeder CS, Gordon BN. Assessment and Treatment of Childhood Problems: A Clinician’s Guide, 2nd ed. New York: Guilford, 2002.
8 Shaffer D, Fisher P, Lucas CP, et al. NIMH Diagnostic Interview for Children-IV (NIMH DISC-IV): Description, differences from previous versions, and reliability of some common diagnoses. J Am Acad Child Adolesc Psychiatry. 2000;39:28-38.
8a American Psychiatric Association. Diagnostic and Statistical Manual of Mental Disorders, 4th ed. Washington, DC: American Psychiatric Association, 1994.
9 Reich W. Diagnostic Interview for Children and Adolescents (DICA). J Am Acad Child Adolesc Psychiatry. 2000;39:59-66.
10 McConaughy SH, Achenbach TM. Manual for the Semistructured Clinical Interview for Children and Adolescents, 2nd ed. Burlington: University of Vermont, Research Center for Children, Youth, & Families, 2001.
11 Achenbach TM: ASEBA: Achenbach System of Em pirically Based Assessment, 2005. (Available at: http://www.aseba.org/aboutus/aboutus.html; accessed 10/18/06.)
12 Angold A, Prendergast M, Cox A, et al. The Child and Adolescent Psychiatric Assessment (CAPA). Psychol Med. 1995;25:739-753.
13 Miller WR, Rollnick S. Motivational Interviewing: Preparing People to Change, 2nd ed. New York: Guilford, 2002.
14 DiClemente CC, Prochaska JO. Toward a comprehensive, transtheoretical model of change: Stages of change and addictive behaviors. In: Miller WR, Heather N, editors. Treating Addictive Behaviors. 2nd ed. New York: Plenum Press; 1998:3-24.
15 Baer JS, Peterson PL. Motivational interviewing with adolescents and young adults. In: Miller WR, Rollnick SR, editors. Motivational Interviewing: Preparing People to Change. 2nd ed. New York: Guilford; 2002:320-332.
16 Sindelar HA, Abrantes AM, Hart C, et al. Motivational interviewing in pediatric practice. Curr Prob Pediatr Adolesc Health Care. 2004;34:322-339.
17 Aylward GP. Practitioner’s Guide to Developmental and Psychological Testing. New York: Plenum Medical, 1994.
18 Aylward GP. Infant and Early Childhood Neuropsy-chology. New York: Plenum Press, 1997.
19 Aylward GP. Measures of infant and early childhood development. Goldstein G, Beers SR, editors. Comprehensive Handbook of Psychological Assessment. Hoboken, NJ: Wiley; 2004;1:87-97.
20 Aylward GP, Carson AD: Use of the Test Observation Checklist with the Stanford-Binet Intelligence Scales for Early Childhood, Fifth Edition (Early SB5). Presented at the National meeting of the National Association of School Psychologists, Atlanta, GA, April 1, 2005.
21 Bishop D, Butterworth GE. A longitudinal study using the WPPSI and WISC-R with an English sample. Br J Educ Psychol. 1979;49:156-168.
22 Mantynen H, Poikkeus AM, Ahonen T, et al. Clinical significance of test refusal among young children. Child Neuropsychol. 2001;7:241-250.
23 Ounsted M, Cockburn J, Moar VA. Developmental assessment at four years: Are there any differences between children who do, or do not, cooperate? Arch Dis Child. 1983;58:286-289.
24 Wolcaldo C, Rieger I. Very preterm children who do not cooperate with assessments at three years of age: Skill differences at five years. J Dev Behav Pediatr. 2000;21:107-113.
25 Langkamp DL, Brazy JE. Risk for later school problems in preterm children who do not cooperate for preschool developmental testing. J Pediatr. 1999;135:756-760.
26 Roid G. Stanford-Binet Intelligence Scales for Early Childhood. Itasca, IL: Riverside, 2005.
27 Bayley N. Bayley Scales of Infant and Toddler Development. San Antonio, TX: The Psychological Corporation, 2006.
28 Bayley N. Bayley Scales of Infant Development. San Antonio, TX: The Psychological Corporation, 1969.
29 Gesell AL, Halverson HM, Amatruda CS. The First Five Years of Life: A Guide to the Study of the Preschool Child, From the Yale Clinic of Child Development. New York: Harper, 1940.
30 Gesell A. The Mental Growth of the Preschool Child. New York: Macmillan, 1925.
31 Cattell P. Cattell Infant Intelligence Scale. New York: The Psychological Corporation, 1940.
32 Knobloch H, Stevens F, Malone AE. Manual of Developmental Diagnosis. New York: Harper & Row, 1980.
33 Bayley N. Bayley Scales of Infant Development-II. San Antonio, TX: The Psychological Corporation, 1993.
34 Flynn JR. Searching for justice. The discovery of IQ gains over time. Am Psychol. 1999;54:5-20.
35 Black M, Matula K. Essentials of Bayley Scales of Infant Development-II Assessment. New York: Wiley, 2000.
36 Greenspan SI. Greenspan Social-Emotional Growth Chart: A Screening Questionnaire for Infants and Young Children. San Antonio, TX: Harcourt Assessment, 2004.
37 Harrison PL, Oakland T. Adaptive Behavior Assessment System, 2nd ed. San Antonio, TX: The Psychological Corporation, 2003.
38 Dunn LM, Dunn LM. The Peabody Picture Vocabulary Test-III. Circle Pines, MN: American Guidance Service, 1997.
39 Newborg J. Battelle Developmental Inventory-Second Edition. Itasca, IL: Riverside, 2005.
40 Newborg J, Stock JR, Wnek L, et al. The Battelle Developmental Inventory. Itasca, IL: Riverside, 1994.
41 Mullen EM. Mullen Scales of Early Learning. Circle Pines, MN: American Guidance Service, 1984.
42 Mullen EM. Mullen Scales of Early Learning: AGS Edition. Circle Pines, MN: American Guidance Service, 1995.
43 Elliott CD. Differential Ability Scales. San Antonio, TX: The Psychological Corporation, 1990.
44 McCarthy DA. McCarthy Scales of Children’s Abilities. New York: The Psychological Corporation, 1972.
45 Kaufman AS, Kaufman NL. Kaufman Brief Intelligence Test, Second Edition. Circle Pines, MN: American Guidance Service, 2004.
46 Roid G. The Stanford-Binet Intelligence Scale-Fifth Edition. Itasca, IL: Riverside, 2003.
47 Kaufman AS, Kaufman NL. Kaufman Assessment Battery for Children-Second Edition. Circle Pines, MN: American Guidance Service, 2004.
48 Wechsler D. Wechsler Preschool and Primary Scale of Intelligence-Third Edition. San Antonio, TX: The Psychological Corporation, 2002.
49 Wechsler D. Wechsler Intelligence Scale for Children-Fourth Edition. San Antonio, TX: The Psychological Corporation, 2003.
50 Wechsler D. The WASI: Wechsler Abbreviated Scale of Intelligence. San Antonio, TX: The Psychological Corporation, 1999.
51 Ramsay MC, Reynolds CR. Relations between intelligence and achievement tests. Goldstein G, Beers SR, editors. Comprehensive Handbook of Psychological Assessment. Hoboken, NJ: Wiley; 2004;1:25-50.
52 Kaufman AS, Kaufman NL. Kaufman Test of Educational Achievement, 2nd ed. Circle Pines, MN: American Guidance Service, 2004.
53 Markwardt EC. Peabody Individual Achievement Test-Revised. Circle Pines, MN: American Guidance Service, 1989.
54 Markwardt EC. Peabody Individual Achievement Test-Normative Update. Circle Pines, MN: American Guidance Service, 1998.
55 Wechsler D. The Wechsler Individual Achievement Test, 2nd ed. San Antonio, TX: The Psychological Corporation, 2001.
56 Wilkerson G. Wide Range Achievement Test, 3rd ed. Wilmington, DE: Wide Range, Inc, 1993.
57 Robertson GJ. Wide Range Achievement Test-Expanded Version. Odessa, FL: Psychological Assessment Resources, 2002.
58 Woodcock RW, McGrew KS, Mather N. Woodcock-Johnson III. Tests of Achievement. Itasca, IL: Riverside, 2001.
59 Leark RA. The Luria-Nebraska Neuropsychological Battery-Children’s Revision. Goldstein G, Beers SR, editors. Comprehensive Handbook of Psychological Assessment. Hoboken, NJ: Wiley; 2004;1:147-156.
60 Cohen M. Children’s Memory Scale. San Antonio, TX: The Psychological Corporation, 1997.
61 Korkman M, Kirk U, Kemp SL. NEPSY-A Developmental Neuropsychological Assessment. San Antonio, TX: The Psychological Corporation, 1998.
62 Gioia GA, Isquith PK, Guy SC, et al. Behavior Rating Inventory of Executive Function (BRIEF). Odessa, FL: Psychological Assessment Resources, 2000.
63 Sheslow D, Adams W. The Wide Range Assessment of Memory and Learning. Wilmington, DE: Jastak Associates, 1990.
64 Sheslow D, Adams W. Wide Range Assessment of Memory and Learning, 2nd ed. Odessa, FL: Psychological Assessment Resources, 2003.
65 Achenbach TM, McConaughy SH, Howell CT. Child/adolescent behavioral and emotional problems: Implications of crossinformant correlations for situational specificity. Psychol Bull. 1987;101:213-232.
66 McMahon RJ, Frick PJ. Evidence-based assessment of conduct problems in children and adolescents. J Clin Child Adolesc Psychol. 2005;34:477-505.
67 Achenbach TM, Rescorla LA. Manual for ASEBA School-Age Forms & Profiles. Burlington: University of Vermont, Research Center for Children, Youth, & Families, 2001.
68 Achenbach TM. The classification of children’s psychiatric symptoms: A factor-analytic study. Psychol Monogr. 80(No. 615), 1966.
69 Achenbach TM, Rescorla LA. Manual for ASEBA Preschool Forms & Profiles. Burlington: University of Vermont, Research Center for Children, Youth, & Families, 2000.
70 Achenbach TM, Rescorla LA. Manual for ASEBA Adult Forms & Profiles. Burlington: University of Vermont, Research Center for Children, Youth, & Families, 2003.
71 Achenbach TM, Newhouse PA, Rescorla LA. Manual for ASEBA Older Adult Forms & Profiles. Burlington: University of Vermont, Research Center for Children, Youth, & Families, 2004.
72 Riekert KA, Stancin T, Palermo TM, et al. A psychological behavioral screening service: Use, feasibility, and impact in a primary care setting. J Pediatr Psychol. 1999;24:405-414.
73 Stancin T, Palermo TM. A review of behavioral screening practices in pediatric settings: Do they pass the test? J Dev Behav Pediatr. 1997;18:183-194.
74 Perrin EC, Stein REK, Drotar D. Cautions in using the Child Behavior Checklist: Observations based on research about children with a chronic illness. J Pediatr Psychol. 1991;16:411-421.
75 Reynolds CR, Kamphaus RW. Behavior Assessment System for Children-Second Edition (BASC-2) Manual. Circle Pines, MN: AGS Publishing, 2006.
76 Carter A, Briggs-Gowan M. Infant Toddler Social Emotional Assessment (ITSEA). San Antonio, TX: Harcourt Assessment, 2006.
77 Carter A, Briggs-Gowan M. Brief Infant Toddler Social Emotional Assessment (BITSEA). San Antonio, TX: Harcourt Assessment, 2006.
78 Butcher JN, Williams CL. Minnesota Multiphasic Personality Inventory-Adolescent (MMPI-A) Manual. Minneapolis, MN: University of Minnesota Press, 1992.
79 Society for Personality Assessment. The status of the Rorschach in clinical and forensic practice: An official statement by the Board of Trustees of the Society for Personality Assessment. J Pers Assess. 2005;85:219-237.
80 Morris TL. Sociometric assessment. In: Ollendick TH, Schroeder CS, editors. Encyclopedia of Clinical Child and Pediatric Psychology. New York: Kluwer Academic/Plenum; 2003:632-634.
81 Weiss B, Harris V, Catron B. Development and initial validation of the Peer-Report Measure of Internalizing and Externalizing Behavior. J Abnorm Child Psychol. 2002;30:285-294.
82 Querido JG, Eyberg SH. Assessment of parent-child interactions. In: Ollendick TH, Schroeder CS, editors. Encyclopedia of Clinical Child and Pediatric Psychology. New York: Kluwer Academic/Plenum; 2003:40-41.
83 Eyberg SM, Nelson MMcD, Duke M, et al: Manual for the Dyadic Parent-Child Interaction Coding System Third Edition, 2005. (Available at: http://www.phhp.ufl.edu/∼seyberg/PCITWEB2004/Measures/DPICS%20III%20final%20draft.pdf; accessed 10/18/06.)
84 White S: Parent training: Use of videotaped interactions. Presented at the Great Lakes Society of Pediatric Psychology Conference, Cleveland, OH, March 20, 2000.
85 Shaddy DJ, Colombo J. Attachment. In: Ollendick TH, Schroeder CS, editors. Encyclopedia of Clinical Child and Pediatric Psychology. New York: Kluwer Academic/Plenum; 2003:43-44.
86 Klein DN, Dougherty LR, Olino TM. Toward guidelines for evidence-based assessment of depression in children and adolescents. J Clin Child Adolesc Psychol. 2005;34:412-432.
87 Kovacs M. Children’s Depression Inventory (CDI) Manual. North Tonawanda, NY: Multi-Health Systems, 1992.
88 Angold A, Costello EJ, Messer SC, et al. Development of a short questionnaire for use in epidemiological studies of depression in children and adolescents. Int J Methods Psychiatric Res. 1995;25:237-249.
89 Reynolds WM. Reynolds Child Depression Scale: Professional Manual. Odessa, FL: Psychological Assessment Resources, 1989.
90 Reynolds WM. Reynolds Adolescent Depression Scale: Professional Manual. Odessa, F L: Psychological Assessment Resources, 1987.
91 Poznanski EO, Mokros HB. Children’s Depression Rating Scale-Revised (CDRS-R). Los Angeles: Western Psychological Services, 1999.
92 Luby JL, Heffelfinger A, Koenig-McNaught AL, et al. The Preschool Feelings Checklist: A brief and sensitive measure for depression in young children. J Am Acad Child Adolesc Psychiatry. 2004;43:708-717.
93 Silverman WK, Ollendick TH. Evidence-based assessment of anxiety and its disorders in children and adolescents. J Clin Child Adolesc Psychol. 2005;34:380-411.
94 March JS, Parker JDA, Sullivan K, et al. The Multidimensional Anxiety Scale for Children (MASC): Factor structure, reliability, and validity. J Am Acad Child Adolesc Psychiatry. 1997;36:554-565.
95 Beidel DC, Turner SM, Morris TL. A new inventory to assess childhood social anxiety and phobia: The Social Phobia and Anxiety Inventory for Children. Psychol Assess. 1995;7:73-79.
96 La Greca AM, Stone WL. Social Anxiety Scale for Children-Revised: Factor structure and concurrent validity. J Clin Child Psychol. 1993;22:7-27.
97 La Greca AM, Lopez N. Social anxiety among adolescents: Linkages with peer relations and friendships. J Abnorm Child Psychol. 1998;26:83-94.
98 Reynolds CR, Richmond BO: Revised Children’s Manifest Anxiety Scale: Manual. Los Angeles: Western Psychological Services, 1985.
99 DuPaul GJ, Power TJ, Anastopoulos AD, et al: ADHD Rating Scale-IV-Checklists, Norms, and Clinical Interpretations. New York; Guildford, 1998.
100 Wolraich ML, Lambert W, Doffing MA, et al. Psychometric properties of the Vanderbilt ADHD Diagnostic Parent Rating Scale in a referred population. J Pediatr Psychol. 2003;28:559-567.
101 Collett BR, Ohan JL, Myers KM. Ten-Year Review of Rating Scales. V: Scales Assessing Attention-Deficit/Hyperactivity Disorder. J Am Acad Child Adolesc Psychiatry. 2003;42:1015-1037.
102 American Academy of Pediatrics. Diagnosis and evaluation of the child with attention-deficit/hyperactivity disorder. Pediatrics. 2000;105:1158-1170.
103 Brown RT, Freeman WS, Perrin JM, et al. Prevalence and assessment of attention-deficit/hyperactivity disorder in primary care settings. Pediatrics. 2001;107:e43. (Available at: http://pediatrics.org/cgi/content/full/107/3/e43; accessed 10/18/06)
104 Dulcan M. Practice parameters for the assessment and treatment of children, adolescents, adults with attention-deficit/hyperactivity disorder. American Academy of Child and Adolescent Psychiatry. J Am Acad Child Adolesc Psychiatry. 1997;36(10 Suppl):85S-121S.
105 Ozonoff S, Goodlin-Jones BL, Solomon M. Evidence-based assessment of autism spectrum disorders in children and adolescents. J Clin Child Adolesc Psychol. 2005;34:523-540.
106 Rutter M, LeCouteur A, Lord C. Autism Diagnostic Interview-Revised Manual. Los Angeles: Western Psychological Services, 2003.
107 Lord C, Rutter M, DiLavore PC, et al. Autism Diagnostic Observation Schedule Manual. Los Angeles: Western Psychological Services, 2002.
108 Rutter M, Bailey A, Berument SK, et al. Social Communication Questionnaire (SCQ) Manual. Los Angeles: Western Psychological Services, 2003.
109 Gilliam JE. Gilliam Autism Rating Scale. Austin, TX: PRO-ED, 1995.
110 Schopler E, Reichler R, Renner B. Childhood Autism Rating Scale (CARS). Los Angeles: Western Psychological Services, 1988.
111 Kazak A. Family assessment. In: Ollendick TH, Schroeder CS, editors. Encyclopedia of Clinical Child and Pediatric Psychology. New York: Kluwer Academic/Plenum; 2003:231-232.
112 Touliatos J, Straus M, Perlmutter B. Handbook of family measurement techniques. Thousand Oaks, CA: Sage Publications, 2000.
113 Abidin RR. Parenting Stress Index, 3rd Edition. Manual. Lutz, FL: Psychological Assessment Resources, 1995.
114 Hodges K. Assessment of global functioning. In: Ollendick TH, Schroeder CS, editors. Encyclopedia of Clinical Child and Pediatric Psychology. New York: Kluwer Academic/Plenum; 2003:38-40.
115 Shaffer DM, Gould S, Brasic J, et al. A Children’s Global Assessment Scale (CGAS). Arch Gen Psychiatry. 1983;40:1228-1231.
116 Hodges K. Child and Adolescent Functional Assessment Scale (CAFAS). In: Marnish ME, editor. The Use of Psychological Testing for Treatment Planning and Outcomes Assessment. 2nd ed. Mahwah, NJ: Erlbaum; 1999:631-664.
117 Sparrow SS, Cicchetti DV, Balla DA. Vineland Adaptive Behavior Scales, 2nd ed. Circle Pines, MN: AGS Publishing, 2006.
118 Varni JW, Burwinkle TM, Seid M, et al. The PedsQL™ 4.0 as a pediatric population health measure: feasibility, reliability, and validity. Ambul Pediatr. 2003;3:329-341.
119 American Educational Research Association, American Psychological Association, National Council on Measurement in Education. The Standards for Educational and Psychological Testing. Washington, DC: AERA Publications, 1999. (Available at: http://www.apa.org/science/standards.html;accessed 10/18/06.)
120 Joint Committee on Testing Practices. Code of Fair Testing Practices in Education (Revised). Educational Measurement: Issues and Practice. 2005;2:23-26.
121 Eyde LD, Moreland KL, Robertson GJ. Test User Qualifications: A Data-Based Approach to Promoting Good Test Use. Washington, DC: American Psychological Association, 1988.
122 Turner SM, DeMers ST, Fox HR, et al. APA’s guidelines for test user qualifications: An executive summary. American Psychologist. 2001;56:1099-1113.
123 Spies RA, Plake BS, editors. The Sixteenth Mental Measurements Yearbook. Lincoln: University of Nebraska Press, 2005.
124 Naglieri J, Drasgow F, Schmit M, et al. Psychological testing on the Internet: new problems, old issues. Am Psychol. 2004;59:150-162.
7D. Assessment of Language and Speech
The development of language represents an important accomplishment for young children, allowing them to participate fully in the human community. Language learning progresses rapidly in the toddler and preschool era. At age 1 year, typically developing children are just beginning to understand and produce words. By age 4 to 5 years, they can participate actively in conversations and construct long and complex discussions. The process of language learning proceeds in a predictable and orderly manner for the majority of children. However, the pace is slow and the pattern disordered for many children. The overall prevalence of language disorders at school entry has been estimated at approximately 7%,1 and the overall prevalence of speech disorders, at nearly 4%.2 In view of the pivotal role of language and speech in learning, communication, and social relationships, and because of the high prevalence of disorders, screening for language delays and disorders is appropriate for all children and comprehensive assessments of language and speech is appropriate for those at high risk for delays or disorders.