[level-membership-for-critical-care-medicine-category]
Chapter 89 Scoring Systems for Comparison of Disease Severity in Intensive Care Unit Patients
Scores at ICU admission
2 Which scores are used for assessing the general severity of disease at ICU admission?


3 Why were scores to assess general disease severity at ICU admission developed?
 To assess performance of the ICU. The ICU patient is a medical or a surgical patient who has either acute failure of one major vital function or a high risk for development of such failure. Because the mortality rate of ICU populations is usually high and varies widely depending on patient admission policies, an objective assessment of the patients’ general disease severity is necessary to ensure that the mortality rate in an ICU is consistent with the overall severity of its patient population at admission. The ratio between observed and predicted mortality, called the standardized mortality ratio, is the simplest way to assess the performance of an ICU. It allows comparisons among mortality rates of various ICUs or the mortality rates documented in one ICU over time.


Scores over the ICU stay


11 What did these scores add to the description of ICU patients?
 The use of the OSF score initially showed that a 100% prediction of death could be made in the most severely afflicted patients after several days. However, the same score was eventually used to demonstrate that care in the ICU had improved over the years, so that published results were no longer valid 10 years later. These investigations documented that such scores are a method to assess ICU performance.


Scores at ICU discharge
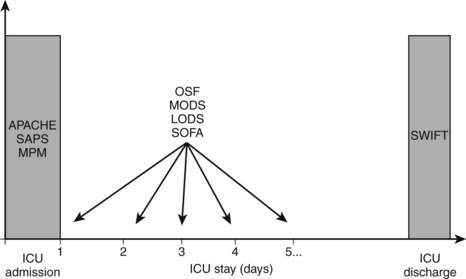
12 At what time of the ICU stay should either of these scores be used? (See Fig. 89-1.)

1 Cook R., Cook D., Tilley J., et al. Multiple organ dysfunction: baseline and serial component scores. Crit Care Med. 2001;29:2046–2050.
2 Fagon J.-Y., Chastre J., Novara A., et al. Characterization of intensive care unit patients using a model based on the presence or absence of organ dysfunctions and/or infection: the ODIN model. Intensive Care Med. 1993;19:137–144.
3 Gajic O., Malinchoc M., Comfere T.B., et al. The Stability and Workload Index for Transfer score predicts unplanned intensive care unit patient readmission: initial development and validation. Crit Care Med. 2008;36:676–682.
4 Higgins T.L., Kramer A.A., Nathanson B.H., et al. Prospective validation of the intensive care unit admission Mortality Probability Model (MPM0-III). Crit Care Med. 2009;37:1619–1623.
5 Higgins T.L., Teres D., Copes W.S., et al. Assessing contemporary intensive care unit outcome: an updated Mortality Probability Admission Model (MPM0-III). Crit Care Med. 2007;35:827–835.
6 Knaus W.A., Draper E.A., Wagner D.P., et al. APACHE II: a severity of disease classification system. Crit Care Med. 1985;13:818–829.
7 Knaus W.A., Draper E.A., Wagner D.P., et al. Prognosis in acute organ-system failure. Ann Surg. 1985;202:685.
8 Knaus W.A., Wagner D.P., Draper E.A., et al. The APACHE III prognostic system: risk prediction of hospital mortality for critically ill hospitalized adults. Chest. 1991;100:1619–1636.
9 Kuzniewicz M.W., Vasilevskis E.E., Lane R., et al. Variation in ICU risk-adjusted mortality: impact of methods of assessment and potential confounders. Chest. 2008;133:1319–1327.
10 Le Gall J.R., Klar J., Lemeshow S., et al. The Logistic Organ Dysfunction system: a new way to assess organ dysfunction in the intensive care unit. JAMA. 1996;276:802–810.
11 Le Gall J.R., Lemeshow S., Saulnier F. A new Simplified Acute Physiology Score (SAPS II) based on a European/North American multicenter study. JAMA. 1993;270:2957–2963.
12 Lemeshow S., Teres D., Klar J., et al. Mortality Probability Models (MPM II) based on an international cohort of intensive care unit patients. JAMA. 1993;270:2478–2486.
13 Marshall J.C., Cook D.J., Christou N.V., et al. Multiple organ dysfunction score: a reliable descriptor of a complex clinical outcome. Crit Care Med. 1995;23:1638–1652.
14 Metnitz P.G., Lang T., Valentin A., et al. Evaluation of the logistic organ dysfunction system for the assessment of organ dysfunction and mortality in critically ill patients. Intensive Care Med. 2001;27:992–998.
15 Moreno R.P., Metnitz P.G., Almeida E., et al. SAPS 3—from evaluation of the patient to evaluation of the intensive care unit. Part 2. Development of a prognostic model for hospital mortality at ICU admission. Intensive Care Med. 2005;31:1345–1355.
16 Moreno R., Vincent J.L., Matos A., et al. The use of maximum SOFA score to quantify organ failure/dysfunction in intensive care: result of a prospective multicenter study. Intensive Care Med. 1999;25:686–696.
17 Vincent J.L., de Mendonca A., Cantraine F., et al. Use of the SOFA score to assess the incidence of organ dysfunction/failure in intensive care units: results of a multicenter, prospective study. Crit Care Med. 1998;26:1793–1800.
18 Zimmerman J.E., Kramer A.A., McNair D.S., et al. Acute Physiology and Chronic Health Evaluation (APACHE) IV: hospital mortality assessment for today’s critically ill patients. Crit Care Med. 2006;34:1297–1310.
[/level-membership-for-critical-care-medicine-category][not-level-membership-for-critical-care-medicine-category]
Chapter 89 Scoring Systems for Comparison of Disease Severity in Intensive Care Unit Patients
Scores at ICU admission
2 Which scores are used for assessing the general severity of disease at ICU admission?
3 Why were scores to assess general disease severity at ICU admission developed?
To assess performance of the ICU. The ICU patient is a medical or a surgical patient who has either acute failure of one major vital function or a high risk for development of such failure. Because the mortality rate of ICU populations is usually high and varies widely depending on patient admission policies, an objective assessment of the patients’ general disease severity is necessary to ensure that the mortality rate in an ICU is consistent with the overall severity of its patient population at admission. The ratio between observed and predicted mortality, called the standardized mortality ratio, is the simplest way to assess the performance of an ICU. It allows comparisons among mortality rates of various ICUs or the mortality rates documented in one ICU over time.
