91 Resuscitation from Circulatory Shock
 Understanding Underlying Pathophysiology of Global Flow and Oxygen Delivery
Addressing Global Adequacy of Tissue Oxygenation
Adequacy of tissue oxygenation is defined as an adapted oxygen supply (or DO2) to oxygen demand.1 Oxygen demand varies according to tissue type and according to time. Although oxygen demand cannot be measured or calculated, oxygen uptake or consumption ( ) and DO2 both can be quantified; they are linked by a simple relationship:
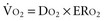
where ERO2 represents oxygen extraction ratio (ERO2 in %;  and DO2 in mL O2/kg/min). DO2 represents the total flow of oxygen in the arterial blood and is given as the product of cardiac output (
 ) by arterial oxygen content (CaO2):

with CaO2 being the product of hemoglobin (Hb, g/100 mL) by arterial oxygen saturation (SaO2, %) and Hb O2 capacity (1.39 mL O2/g Hb): CaO2 = Hb × SaO2 × 1.39.
 (≈2.4 mL O2/kg/min for a 12 mL O2/kg/min D
 : D
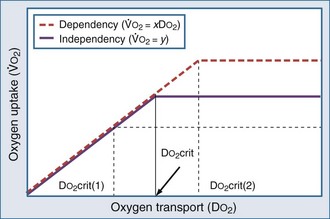
: DDuring circulatory shock and/or severe hypoxemia, as DO2 declines secondary to a decrease in  and/or a decrease in CaO2,
  can be maintained by a compensatory increase in ERO2,
  and DO2 remaining therefore independent. But as DO2 falls further, a critical point (DO2 crit) is reached; ERO2 can no longer compensate for this fall in DO2, and at this critical level,
  becomes DO2 dependent (Figure 91-1). At this DO2 crit (4 mL/kg/min), for a
  of about 2.4 mL/kg/min, ERO2 reaches its critical point (ERO2 crit) of 60%. When
  is higher, DO2 crit is higher as well. Increase in oxygen extraction occurs via two fundamental adaptive mechanisms2: (1) redistribution of blood flow among organs via an increase in sympathetic adrenergic tone and central vascular contraction (this is responsible for a decreased perfusion in organs with low ERO2, such as the skin and splanchnic area, and a maintained perfusion in organs with high ERO2, such as heart and brain); and (2) capillary recruitment within organs responsible for peripheral vasodilation (opposite to central vasoconstriction).
 )-to-O2 supply (D
 is supply independent (“independency”) following the relation
  = y, whole body O2 needs are met. When
  becomes D
 = x D
= x D starts to be linearly dependent on D
 is decreased (e.g., by rest, sedation, hypothermia), the D
 (e.g., by increased muscle activity, awakening, hyperthermia, sepsis) is associated with increased D
Using Mixed Venous Oxygen Saturation to Assess Adequacy of Global Tissue Oxygenation
 -to-D
-to-D is proportional to cardiac output:
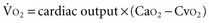
where CvO2 is mixed venous blood oxygen content. To some extent,  is approximately equal to cardiac output × (SaO2 − SvO2) × Hb × 1.39, and SvO2 is approximately equal to SaO2 −
  /(
/( × Hb × 1.39).
Four situations can be responsible for a decrease in SvO2: a decrease in SaO2 (hypoxemia), in Hb (anemia) or in cardiac output, or an increase in  (like in exercise). At DO2 crit, SvO2 is about 40% (SvO2 crit) with an ERO2 of 60% and a SaO2 of 100%. This SvO2 crit has been identified in humans.3 It is important to emphasize that for the same decrease in CaO2 (induced by a decrease of Hb or SaO2), the decrease in SvO2 will be more pronounced if cardiac output cannot adapt. Hence, SvO2 represents adequacy of global flow to CaO2 decrease. A 40% SvO2 can be taken as an imbalance between arterial blood oxygen supply and tissue oxygen demand with evident risk of dysoxia. In the clinical setting, a decrease of SvO2 of 5% from its normal value (77%-65%) is representative of a significant fall in DO2 and/or an increase in oxygen demand (Figure 91-2). If initial probabilistic treatment (fluid resuscitation and/or low-dose inotropes and/or red blood cell transfusion) does not allow SvO2 to be restored to a minimal 65%, Hb, SaO2, and cardiac output should then be individually measured to introduce the appropriate treatment.
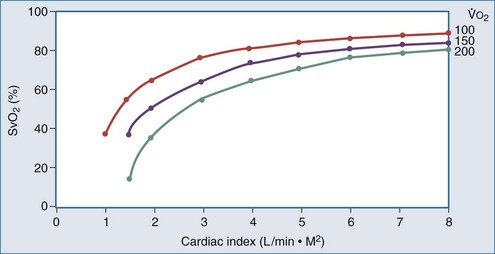
 ) is constant, CI variations lead to large variations in Sv
 .
.Assessing Global Flow
During circulatory shock,  -to-DO2 dependency with a rise in blood lactate levels implies oxygen debt. Several authors have reported that oxygen debt is related to the likelihood of multiple organ failure and mortality in postoperative or polytrauma patients.4,5 Patients who survive multiple organ failure have been shown to have higher cardiac index, lower SVR, higher
  , and higher SvO2 than nonsurvivors.6,7 Rixen and Siegel5 demonstrated that the degree of tissue oxygen debt is related to an enhanced inflammatory response, associated with an increased risk of acute respiratory distress syndrome and higher mortality rates.
Recent research has emphasized the potential interest of central venous oxygen saturation (ScvO2) for detecting global oxygenation impairment.7 Experimental studies reported that changes in SvO2 and ScvO2 closely reflect circulatory disturbances during periods of hypoxia, hemorrhage, and subsequent resuscitation (ScvO2 being approximately 5% higher than SvO2 in the critically ill). Fluctuations in these two parameters correlated relatively well, although absolute values differed.8 Finally, observational data found ScvO2 to be a useful parameter in detecting occult tissue hypoperfusion in both sepsis and cardiac failure.9,10 An important feature with ScvO2 monitoring is that ScvO2 can be continuously provided by central venous catheters equipped with optic fibers (e.g., PreSep oximetry catheter [Edwards Lifesciences, Irvine, California]). In initial resuscitation of circulatory shock, insertion of a central venous catheter is a standard, rapid, and easy approach, much easier than any other invasive hemodynamic monitoring, especially in patients who are not yet sedated, intubated, and ventilated.
In a landmark trial by Rivers et al., patients with severe sepsis and septic shock admitted to the emergency department were randomized to standard therapy (n = 133) or to early goal-directed therapy (n = 130) targeted to achieve a central ScvO2 of greater than 70%.11 Standard therapy included antibiotics, fluid resuscitation, and vasoactive drugs to achieve a central venous pressure between 8 and 12 mm Hg, MAP greater than 65 mm Hg, and urine output greater than 0.5 mL/kg/h. Patients in the early goal-directed therapy group, in addition to the standard goals, had to reach an ScvO2 of greater than 70% by optimizing fluid administration, hematocrit above 30%, and/or prescription of an inotrope (dobutamine < 20 µg/kg/min). Initial ScvO2 in both groups was quite low (49 ± 12%), confirming that severe sepsis is hypodynamic before any fluid resuscitation has started. This study demonstrated a significant reduction in hospital mortality: 30.5% in the early goal-directed therapy group compared with 46.5% in the standard therapy group (P = .009). An important point in this study is that 99.2% of patients receiving early goal-directed therapy achieved their hemodynamic goals within the first 6 hours, compared with 86% of those receiving standard therapy. From the first to the 72nd hour, total fluid loading was not different between the two groups (approximately 13,400 mL); in contrast, from the first to the seventh hour, the amount of fluid received was significantly larger in the early goal-directed therapy patients (approximately 5000 mL versus 3500 mL). In the follow-up period between the seventh and the 72nd hour, in patients receiving early goal-directed therapy, mean ScvO2 was higher (70.6 ± 10.7% versus 65.3 ± 11.4%; P = .02), mean arterial pH was higher (7.40 ± 0.12 versus 7.36 ± 0.12; P = .02), and lactate plasma levels were lower (3.0 ± 4.4 mmol/L versus 3.9 ± 4.4 mmol/L; P = .02), as was base excess (2.0 ± 6.6 mmol/L versus 5.1 ± 6.7 mmol/L; P = .02). The multiple organ failure score was significantly altered in patients receiving standard therapy when compared with early goal-directed therapy patients. This was the first study demonstrating that early identification of patients with sepsis, associated with early initiation of goal-directed therapy to achieve adequate tissue oxygenation by O2 delivery (ScvO2 monitoring), significantly improves mortality rates.11 This study was then supported by more than 10 following trials,12 and further multicentric prospective studies are under way.
 Deciding Diagnostic and Treatment Strategy
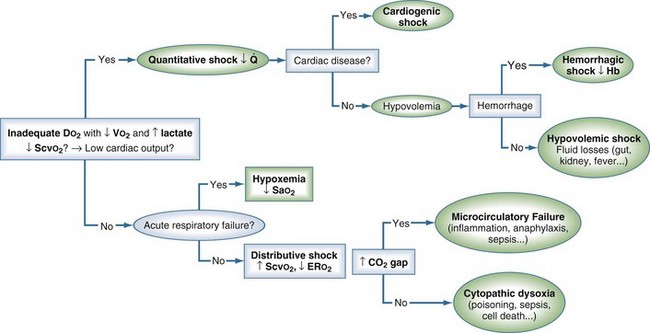
Treatment strategy relies on shock definition (dysoxia) and starts with an early and rapid estimation of O2 deficit, rapidly followed by an early probabilistic treatment (Figure 91-3). The response to this early probabilistic treatment (modification of lactate, arterial pH, ScvO2 or SvO2) then suggests which complementary investigation should be conducted (e.g., echocardiography, esophageal Doppler, computed tomography [CT] scan) and which type of monitoring should be installed (e.g., invasive systolic arterial blood pressure variations, noninvasive or invasive assessment of cardiac output), which will help refine the diagnosis and optimize treatment.
 , cardiac output;
  , O2 uptake.
Diagnosing Shock Type
Quantitative Shock (Decreased DO2)
Distributive Shock (Decreased ERO2)
This type of shock is linked to:
Distributive shock may coexist with hypovolemic and/or cardiogenic shock. Because decreased ERO2 is present, an elevated SvO2 or ScvO2 does not preclude that tissue hypoperfusion no longer exists. It is nevertheless possible to further detect abnormalities in tissue perfusion through bedside microcirculatory exploration or by using the central venous-to-arterial carbon dioxide difference P(cv-a)CO2 (central venous PCO2 as a surrogate for mixed venous PCO2).14 Central venous-to-arterial PCO2 above 6 mm Hg can help in detecting septic shock patients who currently may remain inadequately resuscitated even though an ScvO2 above 70% has been reached. In these patients, when compared to those who presented with a P(cv-a)CO2 below 6 mm Hg, cardiac index was much smaller (2.7 ± 0.6 L/min/m2 versus 4.3 ± 1.6 L/min/m2), lactate concentration remained higher (7.5 ± 3.7 versus 5.6 ± 3.6 mmol/L), and organ failure score was about to increase over a 24-hour time period. These results support the concept that hemodynamics required further optimization in these patients with impaired ERO2, and that targeting a P(cv-a)CO2 less than 6 mm Hg could be used as a complementary tool to do so (see Figure 91-3).
Choosing Appropriate Monitoring
A Swan-Ganz catheter (with continuous cardiac output and SvO2 monitoring) and/or any noninvasive flow assessment (transesophageal echography, esophageal Doppler echography) is recommended when optimized cardiac output is doubtful. This requires that some preliminary cardiorespiratory stability has been obtained. In that context, fluid administration should be continued (the heart is preload dependent) until cardiac output increases no further (becomes preload independent). When cardiac output is insufficient to maintain MAP or urine output, when SvO2 remains low, or when lactate concentration remains elevated, an inotrope should be given. Cardiac echography must be performed in the context of congestive heart failure and/or myocardial ischemia to diagnose ventricular or valvular dysfunction. In the sedated, intubated, and ventilated patient, recordings of systolic pressure variation or pulse pressure variation can be helpful: the heart remains preload dependent until systolic pressure variation is smaller than 10 mm Hg or pulse pressure variation is less than 10%, or both.15 Arrhythmia and tidal volume below 7 mL/kg limit this type of evaluation.
 Therapeutic Principles: Symptomatic and Etiologic Treatments
Symptomatic Treatment
Fluid loading is the first step in treatment, and its first goal is to optimize left ventricular preload to improve DO2 by increasing cardiac output.16 There is, however, an associated risk of interstitial edema, in particular pulmonary edema. Unless the patient has an acute lung injury, fluid loading aims at maximizing cardiac output16 according to the Frank-Starling relationship, decreased lung gas exchange being detected by a decrease in SaO2 (or by a decrease in its surrogate, pulse oximetry).
Swan-Ganz catheter–derived pulmonary artery occlusion pressure has long been the most used static clinical variable for guiding fluid infusion. In septic shock, it was accepted that maximal cardiac output was obtained for values between 12 and 15 mm Hg.17 To better estimate left ventricular preload, left ventricular end-diastolic surface has now been proposed. In fact, in the sedated, intubated, and ventilated patient, ventilatory-induced systolic pressure variation predicts increased systolic ejection volume to fluid loading much better than pulmonary artery occlusion pressure.18
Synthetic colloids are first-line agents. They may induce less pulmonary edema than crystalloids, especially in patients in septic shock. Crystalloids are recommended as first-line agents during anaphylactic shock. Normalization of hemoglobin concentration, [Hb], by red blood cell transfusion is not required. However, a [Hb] between 8 and 10 g/dL16 might be preferred in patients with severe sepsis and/or coronary disease and/or decreased cardiac contractility. In those latter cases, decreased [Hb] is not compensated by increased cardiac output, and DO2 crit is reached more rapidly. In each case targeting a ScvO2 larger than 70% may be a helpful guide for transfusion.19
Catecholamines help in restoring perfusion pressure and maintaining cardiac output, thus allowing sufficient DO2; this should allow regional flow distribution and improved ERO2. All catecholamines are inotropes; they can be divided into (1) inodilators when they combine inotropic and vasodilatory properties (low-dose dopamine, any dose of dobutamine or dopexamine); or (2) inoconstrictors when they combine inotropic and vasoconstricting properties (high-dose dopamine, any dose of epinephrine or norepinephrine). Inodilators increase flow; inoconstrictors increase perfusion pressure. Because of variable individual sensitivity to catecholamines, dose titration is strongly recommended.17 More potent vasopressors such as vasopressin have been tested with conflicting results, in particular as regards regional circulation. More recently, in a large multicenter, randomized, double-blind trial, vasopressin showed no benefit as a first-line vasopressor in comparison to norepinephrine in septic shock.20 It is important to emphasize that a rise in blood pressure may not be a surrogate of clinical benefit. Indeed, in a large placebo-controlled clinical trial, administration of the nonselective nitric oxide inhibitor, NG-methyl-L-arginine, in septic shock produced both significant increases in blood pressure and significant increases in mortality.21
In septic shock, several studies demonstrated that increasing MAP from 65 to 85 mm Hg was associated with no difference in organ perfusion variables.16 Because increasing blood pressure through vasoconstriction may be associated with a decrease in flow, a tradeoff may exist between raising blood pressure and decreasing cardiac index that will vary depending on the specific vasopressor or combined inotrope/vasopressor.17 Applying such principles for symptomatic treatment in septic shock patients has resulted in decreasing unadjusted hospital mortality from 37% to 31% over 2 years (P = .001). The adjusted odds ratio for mortality improved the longer a site was involved in the Surviving Sepsis Campaign, resulting in an adjusted absolute drop of 0.8% per quarter and 5.4% over 2 years (95% CI, 2.5%-8.4%).22
Other Therapeutic Principles
The importance of correction of metabolic acidosis and the use of intravenous bicarbonate for shock-induced anion gap acidosis have been overemphasized in the past. Indeed, clinical studies, including one randomized, prospective trial, failed to show any hemodynamic benefit from bicarbonate therapy either to increase cardiac output or to decrease vasopressor requirements, regardless of the degree of acidemia. Cardiac function does not appear to be significantly decreased when the arterial pH remains higher than 7.00. Bicarbonate infusion, apart from renal or digestive losses, is therefore not recommended unless the patient has hyperkalemia.23
In patients with septic shock, stress-dose (low-dose) steroid therapy (hydrocortisone 200 mg/day) needs to be considered, especially if the decrease in blood pressure requires high or increasing concentrations of vasopressors, once appropriate antibiotics are being given or the infectious site is controlled.16 Steroid therapy may be weaned once vasopressors are no longer required. Beyond 72 hours, absence of any hemodynamic improvement suggests the hydrocortisone treatment is futile.
Although not oriented toward better circulatory efficacy, a number of treatments are essential in septic shock.16 Control of the infectious source is essential. Empirical or probabilistic antibiotics must be directed against gram-negative microorganisms but also against potentially resistant pathogens. This justifies double or sometimes triple antibiotherapy. It theoretically offers the following advantages: widening of the spectrum of activity, antibacterial synergy, increased bactericidal speed, and decreased risk for emergent resistant germs.
 Prognosis
The main prognostic factors for circulatory shock are the number of organ failures present on admission, the delay to start of treatment, and the response to symptomatic treatment. In cases of septic shock, control of the infectious source and its sensitivity to medical and surgical treatment is essential. The early timing of goal-directed therapy certainly influences the severity of multiple organ failure and the prognosis. This point has been clearly demonstrated by the recent trial and earlier studies from Rivers and his colleagues.9–12
Key Points
Dellinger RP, Levy MM, Carlet JM, Bion J, Parker MM, Jaeschke R, et al. Surviving Sepsis Campaign: international guidelines for management of severe sepsis and septic shock: 2008. Intensive Care Med. 2008;34:17-60.
Levy MM, Dellinger RP, Townsend SR, Linde-Zwirble WT, Marshall JC, Bion J, et al. The Surviving Sepsis Campaign: results of an international guideline-based performance improvement program targeting severe sepsis. Intensive Care Med. 2010;36:222-231.
Michard F, Boussat S, Chemla D, Anguel N, Mercat A, Lecarpentier Y, et al. Relation between respiratory changes in arterial pulse pressure and fluid responsiveness in septic patients with acute circulatory failure. Am J Respir Crit Care Med. 2000;162:134-138.
Rivers E, Nguyen B, Havstad S, Ressler J, Muzzin A, Knoblich B, et al. Early goal-directed therapy in the treatment of severe sepsis and septic shock. N Engl J Med. 2001;345:1368-1377.
Vallée F, Vallet B, Mathe O, Parraguette J, Mari A, Silva S, et al. Central venous-to-arterial carbon dioxide difference: an additional target for goal-directed therapy in septic shock? Intensive Care Med. 2008;34:2218-2225.
1 Vallet B, Tavernier B, Lund N. Assessment of tissue oxygenation in the critically ill. Eur J Anaesth. 2000;17:1-10.
2 Vallet B. Vascular reactivity and tissue oxygenation. Intensive Care Med. 1998;24:3-11.
3 Ronco JJ, Fenwick JC, Tweeddale MG, et al. Identification of the critical oxygen delivery for anaerobic metabolism in critically ill septic and nonseptic humans. JAMA. 1993;270:1724-1730.
4 Shoemaker WC, Appel PL, Kram HB. Tissue oxygen debt as a determinant of lethal and nonlethal postoperative organ failure. Crit Care Med. 1988;16:1117-1120.
5 Rixen D, Siegel JH. Metabolic correlates of oxygen debt predict posttrauma early acute respiratory distress syndrome and the related cytokine response. J Trauma. 2000;49:392-403.
6 Shoemaker WC, Appel PL, Kram HB, et al. Hemodynamic and oxygen transport monitoring to titrate therapy in septic shock. New Horiz. 1993;1:145-159.
7 Rady MY, Rivers EP, Martin GB, et al. Continuous central venous oximetry and shock index in the emergency department: Use in the evaluation of clinical shock. Am J Emerg Med. 1999;10:538-541.
8 Dueck MH, Klimek M, Appenrodt S, Weigand C, Boerner U. Trends but not individual values of central venous oxygen saturation agree with mixed venous oxygen saturation during varying hemodynamic conditions. Anesthesiology. 2005;103:249-257.
9 Ander DS, Jaggi M, Rivers E, et al. Undetected cardiogenic shock in patients with congestive heart failure presenting to the emergency department. Am J Cardiol. 1998;82:888-891.
10 Rady MY, Rivers EP, Nowak RM. Resuscitation of the critically ill in the ED: Responses of blood pressure, heart rate, shock index, central venous oxygen saturation, and lactate. Am J Emerg Med. 1996;14:218-225.
11 Rivers E, Nguyen B, Havstad S, et al. Early goal-directed therapy in the treatment of severe sepsis and septic shock. N Engl J Med. 2001;345:1368-1377.
12 Rivers EP, Coba V, Whitmill M. Early goal-directed therapy in severe sepsis and septic shock: a contemporary review of the literature. Curr Opin Anaesthesiol. 2008;21:128-140.
13 Fink MP. Bench-to-bedside review: Cytopathic hypoxia. Crit Care. 2002;6:491-499.
14 Vallée F, Vallet B, Mathe O, Parraguette J, Mari A, Silva S, et al. Central venous-to-arterial carbon dioxide difference: an additional target for goal-directed therapy in septic shock? Intensive Care Med. 2008;34:2218-2225.
15 Michard F, Boussat S, Chemla D, et al. Relation between respiratory changes in arterial pulse pressure and fluid responsiveness in septic patients with acute circulatory failure. Am J Respir Crit Care Med. 2000;162:134-138.
16 Dellinger RP, Levy MM, Carlet JM, et al. Surviving Sepsis Campaign: international guidelines for management of severe sepsis and septic shock: 2008. Intensive Care Med. 2008;34:17-60.
17 Dellinger RP. Cardiovascular management of septic shock. Crit Care Med. 2003;31:916-955.
18 Tavernier B, Makhotine O, Lebuffe G, et al. Systolic pressure variation as a guide to fluid therapy in patients with sepsis-induced hypotension. Anesthesiology. 1998;89:1313-1321.
19 Vallet B, Robin E, Lebuffe G. Venous oxygen saturation as a physiologic transfusion trigger. Critical Care. 2010;14:213.
20 James A, Russell JA, Walley KR, Singer J, et al. Vasopressin versus norepinephrine infusion in patients with septic shock. N Engl J Med. 2008;358:877-887.
21 Lopez A, Lorente JA, Steingrub J, et al. Multiple-center, randomized, placebo-controlled, double-blind study of the nitric oxide synthase inhibitor 546C88: Effect on survival in patients with septic shock. Crit Care Med. 2004;32:21-30.
22 Levy MM, Dellinger RP, Townsend SR, et al. The Surviving Sepsis Campaign: results of an international guideline-based performance improvement program targeting severe sepsis. Intensive Care Med. 2010;36:222-231.
23 Forsythe SM, Schmidt GA. Sodium bicarbonate for the treatment of lactic acidosis. Chest. 2000;117:260-267.
