[level-membership-for-critical-care-medicine-category]
46 Respiratory System Mechanics and Respiratory Muscle Function
Classic respiratory mechanics are based on Newtonian physics, as expressed in the equation of motion. The respiratory system model is derived from an elementary monodimensional system, as depicted by a block with an attached spring, acted on by a unidirectional force (Figure 46-1, A).1,2 Upon application of force, the response of the system can be characterized in terms of displacement, velocity, and acceleration of a block with a mass of M. The balance of forces acting on the block can be expressed as follows:
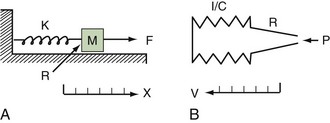
where the total force applied to the system (Fappl) at a given time (t) is equal to the sum of the elastic (Fel), resistive (Fres), and inertial (Fin) forces.
The equation of motion for a three-dimensional pneumatic system may be written as:
where P(t) is the pressure exerted on the system at a given time; E is the elastance (the reciprocal of compliance, i.e., 1/C), which relates pressure to volume (V), and R is the resistance constant, relating pressure to flow. The third term of the equation describes the pressure required to accelerate tissue and gas in the airway, which is an important factor under certain circumstances such as coughing or high-frequency oscillatory ventilation. The inertance constant (I) relates pressure to linear acceleration ( ). However, the third term is usually omitted in this model of the respiratory system, because inertive forces are negligible during quiet breathing and most forms of mechanical ventilation.3 Thus, in most applications, the respiratory system derivative of the equation of motion considers only the elastic and flow-resistive elements that oppose an applied pressure at time (t):
which may also be expressed as:
In this model, any force applied to the respiratory system is either stored as elastic energy or dissipated as resistive energy. Figure 46-1, B shows a three-dimensional model of the respiratory system as it relates to the equation of motion.
 Static Behavior of the Respiratory System

An esophageal balloon catheter can be used to approximate pleural pressure, keeping in mind that pleural pressure is nonuniform and that topographic gradients in pleural pressure vary with posture.4 In the recumbent posture, there is no site in the esophagus at which local pressure approximates average lung surface pressure (i.e., average pleural pressure). However, at least in normal lungs, the average change in surface or pleural pressure can be inferred using esophageal manometry.

By assuming that Pbs is considered to be zero:
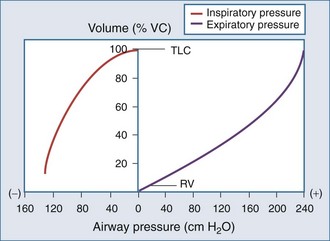
The static respiratory system pressure-volume (P-V) curve is often measured in intubated, mechanically ventilated patients to make inferences about the mechanical properties of the lungs. Although the utility of P-V measurements in clinical decision making remains to be established, the determinants of the P-V relationship should nevertheless be understood. The P-V curve is generated by inflating and deflating the relaxed respiratory system in a stepwise fashion between residual volume and total lung capacity. The airway occlusion pressure at each volume defines the corresponding elastic recoil pressures of the lungs and chest wall. Because the inflation and deflation relationships differ from each other, the resulting curve is often referred to as a P-V loop. The respiratory system P-V loop is the summation of individual lung and chest wall P-V loops, termed a Rahn diagram (Figure 46-2). Because during normal tidal volume breathing (30% to 70% vital capacity), the relationship between elastic pressure and volume is essentially linear, the system’s elastic properties can be defined by a constant, namely elastance. The term compliance is more frequently used and is simply the inverse of elastance, defined as the change in volume per unit change in applied pressure. Static respiratory system compliance can be determined by the slope of the P-V curve. In the quiet breathing range, the normal respiratory system elastance averages 8 to10 cm H2O/L, corresponding to a static respiratory system compliance of 0.12 to 0.1 L/cm H2O.
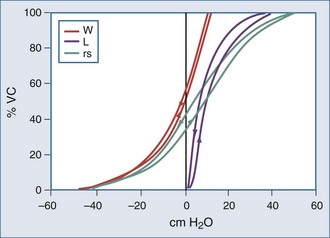
Figure 46-2 shows the P-V curves of the respiratory system’s component structures, the lung and chest wall. At high lung volumes, the total respiratory system compliance is reduced (the P-V curve is concave to the pressure axis), primarily because the lung reaches total capacity, its structural limit. In contrast, the P-V curve of the chest wall remains linear at high volumes (i.e., the chest wall offers much less resistance to further lung expansion).
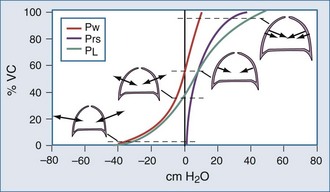
At low lung volumes, a decrease in chest wall compliance is the major contributor to low respiratory system compliance. At relaxation volume (functional residual capacity), the inward recoil of the lung is equal to the outward recoil of the chest wall, so that alveolar pressure is atmospheric. At a volume of 60% of vital capacity, the chest wall reaches a “resting” position, that is, it exerts no force on the lungs, and the pleural pressure is atmospheric. In the normal tidal breathing range, the slopes of the lung and chest wall P-V curves are similar (i.e., lung and chest wall contribute about equally to overall respiratory system compliance). Figure 46-3 shows the volume dependence of the inwardly and outwardly directed forces of the respiratory system during inflation.4
Surface forces (i.e., surface tension) are generated because liquid molecules in contact with air attempt to conserve energy by decreasing the area available for interaction. In the lung, the resulting force acts parallel to the alveolar septa and balances a helical fiber network that supports alveolar ducts and forms alveolar entrance rings.6
As demonstrated in Figure 46-4, the elimination of surface tension has two important consequences on lung mechanics7:
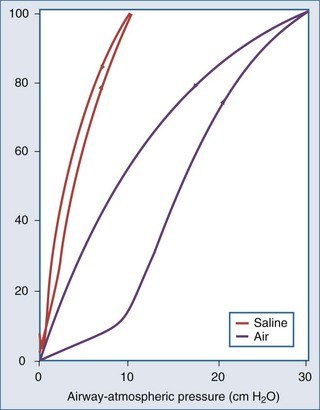
In the normal lung, hysteresis is caused by volume- and time-dependent changes in the molecular composition and hence the biophysical properties of surfactant. Surfactant is a protein-enriched lipid film that coats air-liquid interfaces in distal lung units and lowers surface tension. Hysteresis implies that energy added to the system during inflation is not fully recovered during deflation. The hysteretic loss of energy does not scale with frequency and flow the way a Newtonian viscous resistance does, underscoring one of the many limitations of linear resistance-compliance circuits in modeling lung mechanics.8 Whereas interfacial phenomena are the primary source of hysteresis in the normal lung, alveolar recruitment and derecruitment are important sources of hysteresis in disease.

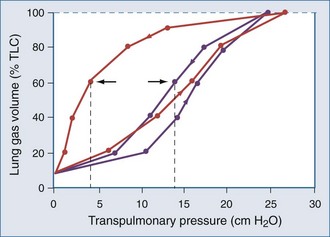
Applied to the lung, this means that changes in alveolar dimensions at low lung volumes would promote alveolar collapse were it not for surfactant’s surface tension–lowering properties. A surfactant-depleted lung exhibits alveolar instability and collapse in the tidal breathing range. In normal pigs, high-tidal-volume ventilation does not alter alveolar mechanics in the normal lung; however, in the surfactant-deactivated lung, it causes alveolar overdistension and exacerbates alveolar instability.9 Figure 46-5 shows a pressure-volume loop of a normal lung and a surfactant-depleted lung. As a consequence of surfactant depletion, larger than normal transpulmonary pressures are required to keep the surfactant-depleted lung inflated.
 Dynamic Behavior of the Respiratory System
According to Ohm’s law, resistance (R) can be calculated by dividing the driving pressure by flow:
Total pulmonary resistance reflects the gas flow–dependent pressure dissipation in the conducting airways (airway resistance) and the frequency-dependent loss of energy associated with parenchymal deformation (tissue resistance). Originally considered only a minor component of total pulmonary resistance, it is now appreciated that the so-called tissue resistance dominates the measurement, at least at low frequencies.10 As outlined by Fredberg and Stamenovic,8 tissue resistance and tissue hysteretic properties are model-specific descriptors of energy loss, the structural and molecular basis of which remains uncertain.11
These determinants can be captured by Reynold’s number, a quantity that represents the ratio of inertial forces to viscous forces.12 A low Reynold’s number (<50) corresponds to laminar flow, and a Reynold’s number greater than 2300 is associated with turbulent flow. Accordingly, the low gas velocity in peripheral airways favors laminar flow, and the acceleration associated with the decrease in total cross-sectional area in central airways promotes turbulence.
where ΔP is the pressure drop, L is the length of pipe, µ is the dynamic viscosity, Q is the volumetric flow rate, r is the radius, and π is the mathematical constant (approximately 3.141592654). In contrast, turbulent flow is associated with nonlinear pressure-flow relationships that are gas-density dependent. The density dependence of turbulent flow is occasionally exploited in the medical use of heliox, a low-density helium-oxygen mixture given to patients with central airway lesions or asthma.13 However, the available clinical data on inhaled He/O2 mixtures are insufficient to prove that this therapy has benefit with respect to outcome variables.14
The flow-dependent shift from laminar to turbulent flow is captured in the Rohrer equation:
where K1 and K2 are constants that scale frictional pressure dissipation associated with laminar and turbulent flow, respectively.
A second mechanism of pressure loss during gas flow is related to the Bernoulli principle, which describes convective pressure dissipation. That is, as a gas flows from a large cross-sectional area to a smaller area, velocity must increase to maintain flow. This results in energy dissipation and a drop in pressure and correlates to expiratory flow of gas from the bronchioles to the central airways. As mentioned previously, ohmic resistance can be computed by dividing resistive pressure by inspiratory flow (see Equation 13).
The respiratory time constant (τ) is the time required for the lung to fill or passively discharge approximately 63% of its contents. It can be determined from the slope of the passive expiratory flow-volume curve (Figure 46-6) or calculated directly by the equation:
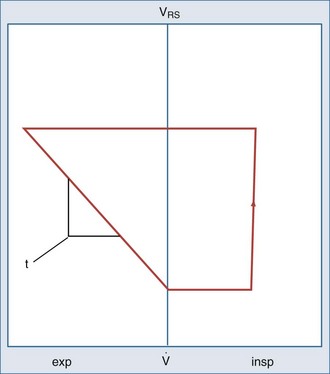
 flow; VRS, volume of respiratory system.
where τ is usually measured in seconds because respiratory system resistance (Rrs) is expressed in units of pressure × time × volume−1, and respiratory system compliance (Crs) is expressed in units of volume × pressure−1.
The value of τ for a normal respiratory system is approximately 0.3 second.3 As can be inferred from the equation, patients with high respiratory system resistance or compliance, such as those with chronic obstructive lung disease (COPD), have correspondingly large τ values.
The added resistance of the artificial tubing in a mechanically ventilated patient may increase τ to 1 second or more. In addition, in patients with even minimally elevated τ values, the expiratory time (depending on the preset inspiratory time in time cycled ventilatory support or from the expiratory threshold in a flow cycled ventilatory mode15) may not be enough to fully empty the lungs during mechanical ventilation. Consequently, the demand for expiratory flow is not met as the lungs near relaxation volume, resulting in dynamic hyperinflation even in healthy lungs at high rates of respiratory frequency.
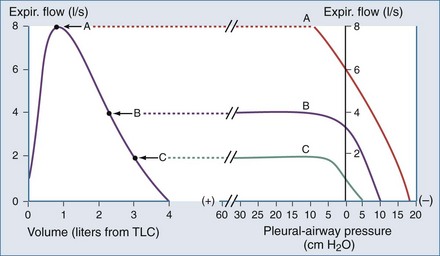
Another important concept that explains the dynamic behavior of the respiratory system is shown in Figure 46-7. Higher lung volumes (curve A) yield higher expiratory flow rates compared with the flow seen at lower lung volumes (curve C). In a classic set of experiments performed on normal subjects, Fry and Hyatt demonstrated that maximal expiratory flow is determined by lung volume.16 They concluded that on the basis of volume-related dynamic airway collapse, expiratory flow plateau cannot be exceeded irrespective of the magnitude of subject effort or applied transpulmonary pressure. Herein lies the value of the forced vital capacity maneuver as a reproducible measure of maximal expiratory flow.
 Assessment of Respiratory System Mechanics in the Intensive Care Unit
Assuming constant flow in a relaxed or paralyzed patient without respiratory muscle contribution, pressure at the ventilator inlet increases linearly with time and volume to a peak. A typical simplified waveform output is demonstrated by Figure 46-8, with a model of the system represented on the right. Pressures are measured at the ventilator inlet or at the airway opening at the level of the “Y” connection. Assuming inflation onset with a constant (square wave) flow, an initial step change in driving pressure is recorded, which precedes alveolar filling and corresponds to resistive pressure related to gas flow in the airways (see Figure 46-8, dotted arrow). When making an end-inspiration airway occlusion after a rapid initial step-off in resistive pressure drop (Pmax–P1), there is then a gradual decrease in pressure to a plateau value (P2) (see Figure 46-8, full thick arrows). This pressure, usually reached after 3 seconds of end-inspiratory occlusion, indicates the true static end-inspiratory elastic recoil pressure of the total respiratory system (Pst,rs)17–18 and represents the static summation of elastic recoil forces corresponding to the applied tidal volume. During this period, the contribution in reduction in pressure due to volume loss by continuing gas exchange should be negligible.
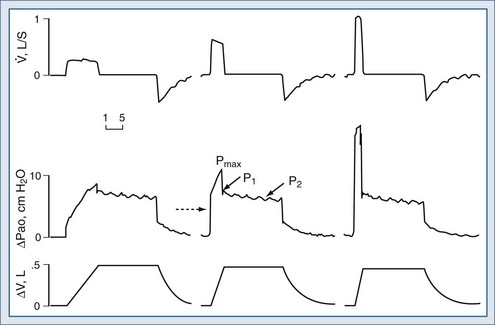
The initial drop in Pmax, namely P1 divided by the preceding steady flow, provides the so-called ohmic resistances (Rmin,rs). Rmin,rs increases linearly with flow according to the Rohrer equation. The slow decrease of pressure (P1 − P2) divided by the preceding steady flow yields the effective additional resistance (ΔRs) due to the viscoelastic properties of the thoracic tissues and time constant inequalities within the lung and the chest wall (so-called pendelluft).19 The sum of Rmin,rs and ΔRs is defined as Rmax.rs.20 In a mechanically ventilated patient, where endotracheal tube resistance dominates measured total respiratory system resistance, the derived value of respiratory resistance must be interpreted with caution.

where dP = change in pressure; dt = change in time; and dV = change in volume.
where PEEP is the set end-expiratory positive pressure and PEEPi the intrinsic PEEP (see below).
and the chest wall:
For example, if the elastance of the chest wall is twice that of the lung, then two-thirds of Prs is used to distend the chest wall and only one-third to inflate the lung.21 Of note, the chest wall in this context comprises not only the thoracic rib cage but also the abdomen.
Compliance of the respiratory system can be also measured by the super syringe method. This method for static P-V curve recordings has been associated with spurious changes in lung volume because of gas absorption during measurement.22 There are also issues related to user interpretation (e.g., difficulties in defining morphologic characteristics of the curve), and interobserver variability is often high.23,24 Some have advocated inductive machine learning in an attempt to standardize interpretation.25
Because the elastic pressure is determined by elastance and the corresponding lung volume, the equation may be rewritten as:
where Te is the expiratory time.
 Respiratory Mechanics and Lung Diseases
Acute Lung Injury and Acute Respiratory Distress Syndrome
Acute lung injury (ALI) and acute respiratory distress syndrome (ARDS) are associated with impaired lung barrier function. Because respiratory system elastance scales with lung size, injured lungs appear stiff.26–28 Total respiratory system resistance is also increased, particularly in the dependent regions of the lungs.28,29 In ARDS, a significant increase in the value of viscoelastic constants is found.28 Whether abnormal lung mechanics reflect the collapse of dependent units or are the consequence of alveolar flooding remains controversial.30
There is clear evidence that the injured lung is susceptible to further injury related to mechanical ventilation, termed ventilator-associated lung injury.31 An understanding of respiratory mechanics provides some insight into the possible pathogenetic mechanisms of this injury. First, the number of recruitable alveoli capable of expanding during inspiration is reduced. This results in what has been termed the “baby lung,” where gas flow is directed to aerated low-impedance units.27 Thus tidal volumes are distributed to fewer lung units and produce a greater local deformation.
Second, the heterogeneous distribution of liquid and associated surface tension in distal airspaces results in adjacent units with vastly different mechanical properties (e.g., opening pressure). This invokes the theory of injury related to interdependence, whereby during the opening of a flooded unit juxtaposed with an open unit, a shear stress across the tissue attachment results in pressures that are substantially higher than the average transpulmonary pressure.32
Mechanical ventilation induces a pulmonary and systemic cytokine response that can minimized by limiting recruitment or derecruitment and overdistention.33 ARDS patients ventilated with pressure-volume curve analysis to titrate PEEP and tidal volume values show attenuation of the inflammatory response if compared to patients ventilated with a strategy based only on obtaining normal values of arterial carbon dioxide tension and producing the greatest improvement in arterial oxygenation.33
Much attention has been focused on the pressure-volume relationship in injured lungs as a means to improve gas exchange and prevent ventilator-associated lung injury in predisposed lungs. Compared with the static P-V curve shown in Figure 46-2, the P-V curve measured with the super syringe method in ARDS and ALI (Figure 46-9) has a number of distinguishing features. These include:
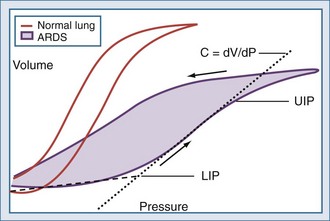
Characteristics of the P-V curve have been examined in animal models and in patients with ALI34–36 to study mechanisms responsible for pulmonary injury due to mechanical ventilation (ventilator-induced lung injury: VILI).37 These studies have demonstrated that tidal inflation starting below the LIP on the P-V curve (leading to tidal recruitment/derecruitment of previously collapsed alveoli) and/or tidal ventilation occurring above the UIP (pulmonary overstretching) could potentially cause a spectrum of pulmonary and systemic lesions including air leaks, alterations in lung fluid balance, increases in endothelial and epithelial permeability, severe tissue damage, and pulmonary and systemic production of inflammatory mediators that could potentially initiate a cascade leading to lung injury and a systemic inflammatory response.38
Mead and co-workers,39 in a classic study, examined the distribution of pressure during tidal inflation in a model of a heterogeneous lung. They found that atelectatic regions in a non-homogeneously inflated lung could be exposed to stresses up to about 140 cm H2O when the transpulmonary pressure was only 30 cm H2O. These stresses are generated by shear forces due to (1) recruitment of atelectatic areas surrounded by normal alveoli and (2) overdistension of alveoli adjacent to atelectatic zones or to the pleura. These findings led to the concept that recruitment/derecruitment of previously collapsed alveoli and/or pulmonary overstretching were potential mechanisms responsible for VILI.33
Use of the P-V curve in clinical decision making, however, has been the subject of much controversy.30,34 Critical appraisal of the P-V curve has revealed that there are technical limitations related to the numerous methods used to generate a P-V curve and low specificity for some derived parameters. Attention has also been refocused on edema, airway liquid, and interfacial phenomena as causes of higher opening pressures and increased lung impedance.30 The lower inflection point may originate in the chest wall rather than the lung in some patients, particularly in those with low end-expired thoracic volumes (recall that the P-V curve of the chest wall is nonlinear at low lung volumes; see Figure 46-2).40
It is clear that adjustments in PEEP are helpful in optimizing gas exchange, with improvements noted in the ratio of arterial oxygen pressure to inspired oxygen fraction (PaO2:FIO2). However, PEEP adjustments via P-V loop guidance do not necessarily translate into improvements in outcome or survival. As previously mentioned, if the assumptions on the lower and upper inflection point are true, ventilator settings should be adjusted until lung expansion is restricted to the linear midrange of the inflation P-V curve. This hypothesis finds application in stress index monitoring,41–42 which allows for breath-by-breath assessment of adherence to this treatment target.
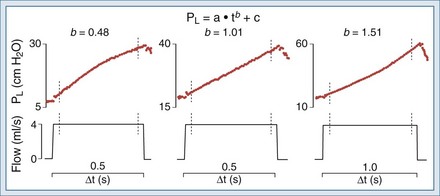
Ranieri et al. showed that the shape of the dynamic inspiratory P-t profile during constant flow inflation allows prediction of a ventilatory strategy that minimizes the occurrence of VILI in an isolated lung model of ALI. Figure 46-10 shows the behavior of the dynamic pressure-time (P-t) curve under such conditions. In addition, the shape of the Paw-t curve detects tidal recruitment and tidal hyperinflation.43
Evidence of alveolar hyperinflation was found in patients with focal ARDS ventilated with the ARDSNet protocol. Individual positive end-expiratory pressure titration based on “stress index” monitoring reduced the risk of alveolar hyperinflation.44 However, patients characterized by a larger amount of collapsed lung may be exposed to VILI despite tidal volume and pressure limitation. As suggested by the study of Terragni et al., plateau pressure should be limited to 28 cm H2O to guarantee lung protection.45
In the ARDSNet trial, early improvements in arterial oxygenation were noted in patients who were ventilated with higher tidal volumes, but such patients turned out to have increased mortality.31 A subsequent study by the same group showed no difference in mortality between ARDS patients randomized to higher “optimal” PEEP and “conventional” PEEP.46
It was suggested that patients with ARDS ventilated at relatively high respiratory rates develop greater PEEPi than when ventilated at lower rates, even for the same minute volume (V). This mechanism may produce decreased lung injury secondary to recruitment/derecruitment, and hence provides a plausible explanation for some of the decreased mortality observed in the ARDSNet trial in the 6 mL/kg ideal body weight (IBW) group.47
Because of concerns about chest wall–related P-V artifacts, esophageal manometry has been used to guide the ventilatory management of patients with injured lungs. Ranieri et al.48 showed that interpretation of the mechanical properties of the respiratory system requires assessment of both lung and chest wall mechanics and may vary with the underlying disease responsible for ARDS. In patients with medical ARDS, the inspiratory P-V curve of the respiratory system and lung showed a progressive reduction in elastance with inflating volume because of alveolar recruitment. In patients in whom ARDS followed major abdominal surgery, abdominal distension, with increased values for chest wall elastance, were observed. When abdominal pressure was normalized by surgical reexploration, improvement of the mechanical properties of the respiratory system, lung, and chest wall was observed. This study suggests that the flattening of the P-V curve at high pressures observed in some patients with ARDS may be due to increase in chest wall elastance related to abdominal distension. These results may also have importance for the optimal ventilatory management of critically ill patients with ARDS with respect to the selection of best PEEP and VT levels to minimize ventilator-induced lung injury. However, data from esophageal catheters may be misleading because derecruited dependent lung units that appose the esophageal probe may fail to generate local pressure swings, thereby biasing the measurement.49
In conclusion, over the past few years, we have learned that the application of a ventilatory strategy that minimizes VILI can decrease mortality rate in patients with ALI and ARDS.31 The key elements of such a lung-protective strategy are minimization of overdistention (volutrauma) and the use of sufficient positive end-expiratory pressure (PEEP) to prevent cyclic alveolar collapse (atelectrauma). The most common approach of trying to ensure a lung-protective strategy makes use of measurements at the airway opening of the pressure applied to he respiratory system. It thus appears that respiratory mechanics in patients with injured lungs are helpful in identifying those at greatest risk for ventilator-associated lung injury, and reassessment of the ventilation strategy limiting tidal volume to 6 mL/kg IBW and plateau pressure to 28 to 30 cm H2O may protect the lungs of patients with acute respiratory distress syndrome from VILI. However, although prevention of ventilator-induced lung injury is primarily based on recognizing the “harmful” threshold for pressure and volume (28-30 cm H2O airway plateau pressure (Pel,rs) and 6 mL/kg VT IBW), VT IBW and airway plateau pressure may be inadequate surrogates for lung stress and strain. Specific elastance (Espec) may play a major role in determining stress and strain.50
Last but not least, the effects of high PEEP strictly depend on lung recruitability, which widely varies during ARDS. Unfortunately, increasing PEEP may lead to opposing effects on two main factors potentially worsening the lung injury: alveolar strain and intratidal opening and closing, being detrimental (increasing the former) or beneficial (decreasing the latter). It has been found that especially in ARDS patients with higher lung recruitability, the beneficial impact of reducing intratidal alveolar opening and closing by increasing PEEP overcomes the effects of increasing alveolar strain.51
Obstructive Pulmonary Disease
A hallmark finding of all patients with obstructive lung disease is the inability to generate normal expiratory flows which, in a mechanically ventilated patient, leads to dynamic hyperinflation. One of the most readily available means to detect hyperinflation is the measurement of intrinsic PEEP by the end-expiratory airway occlusion method. Intrinsic PEEP is defined as total PEEP minus applied or extrinsic PEEP, and it reflects the elastic recoil of the respiratory system at end-expiration.52
It should be noted, however, that intrinsic PEEP is not a specific marker of airway obstruction. Patients with “normal” lungs can hyperinflate above a critical minute ventilation, as explained by Equation 23; the presence of intrinsic PEEP and dynamic hyperinflation does not necessarily indicate an absolute increase in end-expiratory volume. For example, on the basis of mass loading of the chest wall in the recumbent position, many patients with ascites or obesity breathe at lung volumes near residual volume.53 It should also be noted that the reliability of the end-expiratory occlusion method is dependent on complete respiratory muscle inactivity and therefore may not be reliable in a patient who assists the ventilator.
In assessing for the presence of airflow limitation, the expiratory time constant, τ, can be determined by the slope of the flow-volume curve (see Figure 46-6) or by the product of resistance and compliance (see Equation 23). However, a more readily available tool for detecting an in increase in resistive or threshold load is simple pattern recognition of ventilator-generated waveforms during a constant flow breath. Recall from Figure 46-8 that the initial step change in airway pressure during lung inflation should be equal to the recovery of pressure at the end of the tidal volume—that is, the difference between peak and plateau or airway occlusion pressure. The early step change is determined by any load that must be overcome to commence lung inflation. This includes resistive pressure as well as intrinsic PEEP, which drives expiratory flow. Thus, dynamic hyperinflation should be considered when the initial pressure step change significantly exceeds the terminal pressure recovery. This concept is also demonstrated in Figure 46-11, which shows an example of typical volume, airway pressure, and flow curves in an obstructed, dynamically hyperinflated patient.54 This method of assessing for hyperinflation has the added advantage of being less susceptible to patient effort, because thoracic neuromechanical feedback mechanisms tend to blunt effort at end-inspiration.
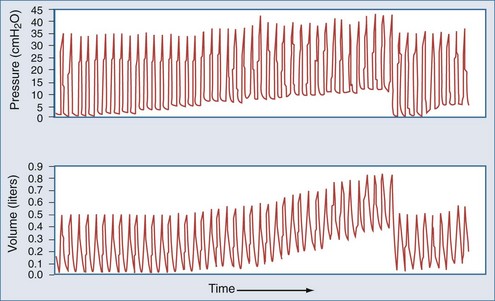
In the normal lung, expiratory driving pressure is determined by the difference between alveolar pressure and airway opening pressure. In the relaxed or paralyzed state, this driving pressure is the respiratory system recoil pressure at end-inspiratory lung volume. In normal lungs, the net driving pressure may be reduced by the application of extrinsic PEEP, which serves as a load that must be overcome before volume can be expired. Consequently, in a volume-preset ventilatory mode, this would result in reduced expiratory flow, hyperinflation, and elevated peak airway pressures over subsequent breaths. As explained in Figure 47-7, if extrinsic PEEP does not affect expiratory flow, flow limitation is present. In other words, in patients with severe airway obstruction who are breathing in the tidal volume range, end-inspiratory recoil pressure far exceeds that required for maximal expiratory flow. These patients would not exhibit reductions in expiratory flow in response to the application of small levels of extrinsic PEEP.55 Accordingly, as shown in Figure 46-11, the application of up to 5 cm H2O of extrinsic PEEP in an obstructed patient fails to raise volume or peak pressure.
 Respiratory Muscle Function in Healthy Lungs and in Pathologic Conditions
The chest wall collectively includes the thoracic cage and the abdominal compartment, which compose a parallel circuit. The respiratory muscles are striated in nature and thus subscribe to Starling’s law regarding length-tension relationships. As such, inspiratory muscles that act to expand the chest wall exert their greatest forces at low lung volumes (Figure 46-12). Conversely, expiratory muscles, working to actively deflate the lungs, are most efficient at high lung volumes.4
The muscles of respiration perform in a complex integrated fashion to maximize breathing efficiency. Although the diaphragm is the primary muscle of respiration, it is known that muscles previously thought to have only an accessory role in breathing, including the intercostal and scalene muscles, are actively taking part in quiet respiration to aid in movement of the chest wall.56 Relaxation allows passive recoil of the respiratory system to its resting functional residual capacity position. During exercise, phasic contraction of expiratory muscles drives the respiratory system below its resting position. Subsequent relaxation at end-expiration increases lung volume, thereby reducing the load on the inspiratory muscles for the next respiratory cycle.3
The most important inspiratory muscle is the dome-shaped diaphragm. It is composed of muscle fibers that radiate from the central tendon to attach to the lower rib cage. The crural portion inserts on the anterior portions of lumbar vertebrae 1 through 3, and the costal portion inserts on the xiphoid process and the upper inner margins of the lower six ribs. The majority of the muscular portion of the diaphragm lies directly beside the lower rib cage, referred to as the zone of apposition (Figure 46-13).The zone of apposition is 6 to 9 cm in height and occupies 25% to 30% of the total interior surface of the rib cage.56
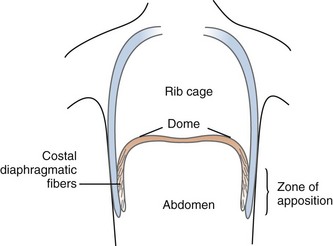
where Pga is gastric pressure, and Pes is esophageal pressure. Second, the contracting diaphragm exerts what is termed an appositional force. This is related to the configuration of the muscle fibers in the zone of apposition which, in contrast to fibers in the dome, have a much larger radius of curvature (i.e., less of a curve). In accordance with the law of Laplace, less pressure is therefore generated to move the diaphragm. Instead, the pleural space in the zone of apposition is exposed to approximate abdominal pressure, thereby acting directly to push the lower rib cage in an outward direction.57 Thus the rise in abdominal pressure caused by descent of the diaphragmatic dome is transmitted through the appositional portion of the diaphragm to expand the lower rib cage.58 Accordingly, pressure in the pleural recess between the apposed diaphragm and the rib cage actually increases during inspiration.
It should be noted that diaphragmatic contraction can have inspiratory or expiratory effects on the thoracic cage, depending on several factors.3 For example, mechanical properties of the abdominal compartment have a marked influence on diaphragmatic function. Low compliance (or high elastance) of the total respiratory system, as in tense ascites, results in reduced dome excursion and decreased insertional force, whereas decrements in abdominal resistance (evisceration) cause loss of the zone of apposition, with resultant expiratory actions on the lower rib cage.56 There are also important effects related to lung volume. The area of apposition increases as the lungs approach residual volume, causing a greater inspiratory effect on the lower rib cage. Conversely, near total lung capacity, the zone of apposition is nearly absent, resulting in an expiratory force. Studies of diaphragmatic contraction in subjects with cervical spinal cord transection have demonstrated expiratory effects on the upper rib cage and inspiratory effects on the lower rib cage.59,60
The scalene muscles, considered primary muscles of respiration, originate at the cervical spine transverse processes and insert on the first two ribs anteriorly. Their contraction aids inspiration by expanding the rib cage. A number of muscles serve an accessory role, facilitating the primary muscles’ role during periods of increased effort (exercise, fatigue). These muscles include the sternocleidomastoids, pectoralis minor, and erector spinae, all of which elevate the ribs during contraction.3
Expiratory muscles are also involved in generating cough.56 In tetraplegic subjects, the clavicular portion of the pectoralis major plays a major role during coughing. Its contraction causes a reduction in the size of the upper part of the rib cage and a rise in intrathoracic pressure; this pressure rise results secondarily in an outward (paradoxical) motion of the abdomen and the lower rib cage.61 Measurement of peak cough maximal expiratory flow rate (PCEF) is a simple and reproducible intervention to assess capability of coughing in spontaneous breathing patients. Values below 3.5 to 4L/sec have been associated with poor coughing.62–63 Measurement of peak flow rate (PEF) during induced cough also seems to improve predictability of successful decannulation or extubation in critical care patients.64–67
The abdomen plays a major role in respiratory mechanics. The abdomen, with the exception of the diaphragm superiorly and the anterior abdominal wall (and small amounts of gas in the gastrointestinal tract), is an essentially incompressible compartment with fixed boundaries. As such, the movement of the diaphragm and thoracic cage is coupled with movement of the anterior abdominal wall. This is a clinically important relationship that should be assessed during a physical examination, because asynchronous and paradoxical motion of the rib cage and abdomen has been associated with increased respiratory drive68 and possible risk of ventilatory failure.69
The Rahn diagram is a graphic representation of the relaxed respiratory system’s P-V characteristics (see Figure 46-2). It provides information on the passive elastic properties of the components of the respiratory system. For accurate chest wall measurements, complete respiratory muscle relaxation is required. The function of the active chest wall can be assessed with the Campbell diagram,70 which plots changes in lung volume against pleural pressure.
Because use of this methodology is difficult in mechanically ventilated patients, simple ventilator waveform analysis can be helpful. For example, deviation of the inspiratory flow waveform from the relaxed tracing indicates active patient effort as a result of flow deprivation—that is, the patient’s demands are not being met by the set inspiratory flow.71 Maximal inspiratory pressure is a commonly used measurement in the ICU, particularly in weaning protocols. High generated pressures probably correlate with adequate muscle strength, but low values may be related to volitional factors. Moreover, standardized testing has shown poor reproducibility.72
Much attention has been given to the concept of respiratory muscle fatigue,73 both in acute respiratory failure and in relation to chronic lung disease. Muscle fatigue is defined as a condition associated with loss of the capacity for developing force, velocity, or both resulting from muscle activity, which is reversible by rest.74 This contrasts with the definition of muscle weakness, in which the rested muscle remains impaired. Fatigue can be induced in striated muscle when working against an increased load. This has been reproduced in normal human respiratory muscles forced to work against high inspiratory airflow resistance.75 Fatigue can be classified as central fatigue, peripheral high-frequency fatigue, or peripheral low-frequency fatigue.76,77 It is likely that all three play a role in respiratory muscle fatigue at any given time.
where Pdi denotes transdiaphragmatic pressure (a measure of magnitude), Ti is inspiratory time, and Ttot is total breath time. When breathing is accomplished primarily by diaphragmatic function, a critical pressure-time index is reached at values of 0.15 to 0.18, above which functional failure readily occurs.51 Similar ranges have been obtained for rib cage muscles as well.78 Unfortunately, because these values were experimentally obtained in normal subjects breathing against imposed loads, the true values that apply to patients with impending respiratory failure, in whom other factors (hypoxemia, hemodynamic instability) are in play, is not known. In addition, when respiration is accomplished only by the diaphragm without the contribution of the other respiratory muscles, as in quadriplegic patients, the fatigue threshold is lower than previously reported.79
Work of breathing is a global measure of respiratory pump activity and reflects the imposed respiratory load, which is often a result of abnormalities in respiratory mechanics. Most of the work of breathing, in both health and disease states, occurs during inspiration (Wi) and is related to the static elastance (Est) of the respiratory system80:

A linear relationship is assumed between elastance and the volumes measured.
Patients with acute respiratory failure related to COPD have been found to have increased inspiratory resistance, increased dynamic elastance, and up to twice the level of intrinsic PEEPi compared with COPD patients not in acute respiratory failure.81 Dynamic hyperinflation has secondary deleterious effects on respiratory muscle function related primarily to Starling’s law (suboptimal coupling of the tension-generating components of the muscle fibers).82 Thus the increased work of breathing and subsequent respiratory muscle fatigue due to disruption of the optimal length-tension relationships of respiratory muscles83 could precipitate acute respiratory failure in patients with “compensated” COPD. Although impairment of inspiratory muscle function related to dynamic hyperinflation is classically associated with COPD, a number of other disorders seen in critical illness have been associated with reduced respiratory muscle force generation. Sepsis, even in the absence of direct lung involvement, can cause respiratory failure related to increased metabolic demands as well as respiratory muscle dysfunction.84 Direct effects on muscle function have been related to failure of neuromuscular contraction, derangements in excitation-contraction coupling, and direct cytotoxic effects.84
Critical illness polyneuropathy, associated with varying degrees of weakness and axonal degeneration on electromyography and denervation atrophy on muscle biopsy, has a reported incidence as high as 25%.85 The causative role of critical illness polyneuropathy in respiratory failure is controversial because it is often associated with other conditions that affect global muscle function, such as sepsis and multiorgan system failure.86 Critical illness polyneuropathy has, however, been documented in cases of respiratory failure independent of these risk factors.87 Critical illness myopathy, which can coexist with polyneuropathy, is most commonly reported in cases of severe asthma and may be related to glucocorticoid and neuromuscular blocking agent administration.88 Finally, there is increasing animal model data showing that mechanical ventilation has direct harmful effects on diaphragmatic structure and function.89,90 Putative mechanisms include atrophy related to disuse (particularly with prolonged mechanical ventilation), tonic effects of PEEP, and confounding effects of anesthesia and neuromuscular blocking agents.
 Weaning from Mechanical Ventilation
Clinical assessment alone is insufficient to predict successful weaning from mechanical ventilation,91 and respiratory muscle function is only one determinant of weaning ability. Unfortunately, the incorporation of many objective methods into weaning paradigms has not proved particularly useful. The shortcomings of breathing pattern assessment were mentioned earlier, and measurements of maximal inspiratory pressures are not easily reproduced. Measurement of pressure-time indices has not been readily adopted in ICU practice, and work-of-breathing determinations are cumbersome and seemingly restricted to the research setting.
The most widely adopted and useful predictor of weaning success is the ratio of breathing frequency to tidal volume, as first reported by Yang and Tobin.92 This involves the simple use of a spirometer attached to the endotracheal tube during a spontaneous breathing trial. A ratio of 105 breaths/min/L provides the best separation between subjects who will succeed or who will fail at weaning.
Key Points
Fredberg JJ, Stamenovic D. On the imperfect elasticity of lung tissue. J Appl Physiol. 1989;67(6):2408-2419.
Fry DL, Hyatt RE. Pulmonary mechanics: a unified analysis of the relationship between pressure, volume and gas flow in the lungs of normal and diseased human subjects. Am J Med. 1960;29:672-689.
Hubmayr RD. Perspective on lung injury and recruitment: a skeptical look at the opening and collapse story. Am J Respir Crit Care Med. 2002;165(12):1647-1653.
Laghi F, Tobin M. Disorders of the respiratory muscles. Am J Respir Crit Care Med. 2003;168(1):10-48.
Loring S. Mechanics of the lung and chest wall. In: Marini JJ, editor. Physiological Basis of Ventilatory Support. New York: Marcel Dekker; 1998:177-205.
Ranieri VM, Zhang H, Mascia L, et al. Pressure-time curve predicts minimally injurious ventilatory strategy in an isolated rat lung model. Anesthesiology. 2000;93(5):1320-1328.
de Durante G, del Turco M, Rustichini L, et al. ARDSNet lower tidal volume ventilatory strategy may generate intrinsic positive end-expiratory pressure in patients with acute respiratory distress syndrome. Am J Respir Crit Care Med. 2002;165(9):1271-1274.
Terragni PP, Rosboch G, Tealdi A, et al. Tidal hyperinflation during low tidal volume ventilation in acute respiratory distress syndrome. Am J Respir Crit Care Med. 2007;175(2):160-166.
Chiumello D, Carlesso E, Cadringher, et al. Lung stress and strain during mechanical ventilation for acute respiratory distress syndrome. Am J Respir Crit Care Med. 2008;178(4):346-355.
1 Caples SM, Hubmayr RD. Respiratory system mechanics and respiratory muscle function. In: Fink MP, Abraham E, Vincent JLet al, editors. Textbook of Critical Care. 5th ed. Philadelphia: Saunders; 2005:471-482.
2 Rodarte JR, Rehder K. Dynamics of respiration. In: Macklem PT, Mead J, editors. Handbook of Physiology, sec 3, The Respiratory System. Baltimore: Williams & Wilkins; 1986:131-144.
3 Loring SH. Mechanics of the lung and chest wall. In: Marini JJ, Slutsky AS, editors. Physiological Basis of Ventilatory Support. New York: Marcel Dekker; 1998:177-205.
4 Agostoni E, Hyatt RE. Static behavior of the respiratory system. In: Fishman AP, editor. Handbook of Physiology. Baltimore: Williams & Wilkins; 1986:113-130.
5 Weibel ER. Functional morphology of lung parenchyma. In: Macklem PT, Mead J, editors. Handbook of Physiology, sec 3, The Respiratory System. Baltimore: Williams & Wilkins; 1986:89-111.
6 Wilson TA, Bachofen H. A model for mechanical structure of the alveolar duct. J Appl Physiol. 1982;52(4):1064-1070.
7 Taylor A, Rehder K, Hyatt R, et al. Mechanics of breathing: Static. In: Taylor AE, editor. Clinical Respiratory Physiology. Philadelphia: WB Saunders; 1989:89-105.
8 Fredberg JJ, Stamenovic D. On the imperfect elasticity of lung tissue. J Appl Physiol. 1989;67:2408-2419.
9 Steinberg J, Schiller HJ, Halter J, et al. Tidal volume increases do not affect alveolar mechanics in normal lung but cause alveolar overdistension and exacerbate alveolar instability after surfactant deactivation. Crit Care Med. 2002;30:2675-2683.
10 Brusasco V, Warner DO, Beck KC, et al. Partitioning of pulmonary resistance in dogs: Effect of tidal volume and frequency. J Appl Physiol. 1989;66:1190-1196.
11 Fabry B, Maksym GN, Butler JP, et al. Scaling the microrheology of living cells. Phys Rev Lett. 2001;87:1429-1436.
12 Pedley TJ, Drazen JM. Aerodynamic theory. In: Macklem PT, Mead J, editors. Handbook of Physiology, sec 3, The Respiratory System. Baltimore: Williams & Wilkins; 1986:41-54.
13 Rodrigo GJ, Rodrigo C, Pollack CV, et al. Use of helium-oxygen mixtures in the treatment of acute asthma: A systematic review. Chest. 2003;123:891-896.
14 Gainnier M, Forel JM. Clinical review: use of helium-oxygen in critically ill patients. Crit Care. 2006;10(6):241.
15 Tassaux D, Gainnier M, Battisti A, et al. Impact of expiratory trigger setting on delayed cycling and inspiratory muscle workload. Am J Respir Crit Care Med. 2005;172:1283-1289.
16 Fry DL, Hyatt RE. A unified analysis of the relationship between pressure, volume and gas flow in the lungs of normal and diseased human subjects. Am J Med. 1960;29:672-689.
17 Bates JH, Brown KA, Kochi T. Respiratory mechanics in the normal dog determined by expiratory flow interruption. J Appl Physiol. 1989;67:2276-2285.
18 D’Angelo E, Calderini E, Torri G, et al. Respiratory mechanics in anesthetized paralyzed humans: effects of flow, volume, and time. J Appl Physiol. 1989;67:2556-2564.
19 Similowski T, Levy P, Corbeil C, et al. Viscoelastic behavior of lung. J Appl Physiol. 1989;67:2219-2229.
20 Agostoni E, Mead J. Statics of the respiratory system. In: Handbook of Physiology. Respiration, Washington DC: American Physiology Society; 1964:387-409. sect. 3, vol. I, chapt. 13
21 Brander L, Ranieri VM, Slutsky AS. Esophageal and transpulmonary pressure help optimize mechanical ventilation in patients with acute lung injury. Crit Care Med. 2006:341556-341558.
22 Sydow M, Burchardi H, Zinserling J, et al. Improved determination of static compliance by automated single volume steps in ventilated patients. Intensive Care Med. 1991;17:108-114.
23 Servillo G, De Robertis E, Maggiore S, et al. The upper inflection point of the pressure-volume curve: Influence of methodology and of different modes of ventilation. Intensive Care Med. 2002;28:842-849.
24 Ward NS, Lin DY, Nelson DL, et al. Successful determination of lower inflection point and maximal compliance in a population of patients with acute respiratory distress syndrome. Crit Care Med. 2002;30:963-968.
25 Ganzert S, Guttmann J, Kersting K, et al. Analysis of respiratory pressure-volume curves in intensive care medicine using inductive machine learning. Artif Intell Med. 2002;26:69-86.
26 Berthiaume Y, Folkesson HG, Matthay MA. Lung edema clearance: 20 years of progress. Invited review: Alveolar edema fluid clearance in the injured lung. J Appl Physiol. 2002;93:2207-2213.
27 Gattinoni L, Pesenti A, Avalli L, et al. Pressure-volume curve of total respiratory system in acute respiratory failure: Computed tomographic scan study. Am Rev Respir Dis. 1987;136:730-736.
28 Eissa NT, Ranieri VM, Corbeil C, et al. Analysis of behavior of the respiratory system in ARDS. J Appl Physiol. 1991;70:2719-2729.
29 Tantucci J, Corbeil C, Chassé M, et al. Flow and volume dependence of respiratory system resistance in patients with adult respiratory distress syndrome. Am Rev Respir Dis. 1992;145:355-360.
30 Hubmayr RD. Perspective on lung injury and recruitment: A skeptical look at the opening and collapse story. Am J Respir Crit Care Med. 2002;165:1647-1653.
31 Acute Respiratory Distress Syndrome Network. Ventilation with lower tidal volumes as compared with traditional tidal volumes for acute lung injury and the acute respiratory distress syndrome. N Engl J Med. 2000;342:1301-1308.
32 Mead J, Takashima T, Leith D. Stress distribution in lungs: A model of pulmonary elasticity. J Appl Physiol. 1970;28:596-603.
33 Ranieri VM, Suter PM, Tortorella C, et al. Effect of mechanical ventilation on inflammatory mediators in patients with acute respiratory distress syndrome: a randomized controlled trial. JAMA. 1999;282:54-61.
34 Hickling K. Reinterpreting the pressure-volume curve in patients with acute respiratory distress syndrome. Curr Opin Crit Care. 2002;8:32-38.
35 Ranieri VM, Giuliani R, Fiore T, et al. Volume pressure curve of the respiratory system predicts effects of PEEP in ARDS: occlusion versus constant flow technique. Am J Respir Crit Care Med. 1994;149:19-27.
36 Ranieri VM, Eissa NT, Corbeil C, et al. Effects of positive end-expiratory pressure on alveolar recruitment and gas exchange in patients with the adult respiratory distress syndrome. Am Rev Respir Dis. 1991;144:544-551.
37 Liu JM, De Roberstis E, Blomquist S, et al. Elastic pressure-volume curves of the respiratory system reveal a high tendency to lung collapse in young pigs. Intensive Care Med. 1999;25:1140-1146.
38 Ranieri VM, Slutsky AS. Respiratory physiology and acute lung injury: the miracle of Lazarus. Intensive Care Med. 1999;25:1040-1043.
39 Mead J, Takishima T, Leith D. Stress distribution in lungs: a model of pulmonary elasticity. J Appl Physiol. 1970;28:596-608.
40 Mergoni M, Martelli A, Volpi A, et al. Impact of positive end-expiratory pressure on chest wall and lung pressure-volume curve in acute respiratory failure. Am J Respir Crit Care Med. 1997;156:846-854.
41 Ranieri VM, Zhang H, Mascia L, et al. Pressure-time curve predicts minimally injurious ventilatory strategy in an isolated rat lung model. Anesthesiology. 2000;93:1320-1328.
42 Terragni PP, Rosboch GL, Lisi A, et al. How respiratory system mechanics may help in minimising ventilator-induced lung injury in ARDS patients. Eur Respir J. 2003;42:15s-21s.
43 Grasso S, Terragni P, Mascia L, et al. Airway pressure-time curve profile (stress index) detects tidal recruitment/hyperinflation in experimental acute lung injury. Crit Care Med. 2004;32:1018-1027.
44 Grasso S, Stripoli T, De Michele M, et al. ARDSNet ventilatory protocol and alveolar hyperinflation: role of positive end-expiratory pressure. Am J Respir Crit Care Med. 2007;176:761-767.
45 Terragni PP, Rosboch G, Tealdi A, et al. Tidal hyperinflation during low tidal volume ventilation in acute respiratory distress syndrome. Am J Respir Crit Care Med. 2007;15(175):160-166.
46 ARDSNet. Higher end-expiratory lung volume/lower FIO2 vs lower end-expiratory lung volume/higher FIO2 ventilation in ALI/ARDS (ALVEOLI). Available at. http://hedwig.mgh.harvard.edu/ardsnet/studies.html.
47 de Durante G, del Turco M, Rustichini L, et al. ARDSNet lower tidal volume ventilatory strategy may generate intrinsic positive end-expiratory pressure in patients with acute respiratory distress syndrome. Am J Respir Crit Care Med. 2002;165:1271-1274.
48 Ranieri VM, Brienza N, Santostasi S, et al. Impairment of lung and chest wall mechanics in patients with acute respiratory distress syndrome: role of abdominal distension. Am J Respir Crit Care Med. 1997;156:1082-1091.
49 de Chazal I, Hubmayr RD. Novel aspects of pulmonary mechanics in intensive care. Br J Anaesth. 2003;91:81-91.
50 Chiumello D, Carlesso E, Cadringher P, et al. Lung stress and strain during mechanical ventilation for acute respiratory distress syndrome. Am J Respir Crit Care Med. 2008;178:346-355.
51 Caironi P, Cressoni M, Chiumello D, et al. Lung Opening and Closing During Ventilation of Acute Respiratory Distress Syndrome. Am J Respir Crit Care Med. 2009 Nov 12. [Epub ahead of print]
52 Pepe PE, Marini JJ. Occult positive end-expiratory pressure in mechanically ventilated patients with airflow obstruction: The auto-PEEP effect. Am Rev Respir Dis. 1982;126:166-170.
53 Pankow W, Podszus T, Gutheil T, et al. Expiratory flow limitation and intrinsic positive end-expiratory pressure in obesity. J Appl Physiol. 1998;85:1236-1243.
54 Gay PC, Rodarte JR, Tayyab M, et al. The evaluation of bronchodilator responsiveness in mechanically ventilated patients. Am Rev Respir Dis. 1987;136:880-885.
55 Gay PC, Rodarte JR, Hubmayr RD. The effects of positive expiratory pressure on isovolume flow and dynamic hyperinflation in patients receiving mechanical ventilation. Am Rev Respir Dis. 1989;139:621-626.
56 De Troyer A. Respiratory muscle function. In: Pinsky MR, editor. Textbook of Critical Care. Philadelphia: WB Saunders; 2000:1172-1184.
57 Mead J. Functional significance of the area of apposition of diaphragm to rib cage. Am Rev Respir Dis. 1979;119:31-32.
58 Urmey WF, De Troyer A, Kelly KB, Loring SH. Pleural pressure increases during inspiration in the zone of apposition of diaphragm to rib cage. J Appl Physiol. 1988;65:2207-2212.
59 Mortola JP, Sant’Ambrogio G. Motion of the rib cage and the abdomen in tetraplegic patients. Clin Sci Mol Med. 1978;54:25.
60 Estenne M, De Troyer A. Relationship between respiratory muscle electromyogram and rib cage motion in tetraplegia. Am Rev Respir Dis. 1985;132:53.
61 Estenne M, De Troyer A. Cough in tetraplegic subjects: an active process. Ann Intern Med. 1990;112:22-28.
62 Bach JR, Smith WH, Michaels J, et al. Airway secretion clearance by mechanical exsufflation for post-poliomyelitis ventilator-assisted individuals. Arch Phys Med Rehabil. 1993;74:170-177.
63 Suárez AA, Pessolano FA, Monteiro SG, et al. Peak flow and peak cough flow in the evaluation of expiratory muscle weakness and bulbar impairment in patients with neuromuscular disease. Am J Phys Med Rehabil. 2002;81:506-511.
64 Smina M, Salam A, Khamiees M, et al. Cough peak flows and extubation outcomes. Chest. 2003;124:262-268.
65 Beuret P, Roux C, Auclair A, et al. Interest of an objective evaluation of cough during weaning from mechanical ventilation. Intensive Care Med. 2009;35:1090-1093.
66 Chan LY, Jones AY, Chung RC, et al. A predictor of successful decannulation of a tracheotomy tube in neurosurgical patients. Peak flow rate during induced cough. Am J Crit Care. 2009 May 12. [Epub ahead of print]
67 Su WL, Chen YH, Chen CW, et al. Involuntary cough strength and extubation outcomes for patients in an intensive care unit: Involuntary cough and extubation outcomes. Chest. 2010 Jan 22. [Epub ahead of print]
68 Tobin MJ, Perez W, Guenther SM, et al. The pattern of breathing during successful and unsuccessful trials of weaning from mechanical ventilation. Am Rev Respir Dis. 1986;134:1111-1118.
69 Ashutosh K, Gilbert R, Auchincloss JH, et al. Asynchronous breathing movements in patients with chronic obstructive pulmonary disease. Chest. 1975;67:553-557.
70 Roussos C, Campbell EJM. Respiratory muscle energetics. In: Macklem PT, Mead J, editors. Handbook of Physiology. Bethesda: American Physiology Society; 1986:481-509.
71 Tobin MJ, Brochard L, Rossi A. Assessment of respiratory muscle function in the intensive care unit. Am J Respir Crit Care Med. 2002;166:610-624.
72 Multz AS, Aldrich TK, Prezant DJ, et al. Maximal inspiratory pressure is not a reliable test of inspiratory muscle strength in mechanically ventilated patients. Am Rev Respir Dis. 1990;142:529-532.
73 Laghi F, Tobin M. Disorders of the respiratory muscles. Am J Respir Crit Care Med. 2003;168:10-48.
74 Summary, NHLBI Workshop. Respiratory muscle fatigue. Am Rev Respir Dis. 1990;142:474-480.
75 Roussos C, Macklem PT. Diaphragmatic fatigue in man. J Appl Physiol. 1977;43:189.
76 American Thoracic Society/European Respiratory Society. ATS/ERS statement on respiratory muscle testing. Am J Respir Crit Care Med. 2002;166:518-624.
77 Bellemare F, Grassino A. Effect of pressure and timing of contraction on human diaphragm fatigue. J Appl Physiol. 1982;53:1190-1195.
78 Zocchi L, Fitting JW, Majani U, et al. Effect of pressure and timing of contraction on human rib cage muscle fatigue. Am Rev Respir Dis. 1993;147:857-864.
79 Nava S, Rubini F, Zanotti E, et al. The tension-time index of the diaphragm revisited in quadriplegic patients with diaphragm pacing. Am J Respir Crit Care Med. 1996;153:1322-1327.
80 Coussa M, Guerin C, Eissa N, et al. Partitioning of work of breathing in mechanically ventilated COPD patients. J Appl Physiol. 1993;75:1711-1719.
81 Jubran A, Tobin MJ. Pathophysiologic basis of acute respiratory distress in patients who fail a trial of weaning from mechanical ventilation. Am J Respir Crit Care Med. 1997;155:906-915.
82 Eissa NT, Milic-Emili J. Modern concepts in monitoring and management of respiratory failure. Anesthesiol Clin. 1991;9:199-218.
83 Farkas G, Cerny FJ, Rochester DF. Contractility of the ventilatory pump muscles. Med Sci Sports Exerc. 1996;28:1106-1114.
84 Hussain SNA. Respiratory muscle dysfunction in sepsis. Mol Cell Biochem. 1998;179:125-134.
85 De Jonghe B, Sharshar T, Lefaucheur J, et al. Paresis acquired in the intensive care unit: A prospective multicenter study. JAMA. 2002;288:2859-2867.
86 Leijten FS, Harinck-de Weerd JE, Poortvliet DC, de Weerd AW. The role of polyneuropathy in motor convalescence after prolonged mechanical ventilation. JAMA. 1995;274:1221-1225.
87 Latronico N, Fenzi F, Recupero D, et al. Critical illness myopathy and neuropathy. Lancet. 1996;347:1579-1582.
88 Leatherman JW, Fluegel WL, David WS, et al. Muscle weakness in mechanically ventilated patients with severe asthma. Am J Respir Crit Care Med. 1996;153:1686-1690.
89 Sassoon CSH. Ventilator-associated diaphragmatic dysfunction. Am J Respir Crit Care Med. 2002;166:1017-1018.
90 Yang L, Luo J, Bourdon J, et al. Controlled mechanical ventilation leads to remodeling of the rat diaphragm. Am J Respir Crit Care Med. 2002;166:1135-1140.
91 Stroetz RW, Hubmayr R. Tidal volume maintenance during weaning with pressure support. Am J Respir Crit Care Med. 1995;152:1034-1040.
92 Yang K, Tobin MJ. A prospective study of indexes predicting the outcome of trials of weaning from mechanical ventilation. N Engl J Med. 1991;324:1445-1450.
[/level-membership-for-critical-care-medicine-category][not-level-membership-for-critical-care-medicine-category]
46 Respiratory System Mechanics and Respiratory Muscle Function
Classic respiratory mechanics are based on Newtonian physics, as expressed in the equation of motion. The respiratory system model is derived from an elementary monodimensional system, as depicted by a block with an attached spring, acted on by a unidirectional force (Figure 46-1, A).1,2 Upon application of force, the response of the system can be characterized in terms of displacement, velocity, and acceleration of a block with a mass of M. The balance of forces acting on the block can be expressed as follows:
where the total force applied to the system (Fappl) at a given time (t) is equal to the sum of the elastic (Fel), resistive (Fres), and inertial (Fin) forces.
The equation of motion for a three-dimensional pneumatic system may be written as:
where P(t) is the pressure exerted on the system at a given time; E is the elastance (the reciprocal of compliance, i.e., 1/C), which relates pressure to volume (V), and R is the resistance constant, relating pressure to flow. The third term of the equation describes the pressure required to accelerate tissue and gas in the airway, which is an important factor under certain circumstances such as coughing or high-frequency oscillatory ventilation. The inertance constant (I) relates pressure to linear acceleration (). However, the third term is usually omitted in this model of the respiratory system, because inertive forces are negligible during quiet breathing and most forms of mechanical ventilation.3 Thus, in most applications, the respiratory system derivative of the equation of motion considers only the elastic and flow-resistive elements that oppose an applied pressure at time (t):
which may also be expressed as:
In this model, any force applied to the respiratory system is either stored as elastic energy or dissipated as resistive energy. Figure 46-1, B shows a three-dimensional model of the respiratory system as it relates to the equation of motion.
Static Behavior of the Respiratory System
An esophageal balloon catheter can be used to approximate pleural pressure, keeping in mind that pleural pressure is nonuniform and that topographic gradients in pleural pressure vary with posture.4 In the recumbent posture, there is no site in the esophagus at which local pressure approximates average lung surface pressure (i.e., average pleural pressure). However, at least in normal lungs, the average change in surface or pleural pressure can be inferred using esophageal manometry.
By assuming that Pbs is considered to be zero:
The static respiratory system pressure-volume (P-V) curve is often measured in intubated, mechanically ventilated patients to make inferences about the mechanical properties of the lungs. Although the utility of P-V measurements in clinical decision making remains to be established, the determinants of the P-V relationship should nevertheless be understood. The P-V curve is generated by inflating and deflating the relaxed respiratory system in a stepwise fashion between residual volume and total lung capacity. The airway occlusion pressure at each volume defines the corresponding elastic recoil pressures of the lungs and chest wall. Because the inflation and deflation relationships differ from each other, the resulting curve is often referred to as a P-V loop. The respiratory system P-V loop is the summation of individual lung and chest wall P-V loops, termed a Rahn diagram (Figure 46-2). Because during normal tidal volume breathing (30% to 70% vital capacity), the relationship between elastic pressure and volume is essentially linear, the system’s elastic properties can be defined by a constant, namely elastance. The term compliance is more frequently used and is simply the inverse of elastance, defined as the change in volume per unit change in applied pressure. Static respiratory system compliance can be determined by the slope of the P-V curve. In the quiet breathing range, the normal respiratory system elastance averages 8 to10 cm H2O/L, corresponding to a static respiratory system compliance of 0.12 to 0.1 L/cm H2O.
Figure 46-2 shows the P-V curves of the respiratory system’s component structures, the lung and chest wall. At high lung volumes, the total respiratory system compliance is reduced (the P-V curve is concave to the pressure axis), primarily because the lung reaches total capacity, its structural limit. In contrast, the P-V curve of the chest wall remains linear at high volumes (i.e., the chest wall offers much less resistance to further lung expansion).
At low lung volumes, a decrease in chest wall compliance is the major contributor to low respiratory system compliance. At relaxation volume (functional residual capacity), the inward recoil of the lung is equal to the outward recoil of the chest wall, so that alveolar pressure is atmospheric. At a volume of 60% of vital capacity, the chest wall reaches a “resting” position, that is, it exerts no force on the lungs, and the pleural pressure is atmospheric. In the normal tidal breathing range, the slopes of the lung and chest wall P-V curves are similar (i.e., lung and chest wall contribute about equally to overall respiratory system compliance). Figure 46-3 shows the volume dependence of the inwardly and outwardly directed forces of the respiratory system during inflation.4
Surface forces (i.e., surface tension) are generated because liquid molecules in contact with air attempt to conserve energy by decreasing the area available for interaction. In the lung, the resulting force acts parallel to the alveolar septa and balances a helical fiber network that supports alveolar ducts and forms alveolar entrance rings.6
As demonstrated in Figure 46-4, the elimination of surface tension has two important consequences on lung mechanics7:
In the normal lung, hysteresis is caused by volume- and time-dependent changes in the molecular composition and hence the biophysical properties of surfactant. Surfactant is a protein-enriched lipid film that coats air-liquid interfaces in distal lung units and lowers surface tension. Hysteresis implies that energy added to the system during inflation is not fully recovered during deflation. The hysteretic loss of energy does not scale with frequency and flow the way a Newtonian viscous resistance does, underscoring one of the many limitations of linear resistance-compliance circuits in modeling lung mechanics.8 Whereas interfacial phenomena are the primary source of hysteresis in the normal lung, alveolar recruitment and derecruitment are important sources of hysteresis in disease.
Applied to the lung, this means that changes in alveolar dimensions at low lung volumes would promote alveolar collapse were it not for surfactant’s surface tension–lowering properties. A surfactant-depleted lung exhibits alveolar instability and collapse in the tidal breathing range. In normal pigs, high-tidal-volume ventilation does not alter alveolar mechanics in the normal lung; however, in the surfactant-deactivated lung, it causes alveolar overdistension and exacerbates alveolar instability.9 Figure 46-5 shows a pressure-volume loop of a normal lung and a surfactant-depleted lung. As a consequence of surfactant depletion, larger than normal transpulmonary pressures are required to keep the surfactant-depleted lung inflated.
Dynamic Behavior of the Respiratory System
According to Ohm’s law, resistance (R) can be calculated by dividing the driving pressure by flow:
Total pulmonary resistance reflects the gas flow–dependent pressure dissipation in the conducting airways (airway resistance) and the frequency-dependent loss of energy associated with parenchymal deformation (tissue resistance). Originally considered only a minor component of total pulmonary resistance, it is now appreciated that the so-called tissue resistance dominates the measurement, at least at low frequencies.10 As outlined by Fredberg and Stamenovic,8 tissue resistance and tissue hysteretic properties are model-specific descriptors of energy loss, the structural and molecular basis of which remains uncertain.11
These determinants can be captured by Reynold’s number, a quantity that represents the ratio of inertial forces to viscous forces.12 A low Reynold’s number (<50) corresponds to laminar flow, and a Reynold’s number greater than 2300 is associated with turbulent flow. Accordingly, the low gas velocity in peripheral airways favors laminar flow, and the acceleration associated with the decrease in total cross-sectional area in central airways promotes turbulence.
where ΔP is the pressure drop, L is the length of pipe, µ is the dynamic viscosity, Q is the volumetric flow rate, r is the radius, and π is the mathematical constant (approximately 3.141592654). In contrast, turbulent flow is associated with nonlinear pressure-flow relationships that are gas-density dependent. The density dependence of turbulent flow is occasionally exploited in the medical use of heliox, a low-density helium-oxygen mixture given to patients with central airway lesions or asthma.13 However, the available clinical data on inhaled He/O2 mixtures are insufficient to prove that this therapy has benefit with respect to outcome variables.14
The flow-dependent shift from laminar to turbulent flow is captured in the Rohrer equation:
where K1 and K2 are constants that scale frictional pressure dissipation associated with laminar and turbulent flow, respectively.
A second mechanism of pressure loss during gas flow is related to the Bernoulli principle, which describes convective pressure dissipation. That is, as a gas flows from a large cross-sectional area to a smaller area, velocity must increase to maintain flow. This results in energy dissipation and a drop in pressure and correlates to expiratory flow of gas from the bronchioles to the central airways. As mentioned previously, ohmic resistance can be computed by dividing resistive pressure by inspiratory flow (see Equation 13).
The respiratory time constant (τ) is the time required for the lung to fill or passively discharge approximately 63% of its contents. It can be determined from the slope of the passive expiratory flow-volume curve (Figure 46-6) or calculated directly by the equation:
where τ is usually measured in seconds because respiratory system resistance (Rrs) is expressed in units of pressure × time × volume−1, and respiratory system compliance (Crs) is expressed in units of volume × pressure−1.
The value of τ for a normal respiratory system is approximately 0.3 second.3 As can be inferred from the equation, patients with high respiratory system resistance or compliance, such as those with chronic obstructive lung disease (COPD), have correspondingly large τ values.
The added resistance of the artificial tubing in a mechanically ventilated patient may increase τ to 1 second or more. In addition, in patients with even minimally elevated τ values, the expiratory time (depending on the preset inspiratory time in time cycled ventilatory support or from the expiratory threshold in a flow cycled ventilatory mode15) may not be enough to fully empty the lungs during mechanical ventilation. Consequently, the demand for expiratory flow is not met as the lungs near relaxation volume, resulting in dynamic hyperinflation even in healthy lungs at high rates of respiratory frequency.
Another important concept that explains the dynamic behavior of the respiratory system is shown in Figure 46-7. Higher lung volumes (curve A) yield higher expiratory flow rates compared with the flow seen at lower lung volumes (curve C). In a classic set of experiments performed on normal subjects, Fry and Hyatt demonstrated that maximal expiratory flow is determined by lung volume.16 They concluded that on the basis of volume-related dynamic airway collapse, expiratory flow plateau cannot be exceeded irrespective of the magnitude of subject effort or applied transpulmonary pressure. Herein lies the value of the forced vital capacity maneuver as a reproducible measure of maximal expiratory flow.
Assessment of Respiratory System Mechanics in the Intensive Care Unit
Assuming constant flow in a relaxed or paralyzed patient without respiratory muscle contribution, pressure at the ventilator inlet increases linearly with time and volume to a peak. A typical simplified waveform output is demonstrated by Figure 46-8, with a model of the system represented on the right. Pressures are measured at the ventilator inlet or at the airway opening at the level of the “Y” connection. Assuming inflation onset with a constant (square wave) flow, an initial step change in driving pressure is recorded, which precedes alveolar filling and corresponds to resistive pressure related to gas flow in the airways (see Figure 46-8, dotted arrow). When making an end-inspiration airway occlusion after a rapid initial step-off in resistive pressure drop (Pmax–P1), there is then a gradual decrease in pressure to a plateau value (P2) (see Figure 46-8, full thick arrows). This pressure, usually reached after 3 seconds of end-inspiratory occlusion, indicates the true static end-inspiratory elastic recoil pressure of the total respiratory system (Pst,rs)17–18 and represents the static summation of elastic recoil forces corresponding to the applied tidal volume. During this period, the contribution in reduction in pressure due to volume loss by continuing gas exchange should be negligible.
The initial drop in Pmax, namely P1 divided by the preceding steady flow, provides the so-called ohmic resistances (Rmin,rs). Rmin,rs increases linearly with flow according to the Rohrer equation. The slow decrease of pressure (P1 − P2) divided by the preceding steady flow yields the effective additional resistance (ΔRs) due to the viscoelastic properties of the thoracic tissues and time constant inequalities within the lung and the chest wall (so-called pendelluft).19 The sum of Rmin,rs and ΔRs is defined as Rmax.rs.20 In a mechanically ventilated patient, where endotracheal tube resistance dominates measured total respiratory system resistance, the derived value of respiratory resistance must be interpreted with caution.
where dP = change in pressure; dt = change in time; and dV = change in volume.
where PEEP is the set end-expiratory positive pressure and PEEPi the intrinsic PEEP (see below).
and the chest wall:
For example, if the elastance of the chest wall is twice that of the lung, then two-thirds of Prs is used to distend the chest wall and only one-third to inflate the lung.21 Of note, the chest wall in this context comprises not only the thoracic rib cage but also the abdomen.
Compliance of the respiratory system can be also measured by the super syringe method. This method for static P-V curve recordings has been associated with spurious changes in lung volume because of gas absorption during measurement.22 There are also issues related to user interpretation (e.g., difficulties in defining morphologic characteristics of the curve), and interobserver variability is often high.23,24 Some have advocated inductive machine learning in an attempt to standardize interpretation.25
[/not-level-membership-for-critical-care-medicine-category]
