[level-membership-for-basic-science-category]
CHAPTER 6 Research Strategies
R esearch in cell biology aims to discover how cells work at the molecular level. Powerful tools are now available to achieve this goal. To understand how these methods contribute to the broad effort to explain cellular function, this chapter begins with a brief account of the synthetic approach used in cell biology. This strategy is based on the premise that one can understand a complex cellular process by reducing the system to its constituent parts and characterizing their properties. This approach, also called reductionism, has dominated cell biology research since the middle of the 20th century and has succeeded time after time. For example, most of what is understood about protein synthesis has come from isolating and characterizing ribosomes, messenger RNAs (mRNAs), transfer RNAs (tRNAs), and accessory factors. In this and many other cases, proof of function has been established by reconstituting a process from isolated parts of the molecular machine and verifying these conclusions with genetic experiments.
This agenda is complete for remarkably few biological processes. Bacterial chemotaxis is one example (see Figs. 27-12 and 27-13). Often, much is known about some aspects of a process, such as a partial list of participating molecules, the localization of these molecules in a cell, or a test for function by removing the genes for one or more molecules from an experimental organism. Rarely is enough information available about molecular concentrations and reaction rates to formulate a mathematical model of the process to verify that the system actually works as anticipated. Thus, much work remains to be done.
Box 6-1 is a guide for locating descriptions of methods used throughout this book. This chapter begins with imaging, one extremely valuable method for studying cells. Microscopy of live and fixed cells often provides initial hypotheses about the mechanisms of cellular process. It is also a valuable adjunct to genetic analysis and testing mechanisms. The chapter then covers a selection of other methods that are used for cell biology research.
BOX 6-1 Guide to Experimental Methods Discussed throughout This Book
| Method | Pages |
|---|---|
| Light microscopy | 86–90 |
| Electron microscopy | 90–92 |
| Gene and protein identification by classical genetics | 94–95 |
| Gene and protein identification by genomics and reverse genetics | 95–96 |
| Protein purification | 96–99 |
| Gel electrophoresis | 97 |
| Column chromatography | 98 |
| Organelle purification | 96 |
| Isolation of genes and cDNAs (PCR, cloning) | 99–102 |
| Molecular structure (hydrodynamics, X-ray crystallography, NMR) | 102 |
| Identification of binding partners by biochemistry | 102–103 |
| Identification of binding partners by genetics and genomics | 103–105 |
| Reaction rates and affinities | 105 |
| Microscopic localization of proteins and nucleic acids | 105–106 |
| Physiological tests of function by genetics | 106–107 |
Imaging
Light Microscopy
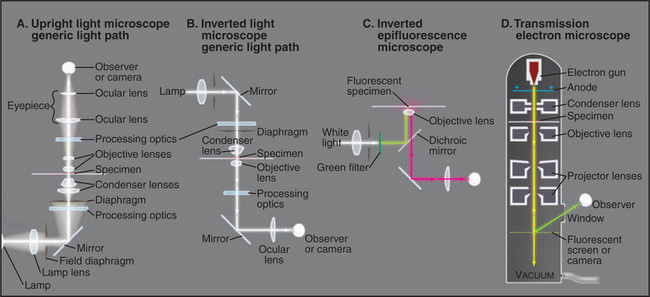
A half dozen optical tricks are used to produce contrast in light micrographs of biological specimens (Table 6-1 and Fig. 6-1). These are called wide-field methods, as a broad beam of illuminating light is focused on the specimen by a condenser lens.
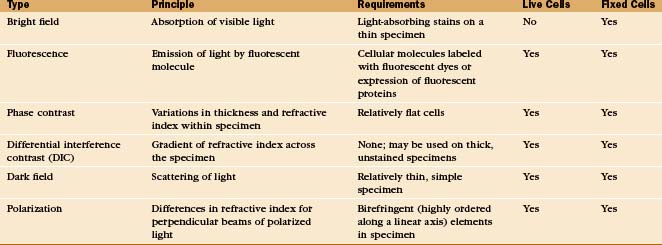
The classic light microscopic method is bright field, whereby the specimen is illuminated with pure white light. Most cells absorb very little visible light and thus show little contrast with bright-field illumination (Fig. 6-2A). For this reason, staining is used to increase light absorption and contrast. Because staining makes it difficult to see through thick tissues, specimens must also be relatively thin, about 1 mm for critical work. Slides for histologic and pathological study are produced by fixing cells with cross-linking chemicals, embedding them in paraffin or plastic, making sections with a microtome (a device that cuts a series of thin slices from the surface of a specimen), and staining with a variety of dyes (for examples, see Figs. 28-2, 28-5, 28-6, 28-7, 29-3, 29-8, 32-1, and 32-2). Alternatively, thin slices may be taken from frozen tissue and then stained. In either case, the cells are killed by fixation or sectioning prior to observation.
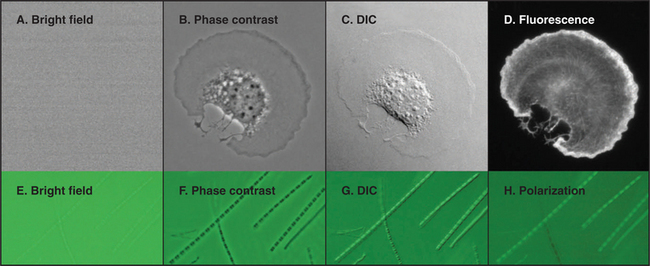
Figure 6-2 comparison of methods to produce contrast. a–d, Micrographs of a spread mouse 3T3 cell grown in tissue culture on a microscope slide, then fixed and stained with rhodamine-phalloidin, a fluorescent peptide that binds actin filaments. Contrast methods include bright field (A), phase contrast (B), differential interference contrast (C), and fluorescence (D). E–H, Micrographs of myofibrils isolated from skeletal muscle. Contrast methods include bright field (E), phase contrast (F), differential interference contrast (G), and polarization (H). The A-bands, consisting of parallel thick filaments of myosin (see Fig. 39-3), appear as dark bands with phase contrast and are birefringent (either bright or dark, depending on the orientation) with polarization.
(A–D, Courtesy of R. Mahaffy, Yale University, New Haven, Connecticut.)
Observations of live cells require other methods to produce contrast. In every case, these methods are also useful for fixed cells. Phase-contrast microscopy generates contrast by interference between light scattered by the specimen and a slightly delayed reference beam of light. Small variations in either thickness or refractive index (speed of light) can be detected, even within specimens that absorb little or no light (Fig. 6-2 B). Differential interference contrast (DIC) produces an image that looks as though it is illuminated by an oblique shaft of light (Fig. 6-2 C). What actually happens is that two nearby beams interfere with each other, producing contrast in proportion to local differences (gradient) in the refractive index across the specimen. Thus, a vesicle with a high refractive index (slow speed of light) in cytoplasm will appear light on one side (where the refractive index is increasing with respect to the cytoplasm) and dark on the other (where the refractive index is decreasing).
Fluorescence microscopy requires a fluorescent dye or protein in the specimen. Remarkable sensitivity makes fluorescence microscopy a powerful tool. Under favorable conditions, single fluorescent dyes or fluorescent protein molecules can be imaged. When a fluorescent molecule absorbs a photon of light, an electron is excited into a higher state. Nanoseconds later, a longer-wavelength (lower-energy) photon is emitted when the electron falls back to its ground state. For example, the fluorescent dye rhodamine absorbs green light (shorter wavelength) and emits red light (longer wavelength). Fluorescence microscopes use filters and special dichroic mirrors that reflect short wavelengths of light used to illuminate and excite fluorescent specimens but transmit the longer-wavelength emitted fluorescent light into the imaging system (camera). Strategically placed emission filters remove the exciting light reflected by the specimen so that only the fluorescent regions of the specimen appear bright. To provide fluorescence, a purified lipid, protein, or nucleic acid can be labeled with a fluorescent dye and injected into a live cell, where it will seek its natural location (see Figs. 37-6 and 38-9). Molecules labeled with a fluorescent dye can also be used to locate a target in a fixed and permeabilized cell. A powerful version of this strategy uses antibodies, proteins produced by the immune system (see Fig. 28-9), to react with specific molecular targets. Antibodies are tagged with fluorescent dyes and used to localize molecules in fixed cells by fluorescence microscopy (Fig. 6-3 E). This is called immunofluorescence. Another strategy is to label an oligonucleotide with a fluorescent dye to probe for nucleic acids with complementary sequences in fixed cells (see Fig. 13-15). Yet another approach is to localize individual structures, such as actin filaments, with a fluorescent dye attached to a small peptide that binds tightly to these filaments (Fig. 6-2 D).
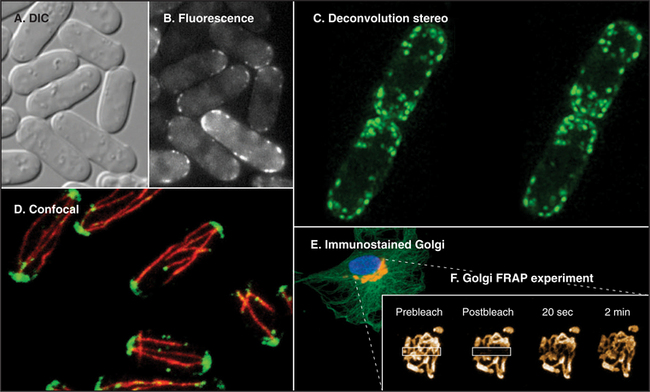
The discovery of proteins whose amino acid sequence renders them naturally fluorescent, such as green fluorescent protein (GFP) from jellyfish, made fluorescence microscopy immensely valuable for observation of individual proteins in live cells. Typically, DNA-encoding GFP is joined to one end of the coding sequence for a cellular protein and introduced into cells, which then synthesize a fusion protein consisting of GFP linked to the protein of interest. GFP fluorescence marks the fusion protein wherever it goes in the cell and can be quantified to determine how many labeled molecules reside in a particular cellular location (Fig. 6-3). Ideally, the coding sequence for GFP fusion protein is inserted into the genome of the test cell in place of the wild type gene, and the fusion protein is shown to function normally by genetic or biochemical experiments. Where this is difficult or impossible (e.g., in most studies of metazoan cells), the GFP fusion protein can be produced from exogenous DNA or RNA introduced into the cell. Mutations in GFP can change its fluorescence properties, providing probes in a range of colors and with differing sensitivities to distinct biochemical parameters in the cell, such as pH, Ca2+ concentration, and kinase activity. When attached to different protein types, these probes allow two or more protein species to be visualized simultaneously in the same cell and can serve as “biosensors” to measure changes in the intracellular environment and in a protein’s behavior/interactions.
Dark-field microscopy and polarization microscopy have specialized uses in biology. In dark-field microscopy, the specimen is illuminated at an oblique angle so that only light scattered by the specimen is collected by the objective lens. Recall how easy it is to detect tiny dust particles in a beam of light in a dark room. The contrast is so great that single microtubules stand out brightly from the dark background. However, for the images to be interpretable, the specimen must be very simple, much simpler than a cell. A dark-field image of something as complicated as cytoplasm is very confusing, owing to multiple overlapping objects that scatter light.
Like dark-field microscopy, polarization microscopy produces a bright image on a dark background. When a specimen is viewed between two crossed polarizing filters, only light whose polarization state is modified by the specimen will pass through the second polarizer to the image. Polarization microscopy relies on a specimen’s crystalline order, or birefringence, to provide contrast. Birefringent specimens, such as filaments in striated muscle (Fig. 6-2 H) or microtubules in a mitotic spindle, are aligned enough that polarized light, oriented so that it vibrates along the length of the polymers, passes through more slowly than does light vibrating perpendicular to the polymers (much as a knife cuts through meat faster with the grain than across it). Most cells do not have sufficient birefringence to produce a useful image with a conventional polarization microscope. New methods are making this approach more applicable for future work.
Computer processing can greatly enhance contrast and remove optical artifacts from images. For example, computer-enhanced DIC can image single microtubules (see Fig. 34-7). New methods of image processing can even improve detection beyond the classic limit determined by the wavelength of light (about 0.2 mm with green light). A processing method called deconvolution produces clear fluorescence images of thick specimens by using an iterative computer process to restore light that is blurred out of focus to its proper focal plane. Starting with a stack of blurry images taken at different focal planes all the way through the specimen using a traditional wide-field microscope, this method produces a remarkably detailed three-dimensional image in sharp focus throughout (Fig. 6-3 C).
Confocal microscopy also produces thin optical sections of fluorescent specimens. Rather than illuminating with a wide beam of light, this method uses a point of laser light sharply focused in all three directions: x, y, and z. The point of light is scanned across the specimen in a raster pattern (checkerboard pattern, like the electron beam in a TV) to excite fluorescent molecules. Light emitted at each consecutive point in the specimen passes through a pinhole placed next to the detector to remove any light that does not come directly from each focal point. A computer reassembles the image from the fluorescence at each point in this checkerboard of fluorescence signals (Fig. 6-3 D; see also Figs. 14-17 and 14-18 Figs. 13-12, 14-2, and 44-23). A series of confocal images taken at different planes of focus can be used for three-dimensional reconstructions.
Electron Microscopy
A transmission electron microscope (Fig. 6-1 D) can resolve points below 0.3 nm, but the practical resolution is usually limited by damage to the specimens from the electron beam and the methods used to prepare specimens. Historically, the most common method used to prepare cells for electron microscopy was to fix the specimen with chemicals, embed it in plastic, cut the specimen into thin sections, and stain the sections with heavy metals (Fig. 6-4 F). With this technique, the resolution is limited to about 3 nm, but that is sufficient to bridge the gap between light microscopy and molecular structures. During the heyday of electron microscopy in cell biology, between 1950 and 1970, thin sections revealed most of what is known about the organization of organelles in cells.
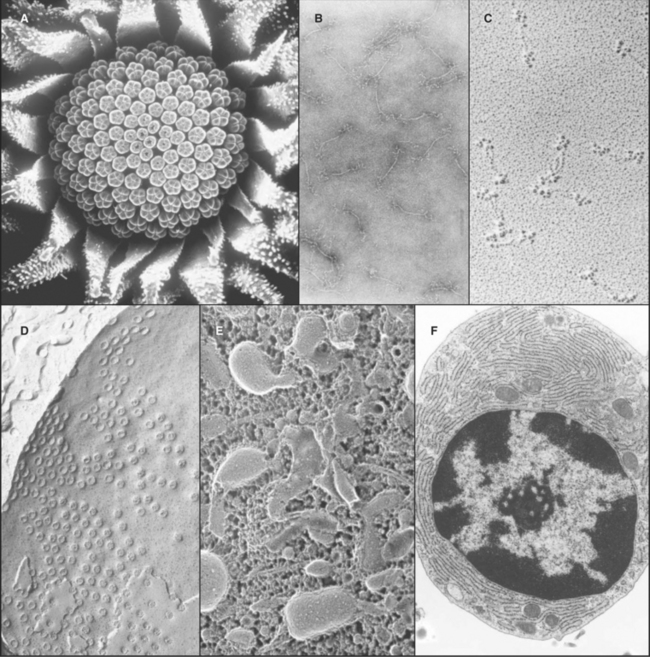
The highest resolution is attained with regular specimens, such as two-dimensional protein crystals rapidly frozen and viewed while embedded in a thin film of vitreous (i.e., amorphous, noncrystalline) ice (see Fig. 5-11A). This is called cryoelectron microscopy be-cause the stage holding the frozen specimen is cooled to liquid nitrogen temperature. Electron micrographs and electron diffraction of frozen crystals have produced structures of bacteriorhodopsin (see Fig. 7-8), aquaporin water channels (see Fig. 10-15), and tubulin (see Fig. 34-4) at resolutions of 3 to 4 nm. Computational image processing methods are used to calculate the three-dimensional structure of proteins in these regular specimens. These methods are similar to those used to calculate electron density maps from X-ray diffraction patterns (see Fig. 3-10). Although the resolution is limited and data collection is tedious in electron crystallography, electron microscopic images have the advantage of containing the phase information that is often difficult to ascertain with X-ray diffraction.
Electron microscopy is valuable for studying protein polymers and other large macromolecular specimens at less-than-atomic resolution. Diverse methods are used to prepare specimens and impart contrast. One way is to freeze filaments or macromolecular assemblies in vitreous ice, as described earlier (see Figs. 34-7 and 36-4A). A second is negative staining, whereby specimens are dried from aqueous solutions of heavy metal salts (Fig. 6-4 B). A shell of dense stain encases particles on the surface of a thin film of carbon and can preserve structural details at a resolution of about 1 nm. Alternatively, macromolecules dried on a smooth surface can be shadowed with a thin coat of metal evaporated from an electrode (Fig. 6-4 C). A variation of this approach that improves preservation is to freeze specimens rapidly, evaporate the ice surrounding the molecules, and then apply a coat of platinum (see Figs. 30-4 and 34-11).
Computer image processing of micrographs of certain types of structures can yield an average three-dimensional reconstruction of a molecular structure. Particles with helical symmetry, such as actin filaments (see Fig. 33-7) and microtubules (see Fig. 34-5), are analyzed by an image-processing method called deconvolution to reconstruct the three-dimensional structure. Single particles may also be reconstructed by first classifying images of thousands of randomly oriented particles into categories corresponding to different views. Then, an average three-dimensional structure is calculated computationally from this ensemble. One example is the Sec61p translocon associated with a ribosome (see Fig. 20-6). More recently, computing advances have led to the development of electron microscope tomography, in which many pictures are taken of a relatively thick specimen from different angles (by tilting the speci-men inside the microscope). Superimposition blurs each picture, but when they are merged together into a three-dimensional map, structures as complex as entire cells can be visualized at a resolution of a few nanometers.
Cells and tissues can also be frozen rapidly and prepared for electron microscopy without chemical fixation. In the freeze-fracture method, the frozen specimen is cleaved to expose the inside of the cells, and exposed surfaces are rotary-shadowed with a thin coat of platinum. This surface coat is then viewed by using a transmission electron microscope (Fig. 6-4 D). Frequently, the cleavage plane splits lipid bilayers in half to reveal proteins embedded in the plane of the membrane. If some of the frozen water in a fractured specimen is evaporated from the surface before shadowing, three-dimensional details of deeper parts of the cytoplasm can be revealed. A variation of this method involves extracting soluble molecules and membranes with mild detergents before freezing, fracturing, evaporating frozen water, and rotary-shadowing (Fig. 6-4 E; see also Fig. 1-13).
A scanning electron microscope (SEM) can be used on thicker specimens, such as whole cells or tissues that have been fixed, dried, and coated with a thin metal film. Here, an electron beam scans a raster pattern over the surface of specimens, and secondary electrons emitted from the surface at each point are collected and used to reconstruct an image (Fig. 6-4 A). The resolution of conventional SEM is limited, but nonetheless valuable, for studying surface features of cells and their three-dimensional relationships in tissues. SEMs that use special high-energy (field emission) guns to produce the electron beam have greatly improved resolution, and these have been very useful for studying cellular substructures, such as nuclear pores (see Fig. 14-6B).
Choice of Organisms for Biological Research
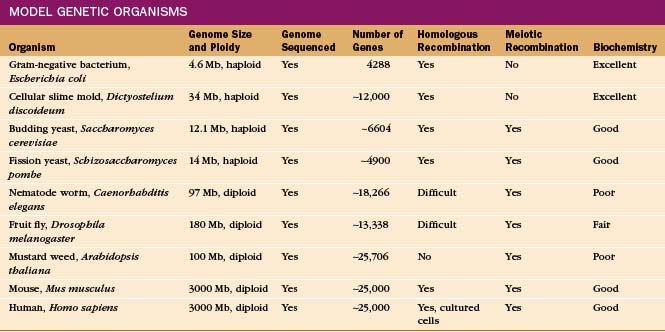
Given the origin of life from a common ancestor (see Fig. 2-1), one can learn about basic cellular processes in any organism that has the molecules of interest. It is useful to select an organism that specializes in the process, such as skeletal muscle to study contractile proteins (see Chapter 39) or Chlamydomonas to study flagella (see Fig. 38-20). Some organisms are much more amenable to investigation because communities of scientists have invested years of hard work to develop genetic, molecular genetic, and biochemical methods for experimentation. These valuable experimental tools have attracted investigators to a growing number of “model” organisms (Table 6-2).
Model Organisms
Ideal model organisms have completely sequenced genomes and facile methods to manipulate the genes, including replacement of a gene with a modified gene, by the process of homologous recombination. Haploid organisms with one copy of each chromosome after mitotic division are particularly favorable for detecting the effects of changes in genes, called mutations (Box 6-2). It is useful for a haploid organism to have a diploid stage with two copies of each chromosome and a sexual phase, during which meiotic recombination occurs between the chromosomes from the two parents. (See Fig. 45-7 for details on recombination.) This allows one to construct strains with a variety of mutations and facilitates mapping mutations to a particular gene. In addition, diploids carrying a lethal mutation of a gene that is essential for life can be propagated, provided that the mutation is recessive.
BOX 6-2 Key Genetic Terms
Complementation. Providing gene function in trans (i.e., by another copy of a gene)
Diploid. A genome with two copies of each chromosome, one from each parent
Essential Gene. A gene whose function is required for viability
Genome. The entire genetic endowment of an or-ganism
Genotype. The genetic complement, including particular mutations
Haploid. A genome with single copies of each chro-mosome
Mutant. An organism that contains a mutation of interest
Budding yeast and fission yeast meet all of these criteria, so they are widely used to study basic cellular functions. These free-living haploid organisms have a tractable diploid stage in their life cycles. Moving between haploid and diploid stages greatly simplifies the process of creating and analyzing recessive mutations. This is important because most loss-of-function mutations are recessive. Even before their genomes were sequenced, the availability of yeast for genetic, biochemical, and microscopic analysis revolutionized research in cell biology. However, yeast are solitary cells with specialized lifestyles.
Cell Culture
For multicellular organisms, it is often possible to isolate single live cells by dissociating a tissue with proteolytic enzymes and media that weaken adhesions between the cells. Many but not all isolated cells can be grown in sterile media, a method called tissue culture or cell culture. Terminally differentiated cells such as muscle or nerve cells do not reenter the cell cycle and grow. Cells that are predisposed to grow in the body including fibroblasts (see Fig. 28-4) and endothelial cells from blood vessels (see Fig. 30-13) will grow if the nutrient medium is supplemented with growth factors to drive the cell cycle (see Fig. 41-7). This is accomplished by adding fetal calf serum, which contains a particularly rich mixture of growth factors. Some cultured cells grow in suspension, but most prefer to grow on a surface of plastic or glass (Fig. 6-2), often coated with extracellular matrix molecules for adhesion (see Fig. 30-11). This is the origin of the term in vitro, meaning “in glass,” used to describe cell culture. Normal cells grow until they cover the artificial surface, when contacts with other cells arrest further growth. Dissociation and dilution of the cells onto a fresh surface allow growth to resume. Most “primary cells” isolated directly from tissues divide a limited number of times (see Fig. 12-15). Primary cells can become immortal, either through mutations or transformation by a tumor virus that overcomes cell cycle controls. Such immortal cells are called cell lines. Similar changes allow cancer cells to grow indefinitely. HeLa cells are a famous cell line derived from Henrietta Lax, an African-American patient with cervical cancer. HeLa cells have been growing in laboratories for more than half a century.
Inventory: Gene and Protein Discovery
Classical Genetics: Identification of Genes through Mutations
The approach in classical genetics is to identify mutations that compromise a particular cellular function and then to find the responsible gene(s). This approach is extremely powerful, especially when little or nothing is known about a process or when the gene product (usually a protein) is present at low concentrations. Yeast genetic studies have been spectacularly successful in mapping out complex pathways, including identification of the proteins that regulate the cell cycle (see Chapters 40 to 44) and the proteins that operate the secretory pathway (see Chapter 21).
Haploid organisms are favorable for detecting mutations because damage to the single copy of a relevant gene will alter function, and either a loss of function or a gain of function can be detected with suitable test conditions (i.e., the ability to grow under certain conditions), biochemical assay, or morphologic assay. A disadvantage is that haploid organisms are not viable following the loss of function of an essential gene. Selecting for conditional mutant alleles allows the haploid organism to survive mutation of an essential gene under permissive conditions (e.g., low temperatures) but not under restrictive conditions (e.g., high temperatures). A further advantage of haploid organisms is that one can usually identify the mutated gene by a complementation experiment. Mutant cells are induced to take up a plasmid library containing fragments of the wild-type genome or cDNAs. Plasmids are circular DNA molecules that can be propagated readily in bacteria and, if suitably designed, in eukaryotes as well. Plasmids carrying the wild-type gene will correct loss-of-function mutations, allowing colonies of cells to grow normally. Plasmids complementing the mutation are isolated and sequenced. Additional tests are required to confirm that the wild-type gene in the plasmid corresponds to the mutant gene, as in some cases, raising the level of an unrelated gene can rescue a mutant phenotype. However, once this is done, the mutant gene can be isolated and sequenced to determine the nature of the damage. This complementation test can also be used to discover genes from other species that correct the mutation in the model organism. For example, genes for human cell cycle proteins can complement many cell cycle mutations in yeast (see Chapter 40). For gain-of-function mutations, a gene library from the mutant cell is inserted into plasmids, which are then tested for their ability to cause the altered phenotype in wild-type cells.
Genetics in obligate diploid organisms is more complicated. Many mutations will appear to have no effect, provided that the corresponding gene on the other chromosome functions normally. These recessive mutations produce a phenotype only after crossing two mutant organisms, yielding 25% of offspring with two copies of the mutant gene. (Consult a genetics textbook for details on Mendelian segregation.) Other mutations will yield an altered phenotype even when only one of the two genes is affected. These dominant mutations include simple loss of function when two wild-type genes are required to make sufficient product for normal function (called haplo-insufficiency); production of an altered protein that compromises the formation of a large assembly by normal protein subunits produced by the wild-type gene (called dominant negative); and production of an unregulated protein that cannot be controlled by partners in the cell (another type of dominant negative).
Once a gene required for the function of interest is sequenced (see Fig. 3-16), the primary structure of the protein (or RNA) is deduced from translating the coding sequence with a computer. Much can be learned by identifying RNAs or proteins with similar sequences or domains in the same or other species, particularly if something is known about the function of the corresponding gene product. Protein can often be expressed from a cDNA copy of the mRNA, tested for activity and binding partners, and (when fused to GFP or when used to make an antibody) localized in cells.
Further insights regarding function are often obtained by disruption of a gene. Genomic DNA can be used to construct a plasmid that contains two substantial regions of the chromosome (usually several thousand base pairs) flanking either the entire gene to be targeted or a significant portion thereof. In the plasmid, these “targeting” regions flank a selectable marker, for example, a gene encoding resistance to a particular drug that would normally kill the cells. If introduced into cells capable of homologous recombination, the targeting regions can recombine into the chromosome, thereby replacing the DNA between the targeting sequences with the selectable marker and disrupting the gene, ideally creating a null mutation. The selectable marker is used to enrich for cells with the disrupted gene. Gene disruption is readily accomplished in yeast and, with somewhat more difficulty, in vertebrate cells but is more complicated in flies, in which this gene-targeting technology is less well developed. Fortunately, an alternative method called RNAi (for RNA interference) can lower the levels of particular mRNAs from many cells, including those in worms and cultured cells of flies and humans (discussed later, and see Fig. 16-12 for details).
Genomics and Reverse Genetics
Thanks to large-scale DNA sequencing projects, nearly complete sequences of the coding regions of the most popular experimental organism are now available (see Figs. 2-4 and 2-9). When fully annotated (i.e., all sequences coding for genes have been identified and catalogued), these genome sequences will be the definitive inventory of genes. This is easier said than done, as accurate and complete identification of genes in raw sequence data is still challenging (see Chapter 12). The task has been aided by constructing databases containing millions of sequence fragments derived from cDNA copies of expressed genes (expressed sequence tags, or ESTs), which help to document the diversity of products created by transcription and RNA processing (see Chapter 15).
Nevertheless, even before genome annotation is complete, these sequences make possible a new approach for relating genes to biological function. Given the sequence of a gene of interest, the initial strategy is to search computer databases for proteins with similar sequences and known functions to try to predict what the protein might do. This is surprisingly fruitful, as many genes occur as extended families. First, one scans the protein sequence for conserved sequence motifs (regions of a few to several hundred amino acid residues). To accomplish particular tasks, for example, to be a protein kinase, proteins use motifs that arose early in evolution and are now widely scattered throughout the genome (see Fig. 25-4). Dozens of motifs are now known (and more are discovered daily), so finding such a motif in your protein can reveal that it binds to phosphorylated tyrosine, is an enzyme that methylates other proteins, or has one of the dozens of functions that are ascribed to particular motifs. Once predicted sequences have been analyzed, one can check when and where the gene is expressed in the organism, test the consequences of deleting the gene, or test for interactions of the protein with other proteins (see later section). These tests can be done one gene at a time or on a genomewide scale. For example, investigators created strains of budding yeast lacking each of the 6000 genes and tested for interaction of the products of each of these genes with the products of all other genes. These preliminary screening tests often yield some clues about function. Ultimately, however, function is understood only when representatives of each protein family are studied in detail by the biophysical, biochemical, and cellular methods described in the following sections.
Biochemical Fractionation
The biochemical approach (to the inventory) is to purify active molecules for analysis of structure and function. This requires a sensitive, quantitative assay to detect the component of interest in crude fractions, an assay to assess purity, and a battery of methods to separate the molecule from the rest of the cellular constituents. Assays are as diverse as the processes of life. Enzymes are often easy to measure. Many molecules are detected by binding a partner molecule. For example, nucleic acids bind complementary nucleotide sequences and sequence-specific regulatory proteins; receptors bind ligands; antibodies bind their antigens; and particular proteins bind partner proteins. More difficult assays reconstitute a cellular process, such as membrane vesicle fusion, nuclear transport, or molecular motility. Devising a sensitive and specific assay is one of the most creative parts of this approach. A second prerequisite for purification is a simple method for assessing purity. Various types of gel electrophoresis often work brilliantly (Box 6-3 and Fig. 6-5).
BOX 6-3 Gel Electrophoresis
An electrical field draws molecules in a sample through a gel matrix. Agarose gels (Fig. 6-5A) are used commonly for nucleic acids, whereas polyacrylamide gels are used for both nucleic acids (see Fig. 3-16) and proteins (Fig. 6-5B). Most often, buffers are employed to dissociate the components of the sample and to make their rate of migration through the gel depend on their size. The ionic detergent sodium dodecylsulfate (SDS) serves this purpose for proteins. SDS binding unfolds polypeptide chains and gives them a uniform negative charge per unit length. Small molecules move rapidly and separate from slowly moving large molecules, which are more impeded by the matrix. By the time small molecules reach the end of the gel, all of the components in the sample are spread out according to size. Buffers containing the nonionic, denaturing agent urea also dissociate and unfold protein molecules. Electrophoresis in urea separates the proteins depending on both their charge and size. Negatively charged proteins move toward the positive electrode, whereas positively charged proteins move in the other direction. Another approach, called isoelectric focusing, uses a buffer that contains molecules called ampholines, which have both positive and negative charges. In an electrical field across a gel, ampholines set up a pH gradient. Proteins (usually dissociated in urea) migrate to the pH where they have a net charge of zero, their isoelectric point. This is a sensitive approach to detect charge differences in proteins, such as those introduced by phosphorylation. Isoelectric focusing in one gel followed by SDS-gel electrophoresis in a second dimension can resolve hundreds of individual proteins in complex samples (see Fig. 38-16A).
Many methods are available to detect molecules separated by gel electrophoresis. Proteins are detected by binding colored dyes or more sensitive metal reduction techniques. Obtaining a single stained band on a heavily loaded SDS gel is the goal of those purifying proteins. Of course, some pure proteins consist of multiple polypeptide chains (Fig. 6-5C); in such cases, multiple bands in characteristic ratios are seen. Specific proteins are often detected with antibodies. Typically, proteins are transferred electrophoretically from the polyacrylamide gel to a sheet of nitrocellulose or nylon before reaction with antibodies. This transfer step is called blotting. Antibodies labeled with radioactivity are detected by exposing a sheet of X-ray film. Antibodies are also detected by reaction with a second antibody conjugated to an enzyme that catalyzes a light-emitting reaction (chemiluminescence), which exposes a sheet of X-ray film. Some proteins can be detected by reaction with naturally occurring binding partners. Fluorescent dyes, such as ethidium bromide, bind nucleic acids (Fig. 6-5A). Following blotting of separated nucleic acids from the gel onto nitrocellulose or nylon films, specific sequences can be detected with complementary oligonucleotides or longer sequences of cloned DNA (probes) labeled with radioactivity or fluorescent dyes.
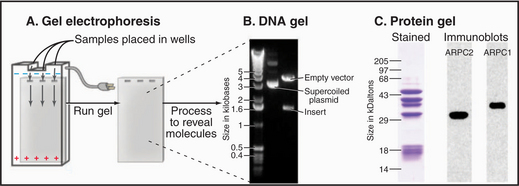
Figure 6-5 gel electrophoresis. A, Schematic diagram showing a (generic) gel with three sample wells and an electric field. B, Agarose gel electrophoresis of DNA samples stained with ethidium bromide. The lane on the left shows size standards. The middle lane has a bacterial plasmid, a supercoiled (see Fig. 3-18) circular DNA molecule carrying an insert (Fig. 6-8 provides details). The right lane has the same plasmid digested with a restriction enzyme that cleaves the DNA twice, releasing the insert. Although smaller than the circular plasmid, the empty vector runs more slowly on the gel because the linear DNA offers more resistance to movement than the supercoiled circular plasmid. C, Polyacrylamide gel electrophoresis of the Arp2/3 complex, an assembly of seven protein subunits involved with actin polymerization (see Fig. 33-13). All three samples are identical. In the left lane, the proteins are stained with the nonspecific protein dye Coomassie blue. The proteins in the other two lanes were transferred to nitrocellulose paper; each reacted with an antibody to one of the subunit proteins (ARPC2 and ARPC1). The position of the bound antibody is determined with a second antibody coupled to an enzyme that produces light and exposes a piece of film black. This method is called chemiluminescence.
(B, Courtesy of V. Sirotkin, Yale University, New Haven, Connecticut. C, Courtesy of H. Higgs, Dartmouth Medical School, Hanover, New Hampshire.)
First, the cell is disrupted gently to avoid damage to the molecule of interest. This may be accomplished physically by mechanical shearing with various types of homogenizers or, where appropriate, chemically, with mild detergents that extract lipids from cellular membranes. Next, the homogenate is centrifuged to separate particulate and soluble constituents. If the molecule of interest is soluble, it can be purified by sophisticated chromatography methods (Box 6-4 and Fig. 6-6) given sufficient starting material.
BOX 6-4 Chromatography
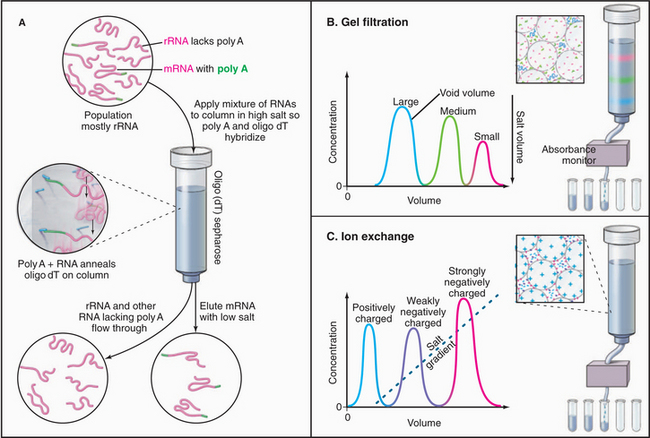
Affinity chromatography (Fig. 6-6) is the most selective purification method. A ligand that binds the target molecule is attached covalently to a solid matrix. When a complex mixture of molecules passes through the column, the target molecule binds, whereas most of the other molecules flow through. After the column is washed, the target protein is eluted by competition with free ligand or changing conditions, such as changes in pH or salt concentration. The ligand and target in Fig. 6-6 are both nucleic acids, but they can be any molecules that bind together, including pairs of proteins, drugs and proteins, proteins and nucleic acids, and so on.
If the molecule of interest is part of an organelle, centrifugation can be used to isolate the organelle. Typically, the crude cellular homogenate is centrifuged multiple times at a succession of higher speeds (and therefore forces). Particles move in a centrifugal field according to their mass and shape. Large particles such as nuclei pack into a pellet at the bottom of the centrifuge tube at low speeds, whereas high speeds are required to pellet small vesicles. These pellets may be enriched in particular organelles but are never pure. Next, the impure pellet is centrifuged for many hours in a tube containing a concentration gradient of sucrose. In sedimentation velocity gradients, particles are centrifuged in a gradient of sucrose (e.g., 5% sucrose in buffer at the top of the tube, increasing to 20% sucrose at the bottom). Because the motion of particles in a centrifugal field depends on the square of the distance from the center of the rotor (think of a spinning ice skater), the farther down the tube the particle travels, the faster it will go. However, the motion of particles in a centrifugal force field also depends on the difference between their density and that of the surrounding medium. Thus, the increasing density of sucrose gradient tends to slow the particle down. Ideally, the two factors counteract one another so that the particle moves at a constant rate, yielding the best separation. In sedimentation equilibrium gradients, particles move until their density equals that of the gradient, at which point they move no farther, regardless of how long or hard they are spun. Membrane-containing organelles can be isolated in this way in sucrose gradients. The small differences in size and buoyant density among many of the membrane-bound organelles limit the resolution of subcellular fractionation by sedimentation velocity and sedimentation equilibrium, so additional methods are useful in purifying preparations of organelles. For example, antibodies specific for a molecule on the surface of an organelle can be attached to a solid support and used to bind the organelle. Contaminating material can then be washed away. Certain particles, such as DNA or RNA molecules, are denser than sucrose. They can be centrifuged to equilibrium in gradients of dense salts, such as cesium chloride.
Once a protein of interest has been purified, the path to its gene(s) is relatively direct. Traditionally, each constituent polypeptide was cut into fragments by proteolytic enzymes, after which these fragments were isolated by chromatography and their amino acid sequence determined by Edman degradation (see Chapter 3). Given part of the amino acid sequence, the corresponding gene can then be identified in a genomic data base or isolated by using oligonucleotide probes as the assay (see next section).
Isolation of Genes and cDNAs
A variety of methods make isolation of specific nucleic acids relatively routine. Genomic DNA is isolated from whole cells by selective extraction. mRNAs are purified by affinity chromatography, taking advantage of their polyadenylate (poly A) tails (see Fig. 16-3), which bind by base pairing to poly dT attached to an insolu-ble matrix (Fig. 6-6A). Because DNA is easier to work with than RNA (e.g., it can be cleaved by restriction endonucleases and cloned), RNAs are usually converted to complementary DNA (cDNA) by reverse transcriptase, a viral DNA polymerase that uses RNA as a template.
Several options exist to purify a particular DNA from a complex mixture:
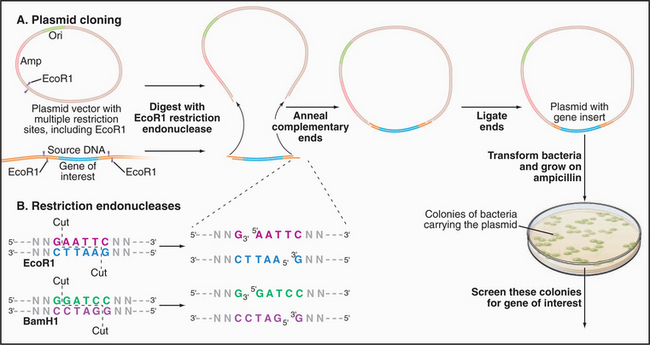
Figure 6-8 DNA CLONING. A, Cloning of a segment of DNA into a plasmid vector. The vector is a circular DNA molecule with an origin of replication (Ori) that allows it to replicate in a host bacterium. Most vectors also include one or more genes conferring antibiotic resistance—in this example, resistance to ampicillin (Amp). This enables one to select only those bacteria carrying a plasmid by the ability to grow in the presence of ampicillin. Vectors also contain a sequence of DNA with multiple restriction enzyme digestion sites (see part B) for the insertion of foreign DNA molecules. In this example, a single restriction enzyme, EcoR1, is used to cut both the source DNA and the plasmid vector, leaving both with identical single-strand overhangs. The ends of the insert and the cut vector anneal together by base pairing and are then covalently linked together by a ligase enzyme, forming a complete circle of DNA. Plasmids are introduced into bacteria, which are then grown on ampicillin to select those with plasmids. Colonies of bacteria are screened for those containing the desired insert using, for example, DNA probes for sequences specific to the gene of interest. Figure 6-5B shows gel electrophoresis of a plasmid carrying an insert before and after digestion with a restriction enzyme to liberate the insert from the vector. B, Sequence-specific cutting of DNA with restriction enzymes. EcoR1 and BamH1 are two of the hundreds of different restriction enzymes that recognize and cleave specific DNA sequences. Both of these restriction enzymes recognize a palindrome of six symmetrical bases. Note that these enzymes leave overhangs with identical sequences on both cut ends that are useful for base pairing with DNA having the same cut. Other restriction enzymes recognize and cut from 4 to 10 bases.
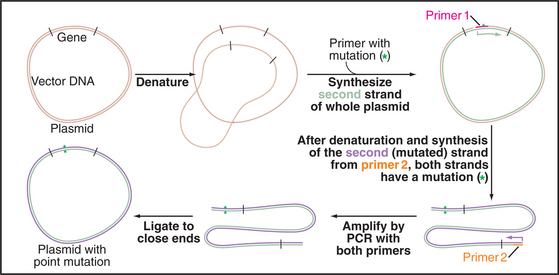
Cloned cDNAs are used to express native or modified proteins in bacteria or other cells for biochemical analysis or antibody production. This approach has two advantages. First, the quantity of protein produced is often far greater than that from the natural source. Second, cloned DNA can readily be modified by site-directed mutagenesis to make predetermined amino acid substitutions and other alterations that are useful for studying protein function (Fig. 6-9). The behavior of mutant proteins in cells can provide evidence for the role of a given protein in particular cellular functions. Thus, biochemical, genetic, and molecular cloning approaches may be applied collectively to reveal the function of proteins.
Molecular Structure
Primary Structure
DNA sequences are now determined by automated dye-termination methods (see Fig. 3-16). The same automated dye-termination methods, when applied to cDNAs, are used to deduce the sequence of proteins and structural RNAs. Protein sequencing by Edman degradation is still occasionally used to detect modified amino acids (see Fig. 3-3); however, mass spectrometry is faster and more sensitive.
Subunit Composition
Gel electrophoresis of many isolated proteins has revealed that they consist of more than one polypeptide chain. Their stoichiometry can be determined from the size and intensity of the stained bands on the gel, but the only way to determine the total number of subunits is to measure the molecular weight of the native protein or protein assembly. The definitive method is a sedimentation equilibrium experiment carried out in an analytical ultracentrifuge. A sample of purified material is centrifuged in a physiological salt solution at relatively low speed in a rotor that allows the measurement of the mass concentration from the top to bottom of the sample cell. At equilibrium, the sedimentation of the material toward the bottom of the tube is balanced by diffusion from the region of high concentration at the bottom of the tube. This balance between sedimentation and diffusion uniquely defines the molecular weight of the particle. A less direct approach to measuring the molecular weight of the native protein or protein assembly is to measure the sedimentation coefficient (the parameter relating the rate of sedimentation to the centrifugal force) during centrifugation at high speed and to measure the diffusion coefficient separately, most often by analytical gel filtration (Fig. 6-6B). These two parameters are used to calculate the molecular weight. (Note that neither measurement separately is sufficient to measure molecular weights, despite numerous assertions in the literature that they are sufficient!) An advantage of the latter approach is that it can be used with impure material, provided that an assay is available that is applicable to the two types of measurements. Light scattering can also be used to estimate molecular weights.
Atomic Structure
X-ray crystallography and nuclear magnetic resonance (NMR) spectroscopy are used to determine the structure of proteins and nucleic acids at atomic resolution (see Fig. 3-8). Although X-ray crystallography has determined structures as large as the ribosome (see Fig. 17-7) and viruses (see Figs. 5-11 and 5-14), some large structures are currently outside the size range of this high-resolution method. Alternatively, large structures can be studied by electron microscopy of single particles or regular assemblies. If available from crystallography or NMR, atomic structures of subunits can be fit into lower-resolution reconstructions of large assemblies made by electron microscopy (see Figs. 36-4 and 36-10). NMR avoids the requirement to crystallize the protein to be studied, but the protein must be soluble at high concentrations, and NMR is difficult for proteins larger than 20 kD.
Partners and Pathways
It is hard to think of a cellular molecule that functions in isolation, as virtually all cellular components are parts of assemblies, networks, or pathways. Thus, a major challenge in defining biological function is to place each molecule in its physiological context with all of its molecular partners. The classic example of such an endeavor is the biochemical mapping of major metabolic pathways (see Fig. 19-4 or a biochemistry textbook). Genetics played a prominent role in the discovery of the network of proteins that control the cell cycle (see Fig. 40-2). Currently, signaling, regulation of gene expression, membrane trafficking, and the control of development are pathways of particular interest.
Biochemical Methods
Once a molecule of interest has been purified, finding partners with which it functions in the cell is often the next step. This requires a method to separate the macromolecular complex containing the molecule being studied away from other cellular proteins. One approach is affinity chromatography with the probe molecule attached by a chemical crosslink to an insoluble support, such as small beads. A popular variation is to express a probe protein fused to GST that can be bound with high affinity to a small molecule attached to beads. A crude cellular extract is run through the column with immobilized probe molecules and washed. Then molecules bound to the probe are eluted with high salt, extremes of pH, specific ligands, or, if necessary, with denaturing agents, such as urea. Eluted proteins are analyzed by gel electrophoresis and identified with antibodies, sequencing, or mass spectrometry. Eluted nucleic acids are cloned and sequenced.
Genetics
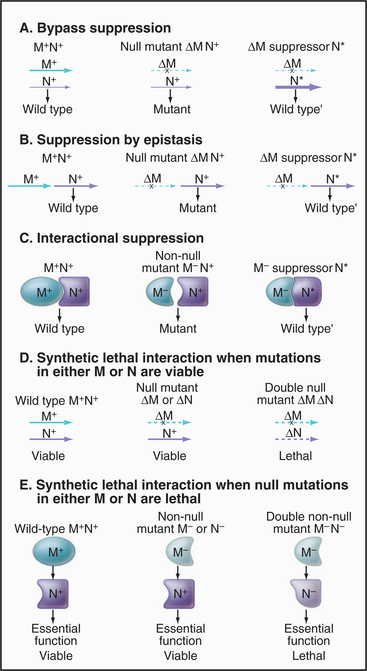
Given a mutation in a gene of interest, two genetic tests are used to search for partners: (1) identification of a second mutation that ameliorates the effects of the pri-mary mutation (a suppressor mutation, Fig. 6-10A–B) and (2) identification of a second mutation that makes the phenotype more severe, often lethal (an enhanc-er mutation [Fig. 6-10 C–E]). A specialized class of enhancer mutations, called synthetic lethal mutations, is particularly useful in the analysis of genetic pathways in yeast. In this case, mutations in two genes in the same pathway, if present in the same cell, even as heterozygotes (i.e., each cell having one good and one mutant copy of each gene), cannot be tolerated, so the cell dies. It is thought that each mutation lowers the level of production of some critical factor just a bit and that the combination of the two effectively means that the output of the pathway is insufficient for survival. These tests can be made with existing collections of mutations by genetically crossing mutant organisms. Alternatively, one can seek new mutations created by a second round of mutagenesis. The results depend on the architecture of the particular pathway. If the products of the genes in question operate in a sequence, analysis of single and double mutants can often reveal their order in the pathway. For essential genes in haploid organisms, a conditional allele of the primary mutation simplifies the experiment. Synthetic interactions (suppression or lethality) may also be discovered by overproduction of wild-type genes on a plasmid. Caution is required in interpreting suppressor and enhancer mutations, given the complexity of cellular systems and the possibility of unanticipated consequences of the mutations.
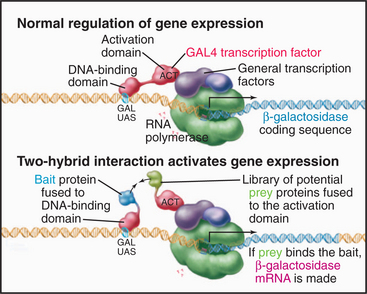
Another approach to find protein partners is called a two-hybrid assay (Fig. 6-11). This assay depends on the observation that some activators of transcription have two modular domains with discrete functions: One domain binds target sites on DNA, and the other recruits the transcriptional apparatus (see Fig. 15-19). The target gene is expressed if both activities are present at the transcription start site, even if the activities are on two different proteins. For the two-hybrid assay, the coding sequence of the protein whose partners are to be identified is fused to the coding sequence of a yeast protein that recognizes a target DNA sequence upstream of a gene that provides the readout of the assay. This so-called bait protein is expressed constitutively in yeast cells. A plasmid library is constructed consisting of cDNA sequences of all possible interaction partners (“prey”), each fused to the coding sequence of an “activator domain” and a nuclear localization sequence. This library of “prey” proteins is introduced into the “bait” yeast strain. The readout gene is expressed if a “prey” protein binds the “bait” protein and recruits the transcriptional apparatus. Many variations of this assay exist. One produces an enzyme that makes a colored product, so colonies of yeast with interacting proteins can be identified visually. In another version, the target gene encodes a gene essential for production of a particular amino acid, so only cells with a bait-prey interaction will grow on agar plates lacking that amino acid. Putative interactions must subsequently be tested carefully to define specificity, as false-positive results are common. Moreover, some valid interactions are missed owing to false-negative results.
Large-Scale Screening with Microarrays
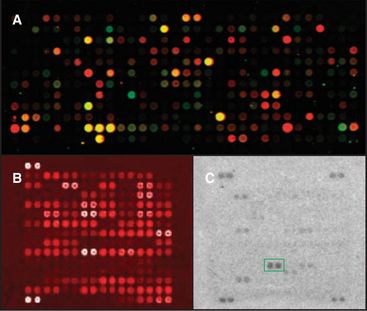
Microarrays display thousands of tiny spots on a glass slide, each with a particular DNA sequence or protein (Fig. 6-12). This allows many reactions to be monitored in parallel. One type of microarray has cDNAs or oligonucleotides for thousands of genes. Probing such an array with complementary copies of mRNAs from a test sample reveals which genes are expressed. This can be used to find partners, because expression of genes contributing proteins to a particular pathway is often coordinated as conditions change. For example, unfolded proteins in the lumen of the endoplasmic reticulum trigger the expression of nearly 300 genes for proteins of the endoplasmic reticulum (see Fig. 20-11). Microarrays of thousands of different proteins can be used to test for interactions. For example, reaction of protein arrays with each yeast protein kinase, one kinase per slide, identified the substrates phosphorylated by each kinase (Fig. 6-12B).
Rates and Affinities
Information about reaction rates is important for two reasons. First, reaction rates are required to account for the dynamic aspects of any biological system. Second, although the methods in the previous section usually provide initial clues about the integration of proteins into pathways, knowledge of reactant concentrations and rate constants is the only way to fully understand biochemical pathways. Fortunately, just two types of reactions occur in biology: first-order reactions, such as conformational changes and dissociation of molecular complexes, and second-order reactions between two molecules. Chapter 4 explains the rate constants for such reactions, the relationship of rate constants to the equilibrium constant for a reaction, and the relationship of the equilibrium constant to thermodynamics. Figure 4-7 illustrates how transient kinetics experiments were used to determine the mechanism of the Ras GTPase (see Fig. 4-6).
Tests of Physiological Function
Reconstitution of Function from Isolated Components
The classic biochemical test of function is reconstitution of a biological process from purified components. This involves creating conditions in the test tube in which isolated molecules can perform a complex process normally carried out by a cell. The difficulty of the task depends on the complexity of the function. Successful reconstitution experiments reveal the molecular requirements and mechanisms involved in a process. Examples of successful tests include reconstitution of ion channel function in pure lipid membranes (see Chapter 10), protein synthesis and translocation of proteins into the endoplasmic reticulum (see Fig. 20-7), and motility of bacteria powered by assembly of actin filaments (see Fig. 37-12).
Anatomic Tests
No biological process can be understood without knowledge of where the components are located in the cell. Often, cellular localization of a newly discovered molecule provides the first clue about its function. This accounts for why cell biologists put so much effort into localizing molecules in cells. Cell fractionation, fluorescent antibody staining, and expression of GFP fusion proteins are all valuable approaches, illustrated by numerous examples in this book. For more detailed localization, antibodies can be adsorbed to small gold beads and used to label fixed specimens for electron microscopy (see Fig. 29-7).
The use of GFP fusions to study cellular dynamics has yielded many surprises, as structures that were thought to be inert have turned out to be remarkably dynamic. One powerful technique is to photobleach the GFP fusion protein in one part of the cell and to observe how the fluorescent proteins in other parts of the cell redistribute with time (fluorescence recovery after photobleaching, or FRAP; see Fig. 6-3E). The speed of fluorescence recovery into the photobleached area provides information on the mobility of the fusion protein (i.e., whether it diffuses freely, is immobilized on a scaffold, or is actively transported) and its interaction properties within the cell (see Figs. 7-11 and 14-4). These properties play important roles in how a protein functions within a cell, which cannot be determined by merely observing the protein’s steady-state distribution.
Physiological Tests
RNA interference (RNAi) is a powerful method to reduce the concentration of a particular RNA, especially mRNAs (see Fig. 16-12). Introducing a double-stranded RNA copy of part of an RNA sequence into the cytoplasm generates a response that results in the degradation of the target RNA. Animals, fungi, and plants use this process to suppress expression of foreign RNAs, such as those introduced by viruses. If double-stranded RNA is introduced into cells, it is fragmented into pieces of about 21 nucleotides (see Fig. 16-12). Base pairing of these fragments with cellular RNAs having the complementary sequence (usually an exact match is required) targets the RNA for cleavage. To suppress a particular RNA in human cells experimentally, one synthesizes a double-stranded RNA including a sequence of 21 nucleotides matching the target cellular RNA. Introduction of this oligonucleotide into cells often (not always) results in destruction of the target RNA. If successful, the level of the targeted protein falls 5- to 10-fold as it is degraded naturally over the next several days. Loss of the protein may produce a cellular phenotype. RNAs and proteins can be depleted from Drosophila and Caenorhabditis elegans by using slightly different procedures. The simplicity of this approach makes RNAi very powerful and suitable for scaling up to study thousands of genes. However, false-negative results are common because some targeted protein usually remains. If the protein is an enzyme, a few protein molecules can turn over numerous substrate molecules and maintain function. One must also be cautious regarding other unanticipated consequences.
Genetics is the best way to replace a native protein with a protein that has altered biochemical properties. Such gene replacement requires homologous recombination in the genome, which is not readily available in all experimental systems (Table 6-2). Examples of altered proteins include an enzyme with an altered catalytic function or a protein with altered affinity for a particular cellular partner. In the best cases, the altered protein is fully characterized before its coding sequence is used to replace that of the wild-type protein, and the cellular concentration of the altered protein is confirmed to be the same as the wild-type protein. On the relatively long time scale of such experiments (up to a year in vertebrates), interpreting the outcome may be compromised by the ability of cells to adapt to the change imposed by the gene substitution in un-known ways.
Altieri AS, Byrd TA. Automation of NMR structure determination of proteins. Curr Opin Struct Biol. 2004;14:547-553.
Bader GD, Heilbut A, Andrews B, et al. Functional genomics and proteomics: Charting a multidimensional map of the yeast cell. Trends Cell Biol. 2003;13:344-356.
Brent R, Finley RLJ. Understanding gene and allele function with two-hybrid methods. Ann Rev Genet. 1997;31:663-704.
Carthew RW. Gene silencing by double-stranded RNA. Curr Opin Cell Biol. 2001;13:244-248.
Celis J, editor. Cell Biology: A Laboratory Handbook, vols 1-3. New York: Academic Press, 1994.
Danuser G, Waterman-Storer CM. Quantitative fluorescent speckle microscopy of cytoskeleton dynamics. Annu Rev Biophys Biomol Struct. 2006;35:361-387.
Falk MM. Genetic tags for labelling live cells: Gap junctions and beyond. Trends Cell Biol. 2002;12:399-404.
Frank J. Single-particle imaging of macromolecules by cryo-electron microscopy. Annu Rev Biophys Biomol Struct. 2002;31:303-319.
Frey TG, Perkins GA, Ellisman MH. Electron tomography of membrane-bound cellular organelles. Annu Rev Biophys Biomol Struct. 2006;35:199-224.
Gariepy J, Kawamura K. Vectorial delivery of macromolecules into cells using peptide-based vehicles. Trends Biotechnol. 2001;19:21-28.
Guarente L. Strategies for the identification of interacting proteins. Proc Natl Acad Sci U S A. 1993;90:1639-1641.
Guarente L. Synthetic enhancement in gene interaction: A genetic tool come of age. Trends Genet. 1993;9:362-366.
Hahn K, Toutchkine A. Live-cell fluorescent biosensors for activated signaling proteins. Curr Opin Cell Biol. 2002;14:167-172.
Inoué S. Video Microscopy. New York: Plenum Press, 1986.
Inoué S, Oldenbourg R. Microscopes. Bass M, Van Stryland EW, Williams DR, Wolf WL, editors. Handbook of Optics, vol 2. New York: McGraw-Hill. 1995:17.1-17.52.
International Human Genome Sequencing Consortium. Initial sequencing and analysis of the human genome. Nature. 2001;409:860-921. [Also see related articles in the same issue.]
Mayer TU. Chemical genetics: Tailoring tools for cell biology. Trends Cell Biol. 2003;13:270-277.
McIntosh JR, Nicastro D, Mastronarde D. New views of cells in 3D: An introduction to electron tomography. Trends Cell Biol. 2005;15:43-51.
Mogilner A, Wollman R, Marshall WF. Quantitative modeling in cell biology: What good is it? Dev Cell. 2006;11:1-9.
Murphy DB. Fundamentals of Light Microscopy and Electronic Imaging. New York: Wiley-Liss, 2001.
Panda S, Sato TK, Hampton GM, Hogenesch JB. An array of insights: Application of DNA chip technology in the study of cell biology. Trends Cell Biol. 2003;13:151-156.
Papin JA, Price ND, Wiback SJ, et al. Metabolic pathways in the post-genome era. Trends Biochem Sci. 2003;28:250-258.
Sambrook J, Russell D. Molecular Cloning, 3rd ed. Plainview, NY: Cold Spring Harbor Laboratory, 2001.
Slayter EM. Optical Methods in Biology. New York: Wiley-Interscience, 1970.
Slepchenko BM, Schaff JC, Carson JH, Loew LM. Computational cell biology: Spatiotemporal simulation of cellular events. Annu Rev Biophys Biomolec Struct. 2002;31:423-441.
Steven AC, Aebi U. The next ice age: Cryo-electron tomography of intact cells. Trends Cell Biol. 2003;13:107-110.
Subramaniam S, Milne JLS. Three-dimensional electron microscopy at molecular resolution. Annu Rev Biophys Biomolec Struct. 2004;33:141-155.
Wu RZ, Bailey SN, Sabatini DM. Cell-biological applications of transfected-cell microarrays. Trends Cell Biol. 2002;12:485-488.
Xia Y, Yu H, Jansen R, et al. Analyzing cellular biochemistry in terms of molecular networks. Annu Rev Biochem. 2004;73:1051-1087.
Yates JRIII. Mass spectral analysis in proteomics. Annu Rev Biophys Biomolec Struct. 2004;33:297-316.
Zhu H, Bilgin M, Snyder M. Proteomics. Annu Rev Biochem. 2003;72:783-812.
[/level-membership-for-basic-science-category][not-level-membership-for-basic-science-category]
CHAPTER 6 Research Strategies
R esearch in cell biology aims to discover how cells work at the molecular level. Powerful tools are now available to achieve this goal. To understand how these methods contribute to the broad effort to explain cellular function, this chapter begins with a brief account of the synthetic approach used in cell biology. This strategy is based on the premise that one can understand a complex cellular process by reducing the system to its constituent parts and characterizing their properties. This approach, also called reductionism, has dominated cell biology research since the middle of the 20th century and has succeeded time after time. For example, most of what is understood about protein synthesis has come from isolating and characterizing ribosomes, messenger RNAs (mRNAs), transfer RNAs (tRNAs), and accessory factors. In this and many other cases, proof of function has been established by reconstituting a process from isolated parts of the molecular machine and verifying these conclusions with genetic experiments.
This agenda is complete for remarkably few biological processes. Bacterial chemotaxis is one example (see Figs. 27-12 and 27-13). Often, much is known about some aspects of a process, such as a partial list of participating molecules, the localization of these molecules in a cell, or a test for function by removing the genes for one or more molecules from an experimental organism. Rarely is enough information available about molecular concentrations and reaction rates to formulate a mathematical model of the process to verify that the system actually works as anticipated. Thus, much work remains to be done.
Box 6-1 is a guide for locating descriptions of methods used throughout this book. This chapter begins with imaging, one extremely valuable method for studying cells. Microscopy of live and fixed cells often provides initial hypotheses about the mechanisms of cellular process. It is also a valuable adjunct to genetic analysis and testing mechanisms. The chapter then covers a selection of other methods that are used for cell biology research.
BOX 6-1 Guide to Experimental Methods Discussed throughout This Book
| Method | Pages |
|---|---|
| Light microscopy | 86–90 |
| Electron microscopy | 90–92 |
| Gene and protein identification by classical genetics | 94–95 |
| Gene and protein identification by genomics and reverse genetics | 95–96 |
| Protein purification | 96–99 |
| Gel electrophoresis | 97 |
| Column chromatography | 98 |
| Organelle purification | 96 |
| Isolation of genes and cDNAs (PCR, cloning) | 99–102 |
| Molecular structure (hydrodynamics, X-ray crystallography, NMR) | 102 |
| Identification of binding partners by biochemistry | 102–103 |
| Identification of binding partners by genetics and genomics | 103–105 |
| Reaction rates and affinities | 105 |
| Microscopic localization of proteins and nucleic acids | 105–106 |
| Physiological tests of function by genetics | 106–107 |
Imaging
Light Microscopy
A half dozen optical tricks are used to produce contrast in light micrographs of biological specimens (Table 6-1 and Fig. 6-1). These are called wide-field methods, as a broad beam of illuminating light is focused on the specimen by a condenser lens.
The classic light microscopic method is bright field, whereby the specimen is illuminated with pure white light. Most cells absorb very little visible light and thus show little contrast with bright-field illumination (Fig. 6-2A). For this reason, staining is used to increase light absorption and contrast. Because staining makes it difficult to see through thick tissues, specimens must also be relatively thin, about 1 mm for critical work. Slides for histologic and pathological study are produced by fixing cells with cross-linking chemicals, embedding them in paraffin or plastic, making sections with a microtome (a device that cuts a series of thin slices from the surface of a specimen), and staining with a variety of dyes (for examples, see Figs. 28-2, 28-5, 28-6, 28-7, 29-3, 29-8, 32-1, and 32-2). Alternatively, thin slices may be taken from frozen tissue and then stained. In either case, the cells are killed by fixation or sectioning prior to observation.
Figure 6-2 comparison of methods to produce contrast. a–d, Micrographs of a spread mouse 3T3 cell grown in tissue culture on a microscope slide, then fixed and stained with rhodamine-phalloidin, a fluorescent peptide that binds actin filaments. Contrast methods include bright field (A), phase contrast (B), differential interference contrast (C), and fluorescence (D). E–H, Micrographs of myofibrils isolated from skeletal muscle. Contrast methods include bright field (E), phase contrast (F), differential interference contrast (G), and polarization (H). The A-bands, consisting of parallel thick filaments of myosin (see Fig. 39-3), appear as dark bands with phase contrast and are birefringent (either bright or dark, depending on the orientation) with polarization.
(A–D, Courtesy of R. Mahaffy, Yale University, New Haven, Connecticut.)
Observations of live cells require other methods to produce contrast. In every case, these methods are also useful for fixed cells. Phase-contrast microscopy generates contrast by interference between light scattered by the specimen and a slightly delayed reference beam of light. Small variations in either thickness or refractive index (speed of light) can be detected, even within specimens that absorb little or no light (Fig. 6-2 B). Differential interference contrast (DIC) produces an image that looks as though it is illuminated by an oblique shaft of light (Fig. 6-2 C). What actually happens is that two nearby beams interfere with each other, producing contrast in proportion to local differences (gradient) in the refractive index across the specimen. Thus, a vesicle with a high refractive index (slow speed of light) in cytoplasm will appear light on one side (where the refractive index is increasing with respect to the cytoplasm) and dark on the other (where the refractive index is decreasing).
Fluorescence microscopy requires a fluorescent dye or protein in the specimen. Remarkable sensitivity makes fluorescence microscopy a powerful tool. Under favorable conditions, single fluorescent dyes or fluorescent protein molecules can be imaged. When a fluorescent molecule absorbs a photon of light, an electron is excited into a higher state. Nanoseconds later, a longer-wavelength (lower-energy) photon is emitted when the electron falls back to its ground state. For example, the fluorescent dye rhodamine absorbs green light (shorter wavelength) and emits red light (longer wavelength). Fluorescence microscopes use filters and special dichroic mirrors that reflect short wavelengths of light used to illuminate and excite fluorescent specimens but transmit the longer-wavelength emitted fluorescent light into the imaging system (camera). Strategically placed emission filters remove the exciting light reflected by the specimen so that only the fluorescent regions of the specimen appear bright. To provide fluorescence, a purified lipid, protein, or nucleic acid can be labeled with a fluorescent dye and injected into a live cell, where it will seek its natural location (see Figs. 37-6 and 38-9). Molecules labeled with a fluorescent dye can also be used to locate a target in a fixed and permeabilized cell. A powerful version of this strategy uses antibodies, proteins produced by the immune system (see Fig. 28-9), to react with specific molecular targets. Antibodies are tagged with fluorescent dyes and used to localize molecules in fixed cells by fluorescence microscopy (Fig. 6-3 E). This is called immunofluorescence. Another strategy is to label an oligonucleotide with a fluorescent dye to probe for nucleic acids with complementary sequences in fixed cells (see Fig. 13-15). Yet another approach is to localize individual structures, such as actin filaments, with a fluorescent dye attached to a small peptide that binds tightly to these filaments (Fig. 6-2 D).
The discovery of proteins whose amino acid sequence renders them naturally fluorescent, such as green fluorescent protein (GFP) from jellyfish, made fluorescence microscopy immensely valuable for observation of individual proteins in live cells. Typically, DNA-encoding GFP is joined to one end of the coding sequence for a cellular protein and introduced into cells, which then synthesize a fusion protein consisting of GFP linked to the protein of interest. GFP fluorescence marks the fusion protein wherever it goes in the cell and can be quantified to determine how many labeled molecules reside in a particular cellular location (Fig. 6-3). Ideally, the coding sequence for GFP fusion protein is inserted into the genome of the test cell in place of the wild type gene, and the fusion protein is shown to function normally by genetic or biochemical experiments. Where this is difficult or impossible (e.g., in most studies of metazoan cells), the GFP fusion protein can be produced from exogenous DNA or RNA introduced into the cell. Mutations in GFP can change its fluorescence properties, providing probes in a range of colors and with differing sensitivities to distinct biochemical parameters in the cell, such as pH, Ca2+ concentration, and kinase activity. When attached to different protein types, these probes allow two or more protein species to be visualized simultaneously in the same cell and can serve as “biosensors” to measure changes in the intracellular environment and in a protein’s behavior/interactions.
Dark-field microscopy and polarization microscopy have specialized uses in biology. In dark-field microscopy, the specimen is illuminated at an oblique angle so that only light scattered by the specimen is collected by the objective lens. Recall how easy it is to detect tiny dust particles in a beam of light in a dark room. The contrast is so great that single microtubules stand out brightly from the dark background. However, for the images to be interpretable, the specimen must be very simple, much simpler than a cell. A dark-field image of something as complicated as cytoplasm is very confusing, owing to multiple overlapping objects that scatter light.
Like dark-field microscopy, polarization microscopy produces a bright image on a dark background. When a specimen is viewed between two crossed polarizing filters, only light whose polarization state is modified by the specimen will pass through the second polarizer to the image. Polarization microscopy relies on a specimen’s crystalline order, or birefringence, to provide contrast. Birefringent specimens, such as filaments in striated muscle (Fig. 6-2 H) or microtubules in a mitotic spindle, are aligned enough that polarized light, oriented so that it vibrates along the length of the polymers, passes through more slowly than does light vibrating perpendicular to the polymers (much as a knife cuts through meat faster with the grain than across it). Most cells do not have sufficient birefringence to produce a useful image with a conventional polarization microscope. New methods are making this approach more applicable for future work.
Computer processing can greatly enhance contrast and remove optical artifacts from images. For example, computer-enhanced DIC can image single microtubules (see Fig. 34-7). New methods of image processing can even improve detection beyond the classic limit determined by the wavelength of light (about 0.2 mm with green light). A processing method called deconvolution produces clear fluorescence images of thick specimens by using an iterative computer process to restore light that is blurred out of focus to its proper focal plane. Starting with a stack of blurry images taken at different focal planes all the way through the specimen using a traditional wide-field microscope, this method produces a remarkably detailed three-dimensional image in sharp focus throughout (Fig. 6-3 C).
Confocal microscopy also produces thin optical sections of fluorescent specimens. Rather than illuminating with a wide beam of light, this method uses a point of laser light sharply focused in all three directions: x, y, and z. The point of light is scanned across the specimen in a raster pattern (checkerboard pattern, like the electron beam in a TV) to excite fluorescent molecules. Light emitted at each consecutive point in the specimen passes through a pinhole placed next to the detector to remove any light that does not come directly from each focal point. A computer reassembles the image from the fluorescence at each point in this checkerboard of fluorescence signals (Fig. 6-3 D; see also Figs. 14-17 and 14-18 Figs. 13-12, 14-2, and 44-23). A series of confocal images taken at different planes of focus can be used for three-dimensional reconstructions.
Electron Microscopy
A transmission electron microscope (Fig. 6-1 D) can resolve points below 0.3 nm, but the practical resolution is usually limited by damage to the specimens from the electron beam and the methods used to prepare specimens. Historically, the most common method used to prepare cells for electron microscopy was to fix the specimen with chemicals, embed it in plastic, cut the specimen into thin sections, and stain the sections with heavy metals (Fig. 6-4 F). With this technique, the resolution is limited to about 3 nm, but that is sufficient to bridge the gap between light microscopy and molecular structures. During the heyday of electron microscopy in cell biology, between 1950 and 1970, thin sections revealed most of what is known about the organization of organelles in cells.
The highest resolution is attained with regular specimens, such as two-dimensional protein crystals rapidly frozen and viewed while embedded in a thin film of vitreous (i.e., amorphous, noncrystalline) ice (see Fig. 5-11A). This is called cryoelectron microscopy be-cause the stage holding the frozen specimen is cooled to liquid nitrogen temperature. Electron micrographs and electron diffraction of frozen crystals have produced structures of bacteriorhodopsin (see Fig. 7-8), aquaporin water channels (see Fig. 10-15), and tubulin (see Fig. 34-4) at resolutions of 3 to 4 nm. Computational image processing methods are used to calculate the three-dimensional structure of proteins in these regular specimens. These methods are similar to those used to calculate electron density maps from X-ray diffraction patterns (see Fig. 3-10). Although the resolution is limited and data collection is tedious in electron crystallography, electron microscopic images have the advantage of containing the phase information that is often difficult to ascertain with X-ray diffraction.
Electron microscopy is valuable for studying protein polymers and other large macromolecular specimens at less-than-atomic resolution. Diverse methods are used to prepare specimens and impart contrast. One way is to freeze filaments or macromolecular assemblies in vitreous ice, as described earlier (see Figs. 34-7 and 36-4A). A second is negative staining, whereby specimens are dried from aqueous solutions of heavy metal salts (Fig. 6-4 B). A shell of dense stain encases particles on the surface of a thin film of carbon and can preserve structural details at a resolution of about 1 nm. Alternatively, macromolecules dried on a smooth surface can be shadowed with a thin coat of metal evaporated from an electrode (Fig. 6-4 C). A variation of this approach that improves preservation is to freeze specimens rapidly, evaporate the ice surrounding the molecules, and then apply a coat of platinum (see Figs. 30-4 and 34-11).
Computer image processing of micrographs of certain types of structures can yield an average three-dimensional reconstruction of a molecular structure. Particles with helical symmetry, such as actin filaments (see Fig. 33-7) and microtubules (see Fig. 34-5), are analyzed by an image-processing method called deconvolution to reconstruct the three-dimensional structure. Single particles may also be reconstructed by first classifying images of thousands of randomly oriented particles into categories corresponding to different views. Then, an average three-dimensional structure is calculated computationally from this ensemble. One example is the Sec61p translocon associated with a ribosome (see Fig. 20-6). More recently, computing advances have led to the development of electron microscope tomography, in which many pictures are taken of a relatively thick specimen from different angles (by tilting the speci-men inside the microscope). Superimposition blurs each picture, but when they are merged together into a three-dimensional map, structures as complex as entire cells can be visualized at a resolution of a few nanometers.
Cells and tissues can also be frozen rapidly and prepared for electron microscopy without chemical fixation. In the freeze-fracture method, the frozen specimen is cleaved to expose the inside of the cells, and exposed surfaces are rotary-shadowed with a thin coat of platinum. This surface coat is then viewed by using a transmission electron microscope (Fig. 6-4 D). Frequently, the cleavage plane splits lipid bilayers in half to reveal proteins embedded in the plane of the membrane. If some of the frozen water in a fractured specimen is evaporated from the surface before shadowing, three-dimensional details of deeper parts of the cytoplasm can be revealed. A variation of this method involves extracting soluble molecules and membranes with mild detergents before freezing, fracturing, evaporating frozen water, and rotary-shadowing (Fig. 6-4 E; see also Fig. 1-13).
A scanning electron microscope (SEM) can be used on thicker specimens, such as whole cells or tissues that have been fixed, dried, and coated with a thin metal film. Here, an electron beam scans a raster pattern over the surface of specimens, and secondary electrons emitted from the surface at each point are collected and used to reconstruct an image (Fig. 6-4 A). The resolution of conventional SEM is limited, but nonetheless valuable, for studying surface features of cells and their three-dimensional relationships in tissues. SEMs that use special high-energy (field emission) guns to produce the electron beam have greatly improved resolution, and these have been very useful for studying cellular substructures, such as nuclear pores (see Fig. 14-6B).
Choice of Organisms for Biological Research
Given the origin of life from a common ancestor (see Fig. 2-1), one can learn about basic cellular processes in any organism that has the molecules of interest. It is useful to select an organism that specializes in the process, such as skeletal muscle to study contractile proteins (see Chapter 39) or Chlamydomonas to study flagella (see Fig. 38-20). Some organisms are much more amenable to investigation because communities of scientists have invested years of hard work to develop genetic, molecular genetic, and biochemical methods for experimentation. These valuable experimental tools have attracted investigators to a growing number of “model” organisms (Table 6-2).
Model Organisms
Ideal model organisms have completely sequenced genomes and facile methods to manipulate the genes, including replacement of a gene with a modified gene, by the process of homologous recombination. Haploid organisms with one copy of each chromosome after mitotic division are particularly favorable for detecting the effects of changes in genes, called mutations (Box 6-2). It is useful for a haploid organism to have a diploid stage with two copies of each chromosome and a sexual phase, during which meiotic recombination occurs between the chromosomes from the two parents. (See Fig. 45-7 for details on recombination.) This allows one to construct strains with a variety of mutations and facilitates mapping mutations to a particular gene. In addition, diploids carrying a lethal mutation of a gene that is essential for life can be propagated, provided that the mutation is recessive.
BOX 6-2 Key Genetic Terms
Complementation. Providing gene function in trans (i.e., by another copy of a gene)
Diploid. A genome with two copies of each chromosome, one from each parent
Essential Gene. A gene whose function is required for viability
Genome. The entire genetic endowment of an or-ganism
Genotype. The genetic complement, including particular mutations
Haploid. A genome with single copies of each chro-mosome
Mutant. An organism that contains a mutation of interest
Budding yeast and fission yeast meet all of these criteria, so they are widely used to study basic cellular functions. These free-living haploid organisms have a tractable diploid stage in their life cycles. Moving between haploid and diploid stages greatly simplifies the process of creating and analyzing recessive mutations. This is important because most loss-of-function mutations are recessive. Even before their genomes were sequenced, the availability of yeast for genetic, biochemical, and microscopic analysis revolutionized research in cell biology. However, yeast are solitary cells with specialized lifestyles.
