[level-membership-for-cardiovascular-category]
CHAPTER 108 Renal Artery Scintigraphy
In patients with a hemodynamically significant reduction in renal artery caliber, there is a reduction in renal perfusion pressure distal to the stenosis. This results in the activation of the renin-angiotensin-aldosterone system, whereby renin is released from the juxtaglomerular apparatus, and a cascade of events occurs that ultimately leads to peripheral vasoconstriction, blood volume increase, and an elevation in blood pressure. Notably, renin converts angiotensinogen to angiotensin I and angiotensin I is then converted to angiotensin II through a process that requires ACE. In the kidney, angiotensin II results in the preferential constriction of efferent arterioles, which raises the pressure gradient across the glomerular capillary membrane and maintains the glomerular filtration rate (GFR). In patients with RVH, the administration of an ACEI blocks the conversion of angiotensin I to angiotensin II, thereby lowering the degree of vasoconstriction in the efferent arterioles, dropping the transcapillary pressures, and resulting in decreased GFR. There is also an increase in the creatinine level, which is the most common reason for pursuing a diagnosis of renal vascular disease. Decreased GFR can be assessed using nuclear scintigraphy and is the underlying mechanism for the diagnosis of RVH by ACEI scintigraphy.1
TECHNIQUES
Indications
ACEI renography can be used to assess for the presence of renovascular hypertension caused by renal artery stenosis. It is most cost-effective when used in a patient population with a high prevalence of RVH.2 Many imaging modalities exist for the evaluation of renal artery stenosis, but renography may be particularly useful for those with known contrast allergy and in whom assessment of functional significance of a stenotic vessel is desired. The success of this technique is based on the inhibition of the conversion of angiotensin I to angiotensin II following the administration of an ACEI, with subsequent reduction in the GFR, and consequently a change in the radiopharmaceutical pattern of uptake and clearance in comparison to a baseline study.
Contraindications
Patients receiving an ACEI can experience significant hypotension; administration of an ACEI warrants proper clinical monitoring. Blood pressure should be carefully measured, with a baseline blood pressure established prior to the administration of the ACEI; subsequent blood pressure measurements should be performed at 5- to 15-minute intervals following drug administration and prior to discharge. Patients should not be discharged home unless their blood pressure is at least 70% of their baseline blood pressure. Chronic ACEI use can reduce the sensitivity of the study and a short-acting ACEI should be held for 3 days before the study and a longer acting ACEI should be held for 5 to 7 days. Chronic diuretic use may be associated with dehydration, leading to an increased risk of hypotension when the ACEI is administered; it should therefore be stopped a few days before the study. Calcium channel blockers have been reported to cause false-positive results and cessation prior to the study should also be considered.3 Many patients referred for this study will be at high risk for cardiovascular disease, however, and if hypertension is severe, antihypertensive use can be maintained with the understanding that there may be a mild reduction in the overall sensitivity of the study.
DESCRIPTION OF THE PROCEDURE
Patients should be appropriately hydrated, because dehydration can affect renal perfusion curves.4 Patients with renin-dependent RVH may experience a drop in systolic blood pressure when the ACEI is administered, a drop that may be more severe if the patient is dehydrated. Hydration will also help decrease radiation dose to the bladder wall5 and to the surrounding reproductive organs by diluting the radioactivity in the bladder. Patients can receive oral or intravenous hydration, although intravenous hydration is generally preferred with enalaprilat. Oral hydration is generally 7 mg/kg of water and IV hydration, 10 mg/kg, with a maximum administered volume of 500 mL of normal saline over 30 minutes; both are initiated following ACEI administration.
A baseline blood pressure reading should be taken and recorded prior to administration of the medication. Four sequential blood pressure measurements are taken and recorded in the patient’s record at 15-minute intervals during the hour following captopril administration, prior to radiopharmaceutical administration. At the culmination of the study, a final blood pressure reading should be taken prior to discharge home. Patients receiving enalaprilat should have blood pressure measured every 5 minutes during the examination. The patient should void when the waiting period comes to an end, prior to imaging, because a full bladder may affect emptying of the upper tract6 and could also lead to premature termination of the study if the patient needs to void during imaging.
The patient is then brought into the scan room and positioned supine on the imaging table with the camera located posteriorly to ensure that the kidneys are lying at the same depth, which could be affected with the patient semirecumbent or sitting.7 Once the patient is positioned appropriately, imaging begins with the intravenous injection of the radiopharmaceutical. The study should be dynamic, with the first series generally consisting of 1 sec/frame for 1 minute to assess early perfusion, the second series consisting of 5 sec/frame for 24 frames, and the final functional sequence, 30 sec/frame for 60 frames, for a total imaging time of approximately 30 minutes. The patient should void at the end of the study to reduce radiation dose to the kidneys, bladder, and pelvic organs. A postvoid bladder residual can also be calculated with a postvoid image consisting of a single 60-sec/frame image.
IMAGE INTERPRETATION
Postprocessing
Whole renogram curves should be obtained over each kidney and cortical regions of interest (ROIs) can also be assessed to exclude any pelvocaliciceal tracer retention, which could interfere with study interpretation by introducing artificial counts into the calculations. Background subtraction should also be performed using a background ROI. Renal curves are generated from the renal ROIs and the time to maximum counts (Tmax), as shown on the curves, is an important parameter in the diagnosis of RAS. Computer quantification can aid in interpretation and has been found to be useful in reducing false-positive results in patients with mildly abnormal perfusion at baseline.8
Reporting
Results from ACEI scintigraphy are reported as low, intermediate, or high probability for RAS (Fig. 108-1). A normal ACEI renogram indicates a low probability (less than 10%) of renal artery stenosis and these patients generally do not need further work-up for RVH or a baseline scan. A scan is read as having an intermediate probability for RVH when the baseline scan is abnormal but does not demonstrate change following the ACEI challenge. These patients generally are found to have ischemic nephropathy, often with a small shrunken kidney. ACEI -augmented scans are also read as intermediate probability in the face of bilateral cortical retention, as commonly seen with renal insufficiency, and in patients with only very small changes in function in relation to the baseline study. With both 99mTc-DTPA and 99mTc-MAG3, a change in differential function of greater than 10% is considered high probability for RAS, whereas a change from 5% to 9% is considered intermediate probability. Depending on the radiotracer, high-probability scans—those that demonstrate reductions in function, changes in differential function, delayed time to peak, and/or increased cortical retention—indicate a greater than 90% likelihood of RAS. These patients are likely to benefit from vascular intervention.
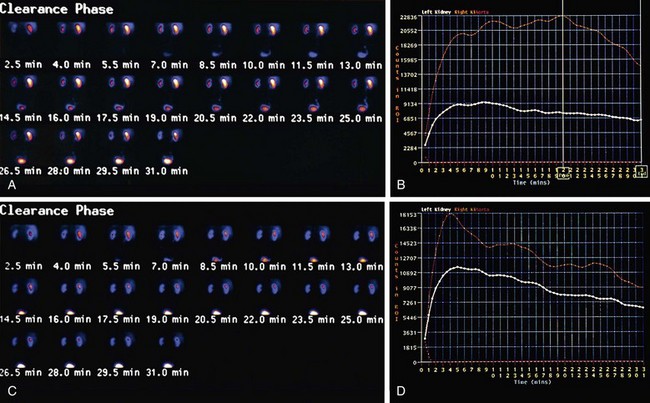
 FIGURE 108-1
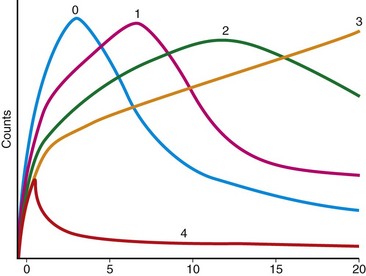
 FIGURE 108-2


Taylor AT, Blaufox MD, Dubovsky EV, et al. Society of Nuclear Medicine Procedure Guideline for Diagnosis of Renovascular Hypertension, version 3.0. Available at http://www.health.gov.il/download/forms/pg_ch16.pdf, June 20, 2003. Accessed December 1, 2009
Taylor A, Nally J, Aurell M, et al. Consensus report on ACE inhibitor renography for detecting renovascular hypertension. J Nucl Med. 1996;37:1876-1882.
1 Taylor A, Nally J, Aurell M, et al. Consensus report on ACE inhibitor renography for detecting renovascular hypertension. J Nucl Med. 1996;37:1876-1882.
2 Blaufox MD, Middleton ML, Bongiovanni J, et al. Cost efficacy of the diagnosis and therapy of renovascular hypertension. J Nucl Med. 1996;37:171-177.
3 Ludwig V, Martin WH, Delbeke D. Calcium channel blockers: a potential cause of false-positive captopril renography. Clin Nucl Med. 2003;28:108-112.
4 Jung HS, Chung YA, Kim EN, et al. Influence of hydration status in normal subjects: fractional analysis of parameters of Tc-99m DTPA and Tc-99m MAG3 renography. Ann Nucl Med. 2005;19:1-7.
5 Dimitrou PA, Tsinikas DT, Depaskouale AK, et al. The effect of hydration on the dose to the urinary bladder wall during technetium-99m diethylene triamine penta-acetic acid renography. Eur J Nucl Med. 1992;19:765-769.
6 O’Reilly P, Aurell M, Brittonn K, et al. Consensus on diuretic renography for investigating the dilated upper renal tract. J Nucl Med. 1996;37:1872-1876.
7 Taylor A, Lewis C, Giacometti A, et al. Improved formulas for the estimation of renal depth in adults. J Nucl Med. 1993;34:1766-1769.
8 Gruenewald SM, Collins LT. Renovascular hypertension: quantitative renography as a screening test. Radiology. 1983;149:287-291.
[/level-membership-for-cardiovascular-category][not-level-membership-for-cardiovascular-category]
CHAPTER 108 Renal Artery Scintigraphy
In patients with a hemodynamically significant reduction in renal artery caliber, there is a reduction in renal perfusion pressure distal to the stenosis. This results in the activation of the renin-angiotensin-aldosterone system, whereby renin is released from the juxtaglomerular apparatus, and a cascade of events occurs that ultimately leads to peripheral vasoconstriction, blood volume increase, and an elevation in blood pressure. Notably, renin converts angiotensinogen to angiotensin I and angiotensin I is then converted to angiotensin II through a process that requires ACE. In the kidney, angiotensin II results in the preferential constriction of efferent arterioles, which raises the pressure gradient across the glomerular capillary membrane and maintains the glomerular filtration rate (GFR). In patients with RVH, the administration of an ACEI blocks the conversion of angiotensin I to angiotensin II, thereby lowering the degree of vasoconstriction in the efferent arterioles, dropping the transcapillary pressures, and resulting in decreased GFR. There is also an increase in the creatinine level, which is the most common reason for pursuing a diagnosis of renal vascular disease. Decreased GFR can be assessed using nuclear scintigraphy and is the underlying mechanism for the diagnosis of RVH by ACEI scintigraphy.1
TECHNIQUES
Indications
ACEI renography can be used to assess for the presence of renovascular hypertension caused by renal artery stenosis. It is most cost-effective when used in a patient population with a high prevalence of RVH.2 Many imaging modalities exist for the evaluation of renal artery stenosis, but renography may be particularly useful for those with known contrast allergy and in whom assessment of functional significance of a stenotic vessel is desired. The success of this technique is based on the inhibition of the conversion of angiotensin I to angiotensin II following the administration of an ACEI, with subsequent reduction in the GFR, and consequently a change in the radiopharmaceutical pattern of uptake and clearance in comparison to a baseline study.
Contraindications
Patients receiving an ACEI can experience significant hypotension; administration of an ACEI warrants proper clinical monitoring. Blood pressure should be carefully measured, with a baseline blood pressure established prior to the administration of the ACEI; subsequent blood pressure measurements should be performed at 5- to 15-minute intervals following drug administration and prior to discharge. Patients should not be discharged home unless their blood pressure is at least 70% of their baseline blood pressure. Chronic ACEI use can reduce the sensitivity of the study and a short-acting ACEI should be held for 3 days before the study and a longer acting ACEI should be held for 5 to 7 days. Chronic diuretic use may be associated with dehydration, leading to an increased risk of hypotension when the ACEI is administered; it should therefore be stopped a few days before the study. Calcium channel blockers have been reported to cause false-positive results and cessation prior to the study should also be considered.3 Many patients referred for this study will be at high risk for cardiovascular disease, however, and if hypertension is severe, antihypertensive use can be maintained with the understanding that there may be a mild reduction in the overall sensitivity of the study.
DESCRIPTION OF THE PROCEDURE
Patients should be appropriately hydrated, because dehydration can affect renal perfusion curves.4 Patients with renin-dependent RVH may experience a drop in systolic blood pressure when the ACEI is administered, a drop that may be more severe if the patient is dehydrated. Hydration will also help decrease radiation dose to the bladder wall5
[/not-level-membership-for-cardiovascular-category]
