CHAPTER 107 Renal Arteries
Computed Tomographic and Magnetic Resonance Angiography
INTRODUCTION
Renal computed tomographic angiography (CTA) and magnetic resonance angiography (MRA) have become clinically important diagnostic tools. Technological advancements are primarily responsible for their rapid development. The implementation of multidetector row array and slip-ring gantry design have propelled CT technology.1 In the past few years, there has been tremendous progress in the development of MR hardware and sequence design, high-performance gradients, parallel imaging techniques, and advanced torso phased-array coils enabling faster scanning and improved image quality. In contrast to CT, MR scanning does not utilize ionizing radiation, avoids exposure to nephrotoxic iodinated contrast material, and demonstrates the capability to provide functional information.2 Alternatively, CT scanning is more widely available and less expensive. Ultimately, although digital subtraction angiography (DSA) remains the gold standard for diagnosing renovascular disease, the diagnostic accuracy of renal CTA and MRA and their ability to offer a reliable, less invasive alternative to diagnostic DSA have fueled their widespread adoption. In this chapter, the technical considerations for performing a renal CTA and MRA will be reviewed.
DESCRIPTION OF TECHNICAL REQUIREMENTS
Renal CTA
Renal CTA is best performed with a multidetector row CT (MDCT) scanner, especially one with at least 64 detector rows. A dual-chamber power injector and a dedicated 3D workstation are also recommended. On-going CT hardware and software development have focused on optimizing image quality while minimizing radiation exposure and improving coordination of the scan with contrast material administration.1
TECHNIQUES
Indications
The most common indications for renal artery CTA and MRA include evaluation for renal artery stenosis and evaluation of potential living kidney donors.1–3 Other common indications include presurgical planning for ureteropelvic junction (UPJ) obstruction, renal tumor evaluation, assessment of congenital anomalies, and trauma.1,3
Renal Artery Stenosis
Renal artery stenosis most commonly occurs secondary to atherosclerosis.4,5 Atherosclerotic disease generally occurs in older patients. Often, there is generalized or diffuse atherosclerotic plaque formation with concomitant involvement of the aorta and the ostium or proximal segment of the main renal artery (Fig. 107-1).4,5 The second most common etiology is fibromuscular dysplasia (FMD) which is found in younger patients, typically females.2,4,5 As opposed to atherosclerotic disease, the middle and distal segments of the main renal artery tend to be more affected in FMD (Fig. 107-2).2,4,5
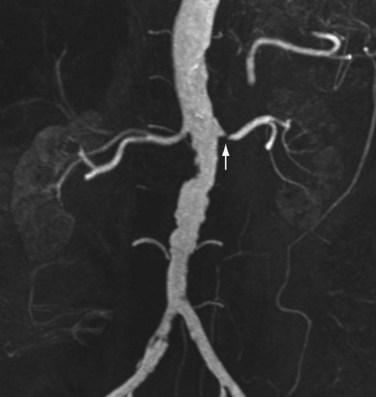
 FIGURE 107-1
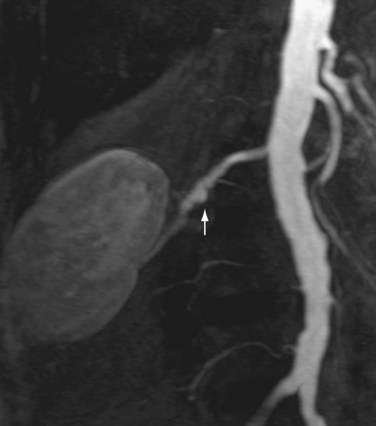
 FIGURE 107-2
The clinical presentation of patients with renal artery stenosis may include abrupt onset or intractable hypertension, acute or chronic azotemia, angiotensin converting enzyme inhibitor induced azotemia, asymmetric renal size, and congestive heart failure in patients with normal ventricular function.2 CTA demonstrates a sensitivity up to 90% and a specificity up to 97% in the detection of hemodynamically significant renal artery stenosis.6 MRA demonstrates a sensitivity of 88% to 100% and a specificity of 70% to 100% in the diagnosis of renal artery stenosis, especially for severe stenosis greater than 70%.2 Following therapeutic angioplasty and/or stenting for renal artery stenosis, CTA and MRA may also be helpful for the surveillance of renal artery restenosis.
Renal Donor Evaluation
Many renal transplantations are performed with living renal donors because of the insufficient availability of cadaveric kidneys.7 Accurate evaluation of the renal vasculature, parenchyma, and collecting system is critical for determining suitability of the donor kidney for transplantation and for preoperative planning.7–10 In many medical centers, donor nephrectomy is now performed laparoscopically to diminish morbidity for the donor.7–10 Consequently, accurate preoperative evaluation has become even more important to minimize the likelihood for unexpected intraoperative vascular complications from unexpected anatomic variants. More than one third of patients may possess anatomic variants (Fig. 107-3).5,7–10 This statistic highlights the importance of accurate preoperative assessment.
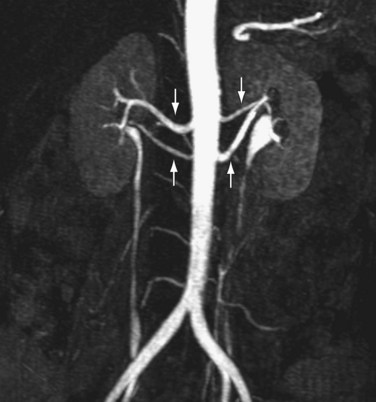
 FIGURE 107-3
Preoperative Planning
In preoperative planning for congenital UPJ obstruction surgery, the CTA or MRA is one component of the diagnostic imaging evaluation. The renal and vascular anatomy, etiology of obstruction, functional significance of obstruction and concomitant conditions will determine the treatment approach.11 The CTA or MRA can typically identify a crossing vessel that is responsible for extrinsic compression of the UPJ resulting in obstruction.11 CTA demonstrates a sensitivity of 91% to 100% and a specificity of 96% to 100% in the detection of crossing vessels.11 MRA demonstrates an accuracy of 86% in the detection of a crossing vessel.11 The presence of a crossing vessel may necessitate a more invasive surgical approach to treat the UPJ obstruction.11
Renal Tumor Evaluation
Renal tumor evaluation is another indication for renal artery CTA and MRA. The vascular features of the tumor may assist staging of the tumor and presurgical planning.11 For instance, renal cell carcinoma may invade the renal vein and extend into the inferior vena cava, which necessitates a substantially longer and more extended surgical approach. Renal cell carcinoma extension into the venous system is typically well assessed by CTA and MRA. Also, the detection of accessory renal arteries or possibly extracapsular feeding arteries of a renal malignancy are important preoperative determinations because knowledge of their presence will minimize intraoperative bleeding complications, especially for laparoscopic nephrectomies, which are becoming increasingly popular surgeries.11
Contraindications
Renal CTA
The contraindications for renal CTA include impaired renal function, known allergy to iodinated contrast material and pregnancy. Also, caution is advised in diabetic patients taking metformin hydrochloride. The development of acute renal impairment secondary to contrast-induced nephropathy may prohibit proper clearance of metformin, which is eliminated through the kidneys, and result in lactic acidosis.12 These patients should discontinue use of metformin for at least 48 hours following administration of iodinated contrast material.12 Metformin may be resumed after 48 hours if the patient’s renal function is normal.12
Renal MRA
Recently, a rare and potentially life-threatening condition called nephrogenic systemic fibrosis (NSF) has been reported in patients with advanced renal failure receiving gadolinium-based contrast material.13,14 This disease is characterized by fibrosis of the skin and connective tissues throughout the body. Patients may develop skin thickening to such an extent that it results in decreased joint mobility. Fibrosis may also occur in other parts of the body including the diaphragm, musculature of the lower abdomen and extremities, and the pulmonary vasculature. The clinical course of NSF is progressive and may be fatal. At the present time, no treatment has been identified. Consequently, extreme caution is advised in administering gadolinium-based contrast material in those patients with advanced renal failure. At our institution, we do not recommend the use of gadolinium-chelate contrast agents in patients with glomerular filtration rate (GFR) < 30 mL/min/1.73 m2.
Technique Description
Renal CTA
The New York University renal CTA protocol is outlined in Table 107-1. Two important factors in performing a renal CTA examination are the selection of scan parameters for optimization of sufficient volume of anatomic coverage for the highest spatial resolution possible within a reasonable scan period, and the administration of iodinated contrast medium for sufficient opacification of the aorta and renal arteries during imaging. Multidetector row array technology and slip-ring gantry design allow volumetric coverage from the upper abdominal aorta through the common iliac arteries within one breath-hold. The data set may be reconstructed at different slice thicknesses to review the images. For a renal CTA, the data set are reconstructed with overlapping thin slices to enable improved data postprocessing on a 3D workstation.
| Scan Parameters for a 64-slice MDCT Scanner | |
| Range | Top of kidneys through iliac crests |
| Collimation | 64 × 0.6 |
| Slice thickness | 1 mm |
| Increment | 0.5 mm |
| Pitch | 0.9 |
| Rotation time | 0.5 sec |
| kVp | 120 (Caredose) |
| mAs | 280 |
| CTDI vol | 20.2 mGy |
| IV contrast dose | 1.5 mL/kg (minimum 100 mL) |
| IV contrast infusion | 3-4 mL/sec |
| Scan delay | Bolus tracking at the level of T12 (threshold of 150 HU) |
CTDI vol, CT dose index of scanned volume.
The most critical element of performing a renal CTA examination is coordination of the scan delay with the arterial arrival of the intravenous contrast bolus.1 Ideally, the scan is obtained during peak contrast opacification of the aorta and renal arteries (Fig. 107-4). The contrast infusion duration should approximate the scan acquisition time.1 Faster scans require less contrast material. However, the drawback of using less contrast material is the shortened duration of the contrast bolus, which increases the challenge for proper coordination of imaging with opacification of the arteries. That is to say, if scanning is too fast, imaging may occur prior to complete opacification of the target vasculature, resulting in suboptimal arterial contrast enhancement and poor arterial visualization. Alternatively, if scanning is slow or performed too late, images would illustrate the venous phase of the bolus with suboptimal arterial enhancement, Consequently, it is important to accurately determine circulation time to achieve an optimal scan.
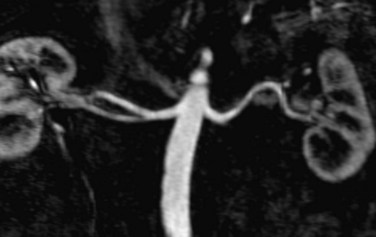
 FIGURE 107-4 Multiplanar reformation (MPR) image from a renal MRA demonstrating bilateral renal arteries.
There are three methods to determine the patient’s circulation time for proper scan delay determination.1 The first method is selecting an empiric scan delay. This method is the least reliable because various factors influence circulation time such as IV catheter location, injection rate, cardiac output, patient body habitus, and patient positioning. The second method is performing a timing bolus scan. In this technique, a small test dose of contrast material, 10 to 15 mL, is infused at a rate of 3 to 4 mL/sec followed by repetitive scans obtained at the level of the upper abdominal aorta at 2-second intervals. The plot of abdominal aortic attenuation versus time will reveal the time of peak enhancement and, consequently, the correct scan delay time for synchronization of CTA acquisition with peak abdominal aortic (and, by inference, renal arterial) enhancement. The main drawbacks with this technique include the higher volume of contrast administered and the additional ionizing radiation dose associated with the timing bolus. The third method is bolus tracking at the level of the upper abdominal aorta. This is the technique used at our institution. In this technique, a region of interest is selected in the upper abdominal aorta at approximately the level of the celiac artery. Following contrast administration, repetitive scans are obtained at this level until a target threshold attenuation of 150 HU is achieved. When the threshold is achieved, the CTA scan is initiated. Although this technique results in a lesser amount of contrast administered than the timing bolus technique, the additional nondiagnostic ionizing radiation dose is comparable to that required for a timing test bolus scan. The drawback with this technique is the time lag between contrast opacification exceeding the threshold and actual initiation of the scan. Generally, this time lag is approximately 6 to 8 seconds. In order to counteract this unavoidable delay, a lower threshold value may be used to trigger the CTA scan. However, this determination is somewhat arbitrary and susceptible to error. For instance, selecting too low a threshold may initiate the scan before peak opacification is achieved. Alternatively, selecting too high a threshold may miss the peak enhancement phase or not trigger the scan at all. Consequently, optimizing the timing for CTA scanning with arrival of the contrast bolus in the target vascular territory requires careful attention to the specific hardware and software configurations at the host site and to the individual patient that is to undergo the CTA.
Renal MRA
The New York University renal MRA protocol is outlined in Table 107-2. Each of these sequences will be briefly reviewed. The patient is placed in the supine position and intravenous access is obtained in the upper extremity. A phased-array coil is positioned over the abdomen and centered over the kidneys. The phased-array coil permits implementation of parallel imaging techniques, which can shorten acquisition times and increase image resolution. The arms are propped up anterior to the level of the coil to avoid wrap-around artifact. Breath-holding instructions are reviewed with the patient to improve compliance.
| Sequence | Plane |
| T1-weighted in- and opposed-phase GRE (include adrenals and kidneys) | Axial |
| HASTE | Axial |
| VIBE (include entire kidneys) | Axial |
| 3D FLASH | Coronal |
| Scan parameters at 1.5 T | |
| TR: 3.1 msec | |
| TE: 1.16 msec | |
| Flip angle: 25 degrees | |
| Slice thickness: 1.2 mm | |
| Matrix size: 256 × 512 | |
| Timing Run | Axial |
| Performed at level of renal arteries | |
| 3D FLASH | Coronal |
| Two measures 7 seconds apart | |
| Standard timing formula | |
| VIBE | Axial |
GRE: gradient-recalled echo; HASTE: half-Fourier acquisition single-shot turbo spin echo; VIBE: volumetric interpolated breath-hold examination; FLASH: fast low angle shot.
The T1-weighted in- and opposed-phase gradient-recalled echo (GRE) pulse sequence provides T1-weighted images for evaluation of renal and adrenal lesions. At our institution, T1-weighted spin-echo (SE) or fast spin-echo (FSE) sequences are not used for renal imaging secondary to the longer acquisition time requirements compared to that for GRE pulse sequences. Short repetition time (TR) and short echo time (TE) are used to achieve T1-weighting. In- and opposed-phase GRE pulse sequences, also known as chemical shift imaging, enable the detection of significant fat within voxels secondary to the signal cancellation that occurs on opposed-phase GRE images. This, in turn, enables the detection of fat within renal and/or adrenal lesions. For instance, this techniques enables the detection of microscopic or intravoxel fat within adrenal adenomas.15
The half-Fourier acquisition single-shot turbo spin echo sequence (HASTE, Siemens Medical Solutions, Malvern, PA) is a long echo train imaging technique that enables acquisition of T2-weighted images in less time than conventional SE sequences.16 This pulse sequence is a single-shot technique that fills just over 50% of k-space in one echo train.16 The remainder of k-space is mathematically filled based on the symmetric properties of k-space. The acquisition times are generally less than 1 second permitting essentially motion-free T2-weighted images. This technique is useful in uncooperative patients or patients who cannot adequately breath-hold. The main drawback, however, is the low signal-to-noise ratio. In this protocol, the HASTE images are mainly used for delineation of the anatomy and assessment of the renal collecting systems.
At our institution, we also perform the volumetric interpolated breath-hold examination technique (VIBE, Siemens Medical Solutions), which is a 3D T1-weighted fat-suppressed GRE pulse sequence that provides high spatial and temporal resolution imaging.17 This volumetric acquisition is performed before and after intravenous contrast administration to allow accurate detection and characterization of adrenal and renal lesions. The complete volume of the adrenal glands and kidneys may be imaged within a single breath-hold to minimize respiratory and other motion artifacts and allow advanced 3D image postprocessing.
Contrast-Enhanced 3D MRA
Renal MRA is best achieved using contrast-enhanced 3D MRA using a 3D fast spoiled GRE pulse sequence (e.g., Fast Low Angle Shot or FLASH, Siemens Medical Solutions).16 This volumetric acquisition is performed during the arterial phase of the contrast bolus and can reliably provide high spatial resolution vascular illustration of the abdominal aorta and renal arteries. The extremely short TR value of this pulse sequence produces high T1 contrast.16,17
In order to accurately image the renal arteries during the arterial phase, the circulation time must be determined for the individual patient because the circulation time can vary significantly from patient to patient. Different methods can be used to accomplish this task. At our institution, we use a preliminary timing bolus scan to estimate scan delay times necessary for the MRA examination.18 In this protocol, a 1 mL test dose of gadolinium-chelate contrast agent is infused followed by a 20 mL saline flush; both infused at a rate of 2 mL/sec with an MR-compatible power injector. At the same time, axial images are acquired at the level of the upper abdominal aorta, at the celiac artery, at 2-second intervals. From these images, the time for peak enhancement of the aorta may be determined. The actual scan delay depends on the k-space scheme of the 3D MRA pulse sequence and the period that the central k-space data is being acquired. For a sequential 3D MRA acquisition, the center of k-space is filled during the middle of the acquisition time, the following formula may be used to calculate the scan delay: T (scan delay) = T (circulation time) +  T (contrast infusion) −
  T (acquisition time). The circulation time is the time for peak enhancement of the aorta. Contrast infusion time is the duration of the contrast infusion (10 sec for 20 mL of contrast infused at 2 mL/sec). Acquisition time is approximately 20 seconds. If a centric phase ordering is used, the central lines of k-space are acquired at the beginning of data acquisition and scan delay is typically timed by simply adding 2 seconds to the circulatory time. The addition of 2 seconds minimizes the risk for ringing artifacts that can occur if central k-space views are sampled during the rapid rise in gadolinium concentration.19 It is preferred that the central k-space views, therefore, be acquired during the plateau phase (i.e., more stable period) of the contrast enhancement curve.
If the contrast-enhanced 3D MRA is suboptimal, there are several additional imaging options that can be performed to ensure a diagnostic result. One is to perform a renal 3D phase contrast (PC) MRA.20 This can be performed during free breathing and using an axial prescription. Vascular signal intensity on 3D PC MRA is actually quite good after Gd-chelate contrast agent administration.21 Yet another option is to perform a postcontrast 3D SSFP MRA. On 3D SSFP, arterial signal intensity is also very high after Gd-chelate contrast administration; however, venous structures also will have high signal intensity.22
New Developments in MRA
A noncontrast enhanced 3D SSFP MRA with fat suppression was originally developed for whole heart coronary artery imaging but is a valuable technique for body MRA. 3D SSFP can be cardiac gated and respiratory gated, typically using navigator echo gating. Of course, 3D SSFP can also be obtained without cardiac or respiratory gating during a breath-hold. Image contrast in 3D SSFP is determined by the T2/T1 ratio which produces bright blood imaging with minimal reliance on inflow effects for signal generation. Consequently, both arteries and veins have high signal intensity. For renal MRA examinations, saturation bands over the kidneys and inferior vena cava can reduce venous signal.23 Application of a slab-selective inversion prepulse can also suppress the signal from the renal parenchyma and the renal veins.24
ASL is frequently used for perfusion measurements in the brain, and also has been applied for renal perfusion measurement and renal artery imaging.25,26 ASL can be combined with fast MRA imaging methods. The ASL technique relies on spin-tagging the blood upstream of the area of interest to provide vessel contrast. With alternate acquisition of the tagged and nontagged images and subtracting these two data sets, a bright blood image, without background signal, can be obtained. ASL imaging can also be produced by using a combination of a spatially nonselective inversion recovery pulse and a spatially selective tagged pulse. The combination of ASL with SSFP technique provides bright blood angiographic images, without venous signal and with high signal-to-noise ratio, suitable for renal artery imaging. The combination of cardiac-triggered, navigator-gated, 3D SSFP technique with a cylindrical (pencil beam) 2D selective spin-labeling inversion pulse, tagging the blood in the suprarenal aorta, demonstrated comparable quality to contrast-enhanced MRA images.26 The main limitation of this technique is the requirement of high velocity flow. ASL works best where there is fast flow such as within the carotid, renal, or pulmonary arteries. It is less effective in regions of slow flow, such as within the peripheral arteries, where blood in the imaging volume is not being adequately replaced by tagged blood.
Pitfalls and Solutions
CTA Pitfalls and Solutions
For CTA, lack of coordination between contrast infusion and scan acquisition may yield a poor quality examination. Solutions to minimize this pitfall include checking the patient’s intravenous injection site and the MR compatible power injector to ensure proper functioning, relaxing the position of the arms to prevent venous kinking and prolonged bolus transit times, and using a saline chaser following the contrast infusion to prevent pooling of contrast material within the catheter tubing and peripheral veins.1
MRA Pitfalls and Solutions
For MRA, parallel imaging with multichannel systems offers the potential to decrease imaging times without sacrificing spatial resolution in those patients who have difficulty breath-holding.16 More than one receiver coil is required, with each coil having its own receiver channel. This technique uses the difference in signal detected by receiver coils positioned over different parts of the body. By incorporating the differences in sensitivity of multiple coils to detect signal from the same source, information regarding spatial localization may be obtained and may reduce the number of phase-encoding steps required to produce an image. Consequently, imaging times will be decreased. Two main techniques of parallel imaging are known as SMASH, simultaneous acquisition of spatial harmonics, and SENSE, sensitivity encoding.16 There are several issues that should be considered when incorporating these techniques. First, special coils must be designed with independent coil elements having their own receiver channels. Second, accuracy of coil sensitivity measurements may be difficult to determine. Third, extensive computational time is required to integrate the independent data from multiple channels. Finally, the signal-to-noise ratio will be decreased inversely with the acceleration factor because of the under-sampling of k-space.
Image Interpretation
Postprocessing
The most commonly used postprocessing techniques include multiplanar reformation (MPR), maximum intensity projection (MIP), and 3D volume rendering (VR).1,2,6,27,28 Each of these visualization techniques possesses different strengths and limitations and a more detailed description can be found in Chapter 83. In any case, the source data should be routinely evaluated to corroborate specific findings.
MPR presents the source data in any desired plane to maximize visualization of the vascular anatomy (Fig. 107-5). The limitation of this technique is that the renal artery must lie in the same plane. Because the renal artery may be tortuous in course, segments of the artery may course in and out of the visualization plane resulting in the appearance of pseudostenoses.6 Proper visualization of arterial branch points may also present a similar challenge at tortuous segments. Curved planar reformation (CPR), a modification of the MPR technique, may be used to overcome this limitation. CPR presents the source data in a single voxel tomogram that follows a curved path.6 The curved path may be manually or automatically designated along the course of the renal artery. This modified technique allows complete visualization of the renal artery in one plane of section. The major limitation of this technique is dependence on accurate designation of the course of the renal artery. If the curve does not accurately follow the renal artery, false stenoses (i.e., pseudostenoses) may be erroneously created. In addition, because the images are only a single voxel in thickness, small or thin structures may not be included in the tomogram image.6 To avoid this potential pitfall, an orthogonal plane may be helpful to visualize a more complete representation of the vessel anatomy.
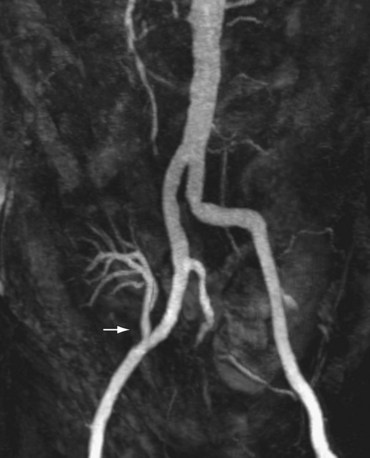
 FIGURE 107-5
MIP presents the source data in a selected plane by using a simple algorithm.27 First, the operator selects a desired visualization plane. Then, the value of each voxel is determined by the maximum value along an array directed perpendicular to the imaging plane and through the volumetric data set. This value represents the maximum density for CTA images and maximum signal intensity for MRA images. The 3D data set is converted to a representative 2D projection image (Fig. 107-6). The limitation of this technique is the loss of depth information because voxels with lower values are overlooked and only maximum values are displayed.27 Overlapping structures often may confound interpretation. One solution to ease interpretation is the creation of MIP images in multiple projections at different angles around the data set to create a 3D effect. For CTA images, any structure with a density greater than intravenous contrast, such as bone, calcification and metal, has the potential to obscure visualization of the vascular anatomy. One solution to avoid this pitfall is to use a smaller selected volume of the original data set, or a sub-volume MIP. For a subvolume MIP, the 2D projection is generated using a subset of the total 3D data (i.e., a thin slab of the volumetric data set) corresponding to the expected plane of the renal arteries. On CTA, this technique can be useful for removing bony structures from the image data set. However, similar to the limitations of MPR, the vascular anatomy must lie within the slab to avoid the generation of pseudostenoses. On CTA, even with these techniques, however, the ostial calcification from atherosclerosis may make it very challenging to separate calcification from the luminal contrast, precluding accurate grading of an ostial renal artery stenosis. MRA offers a few advantages over CTA in this regard. One advantage is that calcification causes a signal void (i.e., no MR signal) and thus will not obscure luminal anatomy. The second advantage of MRA is its ability to acquire precontrast and postcontrast images and perform a subtraction of the volumetric data set. By subtracting the precontrast data set from the postcontrast data set, the resulting postprocessed data set will contain only information regarding the distribution of contrast material. As a result, the MIP images will allow easier visualization of the arterial anatomy without the interference of adjacent structures.
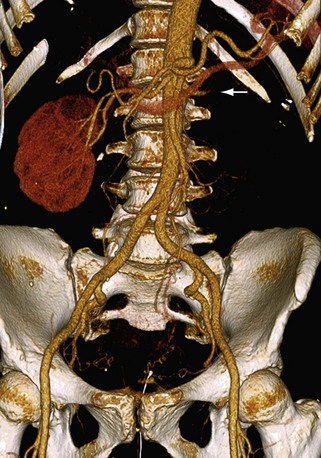
 FIGURE 107-6 3D volume rendered image from a renal CTA demonstrating occlusion of the left renal artery (arrow).
3D VR presents the source data in a 3D format by incorporating the values of each voxel to construct the image data set.1,2,6,27,28 Unlike MIP images, depth information is preserved. Various filters may be applied to the source data to create different colors or degrees of opacity corresponding to each voxel value. In this manner, certain voxel values may be emphasized or minimized to evaluate specific structures. For instance, CTA images may be created that render the bony structures relatively transparent to facilitate visualization of the vascular anatomy (Fig. 107-7). In addition to preserving depth information, 3D VR provides an excellent overview of the anatomic relationships within the data set. Accessory renal arteries and unexpected anatomic variants may be easier to appreciate with these images. The limitation of this technique is the potential to create or overlook pathology because many of the attributes of the image are arbitrarily determined. For instance, the colors and degrees of transparency are user-defined variables and may be vulnerable to error.
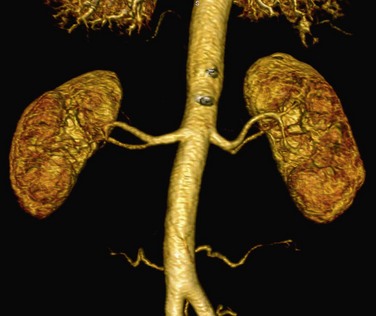
 FIGURE 107-7
Fishman and colleagues found MIP images to be useful for many CTA applications, but rely on 3D VR images for interpretation secondary to its superior ability to differentiate soft tissues and accurately depict 3D anatomic relationships.27 Mallouhi and colleagues found that 3D VR for renal MRA offered three advantages over MIP: a higher positive predictive value for detecting clinically significant renal artery stenosis, better correlation with DSA, and improved delineation of the renal artery.28


Fishman EK, Ney DR, Heath DG, et al. Volume rendering versus maximum intensity projection in CT angiography: What works best, when and why. RadioGraphics. 2006;26:905-922.
Hussain SM, Kock MCJ, Ijzermans JNM, et al. MR imaging: A “one-stop shop” modality for preoperative evaluation of potential living kidney donors. RadioGraphics. 2003;23:505-520.
Kawamoto S, Montgomery RA, Lawler LP, et al. Multi-detector row CT evaluation of living renal donors prior to laparoscopic nephrectomy. RadioGraphics. 2004;24:453-466.
Zhang H, Prince MR. Renal MR angiography. Magn Reson Imaging Clin N Am. 2004;12:487-503.
1 Chow LC, Rubin GD. CT angiography of the arterial system. Radiol Clin N Am. 2002;40:729-749.
2 Zhang H, Prince MR. Renal MR angiography. Magn Reson Imaging Clin N Am. 2004;12:487-503.
3 Kang PS, Spain JW. Multidetector CT angiography of the abdomen. Radiol Clin N Am. 2005;43:963-976.
4 Kawashima A, Sandler CM, Ernst RD, et al. CT evaluation of renovascular disease. RadioGraphics. 2000;20:1321-1340.
5 Urban BA, Ratner LE, Fishman EK. Three-dimensional volume-rendered CT angiography of the renal arteries and veins: Normal anatomy, variants, and clinical applications. RadioGraphics. 2001;21:373-386.
6 Kocakoc E, Bhatt S, Dogra V. Renal multidetector row CT. Radiol Clin N Am. 2005;43:1021-1047.
7 Israel GM, Lee VS, Edye M, Krinsky GA, et al. Comprehensive MR imaging in the preoperative evaluation of living donor candidates for laparoscopic nephrectomy: Initial experience. Radiology. 2002;225:427-432.
8 Hussain SM, Kock MCJ, Ijzermans JNM, et al. MR imaging: A “one-stop shop” modality for preoperative evaluation of potential living kidney donors. RadioGraphics. 2003;23:505-520.
9 Kawamoto S, Montgomery RA, Lawler LP, et al. Multi-detector row CT evaluation of living renal donors prior to laparoscopic nephrectomy. RadioGraphics. 2004;24:453-466.
10 Sahani DV, Rastogi N, Greenfield AC, et al. Multi-detector row CT in evaluation of 94 living renal donors by readers with varied experience. Radiology. 2005;235:905-910.
11 Shah O, Taneja SS. Renal imaging: What the urologist wants to know. Magn Reson Imaging Clin N Am. 2004;12:387-402.
12 Rasuli P, French GJ, Hammond DI. Metformin hydrochloride all right before, but not after, contrast medium administration. Radiology. 1998;209:586.
13 Sadowski EA, Bennett LK, Chan MR, et al. Nephrogenic systemic fibrosis: risk factors and incidence estimation. Radiology. 2007;243:148-157.
14 Marckmann P, Skov L, Rossen K, et al. Nephrogenic systemic fibrosis: suspected causative role of gadodiamide used for contrast-enhanced magnetic resonance imaging. J Am Soc Nephrol. 2006;17:2359-2362.
15 Merkle EM, Nelson RC. Dual gradient-echo in-phase and opposed-phase hepatic MR imaging: a useful tool for evaluating more than fatty infiltration or fatty sparing. RadioGraphics. 2006;26:1409-1418.
16 Lee VS, Cardiovascular MRI. Physical Principles to Practical Protocols. Philadelphia: Lippincott Williams & Wilkins; 2005.
17 Rofsky NM, Lee VS, Laub G, et al. Abdominal MR imaging with a volumetric interpolated breath-hold examination. Radiology. 1999;212:876-884.
18 Earls J, Rofsky N, DeCorato D, et al. Hepatic arterial-phase dynamic gadolinium-enhanced MR imaging: optimization with a test examination and a power injector. Radiology. 1997;202:268-273.
19 Maki JH, Prince MR, Londy FJ, Chenevert TL. The effects of time varying intravascular signal intensity and k-space acquisition order on three-dimensional mr angiography image quality. J Magn Reson Imaging. 1996;6(4):642-651.
20 Hood MN, HO VB, Corse WR. Three-dimensional phase-contrast magnetic resonance angiography: a useful clinical adjunct to gadolinium-enhanced three-dimensional renal magnetic resonance angiography. Mil Med. 2002;167(4):343-349.
21 Bass JC, Prince MR, Londy FJ, Chenevert TL. Effect of Gadolinium on phase-contrast MR angiography of the renal arteries. AJR Am J Roentgenol. 1997;168(1):261-266.
22 Foo TK, Ho VB, Marcos HB, et al. MR Angiography using steady-state free precession. Magn Reson Med. 2002;48(4):699-706.
23 Coenegrachts KL, Hoogeveen RM, Vaninbroukx JA, et al. High-spatial-resolution 3D balanced turbo field-echo technique for MR angiography of the renal arteries: initial experience. Radiology. 2004;231:237-242.
24 Wyttenbach R, Braghetti A, Wyss M, et al. Renal artery assessment with nonenhanced steady-state free precession versus contrast-enhanced MR angiography. Radiology. 2007;245:186-195.
25 Fenchel M, Martirosian P, Langanke J, et al. Perfusion MR imaging with FAIR true FISP spin labeling in patients with and without renal artery stenosis: Initial experience. Radiology. 2006;238:1013-1021.
26 Spuentrup E, Manning WJ, Börnert P, et al. Renal Arteries: Navigator-gated balanced fast field-echo projection MR angiography with aortic spin labeling: Initial experience. Radiology. 2002;225:589-596.
27 Fishman EK, Ney DR, Heath DG, et al. Volume rendering versus maximum intensity projection in CT angiography: What works best, when and why. RadioGraphics. 2006;26:905-922.
28 Mallouhi A, Schocke M, Judmaier W, et al. 3D MR angiography of renal arteries: comparison of volume rendering and maximum intensity projection algorithms. Radiology. 2002;223:509-516.
