CHAPTER 18 Radiology of the Spine
Technical Considerations
Radiographs
The usefulness of conventional radiographs is primarily in the extradural space. Conventional radiographs are relatively inexpensive and easy to perform. They provide a convenient means of assessing alignment and gross bony integrity and can also be used for purposes of localization and evaluation of movement. They are capable of demonstrating the general changes involving various types of arthritis and disk space narrowing. According to recent appropriateness criteria, radiographs are considered sufficient for the initial evaluation of recent significant trauma, osteoporosis, or back pain in individuals older than 70 years.1 Substitution of digital radiography for conventional film-screen techniques has provided more flexible handling of images (e.g., duplication, transmission, postprocessing), as well as expedited cycle time. This latter advantage is extremely useful in the intraoperative environment because the results are available immediately after exposure without the need for traditional processing.2 The disadvantages of conventional radiographic techniques are that they are able to visualize only bony structures and are relatively insensitive to soft tissue changes within the disk, ligaments, nerves, and paraspinal tissues. Bone marrow involvement must be significant and far advanced before it is demonstrable on conventional radiographs.
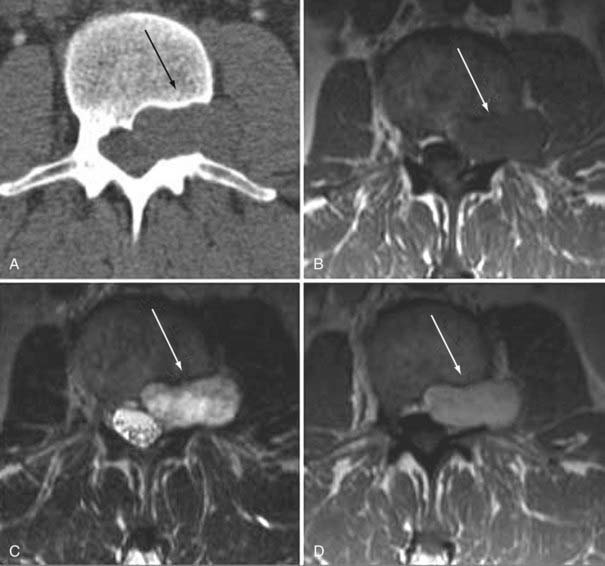
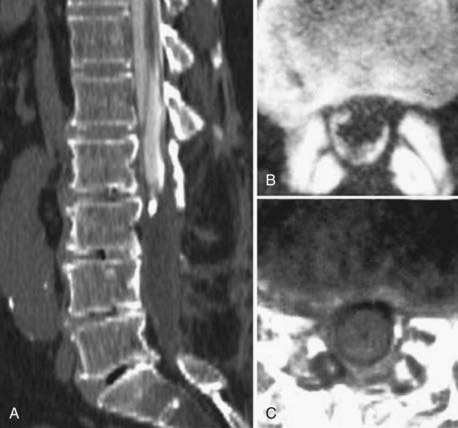
CT Myelography
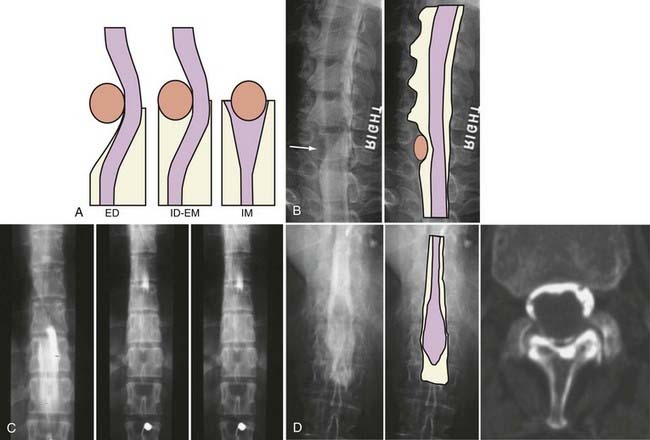
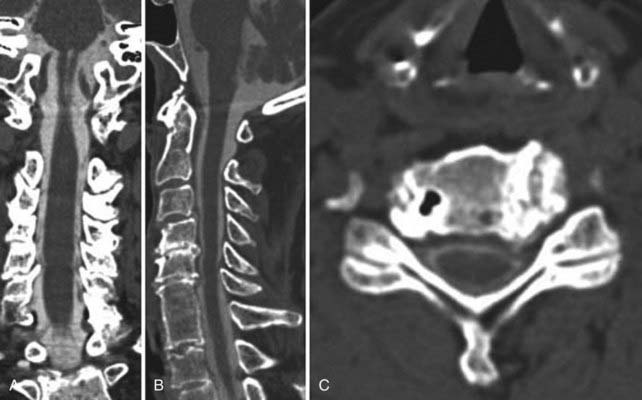
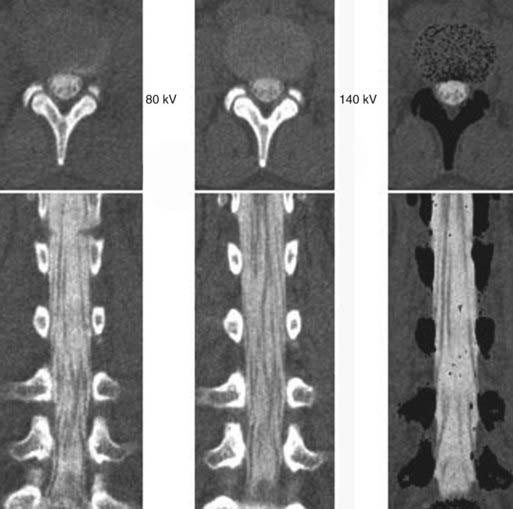
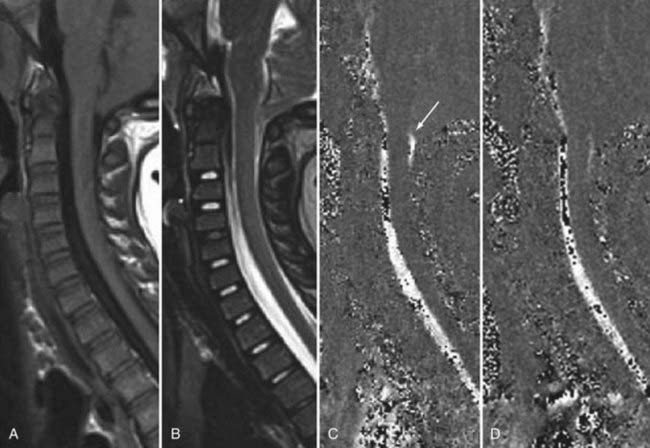
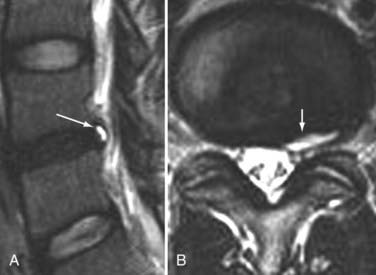
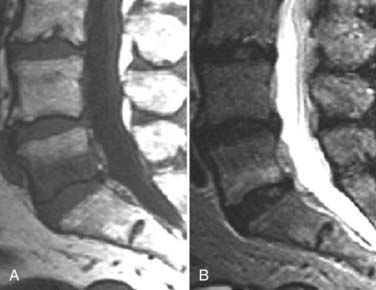
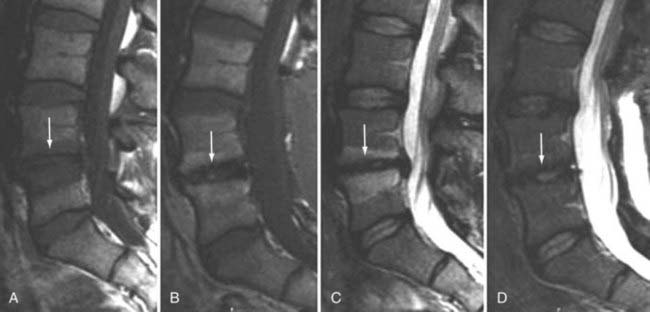
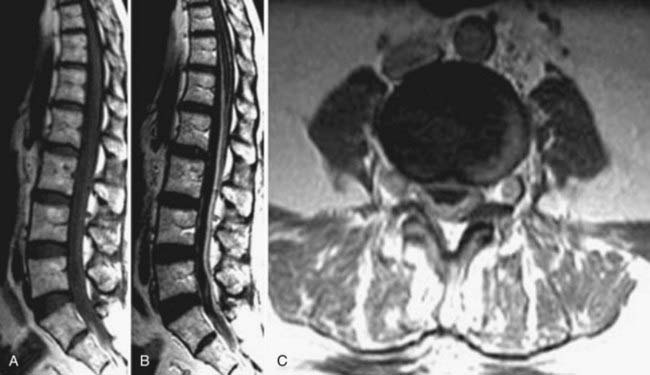
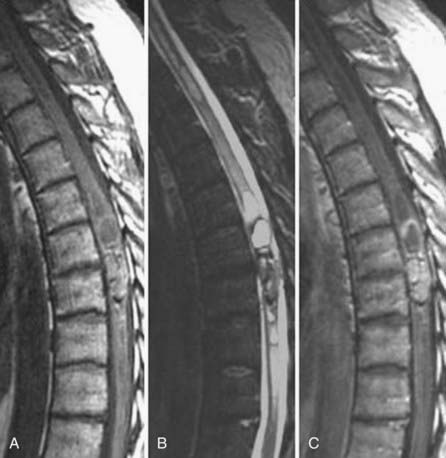
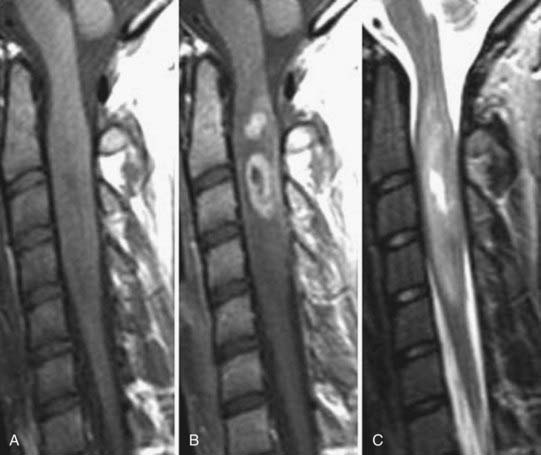
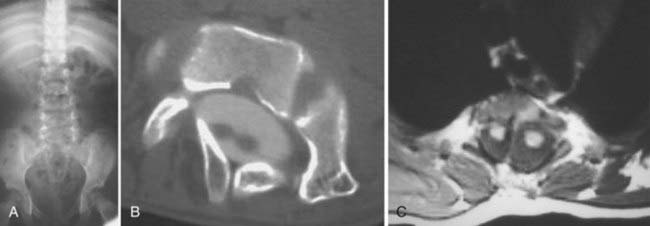
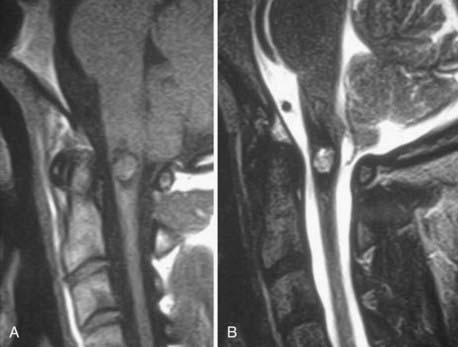
The introduction of contrast material into the intrathecal space provides both extradural and intradural information. Myelography is able to outline the nerve roots, spinal cord, and its coverings. Intradural and extradural disease can be identified and characterized on the basis of the character and morphology of its effect on the contrast column (Fig. 18-1). Plain-film contrast-enhanced myelography is rarely performed on its own and is almost always used in conjunction with CT. Nonionic contrast material has completely replaced its oil-based predecessor and is usually introduced into the lumbar region at L3 or L4 or cervically at C1-2. Plain-film conventional myelography may be useful for general anatomic appraisal in patients with complex deformities or when implanted hardware or electronic devices preclude the use of MRI or CT. CT myelography provides excellent delineation of intradural structures such as the spinal cord and nerve roots and their relationship to the soft tissue and bony surroundings. It is useful in distinguishing bone from soft tissue changes (e.g., osteophytes and disk herniations), which may be inseparable on plain-film myelography (Fig. 18-2). Multidetector CT of the entire spinal axis can be performed in 20 to 30 seconds. With intrathecal contrast media, subsequent multiplanar reformatted images can provide complex 3D assessment of anatomic and pathologic abnormalities with myelographic-like images. More recently, various forms of dual-energy multidetector CT have been introduced that can subtract out bone in both single slices and 3D multiplanar reformatted images (Fig. 18-3).
Magnetic Resonance Imaging
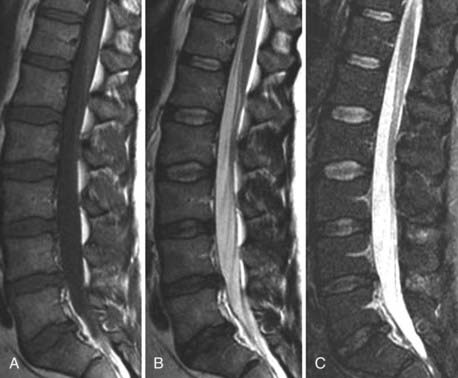
Traditional clinical imaging has emphasized orthogonal T1- and T2-weighted imaging for morphologic assessment of the diskovertebral complex. These sequences also provide an evaluation of the changes in signal intensity associated with degenerative disk disease. Fast spin echo (SE) T2-weighted images have replaced conventional T2-weighted images because of their shorter acquisition times, but they provide no increased diagnostic advantage. Short tau inversion recovery (STIR) or fat-suppressed T2-weighted images have been added because they are more sensitive to marrow and soft tissue changes (Fig. 18-4). Although these standard sequences remain the mainstay of diagnostic MRI of the spine, new techniques continue to be evaluated in the hope of providing stronger correlation between imaging findings and patient symptoms. The utility of many of these techniques for the routine evaluation of degenerative disk disease remains unknown, and the number of patients in whom they have been evaluated remains small. Nevertheless, these approaches may be important for redefining the direction of spinal imaging from strictly anatomic imaging to imaging that combines more physiologic and functional information.3 Techniques that have been evaluated include assessment of spinal motion (dynamic imaging, kinetic assessment, or axial loading), diffusion imaging (water or contrast agents), MR neurography, spectroscopy, functional MRI of the spinal cord, and ultrashort–echo time imaging. Of the variety of techniques available, only MR neurography and dynamic imaging have expanded beyond the experimental phase to demonstrate specific clinical utility (albeit in niche populations).
Dynamic Imaging
The utility of dynamic spine MRI remains unclear, in part because of the varied methods used. Methods used to date include axial loading in the supine position by means of a harness attached to a nonmagnetic compression footplate with nylon straps that can be tightened or the use of an upright open MRI system that allows flexion-extension imaging (Fig. 18-5).4,5 Dynamic MRI has been used to evaluate for the presence of occult herniations, which may not be visible or be less visible when the patient is supine, to measure motion between spinal segments, and to measure canal or foraminal diameter when subjected to axial loading.3,5–8 Hiwatashi and colleagues evaluated 200 patients with clinical symptoms of spinal stenosis and found 20 with detectable differences in caliber of the dural sac on routine and axial-loaded studies.7 In 5 of these selected patients, all three neurosurgeons involved in the clinical evaluation changed their treatment recommendation from conservative management to decompressive surgery. Although a subset of patients may benefit from this type of evaluation, the benefit appears to be small for the added machine time and patient discomfort.
Neurography
A large and varied literature exists concerning the use of MR neurography for the evaluation of peripheral nerves, including the brachial and lumbar plexuses. Thin-section MR neurography uses high-resolution T1-weighted imaging for anatomic detail and fat-suppressed T2-weighted or STIR imaging to show abnormal nerve hyperintensity. Several reviews exist on this subject.9–11 The technique is capable of depicting a wide variety of pathologic conditions involving the sciatic nerve, such as compression, trauma, hypertrophy, neuroma, and tumor infiltration.12,13 MR neurography has 93% specificity and 64% sensitivity for diagnosis of the piriformis syndrome (piriformis muscle asymmetry and sciatic nerve hyperintensity).14
Ultrashort–Echo Time Imaging
Routine clinical MRI does not allow evaluation of tissues with very short relaxation times because echo times are on the order of 8 to 15 msec. Ultrashort–echo time sequences have been preliminarily evaluated for a number of tissues, including the spine. These sequences have echo times as short as 0.08 msec. The images show normal contrast enhancement, with high signal intensity from the longitudinal ligaments, end plates, and interspinous ligaments.15–17
Diffusion
Several authors have evaluated the apparent diffusion coefficient (ADC) in normal and degenerated intervertebral disks. Antoniou and associates evaluated the ADC in cadaveric human disks in relation to matrix composition and matrix integrity by using a stimulated echo sequence.18 They found that the ADC in healthy subjects was significantly greater in the nucleus pulposus than in the annulus fibrosus. The ADC in the nucleus was noted to generally decrease with degeneration grade and age. A similar correlation of ADC measurements and annular degeneration was not found. The most notable correlations were observed between the ADC of the nucleus pulposus and the water and glycosaminoglycan content. Kealey and coworkers evaluated 39 patients with a multishot SE echo planar technique.19 They found a significant decrease in the ADC of degenerated disks in comparison to normal disks. Kurunlahti and colleagues evaluated the ADC of disk and lumbar magnetic resonance angiograms in 37 asymptomatic volunteers.20 Lumbar artery status correlated with diffusion values within the disks, thus suggesting that impaired blood flow may play an important role in disk degeneration.
Kerttula and collaborators compared disk ADC values in normal controls with those in patients with prior compression fractures (at least 1 year previously) and found that ADC values in the x and y directions decreased in degenerated disks and in disks of normal signal intensity in the area of trauma.21 Diffusion tensor imaging has been evaluated for imaging of the annulus fibrosus22 and for imaging defects or disruptions within the annulus.3 Differences in diffusion have been demonstrated for the intervertebral disk in compressed versus uncompressed states.23 Intravenous contrast enhancement may also be used to assess diffusion into the intervertebral disk. Normal disks enhance slowly after the injection of contrast material, which may be as much as 36% in animal models. This enhancement is modified by the type of contrast agent (ionic versus nonionic and molecular weight).24,25 Ionic material diffuses less rapidly than nonionic media into the disk. Degenerated disks with decreased glycosaminoglycan exhibit more intense and rapid enhancement.26 Disk enhancement has been documented in normal and degenerated human lumbar disks.27
Cerebrospinal Fluid
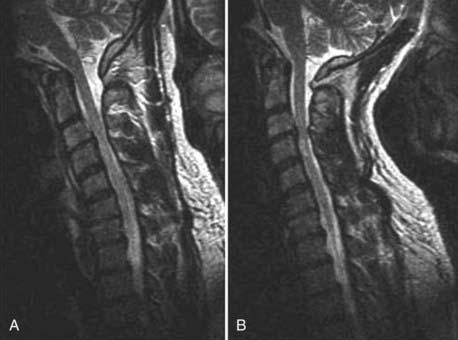
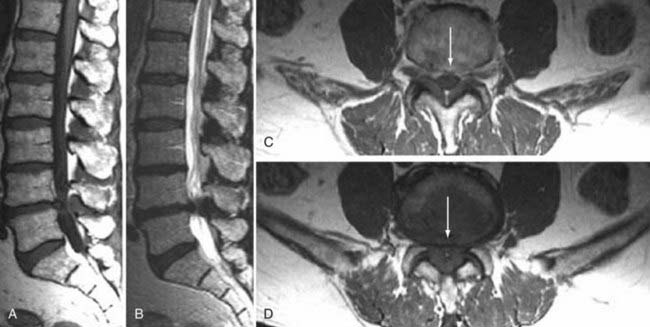
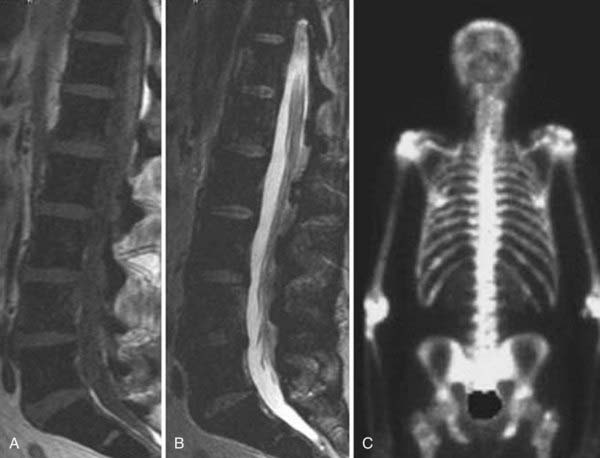
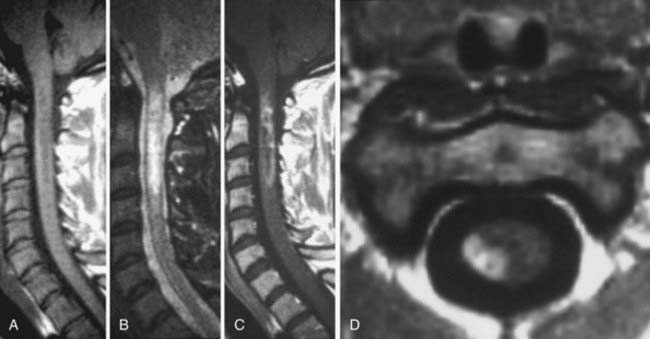
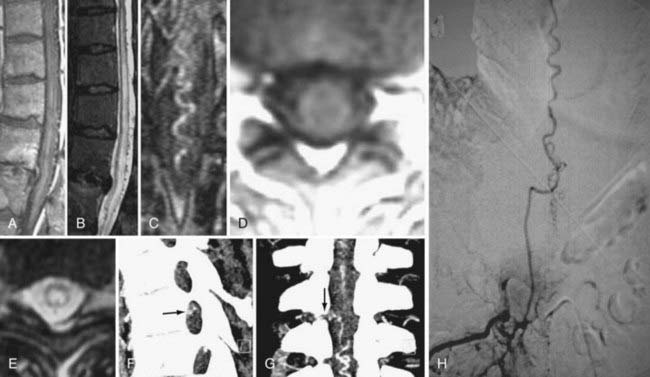
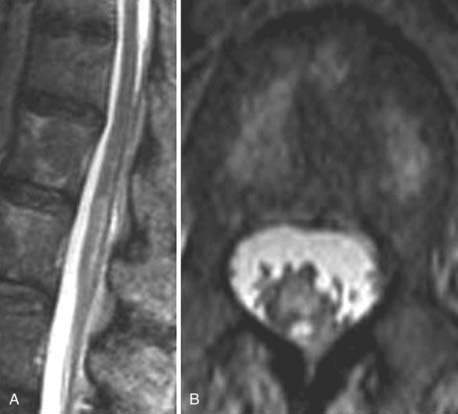
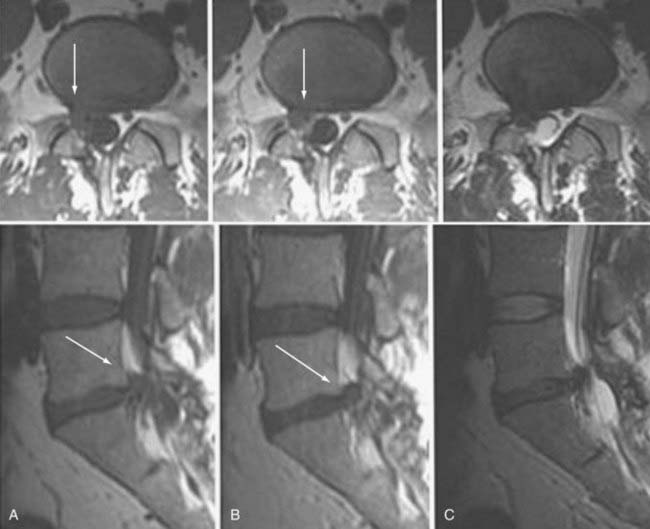
CSF flow studies with cine MRI provide cardiac-gated gradient phase-contrast images that are displayed qualitatively as CSF flow images in a closed loop kinematic format. This same data set can be displayed quantitatively on a graph or in numerical format as analysis of values of flow velocity and volume flow rate. These images demonstrate the pulsatile motion of CSF, not the bulk flow. Pulsatile flow is a result of expansion of the brain during systole and relaxation during diastole and is therefore bidirectional, with CSF flowing caudally during systole and cranially during diastole. Typically, the signal intensity of normal CSF flow in these studies is demonstrated as hyperintense during systole, where there is caudal (downward) flow, and hypointense during diastole, where there is cranial (upward) flow. These images are usually displayed in the sagittal and axial planes. In general, the degree of pulsatile flow diminishes as it proceeds caudally. Clinically, these studies are most often used for the evaluation of CSF flow in patients with Chiari I and II malformations and for the assessment of syrinx cavities (Fig. 18-6).
Artifacts and Contraindications
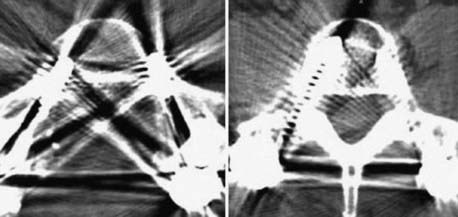
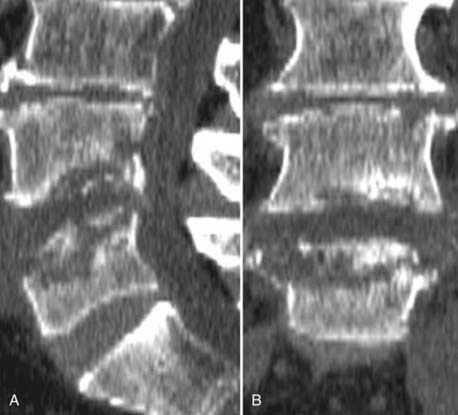
Instrumentation, metal used as part of surgical procedures, and implanted electronic devices represent challenges for both CT and MRI. In the case of CT, metal can create beam-hardening artifacts that obscure adjacent soft tissue and osseous structures (Fig. 18-7). Multidetector studies with isotropic voxels and software used to decrease beam-hardening artifact can often decrease the image degradation caused by implanted metal.28 Different types of metal produce different types of artifacts on MRI that may make the examination uninterpretable. The term magnetic susceptibility describes the manner and amount by which a material becomes magnetized in a magnetic field. Nonferrous magnetic metals may produce local electrical currents induced by the changing field, which causes distortion of the field and artifacts. These artifacts take two main forms: geometric distortion and signal loss secondary to dephasing (Fig. 18-8). Different techniques are more susceptible to these artifacts, and gradient echo images in particular are especially sensitive to differences in magnetic susceptibility and field homogeneity. Although metals can cause artifacts that render the examination uninterpretable, certain indwelling devices may be a contraindication to the entire examination. Certain types of aneurysm clips, cardiac valves, and vascular devices can result in harm to patients during an MRI examination. Some implantable devices may cease to function properly after an MRI study, and others may be a source of heating with deleterious biologic effects and burns. Readers are referred to publications and websites that track information related to contraindications.28
Intravenous contrast agents are commonly used with both CT and MRI examinations. Both iodinated (CT) and paramagnetic substances (MRI) are cleared by the kidney and should be used with caution or not at all in patients with impaired renal function. Although this has been common knowledge with the iodinated contrast media used for CT, recent evidence has also documented various complications related to the use of paramagnetic contrast agents in patients with impaired renal function. Despite being uncommon, nephrogenic systemic fibrosis, a late serious adverse reaction to gadolinium, has been well documented.28,29
Thermography, Diskography, CT Diskography
Most expert panels believe that thermography is too nonspecific to be of significant value for the evaluation of spinal disorders. Diskography is a long-standing provocative technique that by nature of direct stimulation, is thought by some to be able to identify painful and concordant disks.1,30 Diskography and CT diskography are still used, especially when other imaging modalities have failed to localize the cause of pain. The morphologic information is not as critical as reproduction of a patient’s characteristic pain. Although some data support its use, prospective well-controlled trials in support of its prognostic value remain absent from the literature.
Degenerative Disk Disease and Stenosis
Degenerative Disk Changes
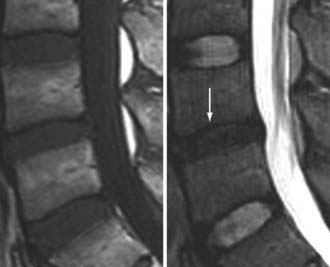
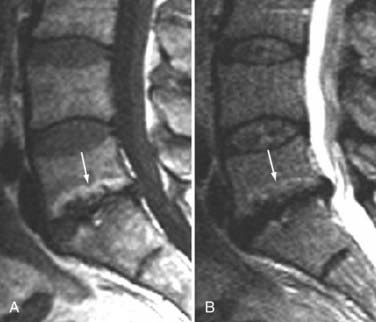
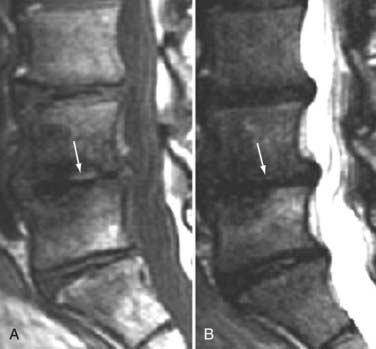
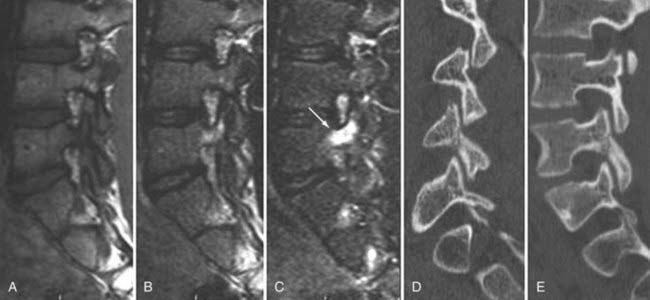
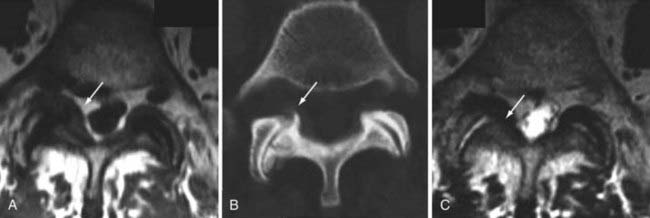
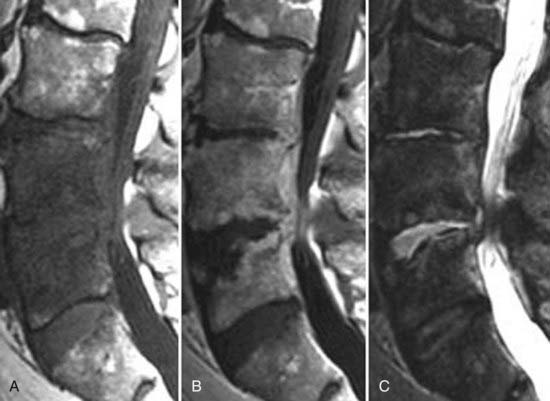
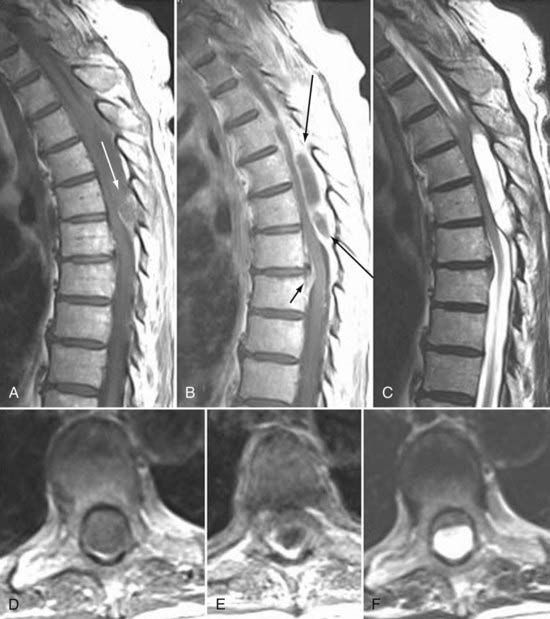
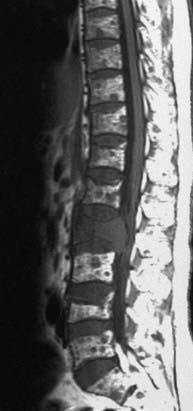
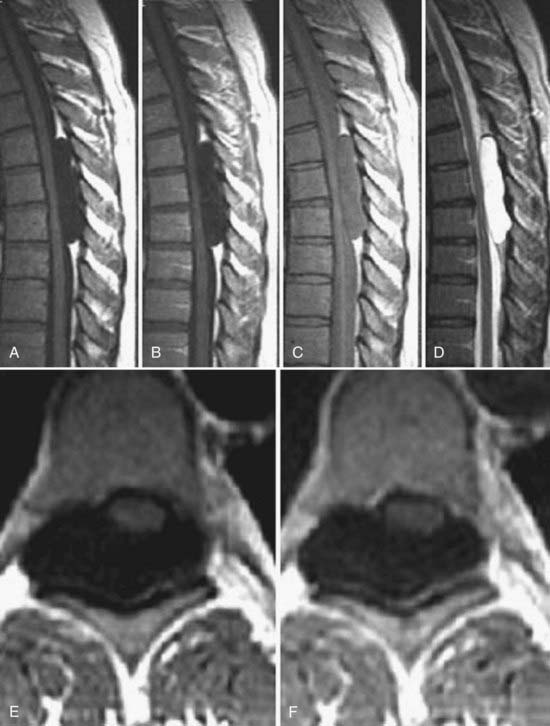
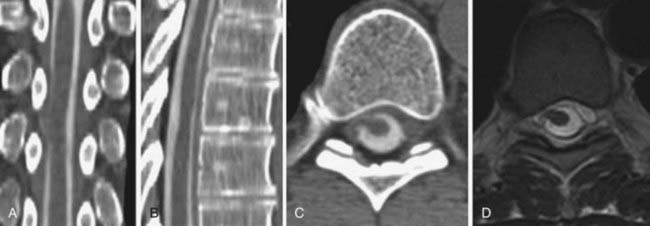
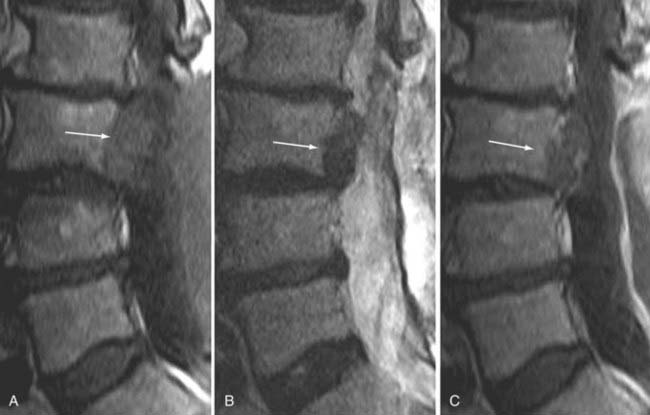
The major cartilaginous joint (amphiarthrosis) of the vertebral column is the intervertebral disk. Each disk consists of an inner portion, the nucleus pulposus, surrounded by a peripheral portion, the annulus fibrosus. The nucleus pulposus is eccentrically located and is closer to the posterior surface of the intervertebral disk. With degeneration and aging, type II collagen increases outwardly in the annulus, and there is greater loss of water from the nucleus pulposus than from the annulus. This results in a loss of the hydrostatic properties of the disk, with an overall reduction in hydration in both areas to about 70%. In addition to water and collagen, the other important biochemical constituents of the intervertebral disk are the proteoglycans. The individual chemical structures of the proteoglycans are not changed with degeneration, but their relative composition is. The ratio of keratin sulfate to chondroitin sulfate increases, and there is a diminished association with collagen, which may reduce the tensile strength of the disk. The decrease in water-binding capacity of the nucleus pulposus is thought to be related to the decreased molecular weight of its nuclear proteoglycan complexes (aggregates). The disk becomes progressively more fibrous and disorganized, with the end stage represented by amorphous fibrocartilage and no clear distinction between the nucleus and annulus.31–33 On T2-weighted images, central disk signal intensity is usually markedly decreased and at distinct variance to that seen in unaffected disks of the same individual. Work with T2-weighed SE sequences34 suggests that MRI is capable of depicting changes in the nucleus pulposus and annulus fibrosus associated with degeneration and aging based on the loss of signal intensity (Fig. 18-9). In work with cadaver spines of various ages, absolute T2 measurements correlated more closely with the glycosaminoglycan concentration than with the absolute water content. Thus, the signal intensity may not be related to the total amount of water but rather the state of the water. At present, the role that specific biochemical changes (proteoglycan ratios, aggregation of complexes) plays in the altered signal intensity is not well understood. Given that the T2 signal intensity in the disk appears to track the concentration and regions with a high percentage of glycosaminoglycan more than the absolute water content, it seems likely that the health and status of the proteoglycans are major determinants of signal intensity.35 It has been proposed that annular disruption is the critical factor in degeneration and that when a radial tear develops in the annulus, there is shrinkage with disorganization of the fibrous cartilage of the nucleus pulposus and replacement of the disk by dense fibrous tissue with cystic spaces (Fig. 18-10).36–40 Annular tears, also properly called annular fissures, are separations between annular fibers, avulsion of fibers from their insertions on the vertebral body, or breaks through fibers that extend radially, transversely, or concentrically and involve one or many layers of the annular lamellae. The term tear or fissure describes the spectrum of such lesions and does not imply that the lesion was caused by trauma (see Fig. 18-1). Although it is established that annular disruption is a sequela of degeneration and is often associated with it, its role as the causal agent of disk degeneration has not been proved. MRI is the most accurate anatomic method for assessing intervertebral disk disease. The signal intensity characteristics of the disk on T2-weighted images reflect changes caused by aging or degeneration. A classification scheme for lumbar intervertebral disk degeneration has been proposed that has reasonable intraobserver and interobserver agreement.41 To date, however, there has been no correlation between disk changes on MRI and a patient’s symptoms. With loss of water and proteoglycans, the nucleus pulposus is desiccated and friable with yellow-brown discoloration. Its onion skin appearance begins to unravel, and cracks, clefts, or crevices appear within the nucleus and extend into the annulus fibrosus. Fissuring, chondrocyte generation, and formation of granulation tissue may be noted within the end plate, annulus fibrosus, and nucleus pulposus of degenerative disks and are indicative of attempts at healing.40 Radiolucent collections (vacuum disk phenomena) representing gas, principally nitrogen, occur at sites of negative pressure produced by the abnormal spaces.42 The vacuum phenomenon within a degenerated disk is represented on SE images as areas of signal void (Fig. 18-11).43 Although the presence of gas within the disk is usually suggestive of degenerative disease, spinal infection may (rarely) be accompanied by intradiscal or intraosseous gas.44 As intervertebral osteochondrosis progresses, there may be calcification of the disk. Calcification has usually been described on MRI as a region of decreased or absent signal intensity. The loss of signal is attributed to a low mobile proton density, as well as, in the case of gradient echo imaging, to its sensitivity to the heterogeneous magnetic susceptibility found in calcified tissue. There is, however, variability in the signal intensity of calcium with various sequences, and the type and concentration of calcification are important factors. Hyperintense disks on T1-weighted MRI may be secondary to calcification (Fig. 18-12).45 For concentrations of calcium particulates of up to 30% by weight, the signal intensity on standard T1-weighted images increases but then subsequently decreases.46,47 These data probably reflect particulate calcium reducing T1 relaxation times by a surface relaxation mechanism. Hyperintensities that are affected by fat suppression techniques have also been noted within intervertebral disks and are thought to be related to ossification with lipid marrow formation in severely degenerated or fused disks.
Degenerative Marrow Changes
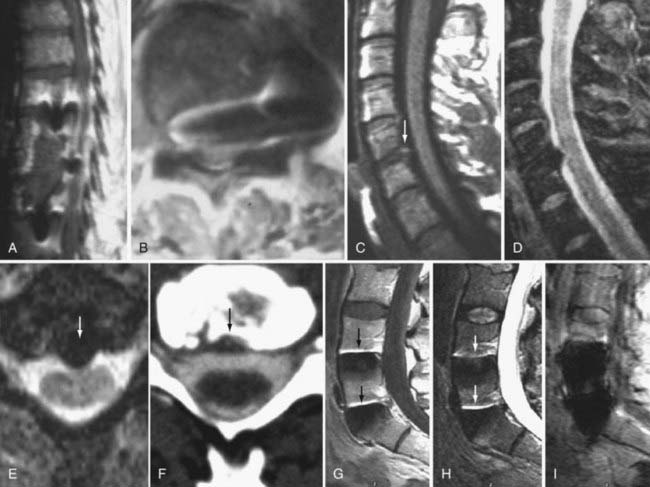
Changes in signal intensity of the vertebral body marrow adjacent to the end plates of degenerated disks are a long recognized and common observation on MRI of the lumbar spine.48,49 However, despite a growing body of literature on this subject, their clinical importance and relationship to symptoms remain unclear.50
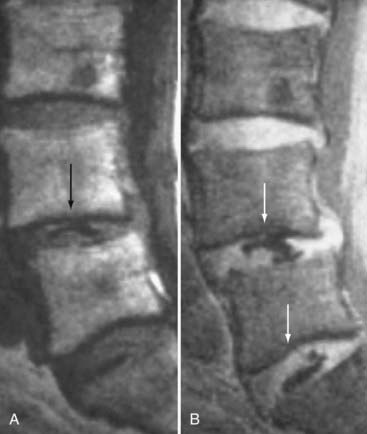
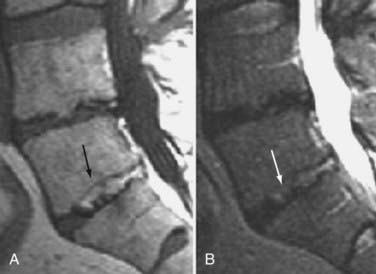
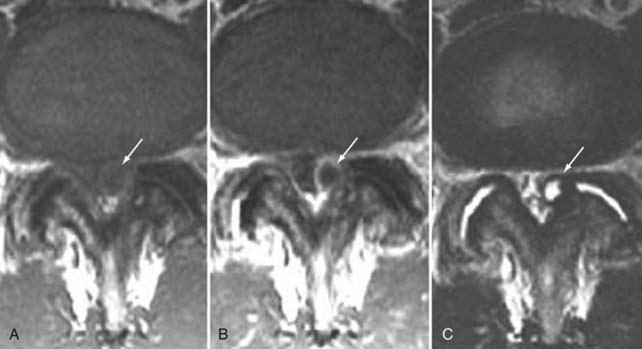
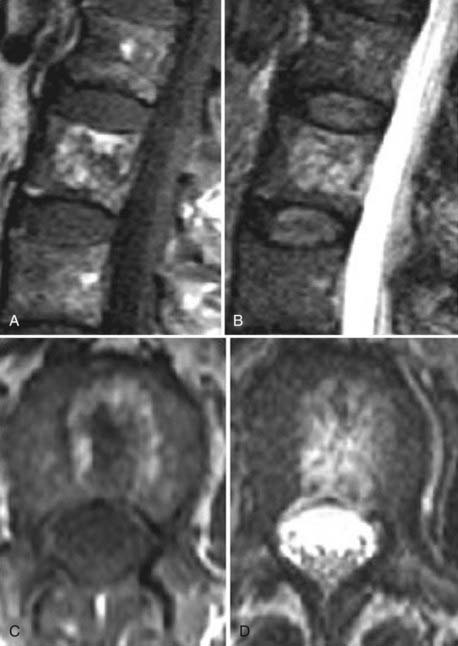
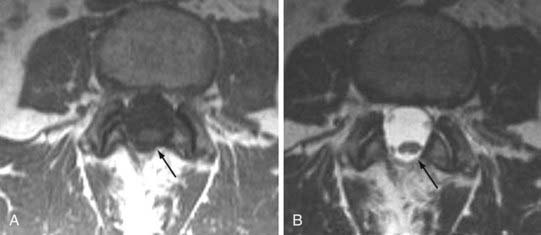
These marrow changes appear to take three main forms. Type I changes consist of decreased signal intensity on T1-weighted images and increased signal intensity on T2-weighted images (Fig. 18-13). They have been identified in approximately 4% of patients scanned for lumbar disease,49 in approximately 8% of patients after diskectomy,51 and in 40% to 50% of chymopapain-treated disks, which may be viewed as a model of acute disk degeneration.52 Histopathologic sections of disks with type I changes show disruption and fissuring of the end plate and vascularized fibrous tissue within the adjacent marrow that prolongs T1 and T2 times. Enhancement of type I vertebral body marrow changes is seen with the administration of gadolinium, and at times the changes extend to involve the disk itself and are presumably related to the vascularized fibrous tissue within the adjacent marrow. Type II changes are represented by increased signal intensity on T1-weighted images and isointense or slightly hyperintense signal on T2-weighted images (Fig. 18-14). They have been identified in approximately 16% of patients on MRI. Disks with type II changes also show evidence of end plate disruption, with yellow (lipid) marrow replacement in the adjacent vertebral body resulting in a shorter T1 time. Type III changes are represented by decreased signal intensity on both T1- and T2-weighted images and correlate with extensive bony sclerosis on plain radiographs. The lack of signal in type III changes no doubt reflects the relative absence of marrow in areas of advanced sclerosis (Fig. 18-15). Unlike types III, types I and II changes show no definite correlation with sclerosis on radiography.53 This is not surprising when one considers the histology; the sclerosis seen on plain radiographs is a reflection of dense woven bone within the vertebral body, whereas the MRI changes are more a reflection of the intervening marrow elements.
Similar marrow changes have also been noted in the pedicles (Fig. 18-16). Although originally described as being associated with spondylolysis, they have also been noted in patients with degenerative facet disease and pedicle fractures.54,55 The exact mechanism by which these marrow changes occur is not known. The association of these marrow changes with degenerative disk disease, facet changes, and pars and pedicle fractures suggest that they are a response to biomechanical stress.
Of these three types, type I changes appear to be more fluid and variable, a reflection of ongoing underlying pathologic processes such as continuing degeneration with associated changing biomechanical stresses. Of the three types, type I is most often associated with ongoing low back symptoms.56–60 In a longitudinal study, the incidence of new degenerative marrow changes was 6% over a 3-year period, with most being type I.58 In a study of nonoperated patients with low back pain, Mitra and associates found that 92% of type I changes converted either wholly or partially to type II (52%), became more extensive (40%), or remained unchanged (8%).57 There was an improvement in symptoms in patients in whom type I changes converted to type II.
Some diskography studies in patients with degenerative marrow changes have suggested that type I marrow changes are invariably associated with painful disks.61,62 Others have failed to reproduce this association,63,64 and thus the relationship between degenerative marrow changes and diskogenic pain remains unproved.
Multiple authors have observed a variety of inflammatory mediators in association with degenerative marrow changes. Burke and colleagues observed an increase in proinflammatory mediators such as interleukin-6, interleukin-8, and prostaglandin E2 in the disks of patients with type I marrow changes who were undergoing fusion for low back pain.64 Ohtori and coworkers found that the cartilaginous end plates of patients with type I marrow changes had more protein gene product (PGP) 9.5 immunoreactive nerve fibers and cells immunoreactive for tumor necrosis factor (TNF) than did patients with normal end plates.65 PGP 9.5 immunoreactivity was seen exclusively in patients with diskogenic low back pain. TNF immunoreactivity in end plates with type I marrow changes was higher than in those with type II marrow changes. The authors concluded that type I marrow changes represent a more active inflammation mediated by proinflammatory cytokines whereas type II and type III changes are more quiescent.50 In a study of infliximab, a monoclonal antibody against TNF-α, Korhonen and associates found that it was most effective when there were degenerative type I marrow changes at the symptomatic level.66 Nevertheless, the relationship of degenerative marrow changes to immunobiologic and cellular response mechanisms, although probably important, remains unclear.
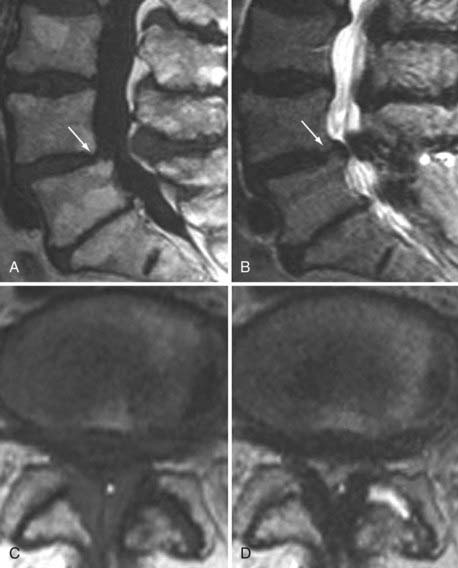
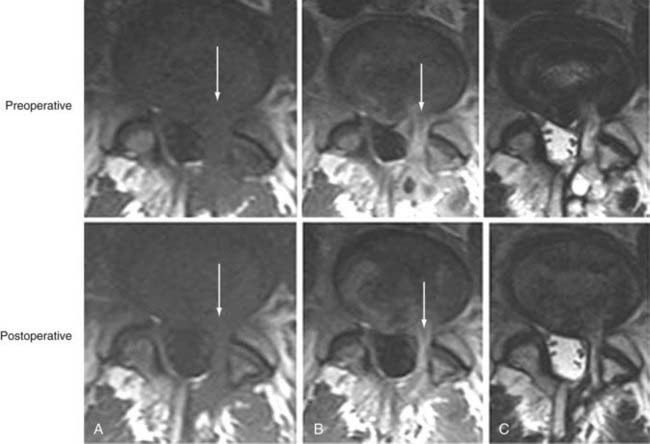
In a study by Toyone and colleagues, 70% of patients with type I marrow changes had segmental hypermobility versus 16% with type II changes.56 Probably the greatest indication that these marrow changes, particularly type I, are related to biomechanical instability is based on observations after fusion. Chataigner and collaborators suggested that patients with type I marrow changes have much better outcomes with surgery than do those with isolated degenerative disk disease and normal or type II marrow changes.67 In addition, conversion of type I marrow changes to either normal or type II was associated with higher fusion rates and better outcomes. Other studies support the contention that persistence of type I changes after fusion suggests pseudarthrosis and is associated with persistent symptoms. Conversely, conversion of type I marrow changes to either normal or type II is associated with higher fusion rates and better outcomes (Fig. 18-17).68–70 The conclusion is that fusion produces greater stability, reduces biomechanical stress, and accelerates the course of type I marrow changes toward improvement.
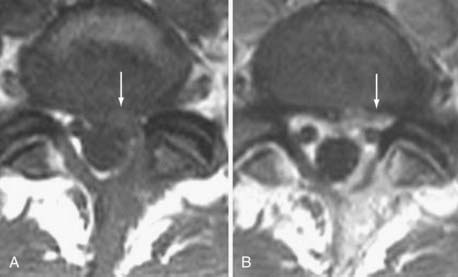
As further support that these fluid marrow changes reflect biomechanical stress, we have seen similar marrow conversion in the pedicles of vertebral bodies associated with symptomatic pars and pedicle fractures, as well as in those with severe degenerative facet joint disease. Pedicle marrow change to a normal or type II appearance is associated with improvement in symptoms.71
Degenerative Facet and Ligamentous Changes
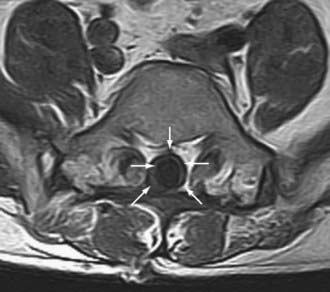
The superior articulating process of one vertebra is separated from the inferior articulating process of the vertebra above by a synovium-lined articulation, the zygapophyseal joint. Like all diarthrodial synovium-lined joints, the lumbar facet joints are predisposed to arthropathy with alterations of the articular cartilage (Fig. 18-18). With disk degeneration and loss of disk space height, the increased stress on the facet joints with craniocaudal subluxation results in arthrosis and osteophytosis. The superior articular facet is usually more substantially involved. Facet arthrosis can result in narrowing of the central canal, lateral recesses, and foramina and is an important component of lumbar stenosis. However, it has been proposed that facet arthrosis may occur independently and be a source of symptoms on its own.72,73 Synovial villi may become entrapped within the joint with resulting joint effusions. The mechanism of pain may be related to nerve root compression from degenerative changes of the facets or direct irritation of pain fibers from the innervated synovial linings and joint capsule.73 Osteophytosis and herniation of synovium through the facet joint capsule may result in synovial cysts, although the cause of these facet joint cysts is unclear. There is a more straightforward relationship of synovial cysts with osteoarthritis and instability of the facet joints than with degeneration of the intervertebral disk alone. In a review of patients with degenerative facet disease, synovial cysts occurred at anterior or intraspinal locations in 2.3% of patients and at posterior or extraspinal locations in 7.3% (Fig. 18-19).74 The important ligaments of the spine include the anterior longitudinal ligament, the posterior longitudinal ligament, the paired sets of ligamenta flava (connecting the laminae of adjacent vertebrae), the intertransverse ligaments (extending between transverse processes), and the unpaired supraspinous ligament (along the tips of the spinous processes). Because these ligaments normally provide stability, any alteration in the vertebral articulations can lead to ligamentous laxity with subsequent deterioration. Loss of elastic tissue, calcification and ossification, and bone proliferation at sites of ligamentous attachment to bone are recognized manifestations of such degeneration. Excessive lordosis or extensive disk space loss in the lumbar spine leads to close approximation and contact of the spinous processes and to degeneration of intervening ligaments.75,76 Histologically, granulomatous reaction and perivascular cellular infiltration characterize the condition.
Morphologic and Functional Sequelae
Instability
Segmental instability can result from degenerative changes involving the intervertebral disk, vertebral bodies, and facet joints that impair the usual pattern of spinal movement and produce motion that is irregular, excessive, or restricted. It can be translational or angular. Spondylolisthesis results when one vertebral body becomes displaced relative to the next most inferior vertebral body. The most common types are classified as degenerative, isthmic, iatrogenic, and traumatic. Degenerative spondylolisthesis is seen usually with an intact pars interarticularis, is related primarily to degenerative changes of the apophyseal joints, and is most common at the L4-5 vertebral level (Fig. 18-20). The predilection for degenerative spondylolisthesis at that level is thought to be related to the more sagittal orientation of the facet joints, which makes them increasingly prone to anterior displacement. Degenerative disk disease may predispose to or exacerbate this condition secondary to narrowing of the disk space, which can produce subsequent malalignment of the articular processes and lead to rostrocaudal subluxation.
Herniation
Herniation refers to localized displacement of nucleus, cartilage, fragmented apophyseal bone, or fragmented annular tissue beyond the intervertebral disk space. The disk space is defined rostrally and caudally by the vertebral body end plates and peripherally by the outer edges of the vertebral ring apophyses, exclusive of osteophytic formations. The term localized contrasts with the term generalized, the latter being arbitrarily defined as greater than 50% (180 degrees) of the periphery of the disk.77 Displacement, therefore, can occur only in association with disruption of the normal annulus or, as in the case of intravertebral herniation (Schmorl’s node), a break in the vertebral body end plate. Because details of the integrity of the annulus are often unknown, the diagnosis of herniation is usually made by observation of localized displacement of disk material beyond the edges of the ring apophyses—that is, less than 50% (180 degrees) of the circumference of the disk (Fig. 18-21). Localized displacement in the axial (horizontal) plane can be focal, or less than 25% of the disk circumference, or broad based, between 25% and 50% of the disk circumference. The presence of disk tissue circumferentially (50% to 100%) beyond the edges of the ring apophyses may be called bulging and is not considered a form of herniation. A disk may have more than one herniation. The term herniated disk does not imply any knowledge of etiology, relationship to symptoms, prognosis, or need for treatment. When data are sufficient to make the distinction, a herniated disk may be more specifically characterized as protruded or extruded. These distinctions are based on the shape of the displaced material. Protrusion is present if the greatest distance, in any plane, between the edges of the disk material beyond the disk space is less than the distance between the edges of the base in the same plane (Fig. 18-22). Extrusion is present when, in at least one plane, any one distance between the edges of the disk material beyond the disk space is greater than the distance between the edges of the base in the same plane or when no continuity exists between the disk material beyond the disk space and that within the disk space (Fig. 18-23). Extrusion may be further specified as sequestration if the displaced disk material has completely lost any continuity with the parent disk. The term migration may be used to signify displacement of disk material away from the site of extrusion, regardless of whether it is sequestrated (Fig. 18-24). Herniated disks in the craniocaudal (vertical) direction through a break in the vertebral body end plate are referred to as intravertebral herniations. Nonacute Schmorl’s node intrabody herniations are common spinal abnormalities regarded as incidental observations. They have been reported in 38% to 75% of the population.78,79 Although intrabody herniations may occur as a result of end plate weakness secondary to bone dysplasia, neoplasms, infections, or any process that weakens the end plate or the underlying bone, most intrabody herniations probably form after axial-loading trauma, with preferential extrusion of nuclear material through the vertebral end plate rather than an intact and normal annulus fibrosus. It has been suggested that asymptomatic intrabody herniations may be traceable to a specific occurrence of acute nonradiating low back pain in the patient’s history, which supports the concept that intrabody herniations (Schmorl’s nodes) occur through sites of end plate fracture. Type I vertebral body marrow changes have been described surrounding acute interbody herniations.80
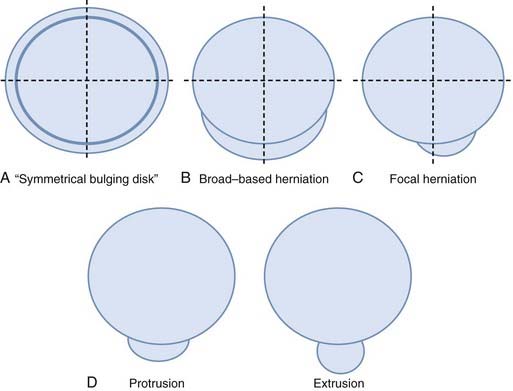
FIGURE 18-21 A, Symmetrical bulging disk. B, Broad-based herniation. C, Focal herniation. D, Protrusion and extrusion.
Stenosis
Spinal stenosis was defined in 1975 as any type of narrowing of the spinal canal, nerve root canals, or intervertebral foramina.81 Two broad groups have been defined: acquired (usually related to degenerative changes) and congenital or developmental. Developmental stenosis can be exacerbated by superimposed acquired degenerative changes (Fig. 18-25). In the acquired type, there has been no association between the severity of pain and the degree of stenosis. The most common symptoms are sensory disturbances in the legs, low back pain, neurogenic claudication, weakness, and relief of pain by bending forward. The imaging changes are in general more extensive than expected from the clinical findings.82 Patients with symptoms referable to spinal stenosis tend to have narrower spines than asymptomatic patients do. Although there appears to be a correlation between cross-sectional area and midsagittal measurements in patients with symptomatic spinal stenosis, absolute values and correlation between measurements and symptoms are lacking. The degree of stenosis is not static; extension worsens the degree of central and foraminal stenosis by 11%, whereas flexion appears to improve it by an average of 11%. Segmental instability, which can cause static and dynamic stenosis, is considered a cause of low back pain but is poorly defined.83 Some evidence suggests that disk degeneration, narrowing of the spinal canal, and degenerative changes in the facets and spinal ligaments contribute to stenosis and that instability increases with age. Unfortunately, there do not appear to be reliable prognostic imaging findings that correlate with surgical success or even predict whether patients will benefit from surgery.84
Significance of Imaging Findings
Given the high prevalence of degenerative morphologic alterations, the role of an imaging test is to provide accurate morphologic information and influence therapeutic decision making.85 A necessary component that connects these two purposes is accurate natural history data. Any study looking at the natural history of degenerative disk disease is confounded by the high prevalence of morphologic changes in the asymptomatic population.86–88 Twenty percent to 28% of asymptomatic patients demonstrate disk herniations, and the majority have evidence of additional degenerative disk disease.86–88 In a study of symptomatic patients with low back pain or sciatica, the prevalence of disk herniation in those with low back pain and in those with radiculopathy at initial evaluation was similar.89 There was a higher prevalence of herniation, 57% in patients with low back pain and 65% in patients with radiculopathy, than the 20% to 28% prevalence reported in asymptomatic series.87,88 In studies of the natural history of disk herniation, many show regression of the disk fragment over time. In general, a third of patients with disk herniation at initial examination exhibit significant resolution or disappearance by 6 weeks and two thirds by 6 months.89,90 The type, size, and location of herniation at diagnosis and changes in herniation size and type over time did not correlate with outcome. In fact, the presence of herniation on MRI was a positive prognostic finding.89 Interestingly, not only do disk herniations have a tendency to regress, but new or larger ones may also appear after the onset of symptoms. In this study, new or larger disk herniations developed in 13% of patients in this symptomatic series over a 6-week period. The lack of prognostic value of imaging studies also applies to the conservative management of spinal stenosis. There do not appear to be reliable prognostic imaging findings that correlate with surgical success or even with whether patients will benefit from surgery.84,91 Demographic and clinical features appear to predict the outcome of nonsurgical treatment, whereas the morphometric features of disk herniation and spinal stenosis in conjunction with clinical features are more powerful predictors of surgical outcome.92
Osteomyelitis
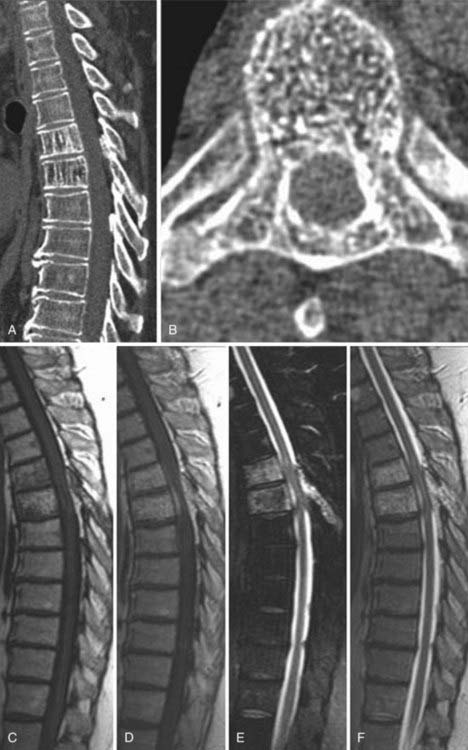
In general, the early findings of disk space infection on plain films consist of minimal disk space narrowing and erosion or indistinctness of the end plates. There may be adjacent paraspinal soft tissue swelling, which in the lumbar region may be detectable as enlargement of a paravertebral soft tissue shadow, in the thoracic region as a paraspinal mass, and in the cervical region as prevertebral soft tissue swelling. As the disease progresses, the disk space narrowing worsens, and destruction of the end plates becomes more obvious (Fig. 18-26). In healing, the disk space remains markedly narrowed or fuses.
CT is most useful for the detection of bony destruction and paraspinal soft tissue changes. The addition of intrathecal contrast material improves the delineation of epidural masses. CT demonstrates a decrease in attenuation of the affected vertebral body and disk. CT criteria for the diagnosis of pyogenic vertebral osteomyelitis include diffuse moth-eaten or permeative bone destruction, gas within the bone or adjacent soft tissues, involvement of the intervertebral disk primarily, and prevertebral soft tissue involvement.77,81,93
MRI has a sensitivity of 96%, a specificity of 92%, and an accuracy of 94% in the diagnosis of vertebral osteomyelitis.55,93 The classic MRI appearance of vertebral osteomyelitis is as follows: a confluent decreased signal intensity of the intervertebral disk and adjacent vertebral bodies with an inability to discern a margin between the two on T1-weighted images, increased signal intensity of the vertebral bodies adjacent to the involved disk on T2-weighted images, and an abnormal configuration and increased signal intensity of the intervertebral disk and the presence of paravertebral soft tissue swelling.93 The addition of gadolinium has been found to increase the accuracy of the diagnosis of vertebral osteomyelitis in equivocal cases.82,93 The involved portions of the adjacent vertebral body and disk will typically enhance after the administration of gadolinium (Fig. 18-27).
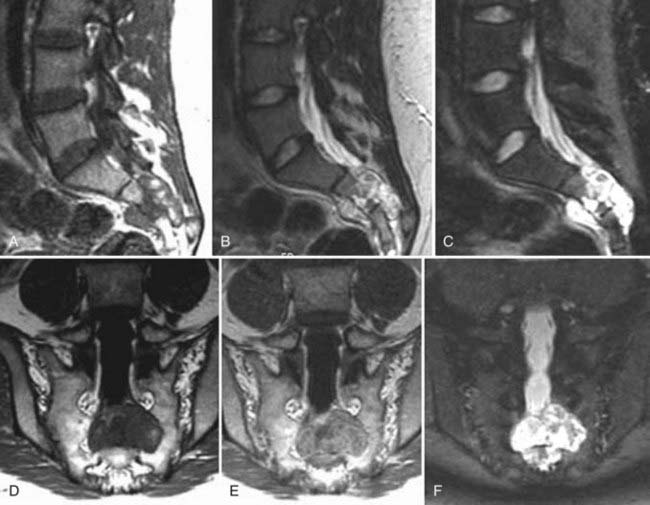
The presence of abnormal soft tissue in a paraspinal epidural location raises the differential consideration of inflammatory phlegmon versus abscess. These soft tissue masses can produce various degrees of encroachment on the central canal and foramina. The typical phlegmon is a homogeneously enhancing soft tissue mass on T1-weighted images and is usually hyperintense on T2 and STIR images. An epidural abscess characteristically demonstrates a peripherally enhancing fluid or soft tissue collection (Fig. 18-28). Epidural metastases may look like phlegmon, and large migrated extruded disks may demonstrate peripheral enhancement and require differentiation from an abscess. Other differential considerations include epidural lipomatosis, which has a more characteristic fat signal on T1, and epidural hematomas, which are more variable on T1 and T2 and usually demonstrate loss of signal on gradient echo images as a result of the presence of blood by-products. More recently, it has been suggested that restricted diffusion is characteristic of an abscess.94,95
Neoplasms
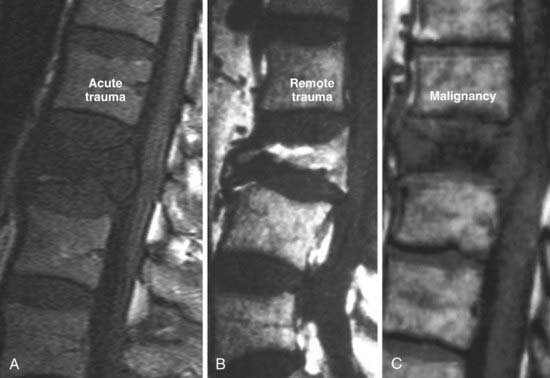
In the extradural space, the most common spinal neoplasms are metastatic lesions. Conventional radiographs usually remain negative until 50% to 70% of the bone has been destroyed. Radionuclide studies (technetium 99–labeled SPECT) have high sensitivity with larger lesions, especially if there is cortical involvement. MRI provides coverage of the spinal axis and is more sensitive than other modalities to the presence of marrow replacement. The characteristic MRI finding in lytic metastases is decreased signal intensity of the marrow space on T1-weighted images (Fig. 18-29). This finding may be solitary, multiple, or diffuse (Fig. 18-30). Typically in adults, the vertebral body marrow signal on T1-weighted images is brighter than that of adjacent disks. Reversal of this signal intensity ratio after the age of 40 is a cause for concern. Lesions on T2-weighted imaging are more variable and can range from hypointense to hyperintense. STIR sequences usually demonstrate high signal intensity, and the appearance on diffusion-weighted images is variable. The presence of epidural disease is easily evaluated. Major differential considerations from an imaging perspective are hematopoietic malignancies such as plasmacytoma, benign osteoporotic compression fractures, and necrosis of a vertebral body. Normal heterogeneous marrow signal intensity may also be somewhat confusing. In hematopoietic malignancies, the marrow signal intensity may be patchy or diffusely decreased. Blastic osseous metastases often demonstrate hypointensity on T1-weighted, STIR, and T2-weighted images because the sclerotic bony changes overwhelm the marrow signal intensity. More benign conditions that need to be considered in the differential diagnosis include hemangiomas, osteodystrophy, Paget’s disease, osteomyelitis, and severe degenerative marrow changes. Distinction between benign and malignant compression fractures on imaging can often be difficult (Fig. 18-31). The typical benign compression fracture has a relatively homogeneous decreased intensity of the vertebral body marrow signal and may have patchy areas of more normal marrow. The posterior elements are involved in less than 25% of cases. From a morphologic perspective, a compressed vertebral body demonstrates fragmentation and may be associated with intrabody disk herniations. Additional fractures are seen in 50% of patients. In contrast, malignant compression fractures show diffuse replacement of the vertebral body marrow signal intensity, which is almost complete in the presence of volume loss. The posterior elements are involved more than 90% of the time. The compressed body has convex rather than fragmented margins. Additional metastatic lesions are common. Compression fractures caused by remote trauma tend to have a more normal or fatty marrow signal intensity and can easily be distinguished from acute trauma or malignant infiltration.
MRI is the imaging examination of choice and the most sensitive imaging study for the detection of marrow involvement and paravertebral tumor extension. It has, in most cases, replaced myelography for the evaluation of spinal cord compression because it is able to evaluate areas between the myelographic block. It is 95% accurate in detecting metastatic compression of the cord and cauda equina.96–98
Multiple myeloma is an important differential consideration in patients with abnormal marrow signal intensity. On conventional radiographs, it is often seen as diffuse osteopenia or multiple lytic lesions. CT may demonstrate lytic lesions, cortical disruption, or extraosseous soft tissue; however, these findings are nonspecific and may be related to any number of etiologies. On MRI, the marrow signal intensity may have a normal focal, diffuse, or heterogeneous pattern (Fig. 18-32) with foci of decreased intensity on T1-weighted images. There is concomitant osteopenia in 85% of patients and multiple lytic lesions in 80%. Vertebral fractures in patients with multiple myeloma may appear benign with a fragmented appearance. Bone scintigraphy is notoriously insensitive and detects less than 10% of lesions.99,100
Hemangiomas, on conventional radiographs, demonstrate coarse vertical bony trabeculae. On axial CT, these lesions are often manifested as a “corduroy” pattern of thickened trabeculae with intervening low-attenuation fat. On MRI, the intraosseous portions often appear mottled and have increased signal intensity on T1 images secondary to adipose tissue interspersed among thickened bony trabeculae. On T2-weighted images, both intraosseous and extraosseous tumor demonstrates increased signal intensity, presumably related to the more vascular and cellular components of the tumor (Fig. 18-33). Although this is the typical appearance of an intraosseous hemangioma, variable signal intensity on T1- and T2-weighted images is not uncommon. Incidental intraosseous hemangiomas are a common finding on MRI of the spine. The primary differential consideration is another normal incidental finding, a lipid marrow rest. Vertebral body hemangiomas can extend extraosseously and, particularly in the thoracic region, can produce severe cord compression (Fig. 18-34).
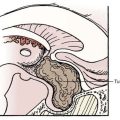
Chordomas are typically seen on conventional radiographs as radiolucent lesions or heterogeneous destructive masses, usually of the sacrum or vertebral body. On CT, chordomas also appear destructive and may have a large paraspinal soft tissue mass. Sclerosis is seen in almost half the cases. The sacral coccygeal region is the most common location (50%), followed by the spheno-occipital (35%) and vertebral bodies elsewhere (15%). On MRI, chordomas typically appear as heterogeneous hypointense to isointense lesions on T1 and hyperintense lesions on T2 with low-signal septations indicative of fibrous stroma (Fig. 18-35).
Intradural Extramedullary Tumors
Meningiomas are most commonly located in the thoracic region in a lateral or posterolateral location. On conventional radiographs the only finding may be focal intraspinal calcification. On CT, an isointense to hyperintense mass, relative to muscle, is the usual appearance on a nonenhanced study. After intravenous contrast administration there may be homogeneous enhancement. Adjacent bone may be hyperostotic. The MRI findings of an intraspinal meningioma are similar to those seen intracranially. On T1-weighted images the mass is isointense with spinal cord. On T2 the mass remains isointense or slightly hypointense in comparison to adjacent spinal cord. Rarely, it may be hyperintense. There is usually prominent homogeneous enhancement after contrast administration (Fig. 18-36). An enhancing dural tail, commonly seen intracranially, is less common intraspinally.101 The common differential consideration is a schwannoma or nerve sheath tumor, which often has higher signal intensity on T2-weighted images, may be cystic, and may be more commonly associated with hemorrhage. Other differential considerations are paraganglioma, epidermoid, arachnoid cyst, intradural metastasis, or lymphoma.
Schwannomas are characterized by a well-circumscribed intraspinal masses; they are most commonly located in an intradural extramedullary location. Fifteen percent may have an extradural component. An enlarged intravertebral foramen and thin pedicle are conventional radiographic signs of a long-standing mass. Schwannomas tend to be more hyperintense on T2-weighted images and have cystic changes or hemorrhage more often than meningiomas do. They are indistinguishable from solitary neurofibromas by imaging (Fig. 18-37).102,103 Spinal involvement in neurofibromatosis is most common in type 2. Schwannomas in this condition may be solitary or multiple and can appear solid or cystic (Fig. 18-38).
Dermoid and epidermoid tumors are usually either intradural extramedullary (60%) or intramedullary (40%). The lower thoracic and lumbar regions are the most common locations. Conventional radiographs are generally normal but may demonstrate benign spinal canal widening with flattening of the pedicles and laminae. On CT these tumors are usually seen as well-demarcated masses with attenuation similar to that of CSF. The presence of calcification is more suggestive of a dermoid than an epidermoid tumor. Again, there may be focal osseous erosion or spinal canal widening. On MRI, dermoids are typically hypointense to hyperintense on T1 with variable signal intensities that reflect fat (hyperintense on T1) or calcium (decreased signal intensity on T1) (Fig. 18-39). Epidermoids are usually isointense on T1. Both tumors demonstrate increased signal intensity on T2-weighted images. Typically, these tumors do not enhance after contrast administration and may demonstrate restricted diffusion.
Myxopapillary ependymomas represent 90% of filum tumors. They occur exclusively in the conus and filum terminale, are slow growing, and may fill the entire spinal canal. Conventional radiographs and CT may demonstrate vertebral body scalloping and canal enlargement (Fig. 18-40).
Leptomeningeal disease is silent on conventional radiographs and on myelography is manifested by filling defects of variable size within the subarachnoid space. Non–contrast-enhanced CT is usually normal unless there is coexisting extradural disease, as in the case of metastatic breast or lung carcinoma. On MRI, leptomeningeal disease is generally isointense with the spinal cord and nerve roots and, when extensive, may be manifested as a diffuse increase in the signal intensity of the CSF space on T1-weighted images with a so-called ground-glass appearance. Nerve roots may appear blurred or less distinct. On T2-weighted images, leptomeningeal disease is usually isointense with neuroelements or may be manifested as thickened nerve roots within the subarachnoid space. On contrast-enhanced T1-weighted images, there is obvious enhancement that may be diffuse, nodular, or linear. The most common cause is hematogenous dissemination from extracranial neoplasms such as adenocarcinoma (Fig. 18-41) of the lung or breast, melanoma, lymphoma, and metastases. In children and young adults, primitive neuroectodermal tumors are most commonly manifested as leptomeningeal disease. Differential considerations include inflammatory conditions such as hemangic meningitis, granulomatous meningitis (tuberculosis and sarcoidosis), congenital hypertrophic polyradiculoneuropathy, thickened nerve roots secondary to inflammatory conditions such as Guillain-Barré syndrome, polyneuropathy associated with acquired immunodeficiency syndrome, and chronic interstitial demyelinating polyneuropathy and arachnoiditis (see Fig. 18-41).104
Arachnoid cysts are typically intradural extramedullary loculated CSF collections that can be manifested as space-occupying lesions. Type I is an extradural meningeal cyst that contains no neural tissue (Fig. 18-42). Type II includes extradural meningeal cysts that contain neural tissue, and type III includes intradural meningeal cysts. Type II, or perineural cysts/Tarlov’s cysts, is more commonly encountered and contains nerve roots, often adherent to the cyst’s wall. Type III consists of spinal intradural meningeal cysts (arachnoid cysts), which are thought to arise from the diverticulum of the arachnoid. When long-standing, they may produce posterior vertebral body scalloping and thinning of the pedicles with a widened intrapedicular distance on conventional radiographs. On myelography, intradural cysts produce an intrathecal filling defect and extradural effacement of the subarachnoid space. Depending on their size, they may result in spinal cord compression. On CT, non–contrast-enhanced studies show isoattenuation with adjacent CSF, and there may be evidence of cord displacement. After intrathecal contrast administration an intradural arachnoid cyst may be difficult to visualize if it is opacified, but it otherwise appears as a filling defect with a mass effect. Delayed imaging with postmyelographic CT often results in opacification of the cyst with decreased attenuation in the generalized subarachnoid space. On MRI, CSF signal intensity is that of CSF that does not usually share the same degree of pulsations as the general subarachnoid space. T2-weighted images are equivalent to CSF but again may lack CSF flow signal changes. There is no enhancement after contrast administration, and the walls of the cyst may be impossible to resolve. Differential considerations include large degenerative cysts, dural ectasia, and spinal cord herniation.
Spinal cord herniation occurs through a defect in the dura, which is usually ventral. Clinically, these patients usually have unexplained chronic progressive leg pain and myelopathy. Imaging findings are those of anterior displacement of the thoracic cord with apparent expansion of the dorsal subarachnoid space. It is usually located in the midthoracic region. On myelography, there is either displacement of the cord or a focal deformity anteriorly. CT myelography is helpful in defining the deformity. MRI demonstrates cord displacement anteriorly, which is usually focal. The increased dorsal subarachnoid space can mimic the appearance of a type I arachnoid cyst (Fig. 18-43).105,106
Intramedullary Disease and Tumors
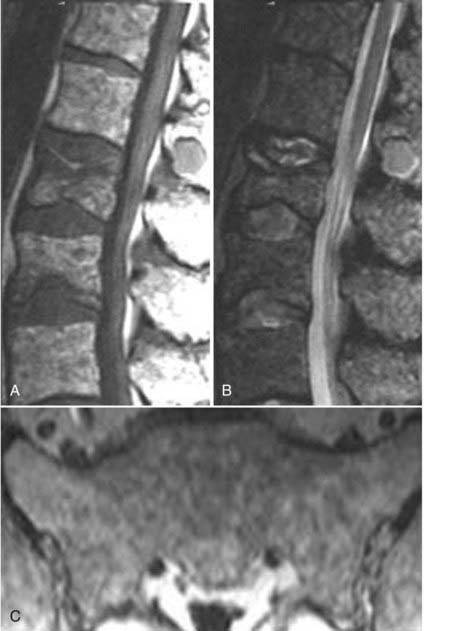
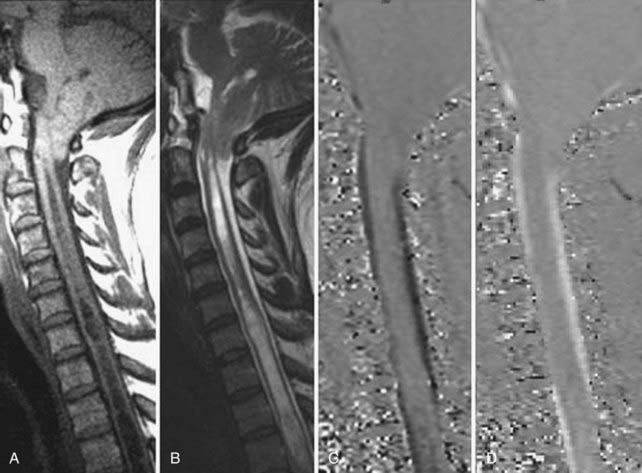
Ten percent to 20% of patients with multiple sclerosis have isolated spinal cord disease, most commonly affecting the cervical region in the dorsal lateral aspect of the cord (Fig. 18-44). These usually appear as well-circumscribed hyperintense lesions on T2 with homogeneous, nodular, or ring enhancement after contrast administration. Long-standing disease is often manifested as cord atrophy. Top differential considerations are other intramedullary diseases, neoplasms, or other causes of acute transverse myelitis.
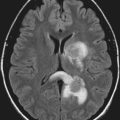
The most common primary neoplasms of the spinal cord are ependymomas and astrocytomas. In general, it is usually impossible to differentiate between the two with imaging. Typically, primary cord tumors demonstrate expansion of the cord, low signal intensity on T1, and high signal intensity on T2 with variable contrast enhancement. Ependymomas are more likely to have associated blood by-products and large satellite cysts (Fig. 18-45). When long-standing, ependymomas may have the conventional radiographic findings of canal widening and posterior vertebral body scalloping. T1-weighted images demonstrate an isointense to slightly hypointense spinal cord mass, which may or may not have associated hemorrhage. T2-weighted images demonstrate hyperintense signal, often associated with intratumoral cysts similar to CSF in signal intensity. The majority of these lesions enhance in a homogeneous fashion, although nodular peripheral enhancement is possible.107 The imaging findings of astrocytoma are similar to those of ependymomas, and typically most enhance (Fig. 18-46). Patients with ependymomas are typically older, hemorrhage is more common, and the prevalence in the lower thoracic region is higher. Cystic or necrotic components are more common in ependymomas.
Less common intramedullary tumors include hemangioblastoma, oligodendroglioma, ganglioglioma, lymphoma, metastatic disease, lipoma, schwannoma, or dermoid/epidermoid tumor.108
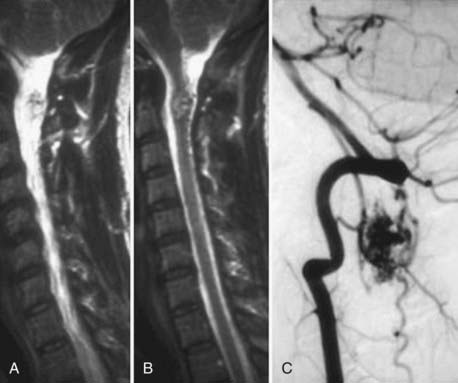
Thirty percent of patients with hemangioblastomas have von Hippel-Lindau syndrome, which may be associated with pancreatic cysts, renal cell carcinoma, renal cysts, and retinal angiomas. The thoracic region is more commonly involved than the cervical. Most are associated with a cyst. Typically, the hemangioblastoma is an expansile cord mass that is hypointense on T1 and hyperintense on T2. After contrast administration, there is usually homogeneous intense enhancement of the nodule or mass. Generally, extensive cord edema extends from the region of the mass, and in some cases hydrosyringomyelia is present. The angiographic findings typically demonstrate an intense prolonged vascular stain that may be associated with arteriovenous (AV) shunting and enlarged spinal arteries (Fig. 18-47). Hemangioblastomas may be single or multiple.109
Intramedullary cystic cavities may be idiopathic, congenital, associated with congenital abnormalities such as Chiari malformations, secondary to trauma, postoperative, secondary to arachnoiditis, or found as a satellite cyst associated with a tumor (Fig. 18-48). Pathologically, these cavities are lined by either neural fibrous or ependymal elements, in distinction to intratumoral cysts, which are characteristically lined by neoplastic cells. Differentiation requires contrast material; intratumoral cysts often exhibit peripheral enhancement, whereas hydrosyringomyelia or satellite cysts associated with tumors may not.110
Congenital Abnormalities
In addition to ultrasound, MRI has also proved useful in fetal imaging of congenital abnormalities. For disorders of the neural tube that have been diagnosed with ultrasound, MRI can provide additional information in determining the level and contents of a suspected myelomeningocele and demonstrating the presence and severity of associated Chiari II malformations and ventriculomegaly in the presence of open spinal neural tube defects. MRI can be used to assess the morphology of the brainstem and cortex and provide useful prognostic information (Fig. 18-49).
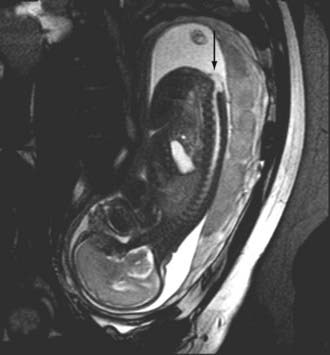
Open dysraphic states are usually closed surgically within 24 to 48 hours of birth. Subsequently, patients are referred for imaging to evaluate any change in neurological status that may be related to Chiari II malformations or other associated abnormalities or after myelomeningocele closure or shunted hydrocephalus (Fig. 18-50).
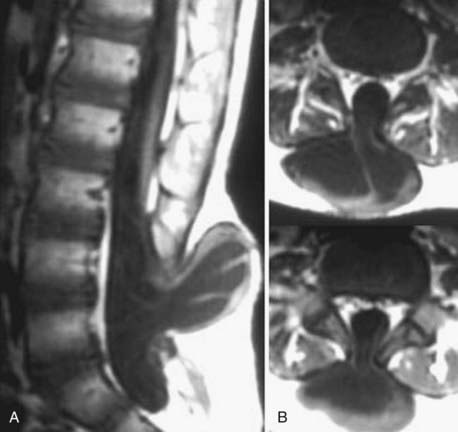
MRI signal intensity characteristics are useful in the assessment and differentiation of a series of disorders. In lipomyelomeningocele or lipomas, MRI demonstrates the relationship of a T1 hyperintense lipoma and neural elements and is useful for surgical planning (Fig. 18-51).
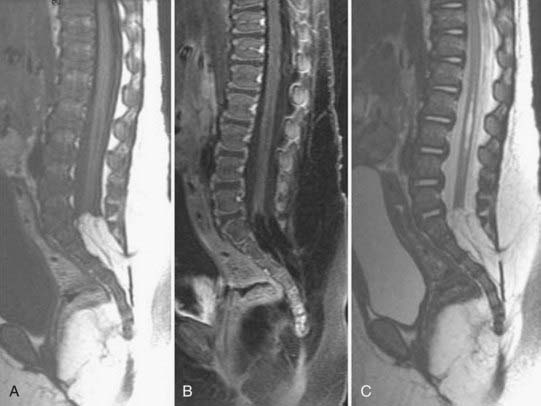
Dermal sinuses, or epithelial tracks extending from the skin surface into deeper tissues, often end in a dermoid/epidermoid or lipoma. The patient may have infection secondary to an abscess. On MRI a dermal sinus generally appears as a relative hypointensity (Fig. 18-52). Uninfected dermoid/epidermoid tumors do usually not enhance and may exhibit restrictive diffusion. They may be hypointense to CSF on MRI sequences, but their characteristics are variable. If infected, paramagnetic contrast material may be helpful in that it usually enhances.
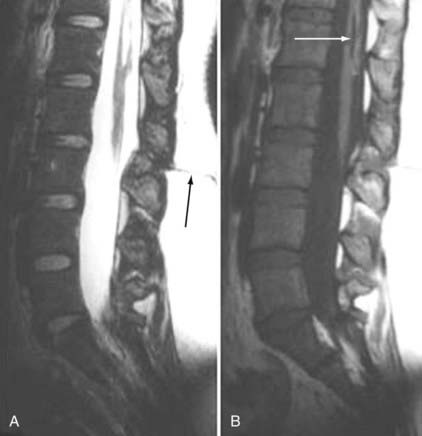
Diastematomyelia, the most common neurenteric or split notochord entity, may require several imaging modalities for full anatomic delineation (Fig. 18-53). Plain films may show spina bifida, intersegmental laminar fusion, anomalies of the vertebral bodies, and kyphoscoliosis. For septal definition, axial SE T2-weighted MRI, axial gradient echo T2-weighted MRI, CT, or CT myelography may be necessary. Other commonly associated abnormalities, including a thickened filum, developmental tumors (lipomas, dermoid/epidermoid), and hydromyelia, can be depicted.
Imaging of Vascular Disorders of the Spine
Vascular Malformations of the Spine and Spinal Cord
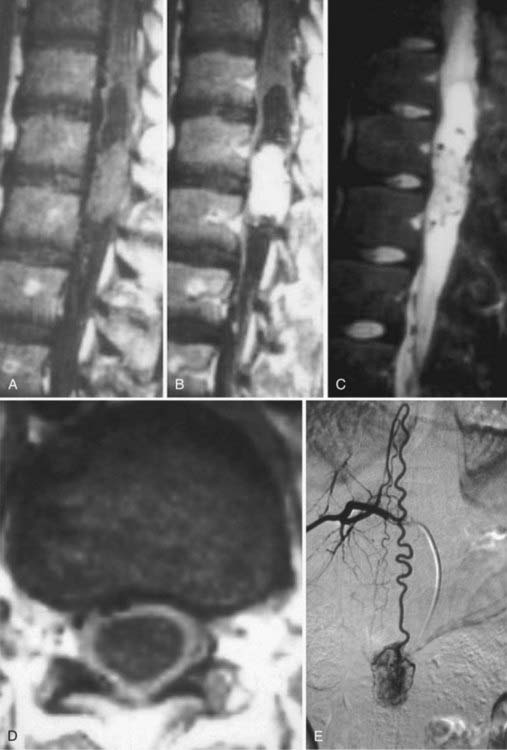
Spinal vascular malformations are a heterogeneous group of non-neoplastic vascular abnormalities that account for 3% to 16% of spinal mass lesions. The current classification system is based on the angioarchitecture and hemodynamics of the lesion as defined by spinal angiography. The major groups of spinal vascular malformations include spinal-dural arteriovenous fistulas (SDAVFs) (Fig. 18-54), spinal cord arteriovenous malformations (SCAVMs) (Fig. 18-55), perimedullary spinal cord arteriovenous fistulas (SCAVFs) (Fig. 18-56), and cavernous malformations (Fig. 18-57).111
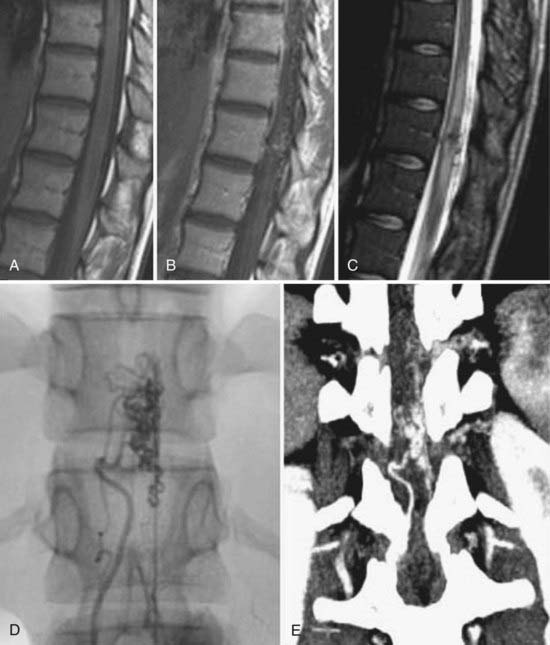
MRI is the imaging modality of choice for the diagnosis of SCAVFs. The presence of enlarged feeding and draining vessels demarcated by flow voids is the characteristic finding. Cord signal abnormalities and evidence of previous hemorrhage may be present. The lack of a true nidus may help differentiate SCAVFs from SCAVMs. Once a diagnosis is suspected based on MRI findings, spinal angiography is recommended for confirmation of the diagnosis and further characterization of the angioarchitecture for planning treatment.115
Cavernous malformations are slow-flow vascular malformations with no AV shunting. They are usually intraparenchymal and can occur throughout the spinal cord, cauda equina, and filum terminale. In most cases they are well-demarcated lesions with surrounding hemosiderin deposition. MRI is the imaging modality of choice for cavernomas and is often diagnostic because of their relatively unique imaging characteristics. A rim of low signal intensity usually surrounds the lesion and represents iron storage products. The lesion is seen as heterogeneous signal abnormalities within the cord on both T1- and T2-weighted images secondary to blood products of various ages within the lesion. Angiography is not helpful in the diagnosis of cavernous malformations (see Fig. 18-57).116–118
Cord infarction or ischemia is a devastating entity best identified by MRI. Patients generally have a relatively rapid onset of paraparesis or quadriparesis. The most common causes of spinal cord infarction are related to embolic disease resulting from therapeutic intervention, aortic dissection, and hematologic diseases. MRI usually demonstrates nonspecific increased signal intensity on T2-weighted images involving variable lengths of the cervical or thoracic cord and may demonstrate restricted diffusion. T1-weighted images are often normal or demonstrate slight expansion of the cord (Fig. 18-58).
Postoperative Imaging of the Spine and Spinal Cord
Magnetic Resonance Imaging
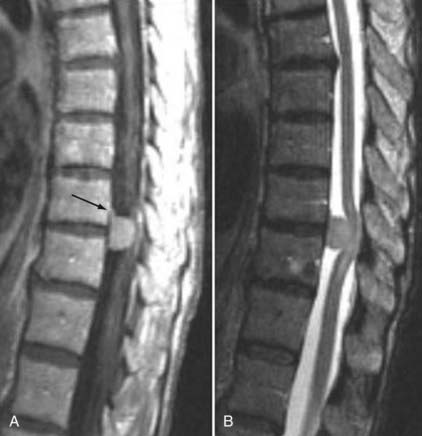
Frequently, the use of gadolinium can aid in the distinction between “normal” postoperative changes and pathology. Scar tissue consistently enhances and is often associated with retraction of the thecal sac and the absence of a mass effect (Figs. 18-59 and 18-60). It may, however, show a mass effect in some situations, and it may be contiguous with the disk space. Disk, in contrast, does not usually enhance centrally within the first 20 minutes after the injection of paramagnetic contrast medium. Peripheral enhancement is common both preoperatively and postoperatively (Fig. 18-61). Disk enhances centrally if delayed images are obtained. This distinction can aid in the diagnosis of recurrent/residual disk herniation.
Primary differential considerations, besides scar and disk, are epidural hematoma and abscess (Fig. 18-62). In the acute period an epidural hematoma may not have peripheral enhancement, and the signal intensity characteristics of the soft tissue mass may be that of blood by-products. Fortunately, the characteristic signal intensity of blood by-products that one is accustomed to from brain imaging does always translate to the spine. In particular, the high signal intensity noted on T1 is not as frequently encountered. Epidural abscesses usually have peripheral enhancement and in the absence of osseous changes may be difficult to distinguish from recurrent disk herniation or hematoma.
The imaging findings of arachnoiditis are a reflection of the adhesion and clumping of nerve roots after inflammation. The first type is manifested by clumping of individual traversing nerve roots within the thecal sac (Fig. 18-63). The second type is a featureless sac in which individual nerve roots are not identified (Fig. 18-64). There is often absent or blunting of nerve root sleeve filling. The third type demonstrates soft tissue masses that cause filling defects within the subarachnoid space and may block the flow of myelographic contrast media. These findings of arachnoiditis are evident on myelography, CT myelography, and MRI. The different appearances of arachnoiditis are probably points on a spectrum rather than different entities or stages. There may be minimal nerve root and dural enhancement after contrast administration or no enhancement at all. Differential considerations include crowding of nerve roots with stenosis, leptomeningeal seeding of neoplasms, or meningitis119,120 (Fig. 18-65).
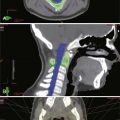
Evaluation of Spine Trauma
Plain radiography, MRI, and CT are all used in evaluation of the posttraumatic spinal column and are often complementary. Appropriate indications for imaging the spine in trauma include pain, neurological deficit, altered consciousness, and the presence of a high-risk mechanism of injury. The Canadian C-spine Rule Study confirmed that “low-risk” patients (ambulatory, no midline tenderness, no immediate onset of pain, able to sit, or victims of simple rear-end motor vehicle collisions) who could actively rotate their heads 45 degrees in both directions do not require imaging.121
Computed Tomography
CT scanning has been shown to be significantly more sensitive and more time efficient than plain films for detection of cervical fractures in the setting of acute spinal trauma. The widespread availability of high-quality CT scanners, the ability to rapidly acquire images, and the ability to construct multiplanar and 3D images make CT the ideal screening test for cervical fracture. The sensitivity of CT scanning for acute cervical fractures ranges from 90% to 99% with specificities of 72% to 89%. The sensitivity of plain films in the acute setting ranges from 39% to 94%.122–124 Moreover, a number of studies have demonstrated limitations in the ability of plain films to detect injuries to the upper cervical spine and occipital condyles.125,126 Because of its greater sensitivity and wide availability, CT is quickly becoming the initial screening modality for bony injury in the cervical spine.
CT has been shown to be superior to plain radiography in assessing fractures of the thoracic and lumbar spine as well. Campbell and coauthors127 reported that 20% of burst fractures diagnosed by CT were misdiagnosed as stable wedge compression fractures on plain films. CT is better at detecting fractures of the dorsal elements, malalignment, and intracanalicular fragments.
Plain Films
Plain films are also critical in the evaluation of instability in the absence of bony injury. Stability of the cervical spine is best assessed with dynamic imaging that includes flexion and extension views. An increase in the atlantodental interval or greater than 3.5-mm horizontal displacement of the vertebral body between flexion and extension can be indicative of spinal instability. This examination should be performed only on alert, cooperative patients without neurological injury or radiographic evidence of unstable spinal injuries. Frequently, cervical mobility is limited by pain and muscle spasm at the time of the initial injury. Flexion and extension views may be more helpful when performed in a delayed fashion 7 to 10 days after the injury.128
Magnetic Resonance Imaging
MRI provides the best evaluation of soft tissue pathology and is the only means of directly evaluating the spinal cord. The information obtained is often complementary to evaluation of the bony structures by CT. Information about disk herniations, hematoma formation, and ligamentous and muscular injury can be instrumental in determining the appropriate treatment for the patient. MRI is indicated in a trauma patient with a neurological deficit or when there is suspicion of a soft tissue or vascular injury. STIR sequences can detect bone edema and aid in differentiating the acuity of fractures. Heavily T2-weighted sequences can be used to evaluate for nerve root avulsions and pseudomeningocele development. MRA and fat-saturated T2 sequences can be used to screen for vascular injuries. Ligamentous and soft tissue injuries are best visualized on fat-saturated T2 images. The normal anterior and posterior longitudinal ligaments are seen as continuous hypointense lines along the ventral and dorsal aspects of the vertebral bodies. In the presence of soft tissue injury, areas of increased T2 signal or discontinuity of the ligament may be seen. MRI is the modality of choice for the evaluation of a variety of posttraumatic conditions, including myelomalacia, cord tethering, syrinx formation, and the presence of dural AV fistulas.128
Anson J, Spetzler R. Classification of spinal arterovenous malformations and implications for treatment. BNI Q. 1992;8:2-8.
Boden SD, Davis DO, Dina TS, et al. Abnormal magnetic-resonance scans of the lumbar spine in asymptomatic subjects: a prospective investigation. J Bone Joint Surg Am. 1990;72:403-408.
Bradley WGJr. ACR appropriateness criteria. Low back pain. AJNR Am J Neuroradiol. 2007;28:990-992.
Carragee EJ, Kim DH. A prospective analysis of magnetic resonance imaging findings in patients with sciatica and lumbar disc herniation: correlation of outcomes with disc fragment and canal morphology. Spine. 1997;22:1650-1660.
Cook AM, Lau TN, Tomlinson MJ, et al. Magnetic resonance imaging of the whole spine in suspected malignant spinal cord compression: impact on management. Clin Oncol. 1998;10:39-43.
Dagirmanjian A, Schils J, McHenry M, et al. MR imaging of vertebral osteomyelitis revisited. AJR Am J Roentgenol. 1996;167:1539-1543.
Egelhoff JC, Bates DJ, Ross JS, et al. Spinal MR findings in neurofibromatosis types 1 and 2. AJNR Am J Neuroradiol. 1992;13:1071-1077.
Gilbertson J, Miller G, Goldman M, et al. Spinal dural arteriovenous fistulas: MR and myelographic findings. AJNR Am J Neuroradiol. 1995;16:2049-2057.
Jensen MC, Brant-Zawadzki MN, Obuchowski N, et al. Magnetic resonance imaging of the lumbar spine in people without back pain. N Engl J Med. 1994;331:69-73.
Korhonen T, Karppinen J, Paimela L, et al. The treatment of disc-herniation induced sciatica with infliximab: one year follow-up results of FIRST II, a randomized controlled trial. Spine. 2006;31:2759-2766.
Maravilla KR, Bowen BC. Imaging of the peripheral nervous system: evaluation of peripheral neuropathy and plexopathy. AJNR Am J Neuroradiol. 1998;19:1011-1023.
Milette PC. Reporting lumbar disk abnormalities: at last, consensus!. AJNR Am J Neuroradiol. 2001;22:428-429.
Modic MT, Obuchowski NA, Ross JS, et al. Acute low back pain and radiculopathy. Radiology. 2005;237:597-604.
Modic MT, Steinbert PM, Ross JS, et al. Degenerative disc disease; assessment of changes in vertebral body marrow with MR imaging. Radiology. 1988;166:193-199.
Morrison JL, Kaplan PA, Dussault RG, et al. Pedicle marrow signal intensity changes in the lumbar spine: a manifestation of facet degenerative joint disease. Skeletal Radiol. 2000;29:703-707.
Ohtori S, Inoue G, Ito T, et al. Tumor necrosis factor–immunoreactive cells and PGP 9.5–immunoreactive nerve fibers in vertebral endplates of patients with discogenic low back pain and Modic type 1 or type 2 changes on MRI. Spine. 2006;31:1026-1031.
Rahme R, Moussa R. The Modic vertebral endplate and marrow changes: pathologic significance and relation to low back pain and segmental instability of the lumbar spine. AJNR Am J Neuroradiol. 2008;29:838-842.
Ross JS, Obuchowski N, Zepp R. The postoperative lumbar spine: evaluation of epidural scar over a 1-year period. AJNR Am J Neuroradiol. 1998;19:183-186.
Ross JS, Masaryk TJ, Modic MT, et al. MR imaging of lumbar arachnoditis. AJR Am J Roentgenol. 1987;149:1025-1032.
Schenarts PJ, Diaz J, Kaiser C, et al. Prospective comparison of admission computed tomographic scan and plain films of the upper cervical spine in trauma patients with altered mental status. J Trauma. 2001;51:663-668.
Shellock F. Magnetic Resonance Procedures: Health Effects and Safety. Philadelphia CRC Press; 2001.
Stiel IG, Wells GA, Vandemheen KL, et al. The Canadian C-spine rule for radiography in alert and stable trauma patients. JAMA. 2001;286:1841-1848.
Thomsen H. Nephrogenic systemic fibrosis: a serious late adverse reaction. Eur Radiol. 2006;12:2619-2621.
Ulmer JL, Elster AD, Mathews VP, et al. Lumbar spondylolysis: reactive marrow changes seen in adjacent pedicles on MR images. AJR Am J Roentgenol. 1995;164:429-433.
Widder S, Doig C, Burrowes P, et al. Prospective evaluation of computed tomographic scanning for spinal clearance of obtunded trauma patients: preliminary results. J Trauma. 2004;56:1179-1184.
1 Bradley WGJr. ACR appropriateness criteria. Low back pain. AJNR Am J Neuroradiol. 2007;28:990-992.
2 Steinmetz M, Mroz T, Krishnaney A, et al. Standard versus digital radiographs for the intraoperative cervical spine-level localization; a prospective time and cost analysis. Spine J. 2009;9:967-971.
3 Haughton V. Medical imaging of intervertebral disc degeneration: current status of imaging. Spine. 2004;29:2751-2756.
4 Jinkins JR, Dworkin JS, Damadian RV. Upright, weight-bearing, dynamic-kinetic MRI of the spine: initial results. Eur Radiol. 2005;15:1815-1825.
5 Danielson B, Willen J. Axially loaded magnetic resonance image of the lumbar spine in asymptomatic individuals. Spine. 2001;26:2601-2606.
6 Kimura S, Steinbach GC, Watenpaugh DE, et al. Lumbar spine disc height and curvature responses to an axial load generated by a compression device compatible with magnetic resonance imaging. Spine. 2001;26:2596-2600.
7 Hiwatashi A, Danielson B, Moritani T, et al. Axial loading during MR imaging can influence treatment decision for symptomatic spinal stenosis. AJNR Am J Neuroradiol. 2004;25:170-174.
8 Tanaka N, An HS, Lim TH, et al. The relationship between disc degeneration and flexibility of the lumbar spine. Spine J. 2001;1:47-56.
9 Aagaard BD, Maravilla KR, Kliot M. Magnetic resonance neurography: magnetic resonance imaging of peripheral nerves. Neuroimaging Clin N Am. 2001;11:131-146. viii
10 Filler AG, Maravilla KR, Tsuruda JS. MR neurography and muscle MR imaging for image diagnosis of disorders affecting theperipheral nerves and musculature. Neurol Clin. 2004;22:643-682. vi-vii
11 Maravilla KR, Bowen BC. Imaging of the peripheral nervous system: evaluation of peripheral neuropathy and plexopathy. AJNR Am J Neuroradiol. 1998;19:1011-1023.
12 Moore KR, Tsuruda JS, Dailey AT. The value of MR neurography for evaluating extraspinal neuropathic leg pain: a pictorial essay. AJNR Am J Neuroradiol. 2001;22:786-794.
13 Ellegala DB, Monteith SJ, Haynor D, et al. Characterization of genetically defined types of Charcot-Marie-Tooth neuropathies by using magnetic resonance neurography. J Neurosurg. 2005;102:242-245.
14 Filler AG, Haynes J, Jordan SE, et al. Sciatica of nondisc origin and piriformis syndrome: diagnosis by magnetic resonance neurography and interventional magnetic resonance imaging with outcome study of resulting treatment. J Neurosurg Spine. 2005;2:99-115.
15 Gatehouse PD, He T, Hughes SP, et al. MR imaging of degenerative disc disease in the lumbar spine with ultrashort TE pulse sequences. MAGMA. 2004;16:160-166.
16 Hall-Craggs MA, Porter J, Gatehouse PD, et al. Ultrashort echo time (UTE) MRI of the spine in thalassaemia. Br J Radiol. 2004;77:104-110.
17 Robson MD, Gatehouse PD, So PW, et al. Contrast enhancement of short T2 tissues using ultrashort TE (UTE) pulse sequences. Clin Radiol. 2004;59:720-726.
18 Antoniou J, Demers CN, Beaudoin G, et al. Apparent diffusion coefficient of intervertebral discs related to matrix composition and integrity. Magn Reson Imaging. 2004;22:963-972.
19 Kealey SM, Aho T, Delong D, et al. Assessment of apparent diffusion coefficient in normal and degenerated intervertebral lumbar disks: initial experience. Radiology. 2005;235:569-574.
20 Kurunlahti M, Kerttula L, Jauhiainen J, et al. Correlation of diffusion in lumbar intervertebral disks with occlusion of lumbar arteries: a study in adult volunteers. Radiology. 2001;221:779-786.
21 Kerttula L, Kurunlahti M, Jauhiainen J, et al. Apparent diffusion coefficients and T2 relaxation time measurements to evaluate disc degeneration: a quantitative MR study of young patients with previous vertebral fracture. Acta Radiol. 2001;42:585-591.
22 Hsu EW, Setton LA. Diffusion tensor microscopy of the intervertebral disc annulus fibrosus. Magn Reson Med. 1999;41:992-999.
23 Chiu EJ, Newitt DC, Segal MR, et al. Magnetic resonance imaging measurement of relaxation and water diffusion in the human lumbar intervertebral disc under compression in vitro. Spine. 2001;26:E437-E444.
24 Perlewitz TJ, Haughton VM, Riley LHI, et al. Effect of molecular weight on the diffusion of contrast media into cartilage. Spine. 1997;22:2707-2710.
25 Akansel G, Haughton VM, Papke RA, et al. Diffusion into human intervertebral disks studied with MR and gadoteridol. AJNR Am J Neuroradiol. 1997;18:443-445.
26 Ibrahim MA, Haughton VM, Hyde JS. Effect of disk maturation on diffusion of low molecular-weight gadolinium complexes: an experimental study in rabbits. AJNR Am J Neuroradiol. 1995;16:1307-1311.
27 Nguyen-minh C, Haughton VM, Papke RA, et al. Measuring diffusion of solutes into intervertebral disks with MR imaging and paramagnetic contrast medium. AJNR Am J Neuroradiol. 1998;19:1781-1784.
28 Shellock F. Magnetic Resonance Procedures: Health Effects and Safety. Philadelphia CRC Press; 2001.
29 Thomsen H. Nephrogenic systemic fibrosis: a serious late adverse reaction. Eur Radiol. 2006;12:2619-2621.
30 Guyer RD, Ohnmeiss DD. Lumbar discography: Position statement from the North American Spine Society Diagnostic and Therapeutic Committee. Spine. 1995;20:2048-2059.
31 Adams P, Eyre DR, Muir H. Biochemical aspects of development and ageing of human lumbar intervertebral discs. Rheumatol Rehabil. 1977;16:22-29.
32 Brown MD. The pathophysiology of disc disease. Orthop Clin North Am. 1971;2:359-370.
33 Lipson SJ, Muir H. Experimental intervertebral disc degeneration: morphologic and proteoglycan changes over time. Arthritis Rheum. 1981;24:12-21.
34 Modic MT, Pavlicek W, Weinstein MA, et al. Magnetic resonance imaging of intervertebral disk disease: clinical and pulse sequence considerations. Radiology. 1984;152:103-111.
35 Majors AW, McDevitt CA, Silgalis I, et al. A correlative analysis of T2, ADC and MT radio with water, hydroxyproline and GAG content in excised human intervertebral disk. Paper presented at a meeting of the Orthopedic Research Society, New Orleans, 1994, pp 116-120.
36 Sether LA, Yu S, Haughton VM, et al. Intervertebral disk: normal age-related changes in MR signal intensity. Radiology. 1990;177:385-388.
37 Yu S, Haughton VM, Sether LA, et al. Criteria for classifying normal and degenerated lumbar intervertebral disks. Radiology. 1989;170:523-526.
38 Friberg S, Hirsch C. Anatomical and clinical studies on lumbar disc degeneration. Acta Orthop Scand. 1949;19:222-242.
39 Hirsch C. Studies on the pathology of low back pain. J Bone Joint Surg Br. 1959;41:237-243.
40 Coventry MB. Anatomy of the intervertebral disk. Clin Orthop Relat Res. 1969;67:9-15.
41 Pfirrmann CW, Metzdorf A, Zanetti M, et al. Magnetic resonance classification of lumbar intervertebral disc degeneration. Spine. 2001;26:1873-1878.
42 Knutsson F. The vacuum phenomenon in the intervertebral discs. Acta Radiol. 1942;23:173-179.
43 Grenier N, Grossman RI, Schiebler ML, et al. Degenerative lumbar disk disease: pitfalls and usefulness of MR imaging in detection of vacuum phenomenon. Radiology. 1987;164:861-865.
44 Bielecki DK, Sartoris D, Resnick D, et al. Intraosseous and intradiscal gas in association with spinal infection: report of three cases. AJR Am J Roentgenol. 1986;147:83-86.
45 Bangert BA, Modic MT, Ross JS, et al. Hyperintense disks on T1-weighted MR images: correlation with calcification. Radiology. 1995;195:437-443.
46 Boyko OB, Burger PC, Shelburne JD, et al. Non-heme mechanisms for T1shortening: pathologic CT, and MR elucidation. AJNR Am J Neuroradiol. 1992;13:1439-1445.
47 Henkelman RM, Watts JF, Kucharczyk W. High signal intensity in MR images of calcified brain tissue. Radiology. 1991;179:199-206.
48 DeRoss A, Kressel H, Spritzer C, et al. MR imaging of marrow changes adjacent to end plates in degenerative lumbar disc disease. AJR Am J Roentgenol. 1987;149:531-534.
49 Modic MT, Steinbert PM, Ross JS, et al. Degenerative disc disease; assessment of changes in vertebral body marrow with MR imaging. Radiology. 1988;166:193-199.
50 Rahme R, Moussa R. The Modic vertebral endplate and marrow changes: pathologic significance and relation to low back pain and segmental instability of the lumbar spine. AJNR Am J Neuroradiol. 2008;29:838-842.
51 Ross JS, Obuchowski N, Zepp R. The postoperative lumbar spine: evaluation of epidural scar over a 1-year period. AJNR Am J Neuroradiol. 1998;19:183-186.
52 Masaryk TJ, Boumphrey F, Modic MT, et al. Effects of chemonucleolysis demonstrated by MR imaging. J Comput Assist Tomogr. 1986;10:917-923.
53 Modic MT, Masary TJ, Ross JS, et al. Imaging of degenerative disk disease. Radiology. 1988;168:177-186.
54 Ulmer JL, Elster AD, Mathews VP, et al. Lumbar spondylolysis: reactive marrow changes seen in adjacent pedicles on MR images. AJR Am J Roentgenol. 1995;164:429-433.
55 Morrison JL, Kaplan PA, Dussault RG, et al. Pedicle marrow signal intensity changes in the lumbar spine: a manifestation of facet degenerative joint disease. Skeletal Radiol. 2000;29:703-707.
56 Toyone T, Takahashi K, Kitahara H, et al. Vertebral bone marrow changes in degenerative lumbar disc disease: an MRI study of 74 patients with low back pain. J Bone Joint Surg Br. 1994;76:757-764.
57 Mitra D, Cassar-Pullicino VN, McCall IW. Longitudinal study of vertebral type-1 end-plate changes on MR of the lumbar spine. Eur Radiol. 2004;14:1574-1581.
58 Kuisma M, Karppinen J, Niinimäki J, et al. A three-year follow up of lumbar spine endplate (Modic) changes. Spine. 2006;31:1714-1718.
59 Albert HB, Manniche C. Modic changes following lumbar disc herniation. Eur Spine J. 2007;16:977-982.
60 Modic MT. Modic type I and type 2 changes. J Neurosurg Spine. 2007;6:150-151. discussion 151
61 Braithwaite I, White J, Saifuddin A, et al. Vertebral end-plate (Modic) changes on lumbar spine MRI: correlation with pain reproduction at lumbar discography. Eur Spine J. 1998;7:363-368.
62 Weishaupt D, Zanetti M, Hodler J, et al. Painful lumbar disk derangement: relevance of endplate abnormalities at MR imaging. Radiology. 2001;218:420-427.
63 Sandhu HS, Sanchez-Caso LP, Parvataneni HK, et al. Association between findings of provocative discography and vertebral endplate signal changes as seen on MRI. J Spinal Disord. 2000;13:438-443.
64 Burke JG, Watson RW, McCormack D, et al. Intervertebral discs which cause low back pain secrete high levels of proinflammatory mediators. J Bone Joint Surg Br. 2002;84:196-201.
65 Ohtori S, Inoue G, Ito T, et al. Tumor necrosis factor–immunoreactive cells and PGP 9.5–immunoreactive nerve fibers in vertebral endplates of patients with discogenic low back pain and Modic type 1 or type 2 changes on MRI. Spine. 2006;31:1026-1031.
66 Korhonen T, Karppinen J, Paimela L, et al. The treatment of disc-herniation induced sciatica with infliximab: one year follow-up results of FIRST II, a randomized controlled trial. Spine. 2006;31:2759-2766.
67 Chataigner H, Onimus M, Polette A. Surgery for degenerative lumbar disc disease: should the black disc be grafted? Rev Chir Orthop Reparatrice Appar Mot. 1998;84:583-589.
68 Buttermann GR, Heithoff KB, Ogilvie JW, et al. Vertebral body MRI related to lumbar fusion results. Eur Spine J. 1997;6:115-120.
69 Esposito P, Pinheiro-Franco JL, Froelich S, et al. Predictive value of MRI vertebral end-plate signal changes (Modic) on outcome of surgically treated degenerative disc disease: results of a cohort study including 60 patients. Neurochirurgie. 2006;52:315-322.
70 Vital JM, Gille O, Pointillart V, et al. Course of Modic 16 months after lumbar posterior osteosynthesis. Spine. 2003;28:715-720.
71 Borg B, Modic M, Ash L, Ross J, et al. Pedicle signal abnormalities [abstract SSC12-03]. November 22-December 2, Chicago. RSNA Proceeding. Oak Brook, IL: Radiological Society of North America. 2005.
72 Harris RI, MacNab I. Structural changes in the lumbar intervertebral discs: their relationship to low back pain and sciatica. J Bone Joint Surg Br. 1954;36:304-322.
73 Schellinger D, Wener L, Ragsdale BD, et al. Facet joint disorders and their role in the production of back pain and sciatica. Radiographics. 1987;7:923-944.
74 Doyle AJ, Merrilees M. Synovial cysts of the lumbar facet joints in a symptomatic population: prevalence on magnetic resonance imaging. Spine. 2004;29:874-878.
75 Baastrup CI. On the spinous processes of the lumbar vertebrae and the soft tissue between them and on pathological changes in that region. Acta Radiol Scand. 1933;14:52-54.
76 Jacobson HG, Tausend ME, Shapiro JH, et al. The swayback syndrome. Am J Roentgenol Radium Ther Nucl Med. 1958;79:677-683.
77 Milette PC. Reporting lumbar disk abnormalities: at last, consensus!. AJNR Am J Neuroradiol. 2001;22:428-429.
78 Hilton RC, Ball J, Benn RT. Vertebral endplate lesions (Schmorl’s nodes) in the dorsolumbar spine. Ann Rheum Dis. 1976;35:127-132.
79 Resnick D, Niwayama G. Intravertebral disk herniations: cartilaginous (Schmorl’s) nodes. Radiology. 1978;126:57-65.
80 Wagner AL, Murtagh FR, Arrington JA, et al. Relationship of Schmorl’s nodes to vertebral body endplate fractures and acute endplate disk extrusions. AJNR Am J Neuroradiol. 2000;21:276-281.
81 Arnoldi CC, Brodsky AE, Cauchoix J, et al. Lumbar spinal stenosis and nerve root entrapment syndromes: definition and classification. Clin Orthop Relat Res. 1976;115:4-5.
82 Amundsen T, Weber H, Lilleas F, et al. Lumbar spinal stenosis: clinical and radiologic features. Spine. 1995;20:1178-1186.
83 Inufusa A, An HS, Lim TH, et al. Anatomic changes of the spinal canal and intervertebral foramen associated with flexion-extension movement. Spine. 1996;21:2412-2420.
84 Emergency Care Research Institute. Treatment of degenerative lumbar spinal stenosis. I. Evidence report. Agency for Healthcare Research and Quality Publication No. 01-E048 #32. Plymouth Meeting, PA: ECRI, 2001:76.
85 Sox H, Stern S, Owens D, et al. Assessment of Diagnostic Technology in Healthcare: Rationale, Methods, Problems and Directions. Washington, DC: National Academy Press; 1989.
86 Wiesel SW, Tsourmas N, Feffer HL, et al. A study of computer-assisted tomography. I. The incidence of positive CAT scans in an asymptomatic group of patients. Spine. 1984;9:549-551.
87 Boden SD, Davis DO, Dina TS, et al. Abnormal magnetic-resonance scans of the lumbar spine in asymptomatic subjects: a prospective investigation. J Bone Joint Surg Am. 1990;72:403-408.
88 Jensen MC, Brant-Zawadzki MN, Obuchowski N, et al. Magnetic resonance imaging of the lumbar spine in people without back pain. N Engl J Med. 1994;331:69-73.
89 Modic MT, Obuchowski NA, Ross JS, et al. Acute low back pain and radiculopathy. Radiology. 2005;237:597-604.
90 Modic MT, Ross JS, Obuchowski NA, et al. Contrast-enhanced MR imaging in acute lumbar radiculopathy: a pilot study of the natural history. Radiology. 1995;195:429-435.
91 Benoist M. The natural history of lumbar degenerative spinal stenosis. Joint Bone Spine. 2002;69:450-457.
92 Carragee EJ, Kim DH. A prospective analysis of magnetic resonance imaging findings in patients with sciatica and lumbar disc herniation: correlation of outcomes with disc fragment and canal morphology. Spine. 1997;22:1650-1660.
93 Dagirmanjian A, Schils J, McHenry M, et al. MR imaging of vertebral osteomyelitis revisited. AJR Am J Roentgenol. 1996;167:1539-1543.
94 Eastwood JD, Vollmer RT, Provenzale JM. Diffusion-weighted imaging in a patient with vertebral and epidural abscesses. AJNR Am J Neuroradiol. 2002;23:496-498.
95 Sandhu FS, Dillon WP. Spinal epidural abscess: evaluation with contrast-enhanced MR imaging. AJNR Am J Neuroradiol. 1991;12:1087-1093.
96 Smoker WR, Godersky JC, Knutzon RK, et al. The role of MR imaging in evaluating metastatic spinal disease. AJR Am J Roentgenol. 1987;149:1241-1248.
97 Caromody RF, Yang PJ, Seeley GW, et al. Spinal cord compression due to metastatic disease: diagnosis with MR imaging versus myelography. Radiology. 1989;173:225-229.
98 Cook AM, Lau TN, Tomlinson MJ, et al. Magnetic resonance imaging of the whole spine in suspected malignant spinal cord compression: impact on management. Clin Oncol. 1998;10:39-43.
99 Lecouvet FE, Malghen J, Michaux L, et al. Skeletal survey in advanced multiple myeloma: radiographic versus MR imaging survey. Br J Haematol. 1999;106:35-39.
100 Libshitz HE, Malthouse SR, Cunningham D, et al. Multiple myeloma: appearance at MR imaging. Radiology. 1992;182:833-837.
101 Solero CL, Fornari M, Giombini S, et al. Spinal meningiomas: review of 174 operated cases. Neurosurgery.. 1989;125:153-160.
102 Egelhoff JC, Bates DJ, Ross JS, et al. Spinal MR findings in neurofibromatosis types 1 and 2. AJNR Am J Neuroradiol. 1992;13:1071-1077.
103 Friedman DP, Tatraglino LM, Flanders AE. Intradural schwannomas of the spine MR findings with emphasis on contrast enhancement characteristics. AJR Am J Roentgenol. 1992;158:1347-1350.
104 Singh SK, Leeds NE, Ginsberg LE. MR imaging of leptomeningeal metastases: comparison of three sequences. AJNR Am J Neuroradiol. 2002;23:817-821.
105 Wada E, Yonebu K, Kang J. Idiopathic spinal cord herniation: report of three cases and review of the literature. Spine. 2000;25:1984-1988.
106 Tekkök IH. Spontaneous spinal cord herniation: case report and review of the literature. Neurosurgery. 2000;46(2):485-491. discussion 491-492
107 Sun B, Wang C, Wang J, et al. MRI features of intramedullary spinal cord ependymomas. J Neuroimaging. 2003;13:345-351.
108 Bourgouin PM, Lesage J, Fontaine S, et al. A pattern approach to the differential diagnosis of intramedullary spinal cord lesions on MR imaging. AJR Am J Roentgenol. 1998;170:1645-1649.
109 Chu BC, Terae S, Hida K, et al. MR findings in spinal hemangioblastoma correlation with symptoms and with angiographic and surgical findings. AJNR Am J Neuroradiol. 2001;22:206-217.
110 Khosla A, Wippold FJ2nd. CT myelography and MR imaging of extramedullary cysts of the spinal canal in adult and pediatric patients. AJR Am J Roentgenol. 2002;178:201-207.
111 Anson J, Spetzler R. Classification of spinal arteriovenous malformations and implications for treatment. BNI Q. 1992;8:2-8.
112 Symon L, Kuyama H, Kendall B. Dural arteriovenous malformations of the spine. Clinical features and surgical results in 55 cases. J Neurosurg. 1984;60:238-247.
113 Bowen B, Fraser K, Kochan J, et al. Spinal dural arteriovenous fistulas: evaluation with MR angiography. AJNR Am J Neuroradiol. 1995;16:2019-2043.
114 Gilbertson J, Miller G, Goldman M, et al. Spinal dural arteriovenous fistulas: MR and myelographic findings. AJNR Am J Neuroradiol. 1995;16:2049-2057.
115 Doppman J, DiChiro G, Dwyer A. Magnetic resonance imaging of spinal arteriovenous malformations. J Neurosurg. 1987;66:830-838.
116 Cosgrove R, Bertrand G, Fontaine S, et al. Cavernous angiomas of the spinal cord. J Neurosurg. 1988;68:31-36.
117 Ogilvy C, Louis D, Ojemann R. Intramedullary cavernous malformations of the spine. Neurosurgery. 1992;31:219-230.
118 Perl J, Ross J. Diagnostic imaging of cavernous malformations. In: Awad A, Barrow D, editors. Cavernous Malformations. Park Ridge, IL: American Association of Neurological Surgeons, 1993.
119 Ross JS, Masaryk TJ, Modic MT, et al. MR imaging of lumbar arachnoiditis. AJR Am J Roentgenol. 1987;149:1025-1032.
120 Long DM. Chronic adhesive spinal arachnoiditis: pathogenesis, prognosis and treatment. Neurosurg Q. 1992;2:296-318.
121 Stiel IG, Wells GA, Vandemheen KL, et al. The Canadian C-spine rule for radiography in alert and stable trauma patients. JAMA. 2001;286:1841-1848.
122 Widder S, Doig C, Burrowes P, et al. Prospective evaluation of computed tomographic scanning for spinal clearance of obtunded trauma patients: preliminary results. J Trauma. 2004;56:1179-1184.
123 Tins BJ, Cessar-Pullicino VN. Imaging of acute cervical spine injuries: review and outlook. Clin Radiol. 2004;59:865-880.
124 Blackmore CC, Mann FA, Wilson AJ. Helical CT in the primary trauma evaluation of the cervical spine: an evidence-based approach. Skeletal Radiol. 2000;29:632-639.
125 Schenarts PJ, Diaz J, Kaiser C, et al. Prospective comparison of admission computed tomographic scan and plain films of the upper cervical spine in trauma patients with altered mental status. J Trauma.. 2001;51:663-668.
126 Link TM, Schuierer G, Hufendiek A, et al. Substantial head trauma: value of routine CT examination of the cervicocranium. Radiology. 1995;196:741-745.
127 Campbell SE, Phillips CD, Dubovsky E, et al. The value of CT in determining potential instability of simple wedge-compression fractures of the lumbar spine. AJNR. 1995;16:1385-1392.
128 Bagley LJ. Imaging of spinal trauma. Radiol Clin North Am. 2006;44:1-12.