CHAPTER 109 Radiologic Features of Central Nervous System Tumors
Principles of Diagnosis by Neuroradiology
Spectroscopy
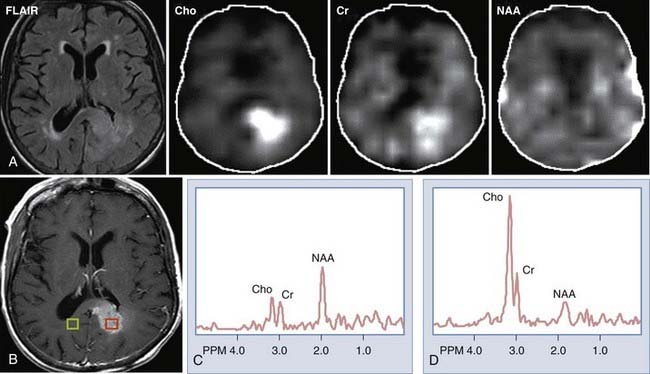
MRS provides information regarding the biochemical milieu within a relatively small volume of interest. Although it began, and is often still used, as a single voxel technique—gathering data from a usually cubic volume measuring between 1 and 2 cm—more modern implementations of MRS allow for acquisition of MRS data from arrays of smaller voxels (usually about 1 cm3 depending on the technical attributes of the imaging system) localized in multiple coplanar sections. These MRS imaging techniques can provide information on spatial variation in biochemical markers that can be used to distinguish among different types of tumors, and that can roughly index a lesion’s degree of malignancy (Fig. 109-1). Among the major markers are N-acetyl aspartate (NAA), choline, creatine, myoinositol, lactate, and lipid. Relevant spectroscopic features of different lesions are discussed throughout this chapter, but a general rule of thumb is that the more malignant the lesion, the lower the NAA and the higher the choline concentrations.
Cerebral Blood Flow and Volume Estimates
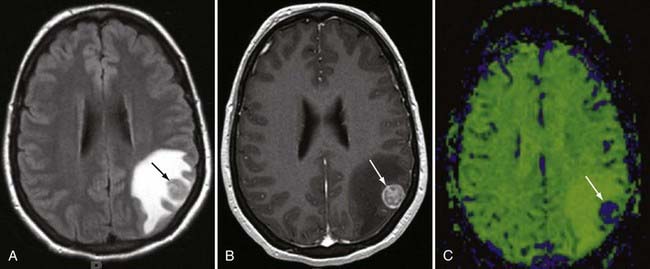
Measures of cerebral blood flow (CBF) and cerebral blood volume (CBV) within tumors using MRI1–4 or, more recently, CT5,6 provide quantitative correlates of what has been known since cerebral angiography as one of the mainstays for brain tumor localization and characterization, that is, that tumors frequently contain dysplastic blood vessels that exhibit blood (contrast) transit time that is markedly slower than is that within the surrounding parenchyma. In the case of many tumors, catheter angiography would demonstrate a tumor blush, indicative of an abnormally enlarged blood pool. MRI or CT perfusion data correlate reasonably well with tumor grade, with higher grade tumors exhibiting greater CBV.1,7–9 There is also some evidence that blood volume measurements have prognostic value, with low-grade tumors that have higher blood volumes advancing in grade more rapidly than tumors with similar histology but lower blood volumes.10
Functional Magnetic Resonance Imaging
The early 1990s saw the development of imaging techniques which could assay dynamic changes in blood flow and blood oxygen extraction as a proxy for regional brain neural activity.11,12 These techniques became known as fMRI and were based on the observations that the concentration of deoxyhemoglobin in blood affected the nuclear magnetic resonance parameter known as T2*—with a higher concentration being associated with a shorter T2*13—and that with brain activation, there is an increase in regional cerebral blood flow out of proportion to the increase in oxygen extraction.14 With regional brain activation, the disproportionate increase in blood flow compared with oxygen extraction leads to a higher concentration of oxyhemoglobin in the venous efflux and thus a reduced concentration of venous deoxyhemoglobin. The reduced concentration of deoxyhemoglobin and concomitant prolongation of T2* leads to a regional task-related increase in signal.
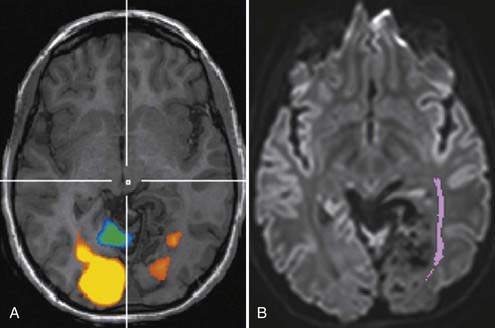
Soon after its introduction, investigators proposed fMRI as a tool in preneurosurgical planning15 and established that its ability to localize primary sensorimotor cortex compared reasonably well with electrophysiologic techniques.16–19 In the neurosurgical setting, the earliest and probably still most common applications of fMRI have been in localizing the hand-arm representation in the primary sensorimotor regions, although with the development of a broad array of paradigms, interrogation of language-related brain regions has become virtually as common (Fig. 109-2). fMRI has been shown useful in demonstrating the degree to which regions of eloquent cortex have been displaced by tumors or have undergone reorganization because of regional cortical dysplasia or dysfunction.20,21 In 1999, Lee and colleagues at the Mayo Clinic published a summary of their experience using fMRI in the setting of presurgical evaluation of tumor and seizure patients.21 They found that they were able to use fMRI to identify the primary sensorimotor region in 70% of patients; their success rate was close to 90% when they considered only the patients they evaluated using more recently developed data acquisition techniques.
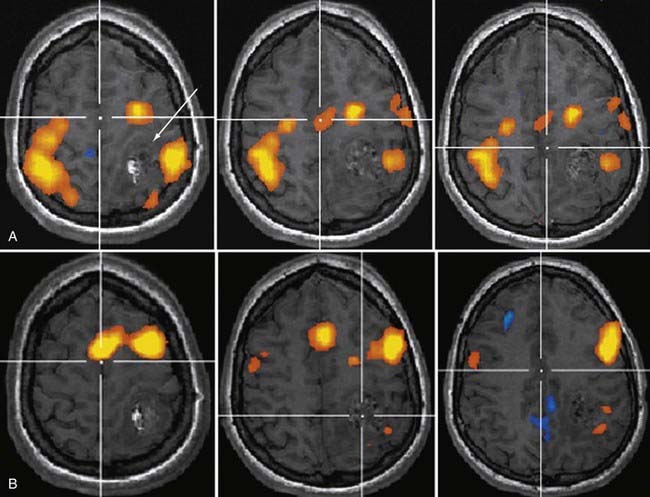
Like any technique, fMRI does not always work; the patients who are being evaluated frequently move more than healthy volunteers, which will almost certainly have an adverse effect on the quality of the data,22 as will reduced vasoreactivity in the vicinity of tumors or vascular malformations. As techniques have improved over time, especially for rapid data acquisition and for patient motion correction, the applicability of fMRI as a neurosurgical planning tool has increased.
Diffusion Tensor Imaging and Tractography
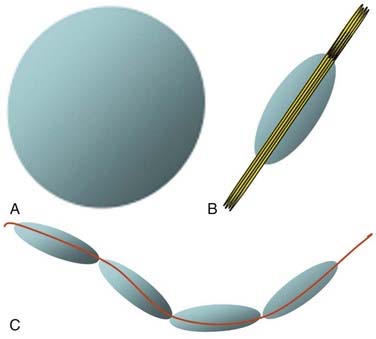
Although fMRI to estimate the proximity of functional cortex to a tumor has been available since the mid-1990s, techniques for estimating the proximity of major white matter tracts have developed much more recently, and as of this writing (mid-2008) remain under active development. These techniques are based on the biophysical observation that water molecules within axons move in a relatively unconstrained manner longitudinally along the length of the axon, whereas those molecules can move only a short distance radially before they encounter either microtubules or the axonal membrane.23–26 Thus, if one were to measure and plot within any given imaging voxel the ability of water molecules to move in a relatively unconstrained way, one would end up with a blimp or cigar-shaped plot, oriented roughly along the axes of the axons that run through that voxel. This plot represents graphically what is known mathematically as the diffusion tensor. Conceptually, by assessing the directionality of water diffusivity in each small imaging voxel and then linking the measures of maximal diffusivity end to end, one can begin to discern the trajectories of white matter tracts as they run through the brain (Fig. 109-3, and Fig. 109-4 for a clinical example). Ongoing technical developments include improvements in tracking white matter bundles through edema surrounding tumors (and even through tumors) and in separating white matter tracts that closely approximate one another, or that cross one another within a group of voxels.27–31
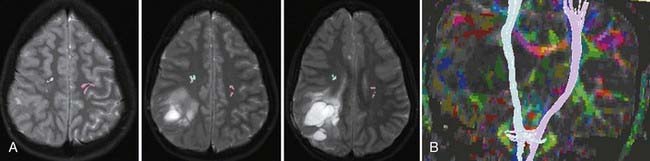
Often fMRI and DTI-tractography results can be used complementarily because in the vicinity of brain tumors or vascular malformations, the coupling between neural activity and the reactive changes in blood flow on which fMRI signal changes depend is often impaired. In such cases, the fMRI data may be of reduced utility, whereas the tractographic data may still be quite robust (Fig. 109-5). Conversely, extensive edema may render the tractographic data suboptimal, whereas the fMRI signal changes in the overlying cortex remain relatively unaffected.
Features that suggest that masses are intra-axial include the following:
Extra-Axial Masses
Meningioma
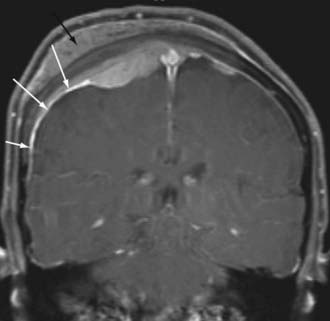
By far, the most common extra-axial neoplasm to affect the intracranial compartment is the meningioma. This tumor is characterized by hyperdensity relative to normal brain parenchyma on CT, isointensity on T1-weighted images relative to gray matter, and slight hyperintensity on T2-weighted images (Fig. 109-6). It should be noted, however, that there is a wide variety of signal intensity characteristics associated with meningiomas, and in fact, some reports suggest that syncytial, transitional, and angioimmunoblastic meningiomas may have differing signal intensity characteristics depending on their internal histology. Nearly all meningiomas show strong contrast enhancement on either CT or MRI. Meningiomas may show stippled or confluent calcification. If the meningioma is extensively calcified, enhancement may be less evident.
Meningiomas also have a characteristic “dural tail,” which represents contrast enhancement extending along the margins of the tumor affecting the pachymeninges (Fig. 109-7). Some histologic studies have suggested that the entirety of the dural tail represents meningioma tumor, whereas others have suggested that this may represent reactive change adjacent to neoplasm.32
The spectroscopic features of meningioma on proton spectroscopy include absence of NAA and elevations of choline peaks. The height of the NAA and creatine peaks may be markedly reduced. Alanine has been suggested to be a specific marker for meningiomas, but its presence is variable.33–35 Although this may help differentiate a meningioma from an intra-axial mass, many other extra-axial masses (see later) have a similar spectroscopic signature.
Meningiomas may deviate from the characteristic benign appearance in many different ways and on occasion demonstrate necrosis, fatty degeneration, cystic areas, infiltration into the brain, infiltration into the bone, and marked vasogenic edema.36 The presence of vasogenic edema associated with meningiomas has been correlated with the lesion size as well as the degree of parasitization of dural venous structures.
On dynamic imaging with contrast agents, the meningiomas show slow uptake of the contrast agent in a continuous fashion followed by a lengthy period of stable enhancement and a delayed clearance of the contrast agent. MRI-based estimates of CBV has been shown to help differentiate between meningioma and dural-based metastatic deposits, with the meningiomas typically showing substantially greater CBV.37 Angiographically, dural vessels generally supply the lesions. This usually means that the branches of the external carotid artery, including the middle meningeal artery or stylomastoid branches of the occipital artery, supply the mass. Nonetheless, branches of the tentorial artery from petrous carotid meningeal branches may be responsible for the primary supply of tentorial meningiomas. Similarly, meningiomas around the cavernous sinus may have direct carotid branches supplying the lesion. Meningiomas at the foramen magnum may receive blood supply from branches of the vertebral artery or posterior inferior cerebellar artery.
Schwannoma
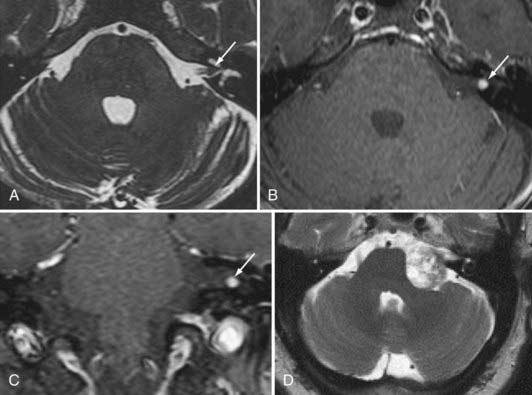
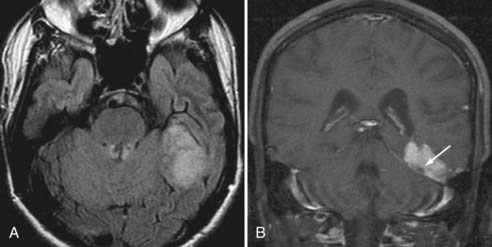
The next most common extra-axial mass is the schwannoma, dominated by those that occur in and around the internal auditory canal. This lesion characteristically resides in the cerebellopontine angle or in the internal auditory canal, arising most often from the vestibular branches of the 8th cranial nerve (Fig. 109-8). Its imaging characteristics are similar to those of a meningioma from the standpoint of being relatively isointense to gray matter, but the absence of a dural tail usually helps to distinguish these two lesions. Vestibular schwannomas, however, may show cystic degeneration as well as hemorrhage and occasionally cause edema in adjacent brain tissue. As opposed to meningiomas, it would be highly unusual for an acoustic schwannoma to cause bony lysis or bony sclerosis. In particular, if a cerebellopontine angle lesion shows enhancing tumor entering the internal auditory canal, one would favor vestibular schwannoma over meningioma.
Epidermoid
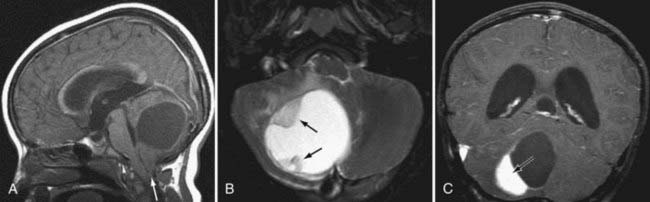
Epidermoid tumors may arise in the cerebellopontine angle, the suprasellar cistern, the diploic space, the peripineal region, or the middle cranial fossa. These lesions do not as a rule exhibit contrast enhancement. Epidermoids have signal intensity appearances that are pathognomonic: (1) very high signal intensity on T2-weighted images, (2) signal intensity close to that of cerebrospinal fluid (CSF) on T1-weighted images, (3) higher signal intensity than CSF on fluid-attenuated inversion recovery (FLAIR) MRI and diffusion-weighted imaging (DWI), (4) restricted diffusion that typically is depicted as low signal on apparent diffusion coefficient (ADC) images, and (5) absence of enhancement (Fig. 109-9). Epidermoid lesions tend to have a crenated margin and will infiltrate adjacent structures, particularly along the brainstem. The usual differential diagnosis with the epidermoid is the arachnoid cyst. Epidermoids can be distinguished from the latter because arachnoid cysts are as dark as CSF on FLAIR, diffusion, and steady-state free precession imaging. The signal intensity of epidermoids will not simulate CSF on these sequences.38 The arachnoid cyst is also more sharply delineated than is the epidermoid.
Proton spectroscopy may help in some instances of cystic masses in the brain. Although cystic astrocytomas show NAA, choline, and creatine peaks (with or without lactate), epidermoid cysts show only lactate signal. There are no identifiable resonances from arachnoid and porencephalic cysts.39
Pineal Region Tumors
Germinomas and Germ Cell Tumors
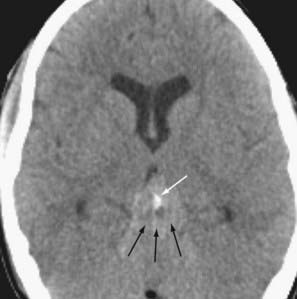
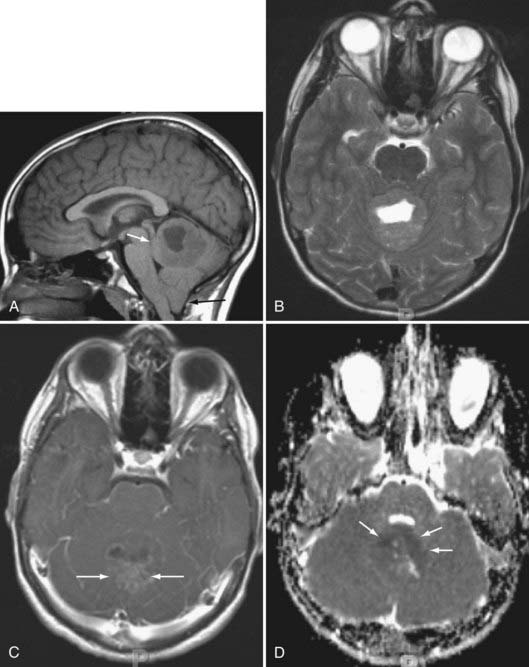
More than half of germinomas are denser than normal brain tissue on CT, and the remainder are isodense. Sometimes, the tumoral tissue surrounds the normal pineal gland, resulting in an engulfed appearance to the calcification (Fig. 109-10). Isointensity to low intensity on T1- and T2-weighted MRI is also the norm. Avid homogeneous enhancement characterizes germinomas. Cystic change occurs in 33% of pineal region, 28% of suprasellar, and 80% of basal ganglionic germinomas.40,41 CSF seeding occurs in 50% of pineal region, 28% of suprasellar, and 30% of basal ganglionic germinoma. Response to radiation therapy may be dramatic, with scans showing no evidence of tumor within 2 weeks after completion of radiation therapy.40 In some instances, complete resolution may not take place for 6 months after radiation. With treatment, the tumor may become hypodense and brighter on T2-weighted and FLAIR images. The presence of cystic change portends a worse response to radiation therapy (33% complete resolution if the mass is cystic, versus 90% without a cyst).
Intraventricular Masses
Choroid Plexus Papilloma
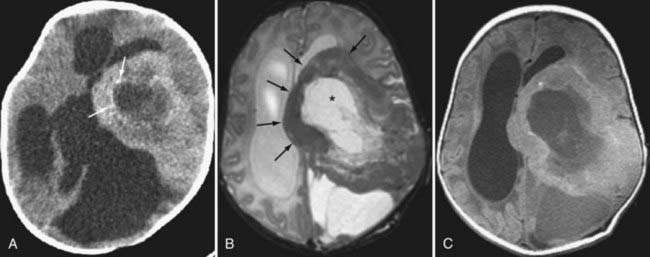
The choroid plexus papilloma is characterized by its frond-like borders, avid contrast enhancement, and characteristic location at the glomus of the lateral ventricle (80% of childhood choroid plexus papillomas).42 In patients younger than 2 months, choroid plexus papillomas account for 42% of brain tumors. Hydrocephalus is the norm from overproduction of CSF, gross obstruction of outlets, or arachnoidal adhesions from high protein or blood associated with the mass. Choroid plexus papillomas are hyperdense on unenhanced CT and demonstrate calcification in nearly 25% of cases.42 Fourth ventricular choroid plexus papillomas also may occur and are generally seen in an older population than are the lateral ventricular ones. These lesions are highly vascular, and one can see flow voids or calcifications as low signal intensity areas within the lesions.42
Ependymoma
Ependymomas have lower NAA-to-choline ratios than do astrocytomas, but the creatine-to-choline ratio is higher for ependymomas (0.60 ± 0.20) than for astrocytomas (0.27 ± 0.12) and primitive neuroectodermal tumors.43 Elevated lactate levels are not uncommon in ependymomas.
Subependymomas
Subependymomas are benign tumors, which again may be seen in association with the ventricular system. They may have signal intensity and density similar to that of gray matter. As opposed to ependymomas, these lesions do not routinely show contrast enhancement, although they can.44 They may have focal mass effect but usually do not elicit vasogenic edema. Characteristic locations include in the floor of the fourth ventricle, along the septum pellucidum, or along the lateral ventricular ependyma. Calcification is rare.
Neurocytomas
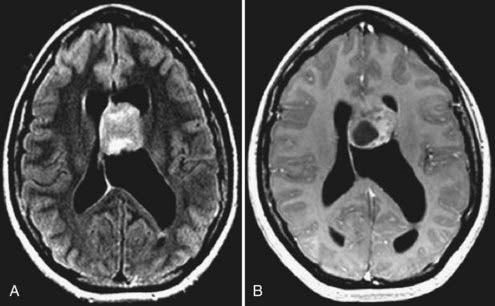
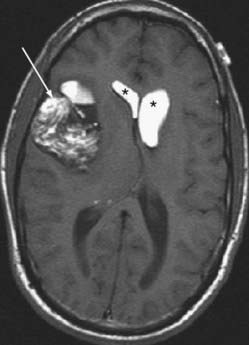
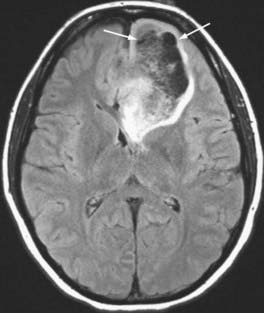
Neurocytomas usually arise along the septum pellucidum and previously were often misclassified as intraventricular oligodendrogliomas. They show a high rate of calcification and have variable enhancement (Fig. 109-11). Their course is usually benign. Rare extraventricular neurocytomas have been reported in the temporal lobe.45
Miscellaneous Extra-axial Lesions
The less common causes of extra-axial lesions in the intracranial compartment include subarachnoid seeding (which may be from a primary CNS lesion, the lymphoma-leukemia spectrum of lesions, or a primary tumor outside the CNS), lipomas (more accurately a congenital lesion rather than a neoplasm), dermoid tumors (characterized by fatty density and a propensity for rupture and seeding fat droplets into the CSF space; Fig. 109-12), and hemangiopericytoma (effectively an aggressive malignant meningioma). Sarcoidosis may mimic an extra-axial tumor and has the same imaging features as most lymphomas and meningiomas.
Intra-Axial Neoplasms
Astrocytomas
Glioblastoma Multiforme
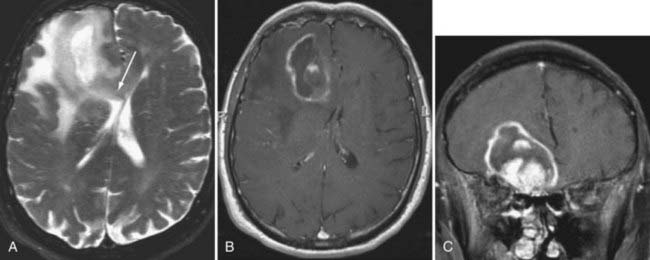
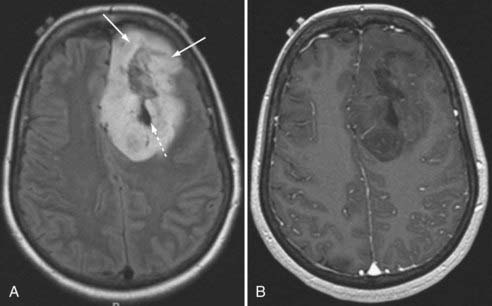
GBM is characterized by irregular infiltrating margins, poor demarcation, extensive edema, necrosis, and hypervascularity (seen as flow voids on standard imaging or high perfusion on gadolinium-enhanced CBV studies; Fig. 109-13).46 Others have found that intratumoral hemorrhage correlates well with histologic grade.47 The aggressiveness of a GBM may be suggested by its infiltration through white matter bundles (particularly the corpus callosum) and its growth into the ependyma or subarachnoid space, or both. Nearly all GBMs show contrast enhancement, but that enhancement may be irregular, nodular, or ring-like in its appearance. The absence of enhancement would argue against GBM in all but the gliomatosis cerebri forms of this tumor.48
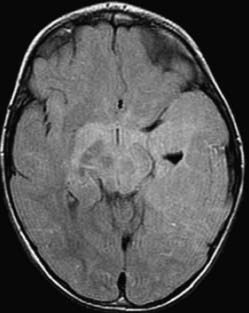
Gliomatosis cerebri is often multilobar with associated involvement and enlargement of deep gray structures.48 Brainstem and cervical cord extension may be present. Underlying structures show preservation of overall shape with a paucity of edema. CT studies may appear normal,49 but MRI demonstrates abnormal signal on long TR (T2-weighted, proton density weighted, and FLAIR) sequences (Fig. 109-14). Necrosis and significant contrast enhancement are absent.
Anaplastic Astrocytoma and Low-Grade Astrocytoma
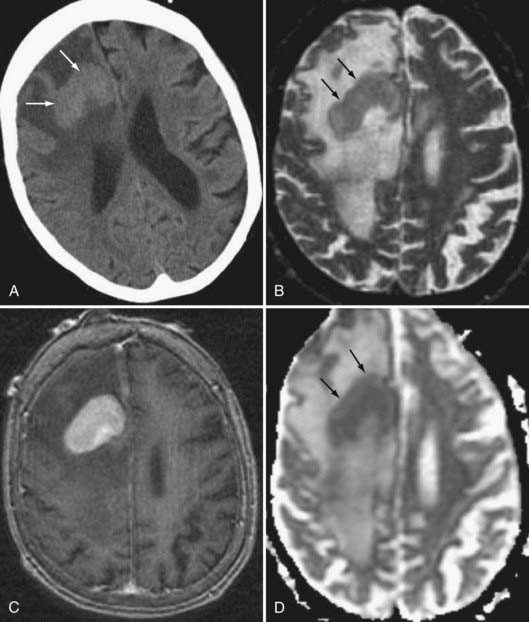
An enhancing lesion that does not show necrosis yet is infiltrative suggests an anaplastic astrocytoma. Absence of contrast enhancement and edema suggests a low-grade astrocytoma (Fig. 109-15). The more infiltrative the margins and the more extensive the edema, the more likely a non-necrotic mass will be graded an anaplastic astrocytoma. The blood flow, measured by perfusion-weighted MRI studies, is higher in anaplastic astrocytomas than in low-grade tumors.
Benign Astrocytomas
Of the benign astrocytomas, pilocytic astrocytomas of the cerebellum (typically seen as tumors with cysts and mural nodules) break the rules that enhancement tends to correlate with grade (Fig. 109-16). Despite their benign appearance, they invariably demonstrate a lactate doublet on proton spectra, a finding usually seen in higher grade tumors.50 Pilocytic astrocytomas of the optic nerve or optic pathway are often detected in patients who have neurofibromatosis type I. This lesion may or may not show contrast enhancement and may exhibit an infiltrative growth pattern. The astrocytomas that infiltrate the brainstem (so-called brainstem gliomas) are typically fibrillary and have a more malignant course than do the pilocytic variety. They may show anaplastic transformation with time. MRI is superior to CT in identifying brainstem gliomas because this is often a region where CT suffers from beam-hardening artifacts arising from the petrous bones. Also, because the lesions may not enhance, long TR (FLAIR; T2-weighted) MRI is needed to show the full extent of the mass, seen as high signal intensity.51
Perfusion scanning with maps of relative CBV of tumors with respect to white matter have been used to assess the grade of tumors.3,52,53 Relative CBV appears to correlate directly with histologic grade because the relative CBV of GBM is nearly 3 to 5 times higher than that of low-grade astrocytomas. The CBV also correlates with histologic vascularity.52 These findings make sense with respect to the propensity of GBM for recruiting and developing a vascular network and the known vascular (angiogenesis) growth factors in malignancies. The area of a tumor with the highest CBV may be the best target for biopsy.
On spectroscopy, higher grade astrocytomas sometimes show elevated lactic acid, perhaps indicative of anaerobic metabolism. Some cystic low-grade tumors may have lactate build-up in the cyst. NAA, although present, will be depressed, but there is an abundance of choline (see Fig. 109-1). The adage that the higher the choline-to-NAA ratio, the more likely one is dealing with a high-grade neoplasm tends to hold with respect to astrocytomas. A choline-to-creatine ratio of greater than 1 suggests a tumor. The lactate-to-water ratio can be used to distinguish all three astrocytoma groups, whereas the choline-to-water ratio distinguished low-grade astrocytomas from the two high-grade groups. Both the choline and lactate ratios can be used to separate the high-grade from the low-grade tumors.54
It has also been reported that MRS of intermediate-grade (WHO grade II) astrocytomas demonstrates elevated levels of myoinositol55,56; this chemical moiety does not appear to be present in as high concentrations in either lower or higher grade astrocytic lesions.
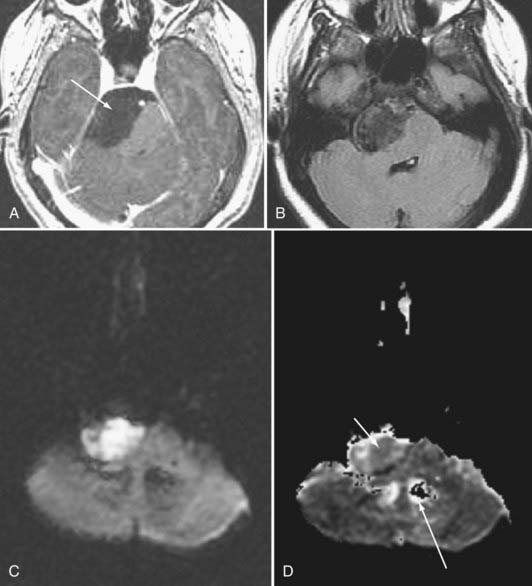
The differential diagnosis of high-grade astrocytomas includes abscess. Although the clinical picture may clearly differentiate the two, DWI has been helpful in this regard. Pyogenic abscesses tend to be bright on diffusion-weighted imaging and dark on ADC maps, indicating restricted diffusion, whereas tumoral cysts and necrosis are dark on DWI57 and bright on ADC maps because the diffusion of the water molecules in the cyst fluid is not as restricted as it is in pus. Enhancement characteristics may also be useful because abscesses have thin rims, thinner toward the ventricles. Abscesses may have high signal intensity rims on T1-weighted MRI before contrast. This has been attributed to the superoxide radicals elaborated by activated macrophages in the walls of an abscess.
Ganglioglioma
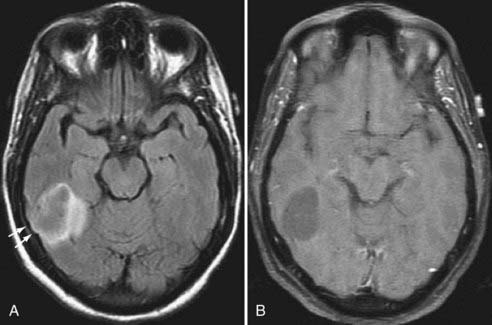
Gangliogliomas are tumors that are usually cortically based, favoring the frontal and temporal lobes.58 These well-demarcated lesions often contain cysts (Fig. 109-17). Enhancement is inconsistent. Given their cortical bases, there may be bony remodeling secondary to their slow indolent growth pattern. Calcification may be present. As opposed to gangliogliomas, which may show differentiation into a more aggressive lesion, ganglioneuromas and gangliocytomas are nonaggressive, nonprogressive lesions that often appear as a cross between a dysplasia of the brain and a neoplasm.
Recently, both positron-emission tomography (PET) and thallium-201 single-photon emission CT have been shown to be useful in predicting grades of ganglioglioma (lower activity in lower grade tumors).59 The only CT or MRI feature suggestive of higher grade is the presence of edema.
Oligodendrogliomas
These tumors are often located in the frontal and temporal lobes and have a higher rate of calcification than the classic astrocytoma series; they also have a greater propensity for cortical involvement than do astrocytomas (Fig. 109-18). Nonetheless, because astrocytomas far outnumber oligodendrogliomas, a calcified intra-axial lesion in the brain is more likely a calcified astrocytoma than an oligodendroglioma. Oligodendrogliomas may also show cystic areas as well as hemorrhagic areas. Therefore, their density and signal intensity characteristics may be heterogeneous. Enhancement is variable.
Primitive Neuroectodermal Tumors
Medulloblastomas are the classic intraparenchymal PNET. These tumors are often hyperdense on noncontrast CT. Ten percent to 20% of medulloblastomas have calcification or cystic or hemorrhagic change.60 Medulloblastomas do sometimes occur in adults and in that patient group often simulate extra-axial tumors such as meningiomas in the posterior fossa. The finding of a well-demarcated, mild to moderately enhancing hemispheric mass involving the cerebellar surface in a young adult is suggestive of medulloblastoma (Fig. 109-19).61
The spectroscopic appearances of PNETs are different than those of the astrocytoma series in that there is an absence (as opposed to a variable degree of reduction) of NAA. Both classes of lesions show elevation of choline peaks. The NAA-to-choline and creatine-to-choline ratios are lower in PNETs than astrocytomas.43 Myoinositol, taurine, glutamate, and glutamine may be evident on proton MRS maps of these tumors.
Germinomas and medulloblastomas usually are hyperdense on noncontrast CT studies, and this finding may suggest the specific diagnosis. The other intra-axial lesion to do this is lymphoma (see Fig. 109-23, later). All these lesions are likely hyperdense on CT on the basis of their dense cellularity; this hypercellularity also contributes to restricted diffusion, evidenced as low signal on ADC maps (see Fig. 109-19).
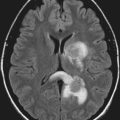
Dysembryoplastic Neuroepithelial Tumors
Dysembryoplastic neuroepithelial tumors are lesions that are hypodense on CT, hypointense on T1-weighted images, and hyperintense on T2-weighted images. Although some may infiltrate the cortex and appear as cortical thickening, most (>80%) show cyst formation, which may be solitary or multiple (Fig. 109-20).62 There may be ipsilateral temporal lobe atrophy with indistinct gray-white matter boundaries.63 Subcortical white matter involvement is seen in most cases. Invariably, there are areas of hemorrhage identified if one employs gradient-echo MRI scanning sequences. Contrast enhancement and edema are variable.62 This is a tumor that has variable aggressiveness and may simulate pleomorphic xanthoastrocytoma or gangliogliomas. Some lesions simulate CSF in their T1- and T2-weighted signal characteristics and may show calcification and bony remodeling of the calvarium.64
Desmoplastic Infantile Ganglioglioma
Desmoplastic infantile ganglioglioma (DIG) is a variant of the ganglioglioma that is usually seen in the first 2 years of life. The tumors typically occur in the frontal and parietal lobes and have a meningeal base. Cyst formation is the rule and peripheral rim enhancement usually is present as well. Some may show a calcified rim. Although this lesion may look like a huge necrotic GBM in an infant, it has a good prognosis, with benign histology. The desmoplasia accounts for the rim of low signal intensity tissue on T2-weighted images (Fig. 109-21). The differential diagnosis includes PNETs, but the incidence of calcification and hemorrhage is higher in cortical PNETS. Desmoplastic cerebral astrocytoma of infancy (DCAI) may also occur in the same aged children and look similarly. Absence of neuronal components histologically distinguishes this tumor from a DIG.
Hemangioblastoma
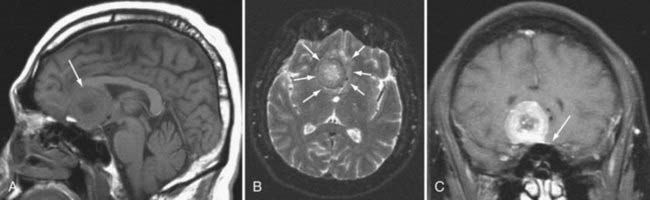
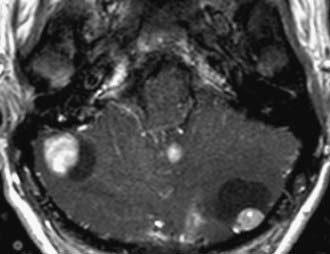
Hemangioblastoma is the second most common posterior fossa tumor in the adult after metastases. It has a characteristic appearance with a markedly enhancing mural nodule associated with a cystic mass seen in the cerebellum (Fig. 109-22). The cyst wall does not enhance.65 It looks similar to a juvenile pilocytic astrocytoma, although in a different age group. The nodule may have flow voids within it, owing to the vascular nature of the tumor, which may help differentiate between hemangioblastoma and pilocytic astrocytoma. Solid hemangioblastomas may occur in up to 40% to 45% of those masses in the cerebellum and is the rule in the cord and medulla.66 Presence of multiple hemangioblastomas implies von Hippel-Lindau (VHL) disease, and the tumors may be found in the brainstem or spinal cord with this lesion. The lesions may be pial based.
On angiography, these tumors show dense staining and may be supplied by a dilated tortuous artery. Dilated veins may coexist. If a cyst is present, it may displace vessels accordingly. Four percent to 40% of patients with hemangioblastomas have VHL disease, and 45% to 83% of patients with VHL have cerebellar hemangioblastomas.66
Lymphoma
Before the HIV-AIDS era, lymphoma was an unusual diagnosis to make on neurological imaging. It also had a reasonably characteristic appearance of being hyperdense on unenhanced CT and demonstrating avid contrast enhancement in a homogeneous fashion (Fig. 109-23); the hypercellularity of the lesions also is often reflected as restricted diffusion. In all, more than 90% of lymphomas enhance,67 and those that do not are often affected by steroid therapy, which suppresses the enhancement. Lymphoma may coat the ventricles and ependymal surfaces. Multiple lesions are present in more than half of all cases and even higher in patients with AIDS. On T2-weighted MRI, the lesion is isointense to hypointense in most cases.67 Growth across the corpus callosum is not uncommon.
Although histologically the diffuse histiocytic lymphoma of elderly patients and that of AIDS patients is similar, the imaging characteristics of these processes differ markedly. The absence of hyperdensity, the presence of necrosis, and the multifocal nature of the lymphoma seen in patients who have AIDS have led to difficulties in distinguishing this lesion from GBM and toxoplasmosis. Peripheral rather than solid enhancement (and necrosis) is often seen in lymphomas of patients who are not immunocompetent.67 Fortunately, GBM can be distinguished from lymphoma in that it is not thallium-avid, whereas lymphoma is. This nuclear medicine study, therefore, is useful in patients who have equivocal lesions and in those who have AIDS.
Metastasis
Metastatic disease of the CNS may present in an intra-axial or extra-axial location. Metastatic disease to the calvaria may be either lytic, blastic, or mixed patterns, with lung and breast carcinomas being the most frequent primary tumors. Similarly, lung and breast cancers have the highest rate of intraparenchymal metastases to the brain. Classically, metastatic foci tend to deposit at the gray-white junction of the brain, where the neoplastic emboli get caught in the vasculature. Metastases most often manifest as well-defined enhancing lesions with surrounding vasogenic edema (Fig. 109-24). Multiplicity is helpful in making the diagnosis, but in many series, a solitary metastasis is still the most common intraparenchymal lesion in an adult.
Metastases show greatly reduced NAA and creatine-phosphocreatine peaks on spectroscopy as opposed to primary glial tumors. Lipids and lactate are frequently seen in metastases. The larger the metastasis and the more heterogeneous the enhancement, the lower the choline and the higher the lipid and lactate resonances.68
Posttherapeutic Imaging
On follow-up images, enhancement is again the key to distinguishing posttherapy changes from tumoral recurrences. Pial recurrences may be present with some histologies such as medulloblastoma or other forms of PNET.69 Dural enhancement, however, is the norm for nearly all postoperative cases, whether after neoplasm resection, shunting, or epilepsy surgery. Dural enhancement does not imply residual or recurrent tumor.
Hudgins and colleagues studied patterns of dural enhancement in the postoperative setting.70 Absent, mild focal, or diffuse dural enhancement was considered a normal finding, and in fact, moderate dural or subdural enhancement may be seen in clinically well children who have a history of postsurgical subdural collections or a history of superimposed meningitis. Nodular dural, pial, or ependymal enhancement suggested recurrent local tumor, leptomeningeal metastases, or active infection.69
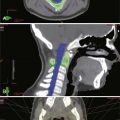
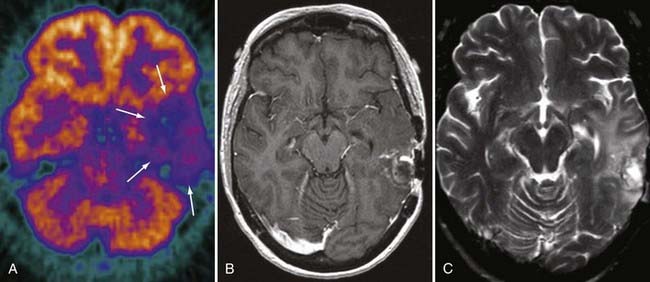
Radiation Effects
Unfortunately, it is exceedingly difficult to make the diagnosis of focal radiation injury. CT or MRI may demonstrate a mass lesion associated with edema, low in attenuation on CT and high in signal on T2-weighted imaging, which usually enhances. The possibility of focal radiation injury needs to be raised when the lesion is found in the appropriate temporal sequence to treatment. If the lesion is remote from the primary tumor site, the diagnosis is more easily suggested. Unfortunately, radiation necrosis favors the primary tumor site, probably because of predisposing vascular effects. The diagnosis of radiation necrosis may be suggested by PET. With residual or recurrent tumor, [18]fluorodeoxyglucose PET has increased activity (greater than normal brain tissue), whereas radiation necrosis shows low activity (Fig. 109-25). Overall accuracy of PET is about 85% for distinguishing residual or recurrent tumor from radiation necrosis. The accuracy rates are better for high-grade tumors than for low-grade tumors, probably because of inherent differences in tumor growth activity, but even with high-grade tumors, the results are not always easy to interpret because biopsy of PET-hypometabolic regions often demonstrates a mixture of treatment effect and isolated foci of residual or regrowing tumor. Focal hemorrhage without necrosis also occurs as a result of radiation.
Radiation-induced telangiectasias and cavernomas have recently been reported as a late phenomenon after therapy. These are characterized by hemosiderin deposition (low in signal intensity on T2-weighted and gradient-echo images) without surrounding edema.71 They may be multiple or solitary.
Spectroscopy may show some utility in the distinction between recurrent tumor and radiation effects. Choline residues are expected to be depressed with radiation injury to the brain, in contradistinction to recurrent neoplasms, in which choline is elevated. Creatine is also lower in radiation damage than in actively proliferating tumors, and lipid signals may be present as well in radiated brain.72
Some have advocated using perfusion MRI to assess for radiation necrosis. Radiation causes a decline in CBV, whereas recurrent tumor tissue leads to an increase in relative CBV by virtue of the tumor’s angiogenesis factors.73–75
Bagley LJ, Grossman RI, Judy KD, et al. Gliomas: correlation of magnetic susceptibility artifact with histologic grade. Radiology. 1997;202:511.
Cha S. Perfusion MR imaging: basic principles and clinical applications. Magn Reson Imaging Clin N Am. 2003;11:403.
del Carpio-O’Donovan R, Korah I, Salazar A, et al. Gliomatosis cerebri. Radiology. 1996;198:831.
Ellika SK, Jain R, Patel SC, et al. Role of perfusion CT in glioma grading and comparison with conventional MR imaging features. AJNR Am J Neuroradiol. 2007;28:1981.
Hinke RM, Hu X, Stillman AE, et al. Functional magnetic resonance imaging of Broca’s area during internal speech. Neuroreport. 1993;4:675.
Howe FA, Barton SJ, Cudlip SA, et al. Metabolic profiles of human brain tumors using quantitative in vivo 1H magnetic resonance spectroscopy. Magn Reson Med. 2003;49:223.
Hudgins PA, Davis PC, Hoffman JCJr. Gadopentetate dimeglumine-enhanced MR imaging in children following surgery for brain tumor: spectrum of meningeal findings. AJNR Am J Neuroradiol. 1991;12:301.
Hwang JH, Egnaczyk GF, Ballard E, et al. Proton MR spectroscopic characteristics of pediatric pilocytic astrocytomas. AJNR Am J Neuroradiol. 1998;19:535.
Ikushima I, Korogi Y, Hirai T, et al. MR of epidermoids with a variety of pulse sequences. AJNR Am J Neuroradiol. 1997;18:1359.
Jack CRJr, Thompson RM, Butts RK, et al. Sensory motor cortex: correlation of presurgical mapping with functional MR imaging and invasive cortical mapping. Radiology. 1994;190:85.
Johnson BA, Fram EK, Johnson PC, et al. The variable MR appearance of primary lymphoma of the central nervous system: comparison with histopathologic features. AJNR Am J Neuroradiol. 1997;18:563.
Kane AG, Robles HA, Smirniotopoulos JG, et al. Radiologic-pathologic correlation. Diffuse pontine astrocytoma. AJNR Am J Neuroradiol. 1993;14:941.
Kinoshita K, Tada E, Matsumoto K, et al. Proton MR spectroscopy of delayed cerebral radiation in monkeys and humans after brachytherapy. AJNR Am J Neuroradiol. 1997;18:1753.
Kremer S, Grand S, Remy C, et al. Contribution of dynamic contrast MR imaging to the differentiation between dural metastasis and meningioma. Neuroradiology. 2004;46:642.
Kwong KK, Belliveau JW, Chesler DA, et al. Dynamic magnetic resonance imaging of human brain activity during primary sensory stimulation. Proc Natl Acad Sci U S A. 1992;89:5675.
Law M, Young R, Babb J, et al. Histogram analysis versus region of interest analysis of dynamic susceptibility contrast perfusion MR imaging data in the grading of cerebral gliomas. AJNR Am J Neuroradiol. 2007;28:761.
Le Bihan D, Mangin JF, Poupon C, et al. Diffusion tensor imaging: concepts and applications. J Magn Reson Imaging. 2001;13:534.
Lee CC, Ward HA, Sharbrough FW, et al. Assessment of functional MR imaging in neurosurgical planning. AJNR Am J Neuroradiol. 1999;20:1511.
Mori S, van Zijl PC. Fiber tracking: principles and strategies—a technical review. NMR Biomed. 2002;15:468.
Mueller DP, Moore SA, Sato Y, et al. MRI spectrum of medulloblastoma. Clin Imaging. 1992;16:250.
Ogawa S, Tank DW, Menon R, et al. Intrinsic signal changes accompanying sensory stimulation: functional brain mapping with magnetic resonance imaging. Proc Natl Acad Sci U S A. 1992;89:5951.
Ostertun B, Wolf HK, Campos MG, et al. Dysembryoplastic neuroepithelial tumors: MR and CT evaluation. AJNR Am J Neuroradiol. 1996;17:419.
Shin JH, Lee HK, Kwun BD, et al. Using relative cerebral blood flow and volume to evaluate the histopathologic grade of cerebral gliomas: preliminary results. AJR Am J Roentgenol. 2002;179:783.
1 Aronen HJ, Gazit IE, Louis DN, et al. Cerebral blood volume maps of gliomas: comparison with tumor grade and histologic findings. Radiology. 1994;191:41.
2 Cha S. Perfusion MR imaging: basic principles and clinical applications. Magn Reson Imaging Clin N Am. 2003;11:403.
3 Knopp EA, Cha S, Johnson G, et al. Glial neoplasms: dynamic contrast-enhanced T2*-weighted MR imaging. Radiology. 1999;211:791.
4 Shin JH, Lee HK, Kwun BD, et al. Using relative cerebral blood flow and volume to evaluate the histopathologic grade of cerebral gliomas: preliminary results. AJR Am J Roentgenol. 2002;179:783.
5 Ellika SK, Jain R, Patel SC, et al. Role of perfusion CT in glioma grading and comparison with conventional MR imaging features. AJNR Am J Neuroradiol. 2007;28:1981.
6 Jain R, Scarpace L, Ellika S, et al. First-pass perfusion computed tomography: initial experience in differentiating recurrent brain tumors from radiation effects and radiation necrosis. Neurosurgery. 2007;61:778.
7 Boxerman JL, Schmainda KM, Weisskoff RM. Relative cerebral blood volume maps corrected for contrast agent extravasation significantly correlate with glioma tumor grade, whereas uncorrected maps do not. AJNR Am J Neuroradiol. 2006;27:859.
8 Emblem KE, Nedregaard B, Nome T, et al. Glioma grading by using histogram analysis of blood volume heterogeneity from MR-derived cerebral blood volume maps. Radiology. 2008;247:808.
9 Law M, Young R, Babb J, et al. Histogram analysis versus region of interest analysis of dynamic susceptibility contrast perfusion MR imaging data in the grading of cerebral gliomas. AJNR Am J Neuroradiol. 2007;28:761.
10 Law M, Oh S, Babb JS, et al. Low-grade gliomas: dynamic susceptibility-weighted contrast-enhanced perfusion MR imaging—prediction of patient clinical response. Radiology. 2006;238:658.
11 Kwong KK, Belliveau JW, Chesler DA, et al. Dynamic magnetic resonance imaging of human brain activity during primary sensory stimulation. Proc Natl Acad Sci U S A. 1992;89:5675.
12 Ogawa S, Tank DW, Menon R, et al. Intrinsic signal changes accompanying sensory stimulation: functional brain mapping with magnetic resonance imaging. Proc Natl Acad Sci U S A. 1992;89:5951.
13 Thulborn KR, Waterton JC, Matthews PM, et al. Oxygenation dependence of the transverse relaxation time of water protons in whole blood at high field. Biochim Biophys Acta. 1982;714:265.
14 Fox PT, Raichle ME. Focal physiological uncoupling of cerebral blood flow and oxidative metabolism during somatosensory stimulation in human subjects. Proc Natl Acad Sci U S A. 1986;83:1140.
15 Hinke RM, Hu X, Stillman AE, et al. Functional magnetic resonance imaging of Broca’s area during internal speech. Neuroreport. 1993;4:675.
16 Jack CRJr, Thompson RM, Butts RK, et al. Sensory motor cortex: correlation of presurgical mapping with functional MR imaging and invasive cortical mapping. Radiology. 1994;190:85.
17 Morioka T, Yamamoto T, Mizushima A, et al. Comparison of magnetoencephalography, functional MRI, and motor evoked potentials in the localization of the sensory-motor cortex. Neurol Res. 1995;17:361.
18 Puce A. Comparative assessment of sensorimotor function using functional magnetic resonance imaging and electrophysiological methods. J Clin Neurophysiol. 1995;12:450.
19 Yetkin FZ, Mueller WM, Morris GL, et al. Functional MR activation correlated with intraoperative cortical mapping. AJNR Am J Neuroradiol. 1997;18:1311.
20 Achten E, Jackson GD, Cameron JA, et al. Presurgical evaluation of the motor hand area with functional MR imaging in patients with tumors and dysplastic lesions. Radiology. 1999;210:529.
21 Lee CC, Ward HA, Sharbrough FW, et al. Assessment of functional MR imaging in neurosurgical planning. AJNR Am J Neuroradiol. 1999;20:1511.
22 Fellner C, Schlaier J, Fellner F, et al. Functional MR imaging of the motor cortex in healthy volunteers and patients with brain tumours: qualitative and quantitative results. Rontgenpraxis. 1999;52:3.
23 Basser PJ. Inferring microstructural features and the physiological state of tissues from diffusion-weighted images. NMR Biomed. 1995;8:333.
24 Beaulieu C. The basis of anisotropic water diffusion in the nervous system—a technical review. NMR Biomed. 2002;15:435.
25 Le Bihan D, Mangin JF, Poupon C, et al. Diffusion tensor imaging: concepts and applications. J Magn Reson Imaging. 2001;13:534.
26 Mori S, van Zijl PC. Fiber tracking: principles and strategies—a technical review. NMR Biomed. 2002;15:468.
27 Barmpoutis A, Vemuri BC, Forder JR. Registration of high angular resolution diffusion MRI images using 4th order tensors. Med Image Comput Comput Assist Interv. 2007;10:908.
28 Cho KH, Yeh CH, Tournier JD, et al. Evaluation of the accuracy and angular resolution of Q-ball imaging. Neuroimage. 2008;2:262-271.
29 Hosey TP, Harding SG, Carpenter TA, et al. Application of a probabilistic double-fibre structure model to diffusion-weighted MR images of the human brain. Magn Reson Imaging. 2008;26:236.
30 Tuch DS. Q-ball imaging. Magn Reson Med. 2004;52:1358.
31 Tuch DS, Reese TG, Wiegell MR, et al. Diffusion MRI of complex neural architecture. Neuron. 2003;40:885.
32 Bourekas EC, Wildenhain P, Lewin JS, et al. The dural tail sign revisited. AJNR Am J Neuroradiol. 1995;16:1514.
33 Demir MK, Iplikcioglu AC, Dincer A, et al. Single voxel proton MR spectroscopy findings of typical and atypical intracranial meningiomas. Eur J Radiol. 2006;60:48.
34 Ott D, Hennig J, Ernst T. Human brain tumors: assessment with in vivo proton MR spectroscopy. Radiology. 1993;186:745.
35 Poptani H, Gupta RK, Roy R, et al. Characterization of intracranial mass lesions with in vivo proton MR spectroscopy. AJNR Am J Neuroradiol. 1995;16:1593.
36 Wasenko JJ, Hochhauser L, Stopa EG, et al. Cystic meningiomas: MR characteristics and surgical correlations. AJNR Am J Neuroradiol. 1994;15:1959.
37 Kremer S, Grand S, Remy C, et al. Contribution of dynamic contrast MR imaging to the differentiation between dural metastasis and meningioma. Neuroradiology. 2004;46:642.
38 Ikushima I, Korogi Y, Hirai T, et al. MR of epidermoids with a variety of pulse sequences. AJNR Am J Neuroradiol. 1997;18:1359.
39 Chang KH, Song IC, Kim SH, et al. In vivo single-voxel proton MR spectroscopy in intracranial cystic masses. AJNR Am J Neuroradiol. 1998;19:401.
40 Moon WK, Chang KH, Han MH, et al. Intracranial germinomas: correlation of imaging findings with tumor response to radiation therapy. AJR Am J Roentgenol. 1999;172:713.
41 Moon WK, Chang KH, Kim IO, et al. Germinomas of the basal ganglia and thalamus: MR findings and a comparison between MR and CT. AJR Am J Roentgenol. 1994;162:1413.
42 Anderson DR, Falcone S, Bruce JH, et al. Radiologic-pathologic correlation. Congenital choroid plexus papillomas. AJNR Am J Neuroradiol. 1995;16:2072.
43 Wang Z, Sutton LN, Cnaan A, et al. Proton MR spectroscopy of pediatric cerebellar tumors. AJNR Am J Neuroradiol. 1995;16:1821.
44 Hoeffel C, Boukobza M, Polivka M, et al. MR manifestations of subependymomas. AJNR Am J Neuroradiol. 1995;16:2121.
45 Tortori-Donati P, Fondelli MP, Rossi A, et al. Extraventricular neurocytoma with ganglionic differentiation associated with complex partial seizures. AJNR Am J Neuroradiol. 1999;20:724.
46 Kuroiwa T, Numaguchi Y, Rothman MI, et al. Posterior fossa glioblastoma multiforme: MR findings. AJNR Am J Neuroradiol. 1995;16:583.
47 Bagley LJ, Grossman RI, Judy KD, et al. Gliomas: correlation of magnetic susceptibility artifact with histologic grade. Radiology. 1997;202:511.
48 del Carpio-O’Donovan R, Korah I, Salazar A, et al. Gliomatosis cerebri. Radiology. 1996;198:831.
49 Felsberg GJ, Silver SA, Brown MT, et al. Radiologic-pathologic correlation. Gliomatosis cerebri. AJNR Am J Neuroradiol. 1994;15:1745.
50 Hwang JH, Egnaczyk GF, Ballard E, et al. Proton MR spectroscopic characteristics of pediatric pilocytic astrocytomas. AJNR Am J Neuroradiol. 1998;19:535.
51 Kane AG, Robles HA, Smirniotopoulos JG, et al. Radiologic-pathologic correlation. Diffuse pontine astrocytoma. AJNR Am J Neuroradiol. 1993;14:941.
52 Bruening R, Kwong KK, Vevea MJ, et al. Echo-planar MR determination of relative cerebral blood volume in human brain tumors: T1 versus T2 weighting. AJNR Am J Neuroradiol. 1996;17:831.
53 Sugahara T, Korogi Y, Kochi M, et al. Correlation of MR imaging-determined cerebral blood volume maps with histologic and angiographic determination of vascularity of gliomas. AJR Am J Roentgenol. 1998;171:1479.
54 Meyerand ME, Pipas JM, Mamourian A, et al. Classification of biopsy-confirmed brain tumors using single-voxel MR spectroscopy. AJNR Am J Neuroradiol. 1999;20:117.
55 Castillo M, Smith JK, Kwock L. Correlation of myo-inositol levels and grading of cerebral astrocytomas. AJNR Am J Neuroradiol. 2000;21:1645.
56 Howe FA, Barton SJ, Cudlip SA, et al. Metabolic profiles of human brain tumors using quantitative in vivo 1H magnetic resonance spectroscopy. Magn Reson Med. 2003;49:223.
57 Kim YJ, Chang KH, Song IC, et al. Brain abscess and necrotic or cystic brain tumor: discrimination with signal intensity on diffusion-weighted MR imaging. AJR Am J Roentgenol. 1998;171:1487.
58 Castillo M, Davis PC, Takei Y, et al. Intracranial ganglioglioma: MR, CT, and clinical findings in 18 patients. AJR Am J Roentgenol. 1990;154:607.
59 Kincaid PK, El-Saden SM, Park SH, et al. Cerebral gangliogliomas: preoperative grading using FDG-PET and 201Tl-SPECT. AJNR Am J Neuroradiol. 1998;19:801.
60 Mueller DP, Moore SA, Sato Y, et al. MRI spectrum of medulloblastoma. Clin Imaging. 1992;16:250.
61 Koci TM, Chiang F, Mehringer CM, et al. Adult cerebellar medulloblastoma: imaging features with emphasis on MR findings. AJNR Am J Neuroradiol. 1993;14:929.
62 Ostertun B, Wolf HK, Campos MG, et al. Dysembryoplastic neuroepithelial tumors: MR and CT evaluation. AJNR Am J Neuroradiol. 1996;17:419.
63 Halpin SS. Dysembryoplastic neuroepithelial tumors. AJNR Am J Neuroradiol. 1997;18:1592.
64 Koeller KK, Dillon WP. Dysembryoplastic neuroepithelial tumors: MR appearance. AJNR Am J Neuroradiol. 1992;13:1319.
65 Lee SR, Sanches J, Mark AS, et al. Posterior fossa hemangioblastomas: MR imaging. Radiology. 1989;171:463.
66 Ho VB, Smirniotopoulos JG, Murphy FM, et al. Radiologic-pathologic correlation: hemangioblastoma. AJNR Am J Neuroradiol. 1992;13:1343.
67 Johnson BA, Fram EK, Johnson PC, et al. The variable MR appearance of primary lymphoma of the central nervous system: comparison with histopathologic features. AJNR Am J Neuroradiol. 1997;18:563.
68 Sijens PE, Levendag PC, Vecht CJ, et al. 1H MR spectroscopy detection of lipids and lactate in metastatic brain tumors. NMR Biomed. 1996;9:65.
69 Meyers SP, Wildenhain S, Chess MA, et al. Postoperative evaluation for intracranial recurrence of medulloblastoma: MR findings with gadopentetate dimeglumine. AJNR Am J Neuroradiol. 1994;15:1425.
70 Hudgins PA, Davis PC, Hoffman JCJr. Gadopentetate dimeglumine-enhanced MR imaging in children following surgery for brain tumor: spectrum of meningeal findings. AJNR Am J Neuroradiol. 1991;12:301.
71 Gaensler EH, Dillon WP, Edwards MS, et al. Radiation-induced telangiectasia in the brain simulates cryptic vascular malformations at MR imaging. Radiology. 1994;193:629.
72 Kinoshita K, Tada E, Matsumoto K, et al. Proton MR spectroscopy of delayed cerebral radiation in monkeys and humans after brachytherapy. AJNR Am J Neuroradiol. 1997;18:1753.
73 Guckel F, Brix G, Rempp K, et al. Assessment of cerebral blood volume with dynamic susceptibility contrast enhanced gradient-echo imaging. J Comput Assist Tomogr. 1994;18:344.
74 Wenz F, Fuss M, Scholdei R, et al. [Blood volume changes after the radiotherapy of the central nervous system]. Strahlenther Onkol. 1996;172:559.
75 Wenz F, Rempp K, Hess T, et al. Effect of radiation on blood volume in low-grade astrocytomas and normal brain tissue: quantification with dynamic susceptibility contrast MR imaging. AJR Am J Roentgenol. 1996;166:187.