1 Radiobiologic Principles
Fundamental Radiobiology
X-rays and gamma rays interact with biologic material primarily by the Compton effect, producing energetic recoil electrons that traverse the cell and induce ionization events along their tracks by removing orbital electrons, either from critical molecules in the cell (direct effect) or from water molecules located 3 to 5 nm from the critical molecules (indirect effect).1 The direct and indirect effects produce highly reactive oxygen and nitrogen species (ROS/RNS, or free radicals), which subsequently diffuse and result in further biologic damage.2 By the mid-1950s, studies on the various radiation syndromes in mammals following whole or partial body irradiation had led Quastler3 to conclude that these biologic effects resulted directly from damage to the reproductive capacity of individual stem cells that were responsible for cell renewal in the irradiated tissues. Earlier work on cell killing in bacteria, yeast, and protozoa had found that single acute x-ray doses in the range of 10 to 100 Gy were required to destroy the reproductive integrity of approximately 50% of the cells. This finding led many investigators to erroneously conclude that a similar cell-killing process involving the loss of reproductive integrity was unlikely to account for tissue effects in mammals, including humans, because in mammals these effects were observed after a radiation dose of only a few Gy. If the radiosensitivities of mammalian cell were similar to the radiosensitivities displayed by microorganisms, hardly any mammalian cells at all would lose their reproductive integrity after a few Gy. However, Quastler was able to deduce that this conclusion must be incorrect and that the radiosensitivity of mammalian cells, with respect to loss of their reproductive integrity (that is, the ability to undergo multiple cell divisions to clonally repopulate a tissue), must be much greater than that of microorganisms and did in fact underlie those effects in tissues and tumors that are of interest for radiotherapy. Furthermore, it was recognized as early as 1906 that the manifestation of radiation-induced tissue injury was expressed much earlier and more severely in tissues with rapidly dividing cells than in those with slowly dividing cells. Cell death associated with dividing cells is called mitotic-linked death, and the increase in tissue response with an increase in mitotic activity is referred to as the law of Bergonie and Tribondeau.4 Finally, for simplification of terminology, cell killing or cell lethality is defined as the loss of the cell’s reproductive integrity; and, conversely, cell survival is defined as the ability of the cell to undergo multiple cell divisions to form a colony after irradiation.
This chapter is devoted primarily to the cellular processes involved in mitotic-linked killing of mammalian cells and other ionizing radiation (IR)-induced cell death mechanisms. Considerable evidence supports the notion that DNA double strand breaks (DSBs), or a subset of DSBs, are the most important lesions mediating IR-induced cellular lethality. Several lines of evidence have led to this assertion. First, selectively irradiating different parts of the cell using charged particle microbeams or incorporated radionuclides showed that the most critical targets for cell inactivation reside in the nucleus.1,5–8 Second, cells are very sensitive to killing by the induction of DSBs following incorporation of the thymidine analog 125iododeoxyuridine (125IdU) into the DNA,6,8 which produces approximately one DSB (or several clustered DSBs) per decay depending on local chromatin topography.9–11 Third, cells are radiosensitized for both cell killing and chromosomal aberration induction by incorporation of the thymidine analog bromodeoxyuridine (BrdU) into DNA,12,13 with the increase in aberrations occurring only where the BrdU incorporates into DNA.14,15 Fourth, and perhaps most importantly, cells that are genetically deficient in rejoining DNA DSBs are very hypersensitive to cell killing and chromosomal aberration induction by IR (discussed further later and in Chapter 2). Details of radiation chemistry, the enzymology of DNA repair, and a discussion of the ongoing studies of DNA repair genes are briefly discussed later and in more detail in other parts of this book, as well as in many reviews.16–19 The mutagenic and carcinogenic effects of radiation, which can induce secondary neoplasms following radiotherapy (RT) of the primary tumor, are not discussed, nor are they important aspects of therapeutic gain, which is defined as achieving a greater effect of radiation on tumors than on surrounding normal tissues.
The First Survival Curves for Mammalian Cells
At about the same time Quastler was reaching the conclusions described in the preceding section, Puck and Marcus20,21 made several important observations about the radiosensitivity of mammalian cells. First, they demonstrated that mammalian cells in culture are at least one or two orders of magnitude more sensitive to ionizing radiation than microorganisms, and that the doses sufficient to kill 50% of the animals (LD50) from hematopoietic or intestinal damage might be killing upwards of 95% to 99% of the stem cells responsible for cell renewal in bone marrow and gut. Second, they showed that even though IR-sterilized cells could not proliferate to form macroscopic colonies, virtually all the cells they studied succeeded in completing at least one, often two to three, and sometimes even four to five abortive divisions before proliferation ceased for doses up to a few Gy, and these often formed giant cells that remained metabolically alive but were reproductively dead. Tolmach later showed that these nonclonogenic cells disappear from irradiated cultures with a half time of about a week.22 Third, Puck and Marcus noted that functions other than reproductive capacity, such as the ability to metabolize nutrients or even the complex processes necessary to reproduce viruses, were largely unaffected by doses of even tens or hundreds of Gy. Fourth, they suggested that chromosomal aberrations induced by radiation were somehow responsible for the killing, based on, among other things, observations that these aberrations began to appear in some cells at the lowest doses at which killing first began to be measurable, and presumably at doses where the most vulnerable of cell processes would be affected.
Puck and Marcus published the first IR dose–response curve for mammalian cell killing for HeLa human cervical adenocarcinoma cells,20 which is reproduced in Fig. 1-1A. In general, to obtain such survival curves, single-cell suspensions are prepared and known numbers of cells are inoculated into cell culture dishes containing the appropriate growth medium. Adherent cells then settle to the bottom, where they attach firmly to the dish. Without irradiation, inoculation of 100 single cells into a dish will yield ≤100 macroscopic colonies, with each colony containing thousands of cells that divided from these single cells following incubation for 1 to 2 weeks. This fraction of colony-forming cells in the unirradiated or untreated cultures is known as the plating (or cloning) efficiency (PE) and is often expressed as a percentage rather than as a fraction. Plating efficiencies for various tumor and normal cells are typically in the 40% to 90% range, although the system works reasonably well for plating efficiencies between 10% and 40%. Below 10%, the cells surviving without treatment may not be representative of the clonogenic population if the plating procedure itself either has sensitized the cells to IR or plating has selectively killed a subpopulation of cells, so caution should be exercised to rule out the influence of such artifacts. Irradiated cultures show reduced fractional survival values relative to unirradiated control cultures. For high doses of irradiation corresponding to survival values of 1% or less, no surviving colonies would be observed for 100 cells inoculated. Therefore, for high doses leading to low survival, the number of cells inoculated per dish is usually increased. The relative surviving fraction S is calculated as:
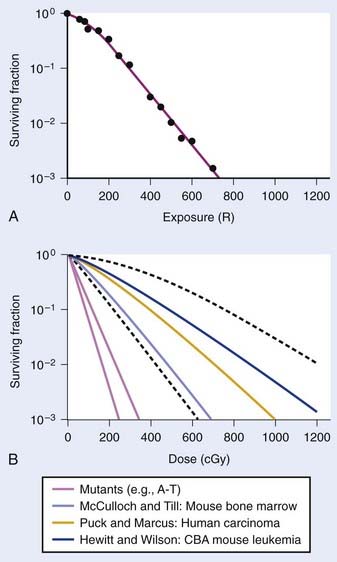
FIGURE 1-1 • X-ray or gamma ray dose–survival curves for mammalian cells. A, The first such survival curve (for HeLa cervical adenocarcinoma cells) reported in 1956 by Puck and Marcus.20 B, A range of survival curves for other mammalian cells. The dashed lines encompass the range for wild-type cells of various origins. The steepest curves show a range typical of hypersensitive mutants, such as cells from patients with ataxia-telangiectasia (A-T). Note that in A, the dose is expressed in roentgens (R), which for the cells X-irradiated on glass, must be multiplied by ∼1.4 to obtain the dose in cGy.
where PE is the fraction (not percentage) of unirradiated cells that form colonies compared to the number of cells initially plated.
For large IR doses that yield low survival values or cultures with very low plating efficiencies for which large numbers of cells must be plated, appropriate controls using irradiated nonclonogenic feeder cells should be used to maintain a constant cell density and ensure that variations in survival because of differences in cell density in these cultures do not occur.23 Note that the survival curve illustrated in Fig. 1-1A, like many others, have a characteristic shoulder region at low doses; the reduction in survival per unit dose (i.e., the slope of the survival curve) is usually less than the approximately constant slope for survival values below about 0.1. Another interesting finding from these and subsequent studies was that cell populations derived from single cells surviving high radiation doses were not radioresistant, but had essentially the same radiosensitivity as the original parent populations. In fact, in many cases, populations derived from single cells surviving high doses of radiation have been found to be slightly more radiosensitive than the original population.24,25 This finding may relate to the observation that progeny of cells surviving irradiation divide at a reduced rate and have genetic instabilities26,27 and reduced plating efficiencies.24
Subsequent to these initial survival studies that used cultured tumor cells, cells from human normal tissues were next to be studied, and other techniques and methods were devised to measure survival of both normal and tumor cells in in vivo experimental animal models. Hewitt and Wilson devised an ingenious dilution assay method to determine the dose response for cell killing in a transplantable murine lymphocytic leukemia.28 They found that, on average, only two cells were necessary to induce a tumor in recipient mice. This corresponds to the inflection point on the titration curve relating the percent of injected animals that develop tumors to the number of cells injected per animal. The number, or dose, of cells for 50% tumor take is known as the TD50. Hewitt and Wilson reasoned that if a radiation treatment killed half of the cells, for example, then an injection of twice as many cells would be required to transplant the tumor. In other words, the inflection point or TD50 of the titration curve would be shifted from two cells for an unirradiated tumor to four cells for an irradiated tumor in which half the cells were killed. Thus, a radiation dose survival curve could be constructed by dividing the TD50 for unirradiated tumors (derived from unirradiated transplanted cells) by the TD50 for tumor cells receiving various radiation doses before inoculation. The survival curve the authors obtained for mouse lymphocytic leukemia cells,28 shown in Fig. 1-1B, was similar to the curve Puck obtained with HeLa cells.
At about the same time the results of Hewitt and Wilson were published for mouse tumor cells in vivo, Till and McCulloch29 reported an equally clever technique for assaying the survival of normal mouse hematopoietic cells. In mice (and humans), both the spleen and the bone marrow are major hematopoietic organs. The authors noticed that colonies arising from surviving cells could easily be seen as nodules in the spleen during necropsies of mice euthanized at various times after irradiation. For high IR doses, no such colonies could be seen; however, injection of nucleated bone marrow cells from unirradiated mice could rescue the irradiated mice if the doses were not too high, and some of the injected cells were also found to lodge in the spleen and form nodules. The number of these nodules was directly proportional to the number of cells injected. Thus, the spleens of the supralethally-irradiated mice acted as in vivo culture dishes in which colonies could be counted, and the injection of irradiated cells resulted in proportionally fewer colonies in the spleen. Survival curves constructed in this way using normal hematopoietic cells injected into mice were again similar to those for human HeLa cells and mouse leukemia cells, as also shown in Fig. 1-1B. These hematopoietic cells responsible for generating spleen colonies have been loosely termed stem cells, although more recent work with cell lineages in the hematopoietic system suggest that such spleen colonies are likely generated by surviving hematopoietic progenitor cells. These are sometimes referred to as spleen colony forming units (CFUs) to avoid implying a precise knowledge of their origin.
These early studies (and several others immediately following) pointed to a general conclusion that the radiosensitivities of mammalian cells examined were quantitatively similar, at least of the same order of magnitude. Doses differed by only factors of about two to three to reach equitoxic survival levels for various cells studied, but no striking systematic differences were observed in relation for tumor cells versus normal cells or those derived from rodents or humans. The range of dose–survival responses for x-rays or gamma rays delivered at high dose rates (20 to 2000 cGy/min) is shown by the dashed curves in Fig. 1-1B. It is noteworthy that although the majority of reports describing dose–survival responses for a wide variety of cells were carried out using in vitro (ex vivo) culture systems, the in vivo studies of Hewitt and Wilson and Till and McCulloch were not the only ones addressing the question of radiosensitivity of cells in more native in vivo tumor or normal tissue contexts. For example, Withers and coworkers, Gould and Clifton and coworkers, and others, have determined dose responses for in vivo IR-induced cell killing in a variety of tissues, including skin cells (D0 ∼1.4 Gy),30 crypt cells of the jejunum (D0 ∼1.4 Gy),31,32 testes spermatogonial stem cells (D0 ∼1.7 Gy) (33), kidney tubule-regenerating cells (D0 ∼1.5 Gy) (34), mammary ductal cells (D0 ∼1.3 Gy),35 and thyroid cells (D0 ∼2 Gy).36 At least for these cell types, the native tissue context does not seem to alter their radiosensitivity relative to typical mammalian cell radiosensitivities documented in vitro.
The previous observations, however, do not rule out potentially important roles for tumor or tissue-specific signaling factors and the local microenvironment in altering tissue IR responses (discussed by Barcellos-Hoff et al.37). It was also recognized at a fairly early stage in the development of modern cellular radiobiology that there were consistent differences among cell types. Cells of lymphoid origin (normal or tumor) appear to be somewhat more radiosensitive than cells from other tissues. It is also important to note that virtually all of the early studies focused on single acute (high dose–rate) exposures, and radiosensitivity was judged largely by examination of survival curves in the 5 to 15 Gy range. In the past 25 years or so, it has become better appreciated that cellular responses in the first decade of survival are not only pertinent for standard multifraction radiotherapy regimens but also can reveal important systematic differences underlying cellular radiosensitivity, especially for cells exposed to low doses or low dose–rates.38 The surviving fraction after 2 Gy or SF2 is an index of radiosensitivity that has been widely used.39,40 Recently though, the clinical use of single-fraction (or two to three large-fraction) high-dose radiotherapy referred to as stereotactic body radiotherapy (SBRT)41 has received much attention and renewed interest in the survival responses of both normal and tumor cells following doses of 15 to 30+ Gy.42 The role of tumor and normal tissue cell killing and therapeutic gain following SBRT are briefly discussed later in this chapter in the apoptosis section.
Definitions and Descriptions of Radiosensitivity: N’s, D0’s, α’s and β’s
Typical IR cell survival curves are constructed with survival plotted on a log scale against dose on a linear scale (typically in cGy or Gy; where 1 Gy = 1 J/kg and 1 cGy = 1 rad), and are characterized by an initial shoulder followed by a linear (or relatively linear) portion at higher doses (see Fig. 1-1). Much effort, thought, and ingenuity in the early days of radiobiology have gone into devising mathematical models to describe the shapes of cell survival curves, based on certain assumptions including mechanisms of cell killing. With appropriate adjustment of various parameters, many mutually exclusive models of radiation action adequately fit any given set of experimental data, so curve fits by themselves tell us essentially nothing about underlying radiobiologic mechanisms. Still, they are useful, principally, in two ways. First, these mathematical descriptions of survival curves provide a very helpful way to catalog and compare radiosensitivities for different cells and different irradiation conditions in terms of these descriptive parameters, so long as one uses the same general mathematical description to fit the survival data. Second, these mathematical survival curve descriptions are useful for predicting the way cell survival may change for different radiation conditions, including changes in dose-rate or dose-fractionation, modification of the chemical environment during irradiation, or changes in radiation quality (linear energy transfer [LET]). Differences in survival may also occur because of alterations in the proportion of various subpopulations of cells that have different radiosensitivities (such as that observed as cells progress through the cell cycle, discussed later).
Historically, the mathematical descriptions of dose–survival curves most widely used for mammalian cells were borrowed from target theory, an analytical approach whose development began in the 1920s and whose aim was to deduce the size and number of critical targets in cells in which IR-induced damage led to a biologic effect. The need for such a target concept, in which damaging ionization events or ion clusters of ∼100 eV are deposited in critical structures such as nuclear DNA, stems from the fact that the amount of energy deposited by exposure to 10 Gy, which kills about 99% of the cells, would raise the temperature of the target material by only about 0.002° C.1 Thus, the difference is that for IR exposures, relatively large amounts of energy are deposited in very small volumes (sufficient to break chemical bonds), whereas raising the temperature only increases the overall average kinetic energy of the molecules in the absorbing material slightly. It has been widely appreciated that a number of complicating factors make classical target theory largely impractical and inappropriate to describe the molecular mechanisms underlying cell killing. The original hit hypothesis and its development to the so-called target theory dealt mainly with numbers of hits or targets and their distribution among cells, and did not account for complications like heterogeneity of sensitivity within a cell population or to repair processes. More realistically, we can think of the distribution of events or hits that could be lethal and are not processed properly or are misrepaired to leave a lethal lesion some time after an exposure, rather that within milliseconds after exposure.
where S is the fraction of cells surviving a dose, D. This type of survival curve is illustrated in Fig. 1-2A. In this expression, D0 is the dose on the straight-line portion of the log-linear survival plot necessary to reduce the survival from some value S to (e−1 S) or (0.368 S). It is also sometimes called the mean lethal dose because it is the dose necessary to produce an average of one event per target in a cell containing N targets, all of which must be hit to kill the cell. If N–1 of these targets have already been hit, as would be the case in virtually all the cells not yet killed after a dose corresponding to survival values below about 0.1, an additional dose of D0 would leave an average of one hit in the previously nonhit targets and would thus reduce the survival from S to (e−1 S). The number N, which in this case is the number of targets, can be obtained by extrapolating the high dose, low survival portion of the curve to its intercept on the ordinate at zero dose. This value is more appropriately referred to as the extrapolation number rather than the target number, since the ideal situation in which the two are the same is seldom if ever seen in practice. It is easy to see, however, that the extrapolation number is a measure of the size or width of the shoulder of the survival curve. Another measure is the quasithreshold dose or Dq which is the intercept of the extrapolated high dose, low survival portion (below 0.1 survival) of the curve back to the dose axis drawn through the ordinate survival axis at a surviving fraction of 1.0. Another way to determine Dq is to recognize that the equation for the high dose portion of the curve is approximated very closely by:
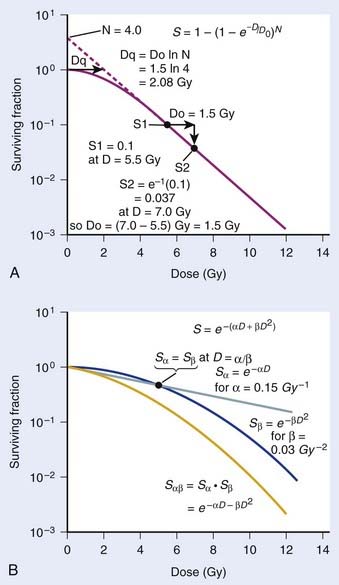

Thus, for a surviving fraction of 1.0 corresponding to the Dq dose:
By far the main drawback for using the so-called simple multitarget expression (equation 1) is the fact that it usually gives a very poor fit to survival data in the shoulder region, that is, in upper part of the first decade of survival. This is a problem because, as already mentioned, the first decade (in the shoulder region) is the region of the curve that is of special interest for radiotherapy delivered in multiple 2-Gy fractions. The shape of the single acute dose survival curve below about the 0.1 survival fraction is of little interest for this purpose, though for single high dose fraction radiotherapy it certainly is of interest. The multitarget-type curve has zero slope at zero dose, and data indicates that survival curves with large shoulders do not fit the multitarget expression well at low doses (below 2 to 3 Gy). As well as providing better consistency for other considerations such as dose-rate and fractionation effects, better curve fits are obtained by adding a single-hit component to the expression, giving:
where 1/D1 + 1/Dn = 1/D0 and D0 is the reciprocal slope of the curve as defined earlier and N is the extrapolation number. This expression provides a good fit to practically any set of data. It retains the N – D0 convention as an index of radiosensitivity and, as mentioned earlier is also able to handle analyses involving changes in survival with dose rate, LET, and other factors affecting responses.
Another mathematical approach to the description of dose–survival relationships which lends itself to analyses involving changes in dose rate and or other modifying factors, and which has other appealing features, is the so-called α–β model. In this model, survival follows the expression shown in Fig. 1-2B:
One of the several appealing features mentioned earlier is that this model readily derives from a mechanism of cell killing that we now know to be largely correct, although for some cells, additional mechanisms such as apoptosis also contribute to cell killing (see later). The mathematics amounts to a simple description of the dose response for the formation of chromosomal aberrations, rather than some abstract targets of obscure identity and behavior. The model derives from the fact that cells die largely as a result of loss of genetic information in the progeny of cells bearing certain chromosomal aberrations induced by radiation. This is not just one of a number of plausible mechanisms of cell killing, but there is a large body of evidence to support it.21,43–48 Not only has quantitative agreement been found between chromosome aberration induction and cell killing, but the strongest possible evidence is that provided by Revell and associates,49 who showed that virtually every diploid cell of the types they studied irradiated in G1 and reaching the first mitosis with a fragment-generating (micronucleus-generating) aberration failed to form a colony, while every irradiated cell reaching the first mitosis without such an aberration did form a colony. Virtually all the cells they studied did reach the first mitosis. If these aberrations and the putative lethal events were unrelated in a cause-and-effect sense, and some other unseen lesions with the same radiosensitivity for its production were actually the real lethal lesion, then some cells with aberrations should have formed colonies while some cells without aberrations should not. The latter was not observed. As already mentioned other mechanisms of cell killing such as apoptosis, may contribute to cell killing to a greater or lesser extent depending on the circumstances (mainly the cell type). For some agents and particular hormonal induction processes, apoptosis may account for all of the cell death; but for exposure to ionizing radiation, most cells die principally as a result of the production of certain chromosomal aberrations. Apoptosis, when it is involved does not nullify the lethal effects of these aberrations in cells bearing them, but only adds to the overall lethality when it is involved.
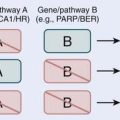
Most chromosomal aberrations are exchange types requiring two chromosome breaks for their formation, with one event or electron track producing one break and another independent event or second electron track producing the other, or in some proportion of the cases, with one electron track producing both breaks (Fig. 1-3). When two independent events must occur in close proximity in space and time, the frequency of such double events increases as the square of the total number of separate single events. This is analogous to second order or bimolecular reaction kinetics in chemistry. The single break events are, of course, directly proportional to the radiation dose, so the exchanges from a coincidence of independent events will increase as the square of the dose. Although when two breaks occur close enough together to form an exchange, they do not necessarily do so. Instead, they can restitute by joining the way they were, or they may fail to rejoin, which would result in a terminal deletion. In fact, exchange-type aberrations are much more frequent than terminal deletions in human cells. The most interesting events are those that result from the closely spaced breaks that mis-rejoin to form either a symmetrical (nonlethal) or an asymmetrical (usually lethal) exchange. When an exchange occurs between two chromosomes, the exchange is symmetrical if the exchange does not join the two centromeres together and is asymmetrical if the two centromeres are joined together. Thus, the initial break-pair forms what may be termed a potentially lethal break-pair or simply a potentially lethal lesion. This will be discussed in more detail in connection with a certain kind of repair process. As mentioned earlier, the yield of these independently produced lethal aberrations per cell, Y2, increases as the square of the dose D, or
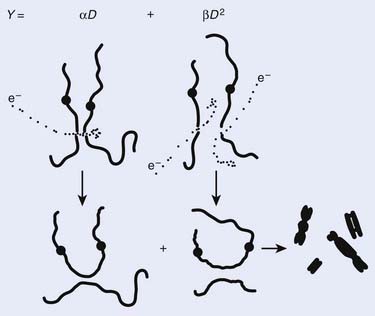

where β is the proportionality constant relating to the fraction of potentially lethal break-pairs that are actually converted to lethal aberrations under a given condition. It is also possible, however, that two breaks could be produced along a single electron track. For example perhaps this would be more likely near the end of an electron track where the number of ionizations per unit track length (LET) increases.1 In any case, the yield of such two-break single-track events would simply increase in direct proportion to dose D, rather than as the square of the dose so the yield Y1, would be

where α is a proportionality constant. The total yield of lethal aberrations per cell Y would then be the sum of Y1 + Y2 so

where Px is the probability that exactly x events will occur for a given trial when the mean number of events over a large number of trials is µ. In our case µ = Y, and the cell must have no lethal events (aberrations) to survive, so x = 0 and the probability of exactly no events is:
and since for large numbers of cells or trials, P0 → S (the fraction surviving), and Y = αD+βD2, we can write 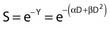 which is equation (4) displayed earlier and plotted in Fig. 1-2B. Curves of the form shown in Fig. 1-2B fit experimental data very well, especially over the first and second decades of survival, but it is also the case that the curve slope continues to increase for higher doses so the curve fit is not always good in the higher dose region. This is an issue in situations where it may be desirable to estimate cell survival for high dose single fraction radiotherapy, but we will return to this later. In addition, recent studies have shown that a substantial fraction of aberrations for doses above 3 to 4 Gy, are complex, meaning they involve 3 or more breaks in 2 or more chromosomes.50–53 The ways in which these form, and the impact on the mathematical description of dose responses from a mechanistic standpoint are not presently known, but there is still no doubt that the increase in lethal asymmetrical exchange aberrations closely follows a linear-quadratic function of dose. It has been argued that one flaw of this linear-quadratic model is that it gives a survival curve that continuously bends downward at higher and higher doses, whereas, very good experimental data for cell survival over 5 or more decades of cell killing tend to show a straight line on a log linear plot for the whole range of survivals below about 0.1. In fact, this is not a very good argument against the connection between aberrations and cell killing, because these lethal aberrations do not actually increase as αD+βD2 at doses much higher than about 8 to 10 Gy; that is, they tend to saturate and approach linearity at high doses (at least up to 15 to 20 Gy).
The earlier arguments for model descriptions that best serve the purposes described have been well recognized and addressed over the past decade or so. These have been well described by several authors and the interested reader may find the descriptions and discussions of Dale,54 Carlone and colleagues,55 Guerrero and Li,56 and Sachs and colleagues57 are of particular interest. For most purposes, the α/β description is probably the best basic starting model to use, but because many workers still use the N – D0 description, we have included it in this chapter as well.
Cellular Processing of Radiation Damage
Cells are able to process radiation damage and are largely able to repair the molecular lesions that can lead to chromosomal aberrations and cell death. In some instances, however, the repair may be incomplete, or misrepair may occur. As we mentioned previously, most lethal chromosome aberrations are exchanges (in human and other types of cells, mostly asymmetric intrachanges yielding interstitial deletions or interchanges yielding dicentrics with an acentric fragment). Two events must occur close together for such exchanges to occur, not only in space but also in time. Cells are able to repair or rejoin chromosome breaks, so if the entire radiation dose is delivered over a period of a few seconds or minutes, all the breaks that are ever going to be produced will occur together, or for practical purposes, nearly simultaneously. After such a dose given in a short period (acute dose), there would be a certain number of break-pairs, each produced by two independent electron tracks spaced close enough together for a possible exchange. However, if the same total dose were delivered over a period of several days, for example at a low dose rate, then fewer of these independent two-track break-pairs that could form potential exchanges will occur simultaneously. Even though breaks may occur in the same proximity in the cell nucleus, the break-pairs would never (or rarely) exist together, because the first break would have rejoined and disappeared long before the second break of the pair needed for an exchange ever arrived. Thus, the βD2 component is very dose rate–dependent. There would, of course, still be the same number of break-pairs produced by the single-track mechanism; therefore, this αD component of cell killing is dose rate–independent and also important for mediating biologic effects of very low acute doses since the higher LET-like track ends of recoil electrons may well produce most of the lethal damage.1 These concepts are illustrated again by reference to Fig. 1-3. Note that the formation of complex aberrations, which involve ≥3 breaks on two or more chromosomes, requires some refinement of the mechanistic description, but this does not alter the established fact that aberrations for the most part underlie cell killing in fibroblasts and epithelial cells, and at least up to doses of 8 to 10 Gy, these increase as a linear-quadratic function of X-ray or gamma ray dose.
Local chromatin topography (compaction status, epigenetic and histone modifications, accessory proteins, etc.) plays a major role in the accessibility of various repair proteins to DSBs and therefore modulates aberration induction. Evidence for this comes from the observation that both IR and restriction endonuclease-induced DSBs occur preferentially in G-light chromosome bands, i.e., euchromatic, more open regions of active gene transcription.58–64 Similarly, a study by Barrios and coworkers who examined cells from radiotherapy patients found that the preponderance of exchange points of radiation induced interchanges occurred in G-light bands.65 It is known that the heterochromatic inactive supernumerary X chromosomes of individuals with Kleinfelter syndrome are resistant to IR-induced chromosome interchange formation.66,67 Recently, a study by Cowell et al. demonstrated γ-H2AX foci generated at sites of IR-induced DSBs form preferentially in euchromatic regions of the interphase nucleus.68 The next topics for discussion are the well-studied cellular repair process known as sublethal damage repair (SLDR) and potentially lethal damage repair (PLDR). These are terms that are operationally defined.
Sublethal Damage Repair
In 1957, Jacobson presented some of the first evidence that X-irradiated cells (chlamydomonas) sustain sublethal damage (SLD) that can be repaired.69 Jacobson showed that a radiation dose delivered in two separate fractions separated in time gave a higher survival than if the dose was given in one single fraction. The first such study of the survival of mammalian cells by Elkind and Sutton (1959) compared single-fraction acute dose radiation survival of V79 Chinese hamster cells to that following doses split into two separate fractions and delivery times.70 In 1960, Elkind and Sutton71 extended these observations and reasoned that the shoulder on survival curves for mammalian cells (or any other cells with similar survival curves having shoulders) by itself indicates that a damage accumulation process must be involved in cell killing.25 Some arguments have arisen over this point because notions of repair saturation have been suggested, but even in this instance, the putative saturation will still require damage accumulation. It also follows from this argument that cells surviving a radiation dose high enough that the survival would be off the shoulder (survival <0.1) must be sublethally damaged. In other words, cells have accumulated damage that makes them more susceptible to killing by the next IR dose than if they had not received any radiation. For this reason, such damage was termed sublethal damage or SLD.25,71 The question they then asked was, if a population of sublethally damaged cells surviving one dose were allowed to incubate for various periods, would the cells be able to repair this sublethal damage? If repair of all the sublethal damage occurred, a dose–survival curve determined for these surviving cells should have a shoulder similar to cells that had never been irradiated. If no repair occurred, the dose–survival response should be a simple exponential decrease continuing at the survival level corresponding to the initial dose and along the same curve as for the original cell population.
As illustrated in Fig. 1-4A, the shoulder of the survival curve indeed returned, indicating that the cells had recovered from their sublethal injury and implying that the sublethal damage had been literally repaired, so the cells were in this respect “restored to their original condition.” In further studies, Elkind and coworkers found that this shoulder returned with the half time for SLDR being of the order of half an hour.25 However, as discussed in the next section on cell cycle effects, a complete return of the shoulder does not necessarily mean that all sublethal damage has been repaired. Many other workers have obtained similar results both for cells in vitro and in vivo, and repair half times range from about 0.5 to 1.5 hours. Typically, the way such studies are carried out is by the split dose technique, in which changes in survival are measured as a function of incubation time between two equal doses. The technique is illustrated in Fig. 1-4B. Generally, for an in vitro experiment, a number of identical cultures would be set up, all of which have the same number of cells that receive the same total dose, 2D; the only difference is that for some cultures, the dose would be given all at once, although for others, the dose would be given in two fractions of D, separated by various periods of time between the doses.
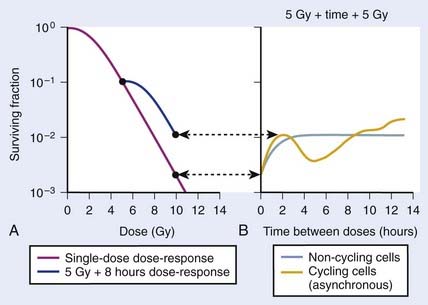
FIGURE 1-4 • Illustration of sublethal damage (SLD) and its repair (SLDR) (A), and the rate of SLDR (B). A, A single-dose dose–response curve (lower curve) and another curve obtained by first delivering a dose of 5 Gy and then incubating the cells (in this case 8 hours) before determining survival for irradiated cells that survived the first dose. If these cells returned to their initial preirradiation state, they should respond (as they do) along the upper curve from 5 to 10 Gy, whereas, if no change occurred during incubation in the cells surviving the first dose (i.e., no recovery from sublethal damage), the response would continue along the lower curve from 5 to 10 Gy. The increase in survival after the total dose of 10 Gy compared to the two 5 Gy radiation doses amounts to a factor of ∼5 in this case. B, The rate at which this increase in survival occurs shown as a function of time between the two IR doses. The complex curve for cycling cells results from the fact that there is a large difference in the radiosensitivity of cells depending on their position in the cell cycle (see text and Fig. 1-5). For noncycling cells, this cell cycle–related complexity is not observed.
According to this view, two breaks produced by a single electron track can also lead to a lethal exchange, and the number of such events is strictly proportional to the total dose; that is, it is dose rate–independent. The contribution of this single-event two-break process to the total lethal damage is given by the αD term of equation 5. It is only the βD2 term that governs dose-rate or dose-fractionation effects related to SLDR. In the simple case of the split dose experiment described earlier, if the total dose 2D is given all at once, the lethal aberration yield will be:
Notice that the αD terms in equations 7 and 8 are the same, but the βD2 terms differ by a factor of 2, which translates to a survival for the split dose treatment (using equations 6, 7, and 8) that is higher by a factor of  than for the single 2D dose. For many small doses, or in the limit of continuous irradiation at a sufficiently low dose rate, the βD2 term disappears altogether, and the only remaining damage is that from the αD component. By the same arguments, a dose-rate reduction factor depending on the rate of rejoining of breaks and their rate of formation can be applied to the βD2 or repairable component of damage. This was first done by Lea72 for the yield of chromosomal aberrations for doses delivered over different periods of time, and by Kellerer and Rossi73 in their theory of dual radiation action. Variations on this same theme54,74,75 as well as other approaches76 also have been described. As mentioned earlier, the recent work of Guerrero and Li56; of Carlone et al.55; and of Sachs et al.57 are particularly pertinent. The general case for different dose rates derived by Dale54 is:

where
and R = dose rate in Gy/hr, µ = repair constant in hr−1 (with the half time for repair equal to 0.693/µ), and T = total duration of irradiation in hours. For very low dose rates of ∼0.3 Gy/hr or less, S = e−αD.
There has been a great deal of discussion in recent years about the relative radiosensitivity and repair capacities of cells whose damage leads to early versus late effects in normal tissues, or effects in tumor versus late normal tissue damage. This discussion generally has been placed in the context of the α/β cell survival expression.77 The point in question is how the responses of these tissues change with dose fractionation and dose rate. Generally, there appears to be a greater dose fractionation sparing effect with late-responding normal tissues than with early-responding tissues. In terms of α, β, and SLDR we have discussed, the radiosensitivity of the cells whose damage underlies late effects has a larger β component relative to the α component than the radiosensitivity of tumor cells or cells for early effects. Put in another way, the α/β ratio is smaller for late effects than for early effects. The α/β ratio gives an index of the proportion of damage subject to the dose fractionation sparing effect. If α were zero, the ratio would be zero, and all the damage would be reparable; therefore, for low enough dose rates or a sufficiently low dose per fraction, the killing effect of radiation would disappear altogether. As β approaches zero, the ratio increases without bound, so no dose rate or fractionation effect at all would be seen; in fact, the survival curve would be linear without a shoulder and would be described by the α component only. Furthermore, as illustrated in Fig. 1-2B, the α/β ratio corresponds to the dose for which there is an equal contribution to the damage from both the α and β components. Thus, when


The relationship between survival and dose (using values of α and β in equation 4) has been used to convert one fractionation scheme to another fractionation scheme that is calculated to give the same amount of radiation damage as the original scheme.78 For example, n1 fractions of dose d1/fraction can be converted into n2 fractions of dose d2/fraction with the following equation:

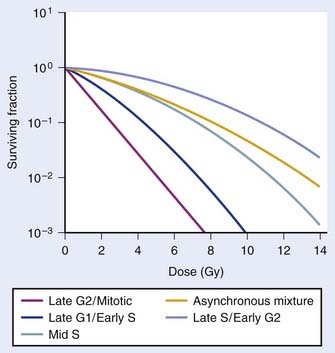
Variation in Radiosensitivity Through the Cell Cycle
So far we have only briefly mentioned an important factor complicating the interpretation of dose fractionation and dose-rate effects, namely the observation that the radiosensitivity of cells changes through the cell cycle. This phenomenon was first discovered by Terasima and Tolmach79 and has been studied extensively by many others.12,80–84 Fig. 1-5 shows dose–survival curves for synchronous cells irradiated at different stages of the cell cycle. Generally, cells in late G2 and mitosis are most sensitive, cells in mid-to-late S phase (the portion of the cell cycle when DNA is replicated) and early G2 are most resistant. Often, cells around the G1/S border (late G1/early S) are sensitive, and cells in mid-G1 are more resistant. The effect of this differential cell cycle radiosensitivity when asynchronous, randomly dividing cell populations are studied in dose fractionation experiments is that the first dose selectively kills the more radiosensitive G1 and G2 cells in the population. The surviving S phase cells continue to repair sublethal damage and begin to progress towards the more sensitive G2 and G1 phases in the cell cycle, following release from a dose-dependent S-phase delay. Both phenomena affect the way in which these cells will respond to the second dose. For example, after the first dose, the selective survival of the more radioresistant S phase cells, reflected by a large shoulder on the survival curve, complicates the interpretation of whether or not recovery of sublethal damage is complete. For complete recovery, the shoulder of the survival curve for the second dose should be larger than the shoulder for the first dose delivered to the original asynchronous cells (consisting of both radiosensitive G1 and G2 phase cells and radioresistant S phase cells).85 Because the rate of SLDR is usually faster than cell cycle progression, SLDR leads to the rapid early increase in survival in split-dose experiments. By contrast, cell cycle progression leads to a gradual decrease in survival over time (via cell cycle redistribution or reassortment), but is eventually followed by an increase in survival as the semisynchronous surviving population divides (repopulates) (see Fig. 1-4B). These three processes have been referred to by Withers as three of his four R’s of radiotherapy, that is, repair, redistribution, and repopulation (along with the fourth R, reoxygenation, discussed later).86
Cell cycle dependent radiosensitivity and progression of cells in the cycle after irradiation can be important factors, both in comparing the radiosensitivities of different cell types and in determining the responses of cell populations in normal tissues and tumors when doses are fractionated or delivered continuously at low dose rates.38,81,87–89 For example, accumulation of cells in the radiosensitive phase at the end of G2 can, in certain instances, overshadow the dose-rate effect due to repair, such that the effect per unit dose actually increases rather than decreases with a reduction in dose rate.88 In general, irradiated cells have the greatest cell cycle delay during G2, with approximately 1 to 2 min per cGy for cells irradiated in late S and G225 and about one third less delay during G2 when they are irradiated in G1 or early S.90 The delay from G1 into S is usually only an hour or two, even for doses as high as 6 Gy,90 but appears to increase in cells that express wild-type Tp53 (discussed later).91 The accumulation of cells in G1 that is observed approximately 16 hours after irradiation in cells expressing wild-type Tp53 is also associated with accumulation of cells in G2,92 and this reduction in the number of cells in the radioresistant S phase should cause a reduction in the shoulder of the survival curve for a second dose delivered ∼16 hr after the first dose (see Fig. 1-4). A simple illustration of effects of heterogeneous populations on radiation survival curves, with explanatory equations, was presented many years ago,93 and has been discussed and applied in practice on other occasions.25,94
Finally, it is extremely important to consider the overall distribution of cells in the cell cycle when comparing the radiosensitivities of different cell lines and other IR-related biologic endpoints. For example, if two cell lines, line A and B, had identical radiosensitivities, but the line A culture was primarily distributed in G1 at the time of irradiation, while the line B culture had its cells primarily distributed in S or was dividing asynchronously, a comparison of the radiation responses of cell lines A and B would lead to the erroneous conclusion that line A is more radiosensitive than line B (compare G1 with asynchronous or S cells in Fig. 1-5). This important concept of intrinsic cellular and differential cell cycle-phase radiosensitivity prompted Steel, McMillan, and Peacock95 to suggest a fifth “R” for radiation therapy, in addition to Wither’s original 4 R’s.86
Potentially Lethal Damage Repair
Cell survival also can be altered by the incubation conditions of cultures after irradiation. Many years before the work with mammalian cells, experiments showed that holding bacteria for a time after irradiation in a buffered salts solution and then plating for the survival assay gave a much higher survival than if the cells were kept in full nutrient broth after irradiation.96 This phenomenon is referred to as liquid holding recovery. Similarly, if mammalian cells are held in suboptimal growth conditions for various times after irradiation, such as by treating cells with metabolic inhibitors,97 balanced salts solution,25,98 reduced temperatures,44,99 or maintaining cultures in G0/G1 contact inhibition48,100 or under serum starvation,101 their survival is greatly enhanced. This is illustrated in Fig. 1-6 for holding cultures in plateau phase.102
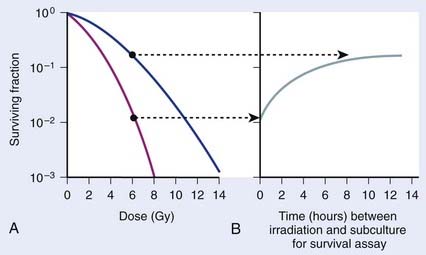
In Fig. 1-6A, survival curves are shown for apparently normal primary human fibroblasts irradiated as plateau-phase G0/G1 cultures and then either subcultured immediately or 24 hours later to assess survival by single-cell colony formation. In Fig. 1-6B, the rate of PLDR is reflected by an increase in survival as a function of the time delay between irradiation and subculture for the survival assay for cultures receiving the same dose. The interpretation of such observations was that radiation produced lesions that were potentially lethal, and that under one set of incubation conditions, a damage repair process operating in opposition to a damage fixation process resulted in a certain fraction of these lesions being converted to nonlethal lesions (via repair and restitution) while the remaining fraction was fixed into lethal lesions that killed the cells (via an improper misrepair event or a lack or repair).103 As postirradiation conditions are changed, they may become more favorable to the repair processes, less favorable to the fixation processes, or both, so that the final result would be a higher proportion of the potentially lethal lesions being converted into nonlethal lesions. From the perspective of chromosomal aberration formation, a highly quantitative correlation between cell survival and the yield of aberrations is observed following manipulation of postirradiation culture conditions.48 One set of incubation conditions may favor the restitution of breaks as opposed to exchange, while for another set, restitution is less favored.44,104 The reason for this phenomenon is not known, although we know that certain suboptimal growth conditions, such as holding cultures in plateau-phase confluency, favor restitution. Also, treatment with anisotonic salts, which inhibits PLDR and SLDR,105,106 greatly affects chromatin structure, which could alter the proximity of lesions, such as DSBs and clustered DNA damage lesions,107 in some way to affect the fixation and repair processes involved in aberration formation.104,108,109
Numerous reports of postirradiation colony formation ability, mitotic and PCC-induced chromosomal aberration induction, gel electrophoresis and γ-H2AX foci kinetics over the last 40 years have documented similar kinetics of PLD repair,48,85,100,110–117 with the majority (≥90%) of PLD repaired by 6 hours. Repair of PLD has been noted in most cell lines examined (except ATM−/− and BRCA1−/− cells), both normal and malignant in origin, making clinical use of chemical inhibitors of PLD processes ineffective for cancer treatment purposes.118–120 Weichselbaum et al. proposed a link between intrinsic PLD repair capability and the radiocurability of tumors,121 but further work119 could not substantiate such a correlation. Although the degree of cellular PLD response may be of little prognostic value in the radiotherapy clinic, such variations may be of great importance for the study of the responsible molecular repair mechanisms. For example, Schwartz et al.,122 Franken et al.,123 and Alsbeih et al.124 recently showed PLD repair to be a Tp53-dependent process. Functional inactivation of Tp53 by HPV-16 infection or direct mutation of Tp53 in human and isogenic mouse cell lines significantly moderated the increases in survival following 24 hours of confluent holding. However, since Tp53 gene inactivation is a classic feature of transformed and tumor cells, the observation that many tumor cells demonstrate PLD repair indicates other (Tp53-independent) pathways in these cells must also contribute to this response.
Chemical Modification of Radiation Damage
Details on modification of radiation damage by chemical sensitizers such as oxygen or other electron-affinic agents or chemical protectors such as sulfhydryl amines or thiophosphates are provided elsewhere in this volume, but it is appropriate to mention briefly the way such agents act to modify the parameters of dose–response relationships discussed earlier in this chapter. Most of these agents act as dose-modifying agents and alter the dose response curve by a parameter termed the dose modification factor (DMF). This is called a synergistic type of interaction between the modifying agent and IR, which is distinctly different from an additive type of interaction that only reduces the shoulder of the survival curve. For an independent type of interaction, the overall shape of the IR survival curve is unaffected, but is shifted downward by an amount equal to the reduction in survival (the DMF) resulting from treatment with the modifying agent.125 In fact for these types of independent interactions, following treatment of synchronous populations or asynchronous populations with minimal variation is modifying agent-induced cytotoxicity through the cell cycle, the net survival for the combination of both agents is simply the IR survival multiplied by survival for the dose of modifying agent employed (see Dewey et al.,12 and Dewey125 for these definitions and discussion of complications caused by cell cycle variations in sensitivities to the two agents).
then under fully oxygenated conditions the dose D would effectively be multiplied by a DMF of 3, so
As can be seen by multiplying both the numerator and denominator of the exponent by  , so that
the oxygen effect effectively reduces the D0 by a factor of 3 without changing the extrapolation number N. A similar calculation applies for the N, D1, Dn–based expression in equation (3).
For the α/β survival expression, if the survival under anoxic conditions SN is
the survival under fully oxygenated conditions is therefore

or
This threefold increase in dose required for a given amount of IR-induced cell killing under hypoxic conditions compared with irradiation under oxygenated conditions is thought to play an important role in radiotherapy.126–128 Many tumors contain a significant fraction of hypoxic and therefore radioresistant cells compared to the well-oxygenated cells in surrounding normal tissue. For a single acute dose of IR, the dose required to kill about 90% of the tumor cells (e.g., a survival fraction of 10−13 for a tumor with 1012 clonogenic tumor cells) would have to be about three times larger than it would be if all of the cells in the tumor were well oxygenated. However, the situation is not this bleak, because in most tumors, considerable reoxygenation occurs during fractionated radiotherapy. This reoxygenation effect is Wither’s fourth “R” of radiotherapy, which follows the three “R’s” mentioned previously, i.e., repair, redistribution, and repopulation.86 It should also be noted that not all tumor cells are likely to be equally clonogenic and capable of regenerating a tumor (often referred to as tumor or cancer stem cells); this will lower the total number of cells in a tumor that require inactivation.129,130
Similar calculations can be made for radioprotective compounds that act as dose modifying agents, except that to calculate the biological effect in the presence of the protector, IR doses delivered in the absence of the protector must be divided by the DMF. Cysteine has been shown to act as a dose modifying radioprotector with a DMF of about 1.5 to 2, which results in an effective reduction of α by  and β by
  .131,132
Radiation Quality, Relative Biologic Effectiveness, and Linear Energy Transfer
An example of the dose–survival curves for mammalian cells for radiations of different LET is shown in Fig. 1-7. The LET is, to a first approximation, a track-averaged description of the density of ionizations along the ionization track in irradiated material and increases as the LET increases. Actually, more sophisticated microdosimetric and nanodosimetric quantities (such as lineal energy) are used for precisely describing radiation quality, but for our purposes, LET is a sufficient tool. Low-LET ionizing radiations such as β particles and secondary electron recoils from X-rays and γ-rays deposit energy stochastically in materials by liberating secondary electrons with tortuous track structures and have LET values on the order of 0.3 to 1 keV/µm (β particles are primary electrons released from radioactive decay processes of unstable radioactive nuclei). High-LET ionizing radiations such as alpha particles, nuclear fragment recoils from high-energy neutron interactions, and other HCP such as constituents of galactic cosmic radiation (GCR) deposit their energy along more direct tracks producing nuclear (i.e., atomic) fragments and scattering secondary high-energy delta-ray electrons with combined LET values that may approach 1000 keV/µm or more.1 It should be noted that protons used in radiotherapy have an LET of ∼1.0 keV/µm, similar to x-rays and gamma rays.133,134 Protons have the primary advantage of improved dose distribution compared to photon and electron beams, however the risks of low dose scattered neutron exposures in the surrounding normal tissues remains to be determined and addressed.135
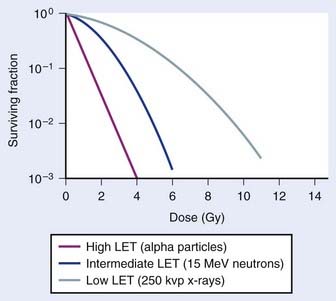
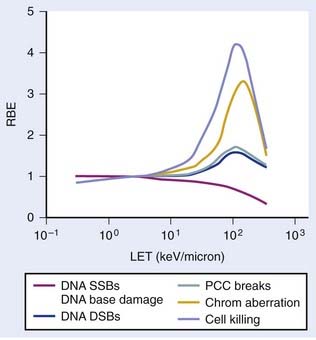
The relationship between RBE and LET can be illustrated in terms of cell killing caused by the induction of chromosomal aberrations. For low LET x-rays or gamma rays, the distance between ionizations or ion clusters along an individual recoil electron track is almost always greater than the minimum interaction distance for two chromosome breaks to interact to form an exchange (∼0.2 to 0.5 µm136,137). Therefore, two or more electron tracks are usually necessary to form an exchange, and most of the ionizations that contribute to the total dose are “wasted” because they are unlikely ever to be involved in generating a potential aberration-producing break-pair. As the LET increases, a peak in RBE is eventually reached at which an optimum spacing of ionizations occurs for producing break-pairs with maximum efficiency.1 This optimum RBE also probably includes a repair component, since the higher density of damage also appears to influence the processing and repair of DNA damage and also the complexity of IR-induced chromosomal aberrations.107,138–140 Depending on the biologic endpoint measured and other factors such as total dose and dose-rate, RBE values from ∼1 for low-LET radiations to >100 for high-LET radiations have been calculated. Maximum RBEs of 1.2 to 1.6 for DNA DSB induction138 and PCC-induced interphase chromosome breaks141 and ∼3 to 10 for chromosomal aberrations and cell killing occur at an LET of ∼100 keV/µm.1 With further increase in LET, the RBE subsequently declines, because more energy is being deposited than is necessary to produce the given biologic effect, so although this wasted energy contributes to increasing the dose, the efficiency per unit dose decreases.
The relationship between RBE and LET is shown in Fig. 1-8 for different biologic endpoints. Especially relevant to radiotherapy with heavy ions, the oxygen enhancement ratio (OER) for cell killing decreases from a maximum of ∼3 for low LET radiation to near unity as the LET increases to ∼100 keV/µm and above.1 This probably occurs because the high LET track traversals induce so much localized damage in the DNA and other sensitive cellular targets that the additional contribution from ROS/RNS-mediated damage becomes relatively unimportant, or it has also been suggested that recombination of these free radicals occurs within the track volume before diffusion.142 Not only does an increase in LET cause an increase in the relative effectiveness per unit dose (up to a maximum), but an increase in LET also decreases repair of DNA damage, SLDR, PLDR, and often the sensitizing and protecting effect of chemical modifiers.138–146 Effectively, the dose response for high LET radiations, like alpha particles and heavy ions, is totally dominated by a dose rate– and repair-independent α component of the expression  . Whereas the value of α for x-rays or gamma rays might be of the order of 0.2 Gy−1, the α parameter for 100 keV/µm alpha particles might be as much as 10 times higher, or ∼2.0 Gy−1, with the β parameter close to zero.
Ionizing Radiation–Sensitive Mutants
A review of the molecular processes involved in the repair of DNA damage, entitled “DNA Damage and Repair,” is available in Chapter 2 of this volume, and other excellent reviews are available in the literature.16,17,19 Ionizing radiations are nearly unique in that a high relative proportion of the prompt or initial DNA damage they produce are DSBs, at least compared to other agents like alkylating agents, H2O2, and UV-C irradiation.2 The few other agents that also produce a high proportion of prompt DSBs relative to other lesions include the bleomycins, neocarzinostatin and restriction endonucleases. DSBs are produced endogenously during V(D)J recombination, meiosis, and chromosome decatenation after DNA replication,147,148 but here we will focus on the phenotypic effects of lesions of principal concern following IR exposure. The following discussion is largely focused on important characteristics of radiosensitive cells with limited discussion of their sensitivity other exogenous or endogenous DNA damaging agents or the underlying molecular repair processes. We have also not discussed nontargeted effects of low dose IR (≤10 cGy), such as adaptive responses, bystander effects, and low dose hyperradiosensitivity (HRS), for which several excellent reviews are available.149–153 Although these would likely be of relatively minor consequence in the context of the radiation therapy of tumors using higher IR doses, their role and risks in normal tissue responses in low dose–exposed regions beyond the treatment window is an active area of radiobiologic research.
Our current understanding of DNA repair processes in prokaryotic (e.g., Escherichia coli) or lower eukaryotic microorganisms (e.g., budding yeast Saccharomyces cerevisiae) following treatment with agents such as ionizing or nonionizing radiations, or genotoxic chemical agents has been based primarily on the availability and study of mutants that are hypersensitive to such agents.154 Progress in this area for mammalian cells was initially very slow and depended on recognition of naturally occurring mutants including human patients affected by various radiosensitivity syndromes, until the development and application of strategies for producing and isolating mutants generated by chemical mutagenesis.155–158 More recently, progress has gradually accelerated, both because increasing numbers of individuals with radiosensitive phenotypes have been recognized, and also the strategies for producing radiosensitive mutants (namely gene targeting approaches159,160) have improved. These approaches include the generation of specific gene knockouts, gene silencing or knock-downs (e.g., using RNA interference or RNAi approaches94) and other reverse genetic techniques that allow one to examine the effects of alterations of single genes and their protein products using cells of the same genetic (isogenic) background (also obviating the need to study genetically unstable tumor cells). These latter approaches, however, require knowledge of a candidate gene to test, whereas other techniques such as replica plating can uncover mutants in unknown genes.
In the 1960’s, Gotoff and coworkers reported that patients with ataxia-telangiectasia (A-T) undergoing radiation treatment for cancer uniformly showed “untoward responses” to X-irradiation.161 Taylor and his colleagues later showed that cells from such patients are very hypersensitive to ionizing radiation.162,163 A-T results from autosomal recessive gene mutation in ATM (ataxia-telangiectasia mutated), located on chromosome 11q22–23, which was cloned in 1995.164 The 9168 bp ATM gene spans 66 exons stretching over 160 kb and encodes a 3056 amino acid, 350-kD serine/threonine protein kinase that plays a pivotal role in orchestrating cellular responses to IR-induced damage including the initial signaling of damage, the activation of DNA repair, and the execution of cell death mechanisms.16,163,165 The complexity of the ATM-regulated damage network is illustrated by a recent report from Matsuoka et al. that documented over 900 phosphorylation site targets for ATM in over 700 proteins.166 The phenotype for homozygous recessive ATM−/− individuals includes a progressive neurodegeneration, hypersensitivity to ionizing radiation, immune deficiencies, and a predisposition to cancer.163 The defect in such individuals appears to involve not only DNA repair but signal transduction and checkpoint pathways as well (discussed later). ATM+/− heterozygotes appear clinically normal, and cellular responses to radiation are near normal, although there are suggestions that heterozygotes may have an increased incidence of breast cancer,167 and several reports show distinct, though mild hypersensitivity to ionizing radiation117,168–170). Genetic mutations of two of the three members of the MRN (Mre11-Rad50-Nbs1) complex are associated with clinical conditions: NBN (Nbs1 or nibrin) with Nijmegen breakage syndrome (NBS)171–173 and MRE11 with A-T-like disorder (ATLD).174,175 Cells derived from these patients share similar, but not identical, phenotypes with cells derived from A-T patients (e.g., radioresistant or unscheduled DNA synthesis, chromosomal and telomere instability, checkpoint defects, and hypersensitivity to DNA-damaging agents).17,171–175 Other genetic diseases subsequently found to be associated with ionizing radiation sensitivity include Ligase 4 (LIG4) syndrome involving DNA ligase IV, radiosensitive SCID (RS-SCID) involving the Artemis protein, and ATR-Seckel syndrome involving the ataxia-telangiectasia and Rad3-related serine/threonine protein kinase ATR.17,176–179
The first radiosensitive mammalian cell line, the mouse lymphoma cell line L5178Y-S (LY-S), was reported in 1961 by Alexander.180 The responses of LY-S cells and the parental LY-R cells to a variety of genotoxic agents are detailed in a recent pair of reviews by Szumiel.181,182 LY-S cells appear to be deficient in nonhomologous end joining (NHEJ), although the responsible mutation remains to be identified.183 Many more radiosensitive mutants of rodent origin were isolated during chemical mutagenesis screens during the past 30 years and several reviews detailing the derivation and characterization of these lines are available (see Collins184 and Thacker and Zdzienicka185 and references therein). More recently, groups employing gene-targeting techniques have generated isogenic cell lines with specified repair gene deletions186,187; this provides an advantage over chemically mutagenized mutant lines that likely harbor additional unknown mutations. Several mutant cell lines deficient in the NHEJ proteins derived from mouse and Chinese hamster cells (primarily derived from V79 lung fibroblast and CHO ovarian epithelial cells) have been phenotypically characterized. Likewise, mutants of the homologous recombinational repair, Fanconi anemia, and IR-responsive checkpoint signaling pathways have been generated and characterized, and are generally only slightly radiosensitive compared to the hypersensitive A-T and NHEJ mutant cells. HRR and FA-deficient cells, however, are hypersensitive to cell killing by other DNA damaging agents such as alkylating agents, DNA interstrand crosslinking agents and UV-C radiation.186,187 Radiosensitive mouse strains have also been identified and studied, including the NHEJ-deficient scid and BALB/c strains that bear defects in the gene encoding DNA-PKcs (Prkdc/Xrcc7).188–192
All of these mutant cells are hypersensitive to IR to some degree with respect to both cell killing and induction of chromosomal aberrations, and have provided extensive insights into the underlying molecular processes that mediate DNA repair, cell cycle checkpoint induction and cell survival after irradiation. The dose–survival response for some radiosensitive mutants is shown in Fig. 1-1B where the x-ray or gamma ray D0 is in the 0.4 to 0.5 Gy range compared to values of 1.5 to 2.0 Gy for the corresponding wild-type cells. Coupled with the fact that the dose response curves for the radiosensitive mutants also generally show a greatly reduced shoulder, the relative radiosensitivities measured by the ratio of doses to yield a 10% level of survival is around fourfold to fivefold and can be even greater for lower doses and higher survival levels. All the genetic and epigenetic factors controlling radiosensitivity are by no means known, so there is much yet to learn about factors controlling radiosensitivity and how we might manipulate them for therapeutic gain; this discussion, however, is beyond the scope of this introductory chapter. In the future, such knowledge should be extremely useful for the radiation oncologist in the clinic. At the very least, it expands our (limited) scientific understanding of the prognostic factors involved in the treatment of patients with cancer, might result in molecular strategies targeted to IR-responsive pathways, and could be used prospectively to tailor customized patient RT regimens (assuming laboratory methods for accurately determining individual radiosensitivity can be developed given the large degree of inherent genetic variation in the human population).
Mechanisms of Ionizing Radiation–Induced Cell Death
Radiation-induced cell death mechanisms are influenced to varying degrees by cell and tissue-type-specific factors. In addition to mitotic linked death that results from genetic loss from acentric fragment-generating chromosome aberrations in the progeny of irradiated cells, other processes that may mediate IR-mediated cell killing include permanent cell cycle arrest, mitotic catastrophe, apoptosis, autophagy, and necrosis. As mentioned previously, cells of hematopoietic origin are prone to IR-induced apoptosis. Cells of the stroma (fibroblasts and endothelial cells) and parenchyma (epithelial cells) are less susceptible to apoptosis, but rather tend to undergo IR-induced mitotic cell death, mitotic catastrophe, or experience Tp53-mediated permanent cell cycle arrest or premature senescence while maintaining continued (and potentially altered) metabolic and biochemical signaling activities.1,193–199 Each of these IR-induced cell death mechanisms can collectively contribute, in varying and often interrelated ways (depending on cell type), to the overall loss of clonogenic capacity following irradiation. It is not surprising then that it has been difficult to obtain strong correlations between tumor cell survival after irradiation (as measured by standard in vitro clonogenic assays) and the induction of non-mitotic linked cell death mechanisms, such as apoptosis. The failure to obtain such strong correlations implies that these various cell death mechanisms collectively influence cellular lethality.
Both cytoprotective (growth) and cytotoxic (stress) pathways are induced following IR and anticancer drug exposures. The severity of cellular damage can influence a particular outcome by tipping the balance of the cellular response in either direction. These responses can be mediated by subtle changes in protein levels or intracellular localization, a number of protein posttranslational modifications (such as phosphorylation and ubiquitination), or, in the case of tumor cells, altered or novel protein activities endowed by genetic mutation. Many intracellular signaling pathways are activated by IR exposure upon initial sensing by the cell’s damage sensors. Intercellular communication and signaling in the tissue microenvironment may also modulate IR-induced cell killing, overall tumor and normal tissue responses, and the risks of early and late effects, although the quantitative influence of these factors in the microenvironment has not been elucidated.37 We have sought to introduce some of the pertinent molecular interactions underlying these modes of cell death since many novel cancer treatment strategies are being engineered to specifically target and exploit these pathways, both as standalone treatments and as agents to maximize the efficacy of more traditional radiotherapy and chemotherapy treatment regimens.
Mitotic Cell Death
As discussed previously, the generation of lethal chromosome aberrations leads to an irreversible loss of proliferative capacity within only two to three cell generations because of the loss of critical genetic information on acentric fragments. These acentric fragments, which may contain hundreds of genes, often fail to segregate properly to daughter cells during mitosis. These fragments generate micronuclei in daughter cells that not only perturb the proper expression of accompanying genes, but more importantly, they are subsequently lost during successive rounds of cell division. Therefore, in most cell types, IR-induced cell killing is greatly influenced by the induction, signaling and repair of double-stranded DNA damage. This includes DSBs and clustered DNA damage formed immediately after IR exposure2,107 and those that can be generated from subsequent repair processes, since the intermediate steps of DNA repair often create aberrant DNA structures that could be considered damage lesions if left unattended by the DNA repair machinery. DSBs are also an important lesion underlying cell killing by chemotherapeutic drug exposures, but many require DNA replication to achieve maximum efficacy.19,148 As such, DSBs are considered the determinant lesion dictating tumor cell survival and the underlying lesion responsible for the induction of chromosome aberrations, chromosomal instability, mutagenesis, and carcinogenesis in normal tissues following IR exposure.200–204 It is very important to consider not only the immediate killing of cells in tumors or normal tissues with rapid turnover, but also those cells in normal tissues that do not proliferate as rapidly where late effects may occur sometimes a decade or more after treatment. Generally, cell turnover in these late responding normal tissues is very slow, and stem cells that repopulate these tissues and maintain tissue homeostasis are called upon to divide more infrequently. This is why proliferative or mitotic-linked cell death is also considered an underlying cause of dose-limiting late effects, as opposed to some delayed signal transduction mechanism in which some signal, triggered years earlier during treatment, reemerges later for reasons unrelated to cell proliferation.
Before DSB repair, IR-induced DSBs are detected by one of a (ever-growing) family of DSB sensor and mediator proteins. To date, these sensor proteins include the Ku70/80 heterodimer, the MRN complex, Tp53-binding protein 1 (53BP1), mediator of the DNA damage checkpoint-1 (MDC1/NFBD1), the Rad9-Rad1-Hus1 or 9-1-1 complex, BRCA1, and DNA and RNA polymerases that become stalled on sites of DNA damage.16,204–211 These sensor proteins transmit damage signals to the transducer protein kinases ATM, ATR, and DNA-PK,16,212 members of the phophatidyinositol-3 kinase (PI3K)-like kinase (PIKK) family that target protein serine and threonine residues for phosphorylation rather than lipids. These proteins mediate the phosphorylation of the histone variant H2AX on serine 139, forming γ-H2AX foci at sites of DSBs in a dose-dependent manner213,214; an example of these IR-induced foci in human fibroblasts can be seen in Fig. 1-9. Such foci serve to recruit additional DSB signaling and repair proteins to the site of damage, the activities of which are likewise modulated by subsequent phosphorylations by ATM, ATR and DNA-PK.213–215 ATR and ATM also phosphorylate the downstream effector kinases CHK1 and CHK2, respectively; these proteins induce cell cycle checkpoints that prevent cells with DNA damage from undergoing DNA replication or entering mitosis. Extensive and partially overlapping autoregulatory feedback mechanisms exist for every step of these pathways, and although these pathways are lesion-specific and dose-dependent in initiation, they converge on several common critical cellular response pathways.16,204,210,212,215,216
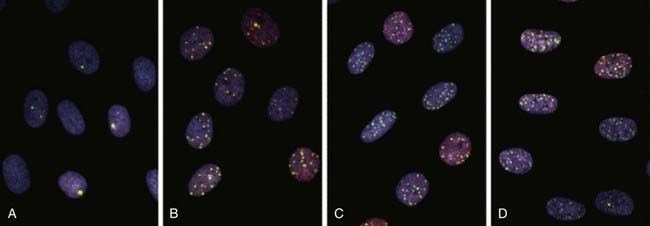
As discussed in Chapter 2, the two main pathways for DSB repair in human cells, NHEJ and homologous recombinational repair (HRR), operate in a cell cycle phase-dependent manner.16,82–84 NHEJ is the primary DSB repair pathway throughout the mammalian cell cycle, while HRR contributes to DSB repair in duplicated S and G2-phase chromosomes by using the sister chromatid as a template for accurate repair. HRR activity is a major factor underlying the increased radioresistance observed in S-phase cells compared to the other cell cycle phases.82–84 NHEJ operates in S and G2-phase, possibly with increased fidelity,217 implying these two major DSB repair pathways are not mutually exclusive during the cell cycle. Interchromosomal HRR between homologous or heterologous chromosomes in G1-phase chromosomes can be detected but occurs at such a low frequency (∼10−6) to be of biologic importance.218–220 NHEJ-mediated repair of radiation-induced DSBs may result in small deletions or nucleotide changes at the repair junction at low frequencies because of exonucleolytic processing.58,221,222 Such error-prone DSB repair through NHEJ-mediated pathways is thought to constitute the predominant source of potentially mutagenic lesions associated with radiation exposure and carcinogenesis, and is thought only to be tolerated in mammalian cells because of the high percentage of non–protein coding DNA sequences in mammalian genomes.223
Following DSB sensing and signaling, rejoining or restitution occurs most of the time, but in a certain proportion of the cases, interaction with a nearby DSB leads to mis-rejoining or chromosome exchange formation. As discussed earlier, about half of these exchanges are lethal in diploid cells irradiated in G0/G1, because half are asymmetrical and generate acentric chromosome fragments that lead to large losses of genetic information in the progeny of cells. A-T cells and many other radiosensitive mutant cells show a large increase in aberration production per unit dose relative to wild-type cells.102,224 For A-T fibroblast cells irradiated in G0/G1, this increase in chromosomal aberration yield results from a much larger proportion, relative to normal cells, of initial chromosome breaks that rejoin incorrectly to yield an excess number of acentric fragment-generating chromosome aberrations.102 This was studied by inducing premature chromosome condensation (PCC)225 in human fibroblasts and measuring the number of excess PCC fragments in cultures held in G0/G1 quiescence for up to 46 hours after irradiation before the initiation of PCC.102 The results for A-T versus normal cells are shown in Fig. 1-10. The initial number of chromosome breaks is apparently the same for normal and A-T cells, although there is some uncertainty in estimating the number immediately after irradiation since the cell fusion and PCC process itself requires 15 to 20 minutes at 37° C. The rate of rejoining also is the same, but the residual number of excess fragments after 24 or even 46 hours while the cells remained in G1 is much higher for A-T cells than for normal cells. This difference fully accounts for the difference in radiosensitivity with respect to cell killing, and develops while the cells are in a noncycling G0-state.48 Specifically, the number of fragments observed in G0/G1 after repair (PLDR) was complete was the same as the number of aberrations observed in metaphase after the cells had traversed S phase and G2. Furthermore, one lethal aberration per cell was observed for both A-T cells and normal cells when survival was reduced to 37% by irradiation with 0.7 Gy and 4 Gy, respectively. Similar techniques have been used by many other investigators to study genotoxic agent-induced chromosome breakage (clastogenicity) and rejoining of chromosomes.226–228
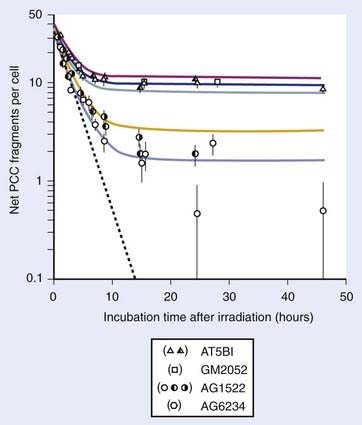
Therefore, the increased radiosensitivity of A-T cells is not dependent on the failure of irradiated A-T cells to arrest in G1, which would result in the cells having less time to repair DNA damage before they enter S phase. In fact, the hypothesis that Tp53-induced G1 arrest enhances radioresistance91 could not apply for most asynchronous populations in which the overall radiosensitivity is determined by the fraction of radioresistant S-phase cells, not cells in G1 (see Fig. 1-5). Finally, the suggestion that radiation-induced apoptosis is principally responsible for A-T fibroblast cells being radiosensitive229 is unlikely, because practically all of the cells irradiated in G1 enter the first mitosis without the appearance of apoptotic cells.102 The possibility that the loss of chromosome fragments in subsequent generations following their initial production in A-T cells might result in a (Tp53-independent) delayed apoptotic death has been investigated by several groups. Some have also reported minimal induction of apoptosis at later times (48 hours) after irradiation230 while others have reported significantly increased rates of apoptosis in A-T fibroblasts (12% to 35%) compared to apparently normal fibroblasts (∼2%).231
Permanent G1-Phase Cell Cycle Arrest
The loss of proliferative capacity associated with mitotic cell death was initially considered the primary or perhaps the sole process responsible for IR-induced cell killing. Other cell death mechanisms such as apoptosis and permanent cell cycle arrest initially did not receive as much attention in the earlier days of radiobiology research. This may have been a result of a heavy reliance on the use of a limited number of cell lines such as HeLa, Chinese hamster cell lines like CHO and V79, and several mouse cell lines, most (if not all) of which were tumor or transformed cells and were Tp53-deficient (in other words, cells that are genetically abnormal). As discussed previously, the ∼1 : 1 correlation between lethal IR-induced chromosome aberrations and cell survival documented in AG01522 human fibroblasts in the Cornforth and Bedford study48 (see Fig. 1-10) suggested that the majority of IR-induced cell killing was due to the induction of lethal CAs. But there is evidence that even in normal fibroblasts, which are not generally prone to IR-induced apoptosis, there can be contributions to cell killing from processes such as permanent G1-phase arrest.230–234
Many reports have now demonstrated that human fibroblasts and epithelial cells undergo a dose-dependent G1-phase arrest.235 This arrest was shown to be Tp53-dependent. A recent report by Borgmann et al.236 that examined several Tp53-wild-type apparently normal human fibroblast strains concluded that more lethal events per cell occurred than chromosome aberrations per cell, whereas in cells known to be Tp53-deficient, one lethal event per cell corresponded to one lethal chromosome aberration per cell. Whether there is any connection between the presence of chromosome aberrations and the sensing and signaling pathways that trigger G1 delay or permanent G1 arrest in Tp53-proficient cells is not known. As many cells and tissues in the body are quiescent or slowly cycling, a large fraction of them are in the G0 or an extended G1 stage of the cell cycle,194 IR-induced permanent G1 arrest of cells and senescence, a state in which cells no longer proliferate but remain metabolically active, is likely to contribute to the extent of acute or late effects, as well as the slow or more rapid turnover of cells that die from early or late mitotic cell death.
IR exposure of cells in the G0/G1 stage of the cell cycle results in the rapid activation of ATM and DNA-PK and the stabilization of Tp53 via phosphorylation.237–239 The primary mediator of the Tp53-dependent G1 delay is CDKN1A (p21Waf1/Cip1), a potent inhibitor of cyclin D–CDK4/6 and cyclin E–CDK2 complexes that function to drive the retinoblastoma protein (pRb)-mediated G1-S transition.232 Tp53 is found in low levels in cells because of steady-state ubiquitin-targeted degradation mediated by its negative regulator, MDM2.240,241 Tp53 is activated by phosphorylation and inhibition of MDM2 binding, and upon stabilization, Tp53 functions as a tetrameric transcription factor that induces the expression of a number of cell cycle control and repair genes that function to halt further cell cycle progression and initiate DNA repair or apoptosis (discussed in a following section).92,237,242–244 A number of additional posttranslational modifications241,244,245 also contribute to the Tp53-mediated DNA damage response regulatory network. Overall, stabilization of Tp53 followed by higher CDKN1A expression results in the accumulation of hypophosphorylated pRb and prevents transition into S phase.
The Tp53 gene is located on human chromosome 17p13.1 and consists of 11 exons that encode a 393 amino acid 53-kDa protein.241 The Tp53 protein includes a number of functional domains involved in transactivation, DNA binding (both Tp53-consensus sequences and damaged DNA sequences), oligomerization (tetramerization), and regulation of protein function and cellular distribution. Over 20,000 mutations have been identified in Tp53 in the majority of human cancer types, 80% of which occur in the DNA binding domain and result in loss of the Tp53-DNA major and minor groove contacts (per the International Agency for Research on Cancer who maintains an extensive Tp53 mutation database at http://www-p53.iarc.fr [release 13, November 2008]246). The functionality of wild-type Tp53 protein can be affected by either loss of both wild-type alleles (such as the loss-of-heterozygosity [LOH] observed in tumor cells from Li-Fraumeni syndrome patients) or the mutation of the wild-type allele. Mutant Tp53 alleles can sometimes result in the expression of mutant Tp53 protein with potentially deregulated activity; loss-of-function mutations in certain domains resulting in a dominant-negative effect; or gain-of-function mutations endowing novel protein function, altered protein–protein interactions or subcellular localization.241
The effect on Tp53 mutations on cellular radiosensitivity is not completely clear, but an increasing body of evidence suggests that Tp53 mutation generally results in increased radioresistance.233,234,247 The radioresistant phenotype was first observed in fibroblasts derived from patients with Li-Fraumeni syndrome, a rare autosomal dominant syndrome caused by Tp53 heterozygosity and characterized by soft tissue sarcomas appearing in infancy or childhood and a high incidence of familial clustering of early-onset (<45 years) sarcomas, breast cancers, brain tumors, and adrenocortical carcinomas.248–250 The list of radioresistant Tp53-mutant or deficient cells has grown to include a large number of human and rodent normal cell types infected with viruses that inactivate Tp53 function, transformed cells, and tumor cells.124,233,234,251 Many studies examining the correlation of Tp53 mutation in human tumors and the efficacy of radiotherapy have reported decreased local control of tumors harboring mutations in Tp53,233,234,247 a testament to the critical cellular functions that this protein mediates.
Retinoblastoma protein-mediated pathways play critical roles in regulating properly timed cell cycle transitions, most notably the G1 to S phase transition; differentiation programs by inducing tissue-specific gene expression and permanent withdrawal from the cell cycle; and they participate in Tp53-mediated apoptotic responses after DNA damage.252–254 As such, the Rb1 locus also presents an attractive target for deregulation as evidenced by the gene’s mutation in ∼80% of sporadic human cancers.255 Oncoproteins encoded by various DNA tumor viruses target pRb and disrupt its function, and have proven to be invaluable tools in the study of the mechanisms of oncogenic transformation.252 Amplification of the cyclin-dependent kinase genes CDK4 and CDK6 or their cyclin partners CCND1–3 (cyclin D1–D3), or loss of CDKN2A (p16Ink4a), a specific CDK4/6 inhibitor, through direct deletion or by promoter silencing provide yet other routes of pRb pathway disruption.253,256,257
The 4.7-kb mRNA transcript of the Rb1 gene encodes a 110-kDa nuclear phosphoprotein composed of 928 amino acids denoted pRb.258 The pRb protein is a member of the so-called pocket protein family that also includes the proteins p107 and p130. The primary function of these pocket proteins is to bind these E2F/DP1 transcription factor family members in transcriptional repressor complexes.259–262 A direct role for E2F-1 in DNA repair is also becoming apparent.261,262 The activity of the pRb protein is controlled by its phosphorylation status, which provides a sensitive regulatory mechanism for the G1 to S-phase transition.263 The active form of pRb is hypophosphorylated and functions in the early G1-phase to bind members of the E2F/DP1 transcription factor family and a multitude of other interacting proteins. This prevents the premature transcription of E2F target genes involved in the onset of S phase and the initiation of DNA synthesis.264 The DP1 and DP2 proteins function as transcriptional repressors, providing the basis of an autoregulatory loop that eventually halts transcription of the E2F-responsive genes as cells complete DNA synthesis and prepare to enter G2 phase. Essentially all pRb-associated interacting proteins fail to bind hyperphosphorylated pRb, and phosphorylation site mutants of pRb are potent inhibitors of cell cycle progression and transcription in virtually all cell types studied.252 Rb1 heterozygosity is not clearly associated with obvious changes in radiosensitivity in vitro38,265; homozygous deletion of Rb1 in mice is an embryonic lethal condition.266–268
Mitotic Catastrophe
Mitotic catastrophe results from aberrant mitosis and can produce giant, multinucleated aneuploid cells that remain metabolically active. Mitotic catastrophe is associated with deficiencies of the G2 and mitotic spindle checkpoints that function to limit the abnormal division of cells with damaged DNA and chromosomes.195,196,269 Efficient regulation of the G2 and mitotic phase transitions ensures that cells have completely and accurately duplicated their genome and other essential cellular components (required proteins and organelles, etc.) for partitioning into daughter cells. Radiation exposure in the G2-phase of the cell cycle engages a checkpoint to delay mitosis and induce repair processes to administer to defects in the DNA, chromosomes and spindle apparatus.270–272 Certain forms of DNA damage, such as base/nucleotide damage and inter/intrastrand crosslinks, may fail to elicit a G2-phase checkpoint delay and may instead induce an S-phase checkpoint delay in the following cell cycle when lesions are encountered by the DNA replication machinery.273,274 Chemical treatments that do not induce prompt DSBs, e.g., camptothecin (a topoisomerase-I inhibitor), and sublethal fluences of UV-C radiation are not effective at inducing G2-phase delay, however treatment with etoposide, bleomycins, and topoisomerase-II inhibitors that do produce DSBs are effective at inducing a dose-dependent G2 delay.275
The primary regulator of the G2 phase transition is the maturation-promoting factor (MPF), a complex composed of the CDK1 kinase and cyclin B1. The activity of this kinase complex is controlled by levels of cyclin B1 and cyclin A, another competing CDK1 partner and the phosphorylation status of CDK1.276,277 To initiate passage into mitosis, the CDC25C phosphatase must dephosphorylate inhibitory CDK1 phosphorylations for full activation of the complex. Substrates of the activated MPF kinase include histones, nuclear lamins, cytoskeletal intermediate filaments and microtubule-associated proteins, and other structural proteins necessary for nuclear envelope breakdown and chromosome alignment.278 As the cell progresses through mitosis, MPF also activates the anaphase promoting complex (APC/CCdc20) or cyclosome, whose E3-like ubiquitin ligase function is necessary for chromatid separation at anaphase and proper orchestration of the final stages of mitosis.279,280
The PIKKs ATM and ATR (ATM/Rad3-related) provide alternative, and partially overlapping, pathways for G2-phase delay.243,270 ATM (with the assistance of BRCA1) and ATR phosphorylate and activate the protein kinases CHK2 and CHK1, respectively, and both these downstream kinases phosphorylate CDC25C.281–284 This inhibitory phosphorylation promotes the sequestration of CDC25C by the 14-3-3 proteins and its export out of the nucleus, displacing CDC25C from the site of its activity.283,284 CHK1 has also been shown to phosphorylate WEE1/MYT1 after irradiation, promoting the inhibitory phosphorylation of CDK1.276 The timing of these two complementary pathways is illustrated in Xu et al. in which cells irradiated in G2 were first delayed in an ATM-dependent, but dose-independent, manner from entering mitosis.285 Cells in late S/early G2-phase at the time of irradiation were later delayed at the G2-M transition point in an ATM-independent, but now dose-dependent, manner by the parallel ATR-mediated pathway (see also DeSimone et al.243). In addition to the ATM-CHK2-CDC25C damage response pathway, ATM also functions to phosphorylate and stabilize Tp53, providing another route to G2-phase delay through CDKN1A induction.92,243,270,286
Originally, A-T cells were thought to experience a much-shortened G2-phase delay.271,287,288 Experiments using tritiated thymidine or BrdU-labeling and flow cytometry techniques later revealed that ATM-deficient cells, following an initial failure to block late G2-phase cells from entering mitosis, later experience a second and considerably longer G2-phase delay in the proportion of late-S/early-G2 cells.272,289–291 presumably mediated through this redundant ATR-mediated mechanism. The timing of these two events may underlie the argument of an abrogated or extended G2-phase delay in A-T cells, depending on the exact experimental conditions used to measure the delay. Cre-mediated deletion of a floxed (flanked by lox sites) ATR gene in human cells or siRNA knockdown of the ATR-interacting protein (ATRIP) abrogates IR-induced G2-phase delay and causes cell death.292 This implies an essential role for the ATR–CHK1–Cdc25C pathway in maintenance of the G2-phase delay, perhaps in temporal continuation of its role as the cardinal mediator of the replication and intra-S phase checkpoints.293
Cells that experience a G2-phase delay may eventually enter into mitosis after moderate doses of DNA damage before repair is complete, a phenomenon known as adaptation.274 Often such cells will fail in critical stages of mitosis and suffer mitotic catastrophe, most notably the final stage of karyokinesis (nuclear cleavage) and cytokinesis (cellular cleavage) which results in giant cells reforming a single nuclear envelope with tetraploid DNA content and double the normal G1 chromosome number.294 Agents that interfere with the mechanisms of the G2-phase delay, such as caffeine and okadaic acid, increase the radiosensitivity of treated cells.295 Caffeine, originally thought to target the ATM and ATR kinases, more probably inhibits an as-yet-unidentified HRR protein.296,297 Cortez demonstrated caffeine treatment results in hyperphosphorylation of the ATM and ATR kinases and their downstream kinase effectors, CHK1 and CHK2.298 Interestingly, caffeine was shown to be ineffective in reducing radiation-induced G2-phase delay in normal human fibroblasts, in sharp contrast to human tumor cell lines.299,300 These findings suggest possible redundant (and apparently caffeine-insensitive) pathways of G2-phase delay induction in normal cells and disruption of these pathways in tumor cells.243
Cells irradiated directly in mitosis may suffer a mitotic checkpoint delay if damage is induced before the metaphase-anaphase transition point.301 A spindle-assembly checkpoint is engaged if chromosomes are not properly aligned on the metaphase plate because of disruption of chromosome or mitotic spindle integrity (e.g., through the use of the spindle “poisons”), insufficient spindle tension and attachment to the centromeric kinetochore protein complexes, or absence of proper kinetochore function.196,274 The progress of mitotic spindle formation also feeds into Tp53 regulatory pathways through the casein kinases,302,303 which are required for the faithful segregation of chromosomes and are intimately associated with microtubules and centrosomes. Mitotic spindle proteins, such as the MAD2 and BUB1/BUBR1 proteins, and chromosomal passenger proteins, such as Survivin and the Aurora kinases, likewise monitor the integrity of the mitotic spindle and can signal for mitotic checkpoint arrest.195,196,279,304,305
Similar to the G2-M checkpoint, cells can undergo anaphase checkpoint adaptation, a process known as mitotic slippage, and enter into anaphase prematurely with damaged or misaligned chromosomes.195,196 Damage induced after the anaphase transition is insufficient to induce a mitotic checkpoint delay, and cells complete cytokinesis and karyokinesis unimpeded.301,306 While IR exposure during mitosis may engage the mitotic checkpoint if cells are irradiated in early prophase, few if any chromosome aberrations are seen in the irradiated mitotic cells at that time.307 This is likely due to the fact that the mitotic chromosomes are highly condensed and compacted (i.e., DSBs remain tightly bound in this chromatin state). The high degree of chromatin compaction in mitotic cells results in significantly higher rates of DNA single- and double-strand break induction, which underlies the increased radiosensitivity of mitotic cells compared to G1-phase cells.109,308–310 An additional Tp53 and CDKN1A-dependent checkpoint at the following G1–S checkpoint, the tetraploidy checkpoint, is thought to exist to prevent such cells from undertaking an additional round of DNA replication.274,311,312 Tetraploid fibroblasts may form metabolically active giant cells that may remain viable in the culture for up to a week,22 but engagement of this checkpoint in lymphoblasts usually results in apoptosis. However, as with the G2-M and anaphase checkpoints, this tetraploidy checkpoint is also capable of becoming adapted, especially in Rb1−/− and Tp53−/− mutant cells.274,294,311–313 Tetraploid cells in general are no more radiosensitive than their euploid counterparts; although burdened with twice the load of aberrations per unit IR dose, they are likely better able to tolerate otherwise lethal chromosome fragment losses due to the redundancy of essential genes.200,314
Tumor cells that survive an abnormal mitosis and undergo asymmetrical cell division may generate genomically unstable aneuploid cells that may be potentially more tumorigenic,195,196 Higher levels of persistent DNA damage in these cells also may contribute to further genomic instability.315,316 Mitotic catastrophe provides a means to halt the further division of such cells and importantly, evidence of IR-induced mitotic catastrophe has been observed in irradiated solid tumors.247,317 Studies have also shown that cells undergoing mitotic catastrophe may subsequently die by apoptosis and mitotic cell death, suggesting that mitotic catastrophe may not be a specific cell death program but precedes other modes of cell death.195,318 Proteins such as Survivin present attractive targets for therapeutic modulation since its deficiency induces mitotic catastrophe in both BCL-2 and Tp53-dependent and independent manners.318–320 Targeting Survivin and other G2-M and spindle checkpoint pathways that increase cell death by mitotic catastrophe, in combination with treatments that promote apoptosis and other types of cell death, could dramatically improve therapeutic gain after IR or anticancer drug treatment in solid tumors.320
Apoptosis
Apoptosis is a well-defined form of programmed cell death (type I)—a tightly regulated ATP- and Tp53-dependent process that targets individual cells for complete disintegration while preventing tissue inflammatory responses.317,321,322 Apoptosis is critical to the development and maintenance of proper tissue homeostasis, by balancing mitotic cell proliferation and by limiting the growth and clearing damaged or unwanted cells. Apoptosis is a mode of early cell death observed in cells exposed to IR or anticancer drugs, and can sometimes be a useful prognostic indicator of tumor response after treatment. It has been suggested that resistance to apoptosis may play a more critical role in the etiology and treatment of hematological malignancies, compared to solid tumors.317 Evasion of the apoptotic program is considered one of the cardinal features of tumor cells,315 and acquired resistance to apoptosis in tumor cells during cancer therapy because of mutation of Tp53, loss or defects in proapoptotic proteins, or overexpression of antiapoptotic proteins is generally associated with poorer prognosis247,317
Apoptotic cells are characterized by cell membrane blebbing, cytoplasmic and nuclear condensation and fragmentation, and nuclear pyknosis, phenotypes easily detectable by several in vitro and in vivo assays.317,321,322 One of the initial characteristic effects of apoptosis is cellular dehydration resulting in cytoplasmic shrinkage. Membrane and organelle integrity remains mostly intact in the initial phases of apoptosis, other than depolarization of mitochondria. Mitochondria also cluster around the nucleus,323 possibly providing additional energy for subsequent chromosome condensation and cleavage of DNA into a characteristic 200-bp DNA ladder of nucleosomal fragments. Finally, the nucleus and cytosol fragment into membrane-bound apoptotic bodies that are phagocytosed by surrounding cells and macrophages, preventing an inflammatory response commonly seen during “accidental” cell death, or necrosis. Several laboratory assays for detecting apoptotic cells are available including gel electrophoresis methods to detect apoptotic DNA laddering; terminal deoxynucleotidyl transferase dUTP nick end labeling (TUNEL) to label DNA strand breaks; flow cytometry (FACS) analysis of DNA content or caspase-3 and annexin V–stained cells (annexin V binds phosphatidylserine exposed on the outer membrane after leaflet switching); and various light and electron microscopy methods. Several in vivo methods for detecting apoptosis are currently available or in development, and include the use of 99mTc-radiolabeled annexin V, imaging, scintigraphy (TAVS), and caspase cleavage assays.324,325
At least two distinct molecular pathways for the initiation of apoptosis after IR exposure have been identified.317,321,322 Both these pathways converge in the activation of caspase executioner cascades by several mitochondria-dependent and independent pathways to complete the cell death program. The first apoptosis signaling pathway, the extrinsic pathway, is initiated by the sensing of membrane damage, which results in: (1) the activation of membrane death receptors, such as Fas, tumor necrosis factor (TNF), and the TNF-related apoptosis-inducing ligand (TRAIL) receptors; and (2) the generation of ceramide.326 The second apoptosis signaling pathway, the intrinsic pathway, is an intracellular pathway that can be initiated by growth factor withdrawal, oncogene activation, or the sensing of oxidative or IR-induced DNA damage. DNA damage signaling results in Tp53 stabilization/activation and the expression of a number of Tp53-inducible genes, including the genes encoding several members of the Bcl-2/Bax family,327–329 the death receptors,328,330,331 and many others.332 Tp53 also functions to repress the expression of the antiapoptotic protein Bcl-2.327,329
IR exposure induces activation of Fas, TNF and TRAIL receptor-mediated signaling pathways at the cell membrane that is indistinguishable from ligand binding. This then results in the PKCδ-mediated phosphorylation and activation of acid sphingomyelinase (ASMase).333 which subsequently cleaves sphingomyelin in the membrane to form the potent second messenger, ceramide.326 Ceramide promotes the activation of the RAS and JNK/SAPK stress pathways that results in c-jun activation and further cytokine (Fas-ligand, TNFα, TRAIL) production, producing an autoregulatory feedback loop. Ceramide also inhibits the PLCγ/PI3K growth pathway signaling. These receptors also stimulate caspase-8 and caspase-10 activation through the recruitment of FADD (Fas-associated death domain) and TRADD (TNFR-associated death domain) adaptor molecules, and the formation of death-inducing signaling complexes (DISC).334 These caspases also function to proteolytically cleave and activate downstream caspases and the protein Bid, whose proapoptotic C-terminal fragment tBid translocates to mitochondria and activates the proapoptotic Bax.335 Activation of the death receptors also prompts the dephosphorylation of the proapoptotic protein Bad by Ca2+-dependent calcineurin336 or the protein phosphatases PP1 and PP2A,337 and inhibits AKT/MAPK-mediated phosphorylation of Bad.338 This allows Bad to translocate from the cytosol to the mitochondria and counter the inhibitory effects of the antiapoptotic protein complexes located there.
The members of the Bcl-2/Bax family represent both proapoptotic and antiapoptotic proteins with at least one of the four conserved Bcl-2 homology domains (BH1-BH4) that tightly regulate the release of cytochrome c from mitochondria.329,339 They are divided into three groups, and include both cytoplasmic and mitochondrial and ER/nuclear membrane-bound proteins. The first group includes membrane-bound members that inhibit apoptosis and contain BH1-4 domains, such as Bcl-2, Bcl-xL, Bcl-w, and Mcl-1. The second group consists of the proapoptotic proteins Bax and Bak, predominantly membrane-bound proteins with BH1-BH3 domains. The final group consists of cytoplasmic apoptosis promoters, such as Bid, Bim, Bad, Noxa and Puma that contain the BH3 domain only and activate Bax and Bak. The stoichiometry of these family members dictates the mitochondrial response. If sufficient numbers of proapoptotic members can escape inhibition by antiapoptotic members, Bax and Bak can oligomerize to form membrane channels and interact with the voltage-dependent anion channel (VDAC) and the adenine nucleotide transporter (ANT) to open a permeability transition pore (PTP) resulting in cytochrome c release from the mitochondria, activation of the caspase cascade, and the eventual depolarization of the mitochondria as an influx of water bursts the outer mitochondrial membrane.340,341 This releases additional cytochrome c, ROS/RNS, and ions from the intermembrane space, along with several procaspases (2, 3, and 9) and members of the inhibitor of apoptosis (IAP) family of caspase inhibitors.342 These IAP proteins are themselves inhibited by proteins such as Smac/DIABLO343,344 and Omi/Htra2.345 which thus promotes caspase activation and apoptosis.
As the primary executioners of the apoptotic program, the cysteinyl aspartate–specific proteinases or caspases irreversibly cleave a number of key substrates within the cell.346,347 Caspases are manufactured in a procaspase form whose activation requires removal of the pro domain and subsequent dimerization. Initially, caspases-8 and 10 are activated by trimerization of the death receptors and they function primarily to activate downstream caspases and liberation of further cytochrome c from mitochondria. Cytosolic cytochrome c results in the formation of the apoptosome—a complex formed by procaspase-9 and an adaptor molecule Apaf-1. Upon cytochrome c and dATP binding, Apaf-1 releases the apoptosome complex from its regulator Bcl-2 and caspase-9 is activated by autocatalytic cleavage or cleavage by other caspases, such as caspase-8.348 As downstream executioner caspases (caspases-3, 4, 6, 7) are activated, at least 100 documented cytoplasmic and nuclear targets are cleaved. Activation of caspase-activated DNAse (DFF40/CAD) and endonuclease G is responsible for the characteristic 200-bp ladder observed in apoptotic cells.349 Other caspase substrates include structural proteins, signaling proteins, and various DNA repair, replication, and transcription proteins. The ultimate result of the caspase cascade is evident morphologically as the cell blebs its contents into apoptotic bodies characterized by the exposure of phosphatidylserine on their outer membrane (a result of membrane leaflet switching) and is subsequently phagocytosed by neighboring cells or macrophages.
The time-course of IR-induced apoptosis in vitro and in vivo is illustrated in Fig. 1-11 (from Dewey et al.350 with data from Olive et al.351 and Stephens et al.352 The upper 4 and 7.5 Gy curves represent the apoptotic responses of TK6 lymphoblastoid cells in culture, which both reach a peak and plateau at approximately 20 hours.351 The lower 2.5 and 25 Gy curves represent the apoptotic responses of OCa-I murine ovarian carcinoma cells in vivo352; in this case, the peak apoptotic response is observed approximately 3 to 5 hours after irradiation, presumably because of clearance of apoptotic cells by neighboring cells and the immune system. In Fig. 1-12A (also from Dewey et al.350 with data from Olive et al.351), the dose response for the induction of apoptosis 24 to 36 hours following irradiation in TK6 cells, as measured by the single-cell Comet assay, shows a relatively linear response below 5 to 7 Gy followed by a plateau of ∼90% for 10 to 15 Gy (suggesting that ∼10% of cells were resistant to apoptosis even at these doses). Also shown is the apoptotic fraction (AP) of ∼3% for apoptosis-resistant Tp53-deficient CHO cells following 15 Gy. Using the same data set, Fig. 1-12B demonstrates the relative contribution of apoptosis to overall cell killing. The rightmost curve 100–AP is the dose response for the percentage of cells surviving apoptosis derived from A, and the dashed curve Sa × 100 is the calculated survival of the remaining apoptosis-susceptible cells.350 Compared to the measured clonogenic survival of TK6 cells from this study, line S × 100, it is evident that only a small fraction of the reduction in overall proliferative capacity of these cultures was due to apoptosis. A subsequent report by Schwartz et al. reported an identical dose response for apoptosis induction in TK6 cells (and minimal apoptosis in Tp53-mutant WI-L2-NS cells, a closely related line derived from the same individual), and also reported chromosome aberration frequencies that correlated significantly with overall cell killing in these lines.353 Collectively these results suggest that although apoptosis is an important early cellular response to IR, it likely contributes only a small fraction to overall cell killing compared to mitotic linked death, even in apoptosis-susceptible cells.350
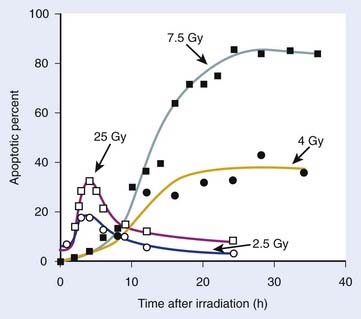
FIGURE 1-11 • Percent of apoptotic cells in vitro and in vivo plotted against time after irradiation. Solid symbols are for TK6 human lymphoblastoid cells in vitro assayed by the Comet assay. Open symbols are for the murine ovarian carcinoma (OCa-I) in vivo. The assay of the number of apoptotic bodies per 100 OCa-I cells was performed by microscopic examination of H&E-stained sections.352
(Data from Olive PL, Frazer G, and Banath JP: Radiation-induced apoptosis measured in TK6 human B lymphoblast cells using the comet assay, Radiat Res 136:130–136, 1993; Stephens LC, Hunter NR, Ang KK, et al: Development of apoptosis in irradiated murine tumors as a function of time and dose, Radiat Res 135:75,80, 1993; Dewey WC, Ling CC, and Meyn RE: Radiation-induced apoptosis: relevance to radiotherapy, Int J Radiat Oncol Biol Phys 33:781–796, 1995.)
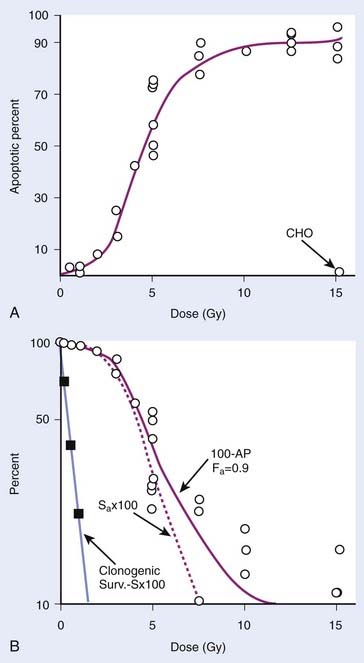
FIGURE 1-12 • A, Percentage of apoptotic cells (AP) plotted against dose for in vitro TK6 lymphoblastoid cells scored 24 to 36 hours after irradiation, as shown in Fig. 1-11. For comparison, data are shown for apoptosis-resistant Tp53-defective CHO cells that were treated identically.351 B, Data in A were converted into the percent of the total population that survived apoptosis, 100–AP, and the survival curve for the remaining apoptosis-susceptible cells Sa × 100 was calculated by Dewey et al.350 The actual clonogenic survival curve obtained for TK6 cells,351 labeled S × 100, is also shown. It can be seen from comparing the Sa and S curves that the overall loss of proliferative capacity following irradiation due to apoptosis only contributes a small portion to killing in these cells.350
(From Dewey WC, Ling CC, and Meyn RE: Radiation-induced apoptosis: relevance to radiotherapy, Int J Radiat Oncol Biol Phys 33:781–796, 1995.)
Increasing evidence suggests that stereotactic body radiation therapy (SBRT) regimens of a single or few multiple high-dose IR fractions may exploit the apoptotic response of endothelial cells of the tumor vasculature354 to achieve a higher therapeutic ratio than would be calculated from tumor cell survival parameters alone.42 The success of SBRT stems from recent advances in high-resolution image guidance and high-precision beam delivery technologies to accurately target and treat the tumor volume, while limiting exposure to surrounding normal tissues.41 As recently discussed by Brown and Koong, although the benefits of the four R’s that apply to fractionated RT regimens are not as relevant for single dose SBRT exposures, it has nevertheless been shown to result in very attractive responses in several tumor types (see Brown and Koong42 and references therein). Although standard RT doses of ∼2 Gy do not result in significant endothelial cell apoptosis in the tumor vasculature and thus normally does not contribute greatly to tumor control, Garcia-Barros et al. demonstrated that this response becomes important for doses of 8 to 10 Gy and higher (doses typical of SBRT).354 In this study, 15 to 20 Gy treatments of xenografted MCA/129 sarcomas and B16F1 melanomas resulted in significant microvasculature apoptosis and tumor control in wild-type mice, but these responses were not observed in apoptosis-resistant Bax−/− or asmase−/− knockout mice. These results suggest that chemical agents that promote endothelial cell apoptosis may result in even higher therapeutic gain if given in conjunction with SBRT.
Autophagy and Autophagic Cell Death
Autophagic cell death is another programmed cell death mechanism (type II) distinct from apoptosis that is induced by hypoxia, glucose deprivation, and other conditions routinely encountered in the tumor microenvironment.321,355,356 Autophagy is defined as the turnover and catabolic degradation of proteins and organelles in lysosomal vesicles and is thought to be a method for cells to shift intracellular nutrient allocation (e.g., amino acids) to support essential metabolic activities. However, cells may not specifically undergo autophagic cell death after anticancer treatments, but rather use autophagy as a prosurvival mechanism to recycle damaged organelles or increase intracellular nutrient availability to support renewed tumor cell proliferation. Cells die from autophagic cell death when the balance of protein degradation via autophagy exceeds protein synthesis.357 Like apoptosis, autophagic cell death is an ATP-dependent process that does not generate an inflammatory response, but unlike apoptosis, it is generally considered a late response following IR and anticancer drug treatment.322 Apoptosis and autophagic cell death are not mutually exclusive modes of cell death, as evidence of both has been observed in the same tissue and even in the same cells.356,358
Autophagy begins with the formation of the autophagosome, a double membrane-bound vesicle that engulfs portions of the cytosol and organelles and subsequently matures upon fusion with lysosomes and other endolytic cell vesicles to form an autolysosome.321,355–357,359 Levels of autophagy in tumor cells tend to be correlated with the stages of tumor progression. Kondo et al. (2005) has suggested that inhibition of autophagy in early stage tumors experiencing high levels of cell proliferation would facilitate tumor growth by reducing the rate of protein degradation and promote the accumulation of genotoxic ROS/RNS and further genomic instability.356 Levels of autophagy may increase in later stages of tumor progression in poorly vascularized portions of tumors experiencing nutrient deprivation and hypoxia. Several types of cancer cell lines including breast and colon cancer, melanoma, hepatoma, and malignant glioma cells undergo autophagy following nutrient deprivation (see Kondo et al.356 and references therein).
Although the molecular mechanisms of autophagy are not as well defined as those mediating apoptosis, genetic analysis has identified more than 30 genes in yeast and several corresponding mammalian homologues.321,355,356 These genes encode autophagy-associated (Atg) proteins that mediate two main pathways for autophagosome formation, and membrane-based signaling by both Class 1 and 3 PI3Ks has been shown to play a prominent role in both pathways.359 Cellular components targeted for degradation by the lysosomal hydrolases of the autolysosome are first tagged with the ubiquitin-like conjugates Atg12 and Atg8/LC3 (microtubule-associated protein 1 light chain 3).359,360 In one pathway, signaling by Class 1 PI3Ks activates an AKT-PKB-mTOR signaling cascade361 that serves to inhibit autophagy. The AKT/PKB pathway is down regulated via dephosphorylation by the PTEN/MMAC1 phosphatase,362 overexpression of which enhances autophagy.363 In the second pathway, signaling by Class 3 PI3Ks, which promote trafficking of lysosomal enzymes from the trans-Golgi network to the lysosome, stimulates autophagy by regulating autophagosome formation.364
Cells undergoing autophagic cell death can be identified by the presence of autophagic vacuoles (AVs, alternatively termed acidic vesicular organelles or AVOs) and enlargement and degradation of the endoplasmic reticulum (ER) and Golgi apparatus. The identification of autophagic cells in the laboratory is currently more difficult than identifying apoptotic cells, and is at present limited to in vitro or ex vivo samples. Autophagic cells can be identified by transmission electron microscopy,358 a time-consuming technique that requires a highly trained and skilled microscopist, although more rapid in vitro and in vivo biochemical and immunohistochemical methods are being introduced.324,356 Caspases are not activated during autophagic cell death, unlike apoptosis, and the characteristic 200-bp ladder and nuclear fragmentation are also not observed. Immunohistochemical staining using antibodies against the LC3 protein and green fluorescent protein (GFP)-tagged LC3 constructs have been developed to monitor autophagosomes in vitro and in vivo.324,356
In a report by Paglin et al.,365 5 to 15 Gy IR exposures of MCF-7 breast cancer cells, LNCaP prostate carcinoma cells, and LoVo colon adenocarcinoma cells induced autophagy in vitro. In the same study, inhibition of autophagy using the H+-ATPase inhibitor bafilomycin A1 in MCF-7 cells, which may prevent the fusion of autophagosomes and lysosomes, resulted in increased apoptosis.365 Inhibition of autophagy by treatment of MDA-MB-231 and MCF-7 breast cancer cells with RAD001 (everolimus, a rapamycin analog) resulted in radiosensitization and significantly increased levels of apoptosis in 3 Gy-exposed samples, as measured by a caspase-3 cleavage assay.366 Similar results were observed in DU145 and PTEN-deficient PC-3 prostate cancer cells treated with RAD001.367 Doses of 2 Gy induced autophagic cell death and mTOR-dependent phosphorylation of p70S6K, a molecular marker for autophagy induction, in DNA-PK-deficient M059J malignant glioma cells, but not in DNA-PK-expressing M059K cells, suggesting crosstalk between NHEJ, the PI3K-AKT-mTOR signaling pathway, and autophagy mediators.368 Several anticancer drugs have been shown to induce autophagy without inducing apoptosis in tumor cell lines, including staurosporine, TNFα, and tamoxifen treatments in MCF-7 cells.369–371
Human tumor samples and cell lines have been documented with mutations in autophagy-related signaling pathways.361,362,372 For example, haploinsufficiency (allelic deletion) of the beclin gene BECN1 on chromosome 17q21 has been documented in several breast cancer cell lines and tumor samples372 and also in ovarian and prostate tumors.356 Transfection of BECN1-expressing constructs into MCF-7 breast cancer cells resulted in increased autophagy and decreased tumorigenicity in nude mice.372 In addition, overexpression of beclin in MCF-7 cells lowers the incidence of tumor formation in nude mouse xenografts.372 Heterozygous BECN1+/− mice show an increased incidence of lung cancer, hepatocellular carcinoma, and lymphoma,373,374 suggesting that Beclin1 functions as a dosage-dependent tumor suppressor. Beclin was initially identified as a Bcl-2-interacting protein, which suggests the likelihood of molecular crosstalk between the apoptotic and autophagic cell death pathways. While much work remains to be done to better understand the role of autophagy and autophagic cell death in tumor progression and cell survival following IR or chemotherapeutic agent treatment, future targeted drugs or synthetic lethal gene therapy approaches may be especially useful for tumors that have acquired resistance to antiapoptotic drugs.375
Necrosis
Compared to apoptosis, necrosis (type III cell death) is considered a mode of unprogrammed or “accidental” cell death generated by tissue trauma and can provoke an inflammatory response. Necrosis is an ATP-independent cell death mechanism characterized by osmotic swelling of cell membranes and organelles and is observed after high doses of IR and anticancer drugs.321,322 While nuclear fragmentation is also observed in necrotic cells, its random nature results in a smear of DNA using gel electrophoresis compared to the typical CAD-mediated 200-bp ladder seen in apoptotic cells. Following the loss of membrane integrity, the release of intracellular contents from necrotic cells can provoke a tissue inflammatory response.
Necrosis can be induced through Fas ligand and TNFα-mediated activation of the membrane-bound death receptors, suggesting that necrosis may not necessarily be an uncontrolled event.376 The activity of the RIP1 (receptor-interacting protein 1) kinase can modulate the induction of necrosis after Fas ligand treatment in Jurkat cells.377 Single-stranded DNA damage induced by IR, higher RIP1-mediated mitochondrial ROS/RNS output, or treatment with DNA alkylating agents that is sensed by the DNA repair protein poly-ADP ribose polymerase 1 (PARP-1) may also activate necrosis.378,379 PARP-1 has been shown to induce translocation of the apoptosis-inducing factor (AIF) protein from the mitochondria to the cell nucleus and promote caspase-independent cell death.380
The extent of the role of necrosis in tumorigenesis and in local tumor control after IR or anticancer drug treatments remains to be identified, but it remains an attractive target since necrotic tumor cells may stimulate an antitumor immune response.381 Much of the difficulty in establishing a role for necrosis in tumor treatment is a lack of specific markers or experimental methods that specifically induce necrosis in vitro and in vivo, without likewise inducing alternative modes of cell death. Screening for caspase-cleaved (apoptotic) or uncleaved (necrotic/nonapoptotic) forms of cytokeratin-18 (CK18) in patient serum samples has allowed some discrimination of the relative contributions of these modes of cell death after treatment,382 although prognostic value of this assay for radiotherapy remains unclear.383 The relative role of necrosis in tumor control following RT remains to be determined, but it is clear that some degree of necrotic cell death likely occurs after IR exposure, especially after high dose per fraction regimens such as SBRT.
1 Hall E, Giaccia A: Radiobiology for the radiologist, Philadelphia, 2006, Lippincott Williams & Wilkins.
2 Ward JF. Complexity of damage produced by ionizing radiation. Cold Spring Harb Symp Quant Biol. 2000;65:377-382.
3 Quastler H. The nature of intestinal radiation death. Radiat Res. 1956;4:303-320.
4 Bergonie J, Tribondeau L. Intrepretation de quelques resultats de la radiotherapie et essai de fixation d’une technique rationnelle. Compt Rend Acad Sci. 1906;143:983-985.
5 Cole A, Humphrey RM, Dewey WC. Low-voltage electron beam irradiation of normal and 5-bromouridine deoxyriboside-treated L-P59 mouse fibroblast cells in vitro. Nature. 1963;199:780-782.
6 Hofer KG, Harris CR, Smith JM. Radiotoxicity of intracellular 67Ga, 125I and 3H. Nuclear versus cytoplasmic radiation effects in murine L1210 leukaemia. Int J Radiat Biol Relat Stud Phys Chem Med. 1975;28:225-241.
7 Munro TR. The site of the target region for radiation-induced mitotic delay in cultured mammalian cells. Radiat Res. 1970;44:747-757.
8 Warters RL, Hofer KG. Radionuclide toxicity in cultured mammalian cells: elucidation of the primary site for radiation-induced division delay. Radiat Res. 1977;69:348-358.
9 Sedelnikova OA, Rogakou EP, Panyutin IG, et al. Quantitative detection of (125)IdU-induced DNA double-strand breaks with gamma-H2AX antibody. Radiat Res. 2002;158:486-492.
10 Yasui LS. GammaH2AX foci induced by gamma rays and 125IdU decay. Int J Radiat Biol. 2004;80:895-903.
11 Elmroth K, Stenerlow B. DNA-incorporated 125I induces more than one double-strand break per decay in mammalian cells. Radiat Res. 2005;163:369-373.
12 Dewey WC, Stone LE, Miller HH, et al. Radiosensitization with 5-bromodeoxyuridine of Chinese hamster cells x-irradiated during different phases of the cell cycle. Radiat Res. 1971;47:672-688.
13 Dewey WC, Sedita BA, Humphrey RM. Radiosensitization of X chromosome of Chinese hamster cells related to incorporation of 5-bromodeoxyuridine. Science. 1966;152:519-521.
14 Cecchini S, Girouard S, Huels MA, et al. Single-strand-specific radiosensitization of DNA by bromodeoxyuridine. Radiat Res. 2004;162:604-615.
15 Dextraze ME, Wagner JR, Hunting DJ. 5-Bromodeoxyuridine radiosensitization: conformation-dependent DNA damage. Biochemistry. 2007;46:9089-9097.
16 Thompson L, Limoli C. Origin, recognition, signaling, and repair of DNA double-strand breaks in mammalian cells. In: Caldecott KW, editor. Eukaryotic DNA Damage Surveillance and Repair. Philadelphia: Kluwer Academic/Plenum Publishers; 2004:107-145.
17 O’Driscoll M, Jeggo PA. The role of double-strand break repair—insights from human genetics. Nat Rev Genet. 2006;7:45-54.
18 Bailey SM, Bedford JS. Studies on chromosome aberration induction: what can they tell us about DNA repair? DNA Repair (Amst). 2006;5:1171-1181.
19 Helleday T, Lo J, van Gent DC, et al. DNA double-strand break repair: from mechanistic understanding to cancer treatment. DNA Repair (Amst). 2007;6:923-935.
20 Puck TT, Marcus PI. Action of x-rays on mammalian cells. J Exp Med. 1956;103:653-666.
21 Puck TT. Action of radiation on mammalian cells III. Relationship between reproductive death and induction of chromosome anomalies by x-irradiation of euploid human cells in vitro. Proc Natl Acad Sci USA. 1958;44:772-780.
22 Tolmach LJ. Growth patterns in x-irradiated HeLa cells. Ann N Y Acad Sci. 1961;95:743-757.
23 Highfield DP, Holahan EV, Holahan PK, et al. Hyperthermic survival of Chinese hamster ovary cells as a function of cellular population density at the time of plating. Radiat Res. 1984;97:139-153.
24 Sinclair WK. X-ray-induced heritable damage (small-colony formation) in cultured mammalian cells. Radiat Res. 1964;21:584-611.
25 Elkind M, Whitmore G. The Radiobiology of Cultured Mammalian Cells. New York: Gordon and Breach; 1967.
26 Marder BA, Morgan WF. Delayed chromosomal instability induced by DNA damage. Mol Cell Biol. 1993;13:6667-6677.
27 Kadhim MA, Macdonald DA, Goodhead DT, et al. Transmission of chromosomal instability after plutonium alpha-particle irradiation. Nature. 1992;355:738-740.
28 Hewitt HB, Wilson CW. A survival curve for mammalian leukaemia cells irradiated in vivo (implications for the treatment of mouse leukaemia by whole-body irradiation). Br J Cancer. 1959;13:69-75.
29 Till JE, McCulloch EA. A direct measurement of the radiation sensitivity of normal mouse bone marrow cells. Radiat Res. 1961;14:213-222.
30 Withers HR. The dose–survival relationship for irradiation of epithelial cells of mouse skin. Br J Radiol. 1967;40:187-194.
31 Withers HR, Elkind MM. Dose–survival characteristics of epithelial cells of mouse intestinal mucosa. Radiology. 1968;91:998-1000.
32 Thames HDJr, Withers R, Mason KA, et al. Dose–survival characteristics of mouse jejunal crypt cells. Int J Radiat Oncol Biol Phys. 1981;7:1591-1597.
33 Withers HR, Hunter N, Barkley HTJr, et al. Radiation survival and regeneration characteristics of spermatogenic stem cells of mouse testis. Radiat Res. 1974;57:88-103.
34 Withers HR, Mason KA, Thames HDJr. Late radiation response of kidney assayed by tubule-cell survival. Br J Radiol. 1986;59:587-595.
35 Gould MN, Clifton KH. The survival of rat mammary gland cells following irradiation in vivo under different endocrinological conditions. Int J Radiat Oncol Biol Phys. 1978;4:629-632.
36 Mulcahy RT, Gould MN, Clifton KH. The survival of thyroid cells: in vivo irradiation and in situ repair. Radiat Res. 1980;84:523-528.
37 Barcellos-Hoff MH, Park C, Wright EG. Radiation and the microenvironment—tumorigenesis and therapy. Nat Rev Cancer. 2005;5:867-875.
38 Wilson PF, Nagasawa H, Warner CL, et al. Radiation sensitivity of primary fibroblasts from hereditary retinoblastoma family members and some apparently normal controls: colony formation ability during continuous low-dose-rate gamma irradiation. Radiat Res. 2008;169:483-494.
39 Fertil B, Malaise EP. Inherent cellular radiosensitivity as a basic concept for human tumor radiotherapy. Int J Radiat Oncol Biol Phys. 1981;7:621-629.
40 Deacon J, Peckham MJ, Steel GG. The radioresponsiveness of human tumours and the initial slope of the cell survival curve. Radiother Oncol. 1984;2:317-323.
41 Chang BK, Timmerman RD. Stereotactic body radiation therapy: a comprehensive review. Am J Clin Oncol. 2007;30:637-644.
42 Brown JM, Koong AC. High-dose single-fraction radiotherapy: exploiting a new biology? Int J Radiat Oncol Biol Phys. 2008;71:324-325.
43 Joshi GP, Nelson WJ, Revell SH, et al. X-ray-induced chromosome damage in live mammalian cells, and improved measurements of its effects on their colony-forming ability. Int J Radiat Biol Relat Stud Phys Chem Med. 1982;41:161-181.
44 Dewey WC, Miller HH, Leeper DB. Chromosomal aberrations and mortality of x-irradiated mammalian cells: emphasis on repair. Proc Natl Acad Sci USA. 1971;68:667-671.
45 Dewey WC, Furman SC, Miller HH. Comparison of lethality and chromosomal damage induced by x-rays in synchronized Chinese hamster cells in vitro. Radiat Res. 1970;43:561-581.
46 Bedford JS, Mitchell JB, Griggs HG, et al. Radiation-induced cellular reproductive death and chromosome aberrations. Radiat Res. 1978;76:573-586.
47 Carrano AV. Chromosome aberrations and radiation-induced cell death. II. Predicted and observed cell survival. Mutat Res. 1973;17:355-366.
48 Cornforth MN, Bedford JS. A quantitative comparison of potentially lethal damage repair and the rejoining of interphase chromosome breaks in low passage normal human fibroblasts. Radiat Res. 1987;111:385-405.
49 Revell SH. Relationships between chromosome damage and cell death. In: Ishihara T, Sasaki MS, editors. Radiation-Induced Chromosome Damage in Man. New York: Alan R. Liss, Inc.; 1983:215-233.
50 Brown JM, Kovacs MS. Visualization of nonreciprocal chromosome exchanges in irradiated human fibroblasts by fluorescence in situ hybridization. Radiat Res. 1993;136:71-76.
51 Brown JM, Evans JW, Kovacs MS. Mechanism of chromosome exchange formation in human fibroblasts: insights from “chromosome painting.”. Environ Mol Mutagen. 1993;22:218-224.
52 Cornforth MN. Analyzing radiation-induced complex chromosome rearrangements by combinatorial painting. Radiat Res. 2001;155:643-659.
53 Savage JR. Reflections and meditations upon complex chromosomal exchanges. Mutat Res. 2002;512:93-109.
54 Dale RG. The application of the linear-quadratic dose-effect equation to fractionated and protracted radiotherapy. Br J Radiol. 1985;58:515-528.
55 Carlone M, Wilkins D, Raaphorst P. The modified linear-quadratic model of Guerrero and Li can be derived from a mechanistic basis and exhibits linear-quadratic-linear behaviour. Phys Med Biol. 2005;50:L9-13.
56 Guerrero M, Li XA. Extending the linear-quadratic model for large fraction doses pertinent to stereotactic radiotherapy. Phys Med Biol. 2004;49:4825-4835.
57 Sachs RK, Hahnfeld P, Brenner DJ. The link between low-LET dose–response relations and the underlying kinetics of damage production/repair/misrepair. Int J Radiat Biol. 1997;72:351-374.
58 Forrester HB, Radford IR. Ionizing radiation-induced chromosomal rearrangements occur in transcriptionally active regions of the genome. Int J Radiat Biol. 2004;80:757-767.
59 Bauchinger M, Gotz G. Distribution of radiation induced lesions in human chromosomes and dose-effect relation analysed with G-banding. Radiat Environ Biophys. 1979;16:355-366.
60 Winegar RA, Preston RJ. The induction of chromosome aberrations by restriction endonucleases that produce blunt-end or cohesive-end double-strand breaks. Mutat Res. 1988;197:141-149.
61 Folle GA, Obe G. Intrachromosomal localization of breakpoints induced by the restriction endonucleases AluI and BamHI in Chinese hamster ovary cells treated in S phase of the cell cycle. Int J Radiat Biol. 1996;69:447-457.
62 Folle GA, Martinez-Lopez W, Boccardo E, et al. Localization of chromosome breakpoints: implication of the chromatin structure and nuclear architecture. Mutat Res. 1998;404:17-26.
63 Martinez-Lopez M, Folle GA, Cassina G, et al. Distribution of breakpoints induced by etoposide and x-rays along the CHO X chromosome. Cytogenet Genome Res. 2004;104:182-187.
64 Yunis JJ, Kuo MT, Saunders GF. Localization of sequences specifying messenger RNA to light-staining G-bands of human chromosomes. Chromosoma. 1977;61:335-344.
65 Barrios L, Miro R, Caballin MR, et al. Cytogenetic effects of radiotherapy. Breakpoint distribution in induced chromosome aberrations. Cancer Genet Cytogenet. 1989;41:61-70.
66 Muhlmann-Diaz MC, Bedford JS. Breakage of human chromosomes 4:19 and Y in G0 cells immediately after exposure to gamma-rays. Int J Radiat Biol. 1994;65:165-173.
67 Muhlmann-Diaz MC, Bedford JS. A comparison of radiation-induced aberrations in human cells involving early and late replicating X chromosomes. In: Obe G, Natarajan AT, editors. Chromosomal Alterations: Origin and Significance. New York: Springer-Verlag; 1994:125-131.
68 Cowell IG, Sunter NJ, Singh PB, et al. GammaH2AX foci form preferentially in euchromatin after ionising-radiation. PLoS ONE. 2007;2:e1057.
69 Jacobson BS. Evidence for recovery from x-ray damage in Chlamydomonas. Radiat Res. 1957;7:394-406.
70 Elkind MM, Sutton H. X-ray damage and recovery in mammalian cells in culture. Nature. 1959;184:1293-1295.
71 Elkind MM, Sutton H. Radiation response of mammalian cells grown in culture. I. Repair of x-ray damage in surviving Chinese hamster cells. Radiat Res. 1960;13:556-593.
72 Lea D. Actions of Radiations on Living Cells. New York: Cambridge University Press; 1955.
73 Kellerer AM, Rossi HH. The theory of dual radiation action. Curr Top Radiat Res Q. 1974;8:85-158.
74 Bedford JS, Cornforth MN. Relationship between the recovery from sublethal x-ray damage and the rejoining of chromosome breaks in normal human fibroblasts. Radiat Res. 1987;111:406-423.
75 Thames HDJr, Hendry J. Fractionation in Radiotherapy. London: Taylor & Francis; 1987.
76 Lajtha LG, Oliver R. Some radiobiological considerations in radiotherapy. Br J Radiol. 1961;34:252-257.
77 Thames HDJr, Withers HR, Peters LJ, et al. Changes in early and late radiation responses with altered dose fractionation: implications for dose-survival relationships. Int J Radiat Oncol Biol Phys. 1982;8:219-226.
78 Fowler JF. The linear-quadratic formula and progress in fractionated radiotherapy. Br J Radiol. 1989;62:679-694.
79 Terasima T, Tolmach LJ. X-ray sensitivity and DNA synthesis in synchronous populations of HeLa cells. Science. 1963;140:490-492.
80 Sinclair WK, Morton RA. Variations in x-ray response during the division cycle of partially synchronized chinese hamster cells in culture. Nature. 1963;199:1158-1160.
81 Bedford JS, Mitchell JB. Dose-rate effects in synchronous mammalian cells in culture. Radiat Res. 1973;54:316-327.
82 Rothkamm K, Kruger I, Thompson LH, et al. Pathways of DNA double-strand break repair during the mammalian cell cycle. Mol Cell Biol. 2003;23:5706-5715.
83 Hinz JM, Yamada NA, Salazar EP, et al. Influence of double-strand-break repair pathways on radiosensitivity throughout the cell cycle in CHO cells. DNA Repair (Amst). 2005;4:782-792.
84 Tamulevicius P, Wang M, Iliakis G. Homology-directed repair is required for the development of radioresistance during S phase: interplay between double-strand break repair and checkpoint response. Radiat Res. 2007;167:1-11.
85 Winans LF, Dewey WC, Dettor CM. Repair of sublethal and potentially lethal x-ray damage in synchronous Chinese hamster cells. Radiat Res. 1972;52:333-351.
86 Withers HR. Four R’s of radiotherapy. In: Lett JT, Adler H, editors. Advances in radiation biology. New York: Academic Press, Inc; 1975:241-247.
87 Mitchell JB, Bedford JS. Dose-rate effects in synchronous mammalian cells in culture. II. A comparison of the life cycle of HeLa cells during continuous irradiation or multiple-dose fractionation. Radiat Res. 1977;71:547-560.
88 Mitchell JB, Bedford JS, Bailey SM. Dose-rate effects in mammalian cells in culture III. Comparison of cell killing and cell proliferation during continuous irradiation for six different cell lines. Radiat Res. 1979;79:537-551.
89 Zeman EM, Bedford JS. Changes in early and late effects with dose-per-fraction: alpha, beta, redistribution and repair. Int J Radiat Oncol Biol Phys. 1984;10:1039-1047.
90 Leeper DB, Schneiderman MH, Dewey WC. Radiation-induced cycle delay in synchronized Chinese hamster cells: comparison between DNA synthesis and division. Radiat Res. 1973;53:326-337.
91 Murnane JP, Schwartz JL. Cell checkpoint and radiosensitivity. Nature. 1993;365:22.
92 Kastan MB, Onyekwere O, Sidransky D, et al. Participation of p53 protein in the cellular response to DNA damage. Cancer Res. 1991;51:6304-6311.
93 Dewey WC, Cole A. Effects of heterogeneous populations on radiation survival curves. Nature. 1962;194:660-662.
94 Peng Y, Zhang Q, Nagasawa H, et al. Silencing expression of the catalytic subunit of DNA-dependent protein kinase by small interfering RNA sensitizes human cells for radiation-induced chromosome damage, cell killing, and mutation. Cancer Res. 2002;62:6400-6404.
95 Steel GG, McMillan TJ, Peacock KH. The 5Rs of radiobiology. Int J Radiat Biol. 1989;56:1045-1048.
96 Stapleton GE, Billen D, Hollaender A. Recovery of x-irradiated bacteria at suboptimal incubation temperatures. J Cell Physiol. 1953;41:345-357.
97 Phillips RA, Tolmach LJ. Repair of potentially lethal damage in x-irradiated HeLa cells. Radiat Res. 1966;29:413-432.
98 Belli JA, Shelton M. Potentially lethal radiation damage: repair by mammalian cells in culture. Science. 1969;165:490-492.
99 Whitmore GF, Gulyas S. Studies on recovery processes in mouse L cells. Natl Cancer Inst Monogr. 1967;24:141-156.
100 Little JB. Repair of sublethal and potentially lethal radiation damage in plateau phase cultures of human cells. Nature. 1969;224:804-806.
101 Mayne LV, Lehmann AR. Failure of RNA synthesis to recover after UV irradiation: an early defect in cells from individuals with Cockayne’s syndrome and xeroderma pigmentosum. Cancer Res. 1982;42:1473-1478.
102 Cornforth MN, Bedford JS. On the nature of a defect in cells from individuals with ataxia-telangiectasia. Science. 1985;227:1589-1591.
103 Iliakis G. Radiation-induced potentially lethal damage: DNA lesions susceptible to fixation. Int J Radiat Biol Relat Stud Phys Chem Med. 1988;53:541-584.
104 Cornforth MN, Bedford JS. Ionizing radiation damage and its early development in chromosomes. In: Lett JT, Adler H, editors. Advances in radiation biology. New York: Academic Press; 1993:423-496.
105 Dettor CM, Dewey WC, Winans LF, et al. Enhancement of x-ray damage in synchronous Chinese hamster cells by hypertonic treatments. Radiat Res. 1972;52:352-372.
106 Raaphorst GP, Dewey WC. Alterations in the radiosensitivity of CHO cells by anisotonic treatments: correlations between cell lethality and chromosomal aberrations. Radiat Res. 1979;79:403-416.
107 Sutherland BM, Bennett PV, Sidorkina O, et al. Clustered DNA damages induced in isolated DNA and in human cells by low doses of ionizing radiation. Proc Natl Acad Sci USA. 2000;97:103-108.
108 Dewey WC, Noel JS, Dettor CM. Changes in radiosensitivity and dispersion of chromatin during the cell cycle of synchronous Chinese hamster cells. Radiat Res. 1972;52:373-394.
109 Roos WP, Binder A, Bohm L. The influence of chromatin structure on initial DNA damage and radiosensitivity in CHO-K1 and xrs1 cells at low doses of irradiation 1–10 Gy. Radiat Environ Biophys.. 2002;41:199-206.
110 Malcolm AW, Little JB. Rapid recovery in plateau-phase mammalian cells. Radiat Res. 1979;80:38-48.
111 Cox R, Masson WK, Weichselbaum RR, et al. The repair of potentially lethal damage in x-irradiated cultures of normal and ataxia telangiectasia human fibroblasts. Int J Radiat Biol Relat Stud Phys Chem Med. 1981;39:357-365.
112 Thacker J, Stretch A. Recovery from lethal and mutagenic damage during postirradiation holding and low-dose-rate irradiations of cultured hamster cells. Radiat Res. 1983;96:380-392.
113 Astor MB, Morse TD. Rapid repair of potentially lethal damage in normal and ataxia telangiectasia cell lines. Int J Radiat Biol. 1989;55:631-639.
114 Nagasawa H, Chen DJ, Strniste GF. Response of x-ray-sensitive CHO mutant cells to gamma radiation. I. Effects of low dose rates and the process of repair of potentially lethal damage in G1 phase. Radiat Res. 1989;118:559-567.
115 Stackhouse MA, Bedford JS. An ionizing radiation-sensitive mutant of CHO cells: irs-20. II. Dose-rate effects and cellular recovery processes. Radiat Res. 1993;136:250-254.
116 Lobrich M, Kuhne M, Wetzel J, et al. Joining of correct and incorrect DNA double-strand break ends in normal human and ataxia telangiectasia fibroblasts. Genes Chromosomes Cancer. 2000;27:59-68.
117 Kato TA, Nagasawa H, Weil MM, et al. Levels of gamma-H2AX foci after low-dose-rate irradiation reveal a DNA DSB rejoining defect in cells from human ATM heterozygotes in two at families and in another apparently normal individual. Radiat Res. 2006;166:443-453.
118 Hall EJ, Marchese MJ, Astor MB, et al. Response of cells of human origin, normal and malignant, to acute and low dose rate irradiation. Int J Radiat Oncol Biol Phys. 1986;12:655-659.
119 Hall EJ, Marchese M, Hei TK, et al. Radiation response characteristics of human cells in vitro. Radiat Res. 1988;114:415-424.
120 Mamon HJ, Dahlberg W, Azzam EI, et al. Differing effects of breast cancer 1, early onset (BRCA1) and ataxia-telangiectasia mutated (ATM) mutations on cellular responses to ionizing radiation. Int J Radiat Biol. 2003;79:817-829.
121 Weichselbaum RR, Schmit A, Little JB. Cellular repair factors influencing radiocurability of human malignant tumours. Br J Cancer. 1982;45:10-16.
122 Schwartz JL, Jordan R, Kaufmann WK, et al. Evidence for the expression of radiation-induced potentially lethal damage being a p53-dependent process. Int J Radiat Biol. 2000;76:1037-1043.
123 Franken NA, van Bree C, ten Cate R, et al. Importance of TP53 and RB in the repair of potentially lethal damage and induction of color junctions after exposure to ionizing radiation. Radiat Res. 2002;158:707-714.
124 Alsbeih G, Torres M, Al-Harbi N, et al. Loss of wild-type Trp53 protein in mouse fibroblasts leads to increased radioresistance with consequent decrease in repair of potentially lethal damage. Radiat Res. 2004;161:185-192.
125 Dewey WC. In vitro systems: standardization of endpoints. Int J Radiat Oncol Biol Phys. 1979;5:1165-1174.
126 Brown JM, Wilson WR. Exploiting tumour hypoxia in cancer treatment. Nat Rev Cancer. 2004;4:437-447.
127 Brown JM. Tumor hypoxia in cancer therapy. Methods Enzymol. 2007;435:297-321.
128 Tatum JL, Kelloff GJ, Gillies RJ, et al. Hypoxia: importance in tumor biology, noninvasive measurement by imaging, and value of its measurement in the management of cancer therapy. Int J Radiat Biol. 2006;82:699-757.
129 Diehn M, Clarke MF. Cancer stem cells and radiotherapy: new insights into tumor radioresistance. J Natl Cancer Inst. 2006;98:1755-1757.
130 Baumann M, Krause M, Hill R. Exploring the role of cancer stem cells in radioresistance. Nat Rev Cancer. 2008;8:545-554.
131 Maisin JR. Chemical protection against ionizing radiation. Adv Space Res. 1989;9:205-212.
132 Maisin JR, Albert C, Henry A. Reduction of short-term radiation lethality by biological response modifiers given alone or in association with other chemical protectors. Radiat Res. 1993;135:332-337.
133 Raju MR. Proton radiobiology, radiosurgery and radiotherapy. Int J Radiat Biol. 1995;67:237-259.
134 Gerweck LE, Kozin SV. Relative biological effectiveness of proton beams in clinical therapy. Radiother Oncol. 1999;50:135-142.
135 Brenner DJ, Hall EJ. Secondary neutrons in clinical proton radiotherapy: a charged issue. Radiother Oncol. 2008;86:165-170.
136 Nikiforova MN, Stringer JR, Blough R, et al. Proximity of chromosomal loci that participate in radiation-induced rearrangements in human cells. Science. 2000;290:138-141.
137 Aten JA, Stap J, Krawczyk PM, et al. Dynamics of DNA double-strand breaks revealed by clustering of damaged chromosome domains. Science. 2004;303:92-95.
138 Blocher D. DNA double-strand break repair determines the RBE of alpha-particles. Int J Radiat Biol. 1988;54:761-771.
139 Rydberg B, Lobrich M, Cooper PK. Repair of clustered DNA damage caused by high LET radiation in human fibroblasts. Phys Med. 1998;14(Suppl 1):24-28.
140 Anderson RM, Marsden SJ, Wright EG, et al. Complex chromosome aberrations in peripheral blood lymphocytes as a potential biomarker of exposure to high-LET alpha-particles. Int J Radiat Biol. 2000;76:31-42.
141 Bedford JS, Goodhead DT. Breakage of human interphase chromosomes by alpha particles and x-rays. Int J Radiat Biol. 1989;55:211-216.
142 Chapman JD, Doern SD, Reuvers AP, et al. Radioprotection by DMSO of mammalian cells exposed to x-rays and to heavy charged-particle beams. Radiat Environ Biophys. 1979;16:29-41.
143 Blakely EA, Chang PY, Lommel L. Cell-cycle-dependent recovery from heavy-ion damage in G1-phase cells. Radiat Res. 1985;Suppl 8:S145-S157.
144 Afzal SM, Ainsworth EJ. Radioprotection of mouse colony forming units—spleen against heavy-charged particle damage by WR 2721. Radiat Res. 1987;109:118-126.
145 Suzuki M, Kase Y, Kanai T, et al. Change in radiosensitivity with fractionated-dose irradiation of carbon-ion beams in five different human cell lines. Int J Radiat Oncol Biol Phys. 2000;48:251-258.
146 Bennett PV, Cutter NC, Sutherland BM. Split-dose exposures versus dual ion exposure in human cell neoplastic transformation. Radiat Environ Biophys. 2007;46:119-123.
147 Vilenchik MM, Knudson AG. Endogenous DNA double-strand breaks: production, fidelity of repair, and induction of cancer. Proc Natl Acad Sci USA. 2003;100:12871-12876.
148 Jeggo PA, Lobrich M. DNA double-strand breaks: their cellular and clinical impact? Oncogene. 2007;26:7717-7719.
149 Little JB. Genomic instability and bystander effects: a historical perspective. Oncogene. 2003;22:6978-6987.
150 Morgan WF. Non-targeted and delayed effects of exposure to ionizing radiation: I. Radiation-induced genomic instability and bystander effects in vitro. Radiat Res. 2003;159:567-580.
151 Morgan WF. Non-targeted and delayed effects of exposure to ionizing radiation: II. Radiation-induced genomic instability and bystander effects in vivo, clastogenic factors and transgenerational effects. Radiat Res. 2003;159:581-596.
152 Wolff S. The adaptive response in radiobiology: evolving insights and implications. Environ Health Perspect. 1998;106(Suppl 1):277-283.
153 Marples B, Collis SJ. Low-dose hyper-radiosensitivity: past, present, and future. Int J Radiat Oncol Biol Phys. 2008;70:1310-1318.
154 Friedberg EC. A brief history of the DNA repair field. Cell Res. 2008;18:3-7.
155 Thompson LH, Rubin JS, Cleaver JE, et al. A screening method for isolating DNA repair-deficient mutants of CHO cells. Somatic Cell Genet. 1980;6:391-405.
156 Busch DB, Cleaver JE, Glaser DA. Large-scale isolation of UV-sensitive clones of CHO cells. Somatic Cell Genet. 1980;6:407-418.
157 Jeggo PA, Kemp LM, Holliday R. The application of the microbial “tooth-pick” technique to somatic cell genetics, and its use in the isolation of x-ray sensitive mutants of Chinese hamster ovary cells. Biochimie. 1982;64:713-715.
158 Stamato TD, Weinstein R, Giaccia A, et al. Isolation of cell cycle-dependent gamma ray-sensitive Chinese hamster ovary cell. Somatic Cell Genet. 1983;9:165-173.
159 Capecchi MR. Gene targeting in mice: functional analysis of the mammalian genome for the twenty-first century. Nat Rev Genet. 2005;6:507-512.
160 Santiago Y, Chan E, Liu PQ, et al. Targeted gene knockout in mammalian cells by using engineered zinc-finger nucleases. Proc Natl Acad Sci USA. 2008;105:5809-5814.
161 Gotoff SP, Amirmokri E, Liebner EJ. Ataxia telangiectasia. Neoplasia, untoward response to x-irradiation, and tuberous sclerosis. Am J Dis Child. 1967;114:617-625.
162 Taylor AM, Harnden DG, Arlett CF, et al. Ataxia telangiectasia: a human mutation with abnormal radiation sensitivity. Nature. 1975;258:427-429.
163 Lavin MF. Ataxia-telangiectasia: from a rare disorder to a paradigm for cell signalling and cancer. Nat Rev Mol Cell Biol. 2008;9:759-769.
164 Savitsky K, Bar-Shira A, Gilad S, et al. A single ataxia telangiectasia gene with a product similar to PI-3 kinase. Science. 1995;268:1749-1753.
165 Bakkenist CJ, Kastan MB. DNA damage activates ATM through intermolecular autophosphorylation and dimer dissociation. Nature. 2003;421:499-506.
166 Matsuoka S, Ballif BA, Smogorzewska A, et al. ATM and ATR substrate analysis reveals extensive protein networks responsive to DNA damage. Science. 2007;316:1160-1166.
167 Thompson D, Duedal S, Kirner J, et al. Cancer risks and mortality in heterozygous ATM mutation carriers. J Natl Cancer Inst. 2005;97:813-822.
168 Nagasawa H, Kraemer KH, Shiloh Y, et al. Detection of ataxia telangiectasia heterozygous cell lines by postirradiation cumulative labeling index: measurements with coded samples. Cancer Res. 1987;47:398-402.
169 Mitchell EL, Scott D. G2 chromosomal radiosensitivity in fibroblasts of ataxia-telangiectasia heterozygotes and a Li-Fraumeni syndrome patient with radioresistant cells. Int J Radiat Biol. 1997;72:435-438.
170 Tchirkov A, Bay JO, Pernin D, et al. Detection of heterozygous carriers of the ataxia-telangiectasia (ATM) gene by G2 phase chromosomal radiosensitivity of peripheral blood lymphocytes. Hum Genet. 1997;101:312-316.
171 Demuth I, Digweed M. The clinical manifestation of a defective response to DNA double-strand breaks as exemplified by Nijmegen breakage syndrome. Oncogene. 2007;26:7792-7798.
172 Carney JP, Maser RS, Olivares H, et al. The hMre11/hRad50 protein complex and Nijmegen breakage syndrome: linkage of double-strand break repair to the cellular DNA damage response. Cell. 1998;93:477-486.
173 Varon R, Vissinga C, Platzer M, et al. Nibrin, a novel DNA double-strand break repair protein, is mutated in Nijmegen breakage syndrome. Cell. 1998;93:467-476.
174 Taylor AM, Groom A, Byrd PJ. Ataxia-telangiectasia-like disorder (ATLD)—its clinical presentation and molecular basis. DNA Repair (Amst). 2004;3:1219-1225.
175 Stewart GS, Maser RS, Stankovic T, et al. The DNA double-strand break repair gene hMRE11 is mutated in individuals with an ataxia-telangiectasia-like disorder. Cell. 1999;99:577-587.
176 Badie C, Goodhardt M, Waugh A, et al. A DNA double-strand break defective fibroblast cell line (180BR) derived from a radiosensitive patient represents a new mutant phenotype. Cancer Res. 1997;57:4600-4607.
177 O’Driscoll M, Cerosaletti KM, Girard PM, et al. DNA ligase IV mutations identified in patients exhibiting developmental delay and immunodeficiency. Mol Cell. 2001;8:1175-1185.
178 O’Driscoll M, Ruiz-Perez VL, Woods CG, et al. A splicing mutation affecting expression of ataxia-telangiectasia and Rad3-related protein (ATR) results in Seckel syndrome. Nat Genet. 2003;33:497-501.
179 O’Driscoll M, Gennery AR, Seidel J, et al. An overview of three new disorders associated with genetic instability: LIG4 syndrome, RS-SCID and ATR-Seckel syndrome. DNA Repair (Amst). 2004;3:1227-1235.
180 Alexander P. Mouse lymphoma cells with different radiosensitivities. Nature. 1961;192:572-573.
181 Szumiel I. L5178Y sublines: a look back from 40 years. Part 1: general characteristics. Int J Radiat Biol. 2005;81:339-352.
182 Szumiel I. L5178Y sublines: a look back from 40 years. Part 2: response to ionizing radiation. Int J Radiat Biol. 2005;81:353-365.
183 Brzoska K, Kruszewski M, Szumiel I. Nonhomologous end-joining deficiency of L5178Y-S cells is not associated with mutation in the ABCDE autophosphorylation cluster. Acta Biochim Pol. 2006;53:233-236.
184 Collins AR. Mutant rodent cell lines sensitive to ultraviolet light, ionizing radiation and cross-linking agents: a comprehensive survey of genetic and biochemical characteristics. Mutat Res. 1993;293:99-118.
185 Thacker J, Zdzienicka MZ. The XRCC genes: expanding roles in DNA double-strand break repair. DNA Repair (Amst). 2004;3:1081-1090.
186 Hinz JM, Tebbs RS, Wilson PF, et al. Repression of mutagenesis by Rad51D-mediated homologous recombination. Nucleic Acids Res. 2006;34:1358-1368.
187 Tebbs RS, Hinz JM, Yamada NA, et al. New insights into the Fanconi anemia pathway from an isogenic FancG hamster CHO mutant. DNA Repair (Amst). 2005;4:11-22.
188 Blunt T, Gell D, Fox M, et al. Identification of a nonsense mutation in the carboxyl-terminal region of DNA-dependent protein kinase catalytic subunit in the scid mouse. Proc Natl Acad Sci USA. 1996;93:10285-10290.
189 Danska JS, Holland DP, Mariathasan S, et al. Biochemical and genetic defects in the DNA-dependent protein kinase in murine scid lymphocytes. Mol Cell Biol. 1996;16:5507-5517.
190 Araki R, Fujimori A, Hamatani K, et al. Nonsense mutation at Tyr-4046 in the DNA-dependent protein kinase catalytic subunit of severe combined immune deficiency mice. Proc Natl Acad Sci USA. 1997;94:2438-2443.
191 Okayasu R, Suetomi K, Yu Y, et al. A deficiency in DNA repair and DNA-PKcs expression in the radiosensitive BALB/c mouse. Cancer Res. 2000;60:4342-4345.
192 Yu Y, Okayasu R, Weil MM, et al. Elevated breast cancer risk in irradiated BALB/c mice associates with unique functional polymorphism of the Prkdc (DNA-dependent protein kinase catalytic subunit) gene. Cancer Res. 2001;61:1820-1824.
193 Darzynkiewicz Z, Juan G, Li X, et al. Cytometry in cell necrobiology: analysis of apoptosis and accidental cell death (necrosis). Cytometry. 1997;27:1-20.
194 Campisi J. Cancer and ageing: rival demons? Nat Rev Cancer. 2003;3:339-349.
195 Castedo M, Perfettini JL, Roumier T, et al. Cell death by mitotic catastrophe: a molecular definition. Oncogene. 2004;23:2825-2837.
196 Kops GJ, Weaver BA, Cleveland DW. On the road to cancer: aneuploidy and the mitotic checkpoint. Nat Rev Cancer. 2005;5:773-785.
197 Suzuki K, Mori I, Nakayama Y, et al. Radiation-induced senescence-like growth arrest requires TP53 function but not telomere shortening. Radiat Res. 2001;155:248-253.
198 Gorbunova V, Seluanov A, Pereira-Smith OM. Expression of human telomerase (hTERT) does not prevent stress-induced senescence in normal human fibroblasts but protects the cells from stress-induced apoptosis and necrosis. J Biol Chem. 2002;277:38540-38549.
199 Jones KR, Elmore LW, Jackson-Cook C, et al. p53-Dependent accelerated senescence induced by ionizing radiation in breast tumour cells. Int J Radiat Biol. 2005;81:445-458.
200 Bedford JS. Sublethal damage, potentially lethal damage, and chromosomal aberrations in mammalian cells exposed to ionizing radiations. Int J Radiat Oncol Biol Phys. 1991;21:1457-1469.
201 Little JB. Radiation-induced genomic instability. Int J Radiat Biol. 1998;74:663-671.
202 Hoeijmakers JH. Genome maintenance mechanisms for preventing cancer. Nature. 2001;411:366-374.
203 van Gent DC, Hoeijmakers JH, Kanaar R. Chromosomal stability and the DNA double-stranded break connection. Nat Rev Genet. 2001;2:196-206.
204 Khanna KK, Jackson SP. DNA double-strand breaks: signaling, repair and the cancer connection. Nat Genet. 2001;27:247-254.
205 Schultz LB, Chehab NH, Malikzay A, et al. p53 binding protein 1, (53BP1) is an early participant in the cellular response to DNA double-strand breaks. J Cell Biol. 2000;151:1381-1390.
206 Venkitaraman AR. Cancer susceptibility and the functions of BRCA1 and BRCA2. Cell. 2002;108:171-182.
207 Shang YL, Bodero AJ, Chen PL. NFBD1, a novel nuclear protein with signature motifs of FHA and BRCT, and an internal 41-amino acid repeat sequence, is an early participant in DNA damage response. J Biol Chem. 2003;278:6323-6329.
208 Goldberg M, Stucki M, Falck J, et al. MDC1 is required for the intra-S-phase DNA damage checkpoint. Nature. 2003;421:952-956.
209 Parrilla-Castellar ER, Arlander SJ, Karnitz L. Dial 9-1-1 for DNA damage: the Rad9-Hus1-Rad1 (9–1-1) clamp complex. DNA Repair (Amst). 2004;3:1009-1014.
210 Mochan TA, Venere M, DiTullio RAJr, et al. 53BP1 and NFBD1/MDC1-Nbs1 function in parallel interacting pathways activating ataxia-telangiectasia mutated (ATM) in response to DNA damage. Cancer Res. 2003;63:8586-8591.
211 D’Amours D, Jackson SP. The Mre11 complex: at the crossroads of dna repair and checkpoint signalling. Nat Rev Mol Cell Biol. 2002;3:317-327.
212 Bakkenist CJ, Kastan MB. Initiating cellular stress responses. Cell. 2004;118:9-17.
213 Rogakou EP, Pilch DR, Orr AH, et al. DNA double-stranded breaks induce histone H2AX phosphorylation on serine 139. J Biol Chem. 1998;273:5858-5868.
214 Rogakou EP, Boon C, Redon C, et al. Megabase chromatin domains involved in DNA double-strand breaks in vivo. J Cell Biol. 1999;146:905-915.
215 Paull TT, Rogakou EP, Yamazaki V, et al. A critical role for histone H2AX in recruitment of repair factors to nuclear foci after DNA damage. Curr Biol. 2000;10:886-895.
216 Thompson LH, Schild D. Recombinational DNA repair and human disease. Mutat Res. 2002;509:49-78.
217 Kruger I, Rothkamm K, Lobrich M. Enhanced fidelity for rejoining radiation-induced DNA double-strand breaks in the G2 phase of Chinese hamster ovary cells. Nucleic Acids Res. 2004;32:2677-2684.
218 Richardson C, Moynahan ME, Jasin M. Double-strand break repair by interchromosomal recombination: suppression of chromosomal translocations. Genes Dev. 1998;12:3831-3842.
219 Richardson C, Jasin M. Recombination between two chromosomes: implications for genomic integrity in mammalian cells. Cold Spring Harb Symp Quant Biol. 2000;65:553-560.
220 Sonoda E, Takata M, Yamashita YM, et al. Homologous DNA recombination in vertebrate cells. Proc Natl Acad Sci USA. 2001;98:8388-8394.
221 Taghian DG, Nickoloff JA. Chromosomal double-strand breaks induce gene conversion at high frequency in mammalian cells. Mol Cell Biol. 1997;17:6386-6393.
222 Elliott B, Richardson C, Winderbaum J, et al. Gene conversion tracts from double-strand break repair in mammalian cells. Mol Cell Biol. 1998;18:93-101.
223 Sengupta S, Harris CC. p53: traffic cop at the crossroads of DNA repair and recombination. Nat Rev Mol Cell Biol. 2005;6:44-55.
224 Nagasawa H, Latt SA, Lalande ME, et al. Effects of X-irradiation on cell-cycle progression, induction of chromosomal aberrations and cell killing in ataxia telangiectasia (AT) fibroblasts. Mutat Res. 1985;148:71-82.
225 Hittelman WN, Rao PN. Premature chromosome condensation. I. Visualization of x-ray-induced chromosome damage in interphase cells. Mutat Res. 1974;23:251-258.
226 Waldren CA, Johnson RT. Analysis of interphase chromosome damage by means of premature chromosome condensation after x- and ultraviolet-irradiation. Proc Natl Acad Sci U S A. 1974;71:1137-1141.
227 Iliakis GE, Pantelias GE. Production and repair of chromosome damage in an x-ray sensitive CHO mutant visualized and analysed in interphase using the technique of premature chromosome condensation. Int J Radiat Biol. 1990;57:1213-1223.
228 Sasai K, Evans JW, Kovacs MS, et al. Prediction of human cell radiosensitivity: comparison of clonogenic assay with chromosome aberrations scored using premature chromosome condensation with fluorescence in situ hybridization. Int J Radiat Oncol Biol Phys. 1994;30:1127-1132.
229 Meyn MS, Strasfeld L, Allen C. Testing the role of p53 in the expression of genetic instability and apoptosis in ataxia-telangiectasia. Int J Radiat Biol. 1994;66:S141-S149.
230 Enns L, Barley RD, Paterson MC, et al. Radiosensitivity in ataxia telangiectasia fibroblasts is not associated with deregulated apoptosis. Radiat Res. 1998;150:11-16.
231 Zhang Y, Dimtchev A, Dritschilo A, et al. Ionizing radiation-induced apoptosis in ataxia-telangiectasia fibroblasts. Roles of caspase-9 and cellular inhibitor of apoptosis protein-1. J Biol Chem. 2001;276:28842-28848.
232 Di Leonardo A, Linke SP, Clarkin K, et al. DNA damage triggers a prolonged p53-dependent G1 arrest and long-term induction of Cip1 in normal human fibroblasts. Genes Dev. 1994;8:2540-2551.
233 Bristow RG, Benchimol S, Hill RP. The p53 gene as a modifier of intrinsic radiosensitivity: implications for radiotherapy. Radiother Oncol. 1996;40:197-223.
234 Cuddihy AR, Bristow RG. The p53 protein family and radiation sensitivity: yes or no? Cancer Metastasis Rev. 2004;23:237-257.
235 Little JB, Nagasawa H. Effect of confluent holding on potentially lethal damage repair, cell cycle progression, and chromosomal aberrations in human normal and ataxia-telangiectasia fibroblasts. Radiat Res. 1985;101:81-93.
236 Borgmann K, Dede M, Wrona A, et al. For X-irradiated normal human fibroblasts, only half of cell inactivation results from chromosomal damage. Int J Radiat Oncol Biol Phys. 2004;58:445-452.
237 Siliciano JD, Canman CE, Taya Y, et al. DNA damage induces phosphorylation of the amino terminus of p53. Genes Dev. 1997;11:3471-3481.
238 Chao C, Saito S, Anderson CW, et al. Phosphorylation of murine p53 at ser-18 regulates the p53 responses to DNA damage. Proc Natl Acad Sci USA. 2000;97:11936-11941.
239 Turenne GA, Paul P, Laflair L, et al. Activation of p53 transcriptional activity requires ATM’s kinase domain and multiple N-terminal serine residues of p53. Oncogene. 2001;20:5100-5110.
240 Honda R, Tanaka H, Yasuda H. Oncoprotein MDM2 is a ubiquitin ligase E3 for tumor suppressor p53. FEBS Lett. 1997;420:25-27.
241 Hainaut P, Hollstein M. p53 and human cancer: the first ten thousand mutations. Adv Cancer Res. 2000;77:81-137.
242 Lu X, Lane DP. Differential induction of transcriptionally active p53 following UV or ionizing radiation: defects in chromosome instability syndromes? Cell. 1993;75:765-778.
243 DeSimone JN, Bengtsson U, Wang X, et al. Complexity of the mechanisms of initiation and maintenance of DNA damage-induced G2-phase arrest and subsequent G1-phase arrest: TP53-dependent and TP53-independent roles. Radiat Res. 2003;159:72-85.
244 Fei P, El-Deiry WS. P53 and radiation responses. Oncogene. 2003;22:5774-5783.
245 Saito S, Yamaguchi H, Higashimoto Y, et al. Phosphorylation site interdependence of human p53 post-translational modifications in response to stress. J Biol Chem. 2003;278:37536-37544.
246 Petitjean A, Mathe E, Kato S, et al. Impact of mutant p53 functional properties on TP53 mutation patterns and tumor phenotype: lessons from recent developments in the IARC TP53 database. Hum Mutat. 2007;28:622-629.
247 Gudkov AV, Komarova EA. The role of p53 in determining sensitivity to radiotherapy. Nat Rev Cancer. 2003;3:117-129.
248 Li FP, Fraumeni JFJr. Soft-tissue sarcomas, breast cancer, and other neoplasms. A familial syndrome? Ann Intern Med. 1969;71:747-752.
249 Blattner WA, McGuire DB, Mulvihill JJ, et al. Genealogy of cancer in a family. JAMA. 1979;241:259-261.
250 Malkin D, Li FP, Strong LC, et al. Germ line p53 mutations in a familial syndrome of breast cancer, sarcomas, and other neoplasms. Science. 1990;250:1233-1238.
251 Bohnke A, Westphal F, Schmidt A, et al. Role of p53 mutations, protein function and DNA damage for the radiosensitivity of human tumour cells. Int J Radiat Biol. 2004;80:53-63.
252 Morris EJ, Dyson NJ. Retinoblastoma protein partners. Adv Cancer Res. 2001;82:1-54.
253 Weinberg RA. The retinoblastoma protein and cell cycle control. Cell. 1995;81:323-330.
254 Zheng L, Lee WH. Retinoblastoma tumor suppressor and genome stability. Adv Cancer Res. 2002;85:13-50.
255 Sherr CJ. Cancer cell cycles. Science. 1996;274:1672-1677.
256 Mittnacht S. Control of pRB phosphorylation. Curr Opin Genet Dev. 1998;8:21-27.
257 Sherr CJ. The INK4a/ARF network in tumour suppression. Nat Rev Mol Cell Biol. 2001;2:731-737.
258 Friend SH, Bernards R, Rogelj S, et al. A human DNA segment with properties of the gene that predisposes to retinoblastoma and osteosarcoma. Nature. 1986;323:643-646.
259 de Bruin A, Maiti B, Jakoi L, et al. Identification and characterization of E2F7, a novel mammalian E2F family member capable of blocking cellular proliferation. J Biol Chem. 2003;278:42041-42049.
260 Maiti B, Li J, de Bruin A, et al. Cloning and characterization of mouse E2F8, a novel mammalian E2F family member capable of blocking cellular proliferation. J Biol Chem. 2005;280:18211-18220.
261 Stevens C, La Thangue NB. The emerging role of E2F-1 in the DNA damage response and checkpoint control. DNA Repair (Amst). 2004;3:1071-1079.
262 Genovese C, Trani D, Caputi M, et al. Cell cycle control and beyond: emerging roles for the retinoblastoma gene family. Oncogene. 2006;25:5201-5209.
263 Sherr CJ, McCormick F. The RB and p53 pathways in cancer. Cancer Cell. 2002;2:103-112.
264 Dyson N. The regulation of E2F by pRB-family proteins. Genes Dev. 1998;12:2245-2262.
265 Little JB, Nichols WW, Troilo P, et al. Radiation sensitivity of cell strains from families with genetic disorders predisposing to radiation-induced cancer. Cancer Res. 1989;49:4705-4714.
266 Lee EY, Chang CY, Hu N, et al. Mice deficient for Rb are nonviable and show defects in neurogenesis and haematopoiesis. Nature. 1992;359:288-294.
267 Jacks T, Fazeli A, Schmitt EM, et al. Effects of an Rb mutation in the mouse. Nature. 1992;359:295-300.
268 Clarke AR, Maandag ER, van Roon M, et al. Requirement for a functional Rb-1 gene in murine development. Nature. 1992;359:328-330.
269 Vakifahmetoglu H, Olsson M, Zhivotovsky B. Death through a tragedy: mitotic catastrophe. Cell Death Differ. 2008;15:1153-1162.
270 Iliakis G, Wang Y, Guan J, et al. DNA damage checkpoint control in cells exposed to ionizing radiation. Oncogene. 2003;22:5834-5847.
271 Zampetti-Bosseler F, Scott D. Cell death, chromosome damage and mitotic delay in normal human, ataxia telangiectasia and retinoblastoma fibroblasts after x-irradiation. Int J Radiat Biol Relat Stud Phys Chem Med. 1981;39:547-558.
272 Nagasawa H, Keng P, Harley R, et al. Relationship between gamma-ray-induced G2/M delay and cellular radiosensitivity. Int J Radiat Biol. 1994;66:373-379.
273 Akkari YM, Bateman RL, Reifsteck CA, et al. DNA replication is required to elicit cellular responses to psoralen-induced DNA interstrand cross-links. Mol Cell Biol. 2000;20:8283-8289.
274 Andreassen PR, Lohez OD, Margolis RL. G2 and spindle assembly checkpoint adaptation, and tetraploidy arrest: implications for intrinsic and chemically induced genomic instability. Mutat Res. 2003;532:245-253.
275 Kaufmann WK, Kies PE. DNA signals for G2 checkpoint response in diploid human fibroblasts. Mutat Res. 1998;400:153-167.
276 Parker LL, Piwnica-Worms H. Inactivation of the p34cdc2-cyclin B complex by the human WEE1 tyrosine kinase. Science. 1992;257:1955-1957.
277 Liu F, Stanton JJ, Wu Z, et al. The human Myt1 kinase preferentially phosphorylates Cdc2 on threonine 14 and localizes to the endoplasmic reticulum and Golgi complex. Mol Cell Biol. 1997;17:571-583.
278 Ubersax JA, Woodbury EL. Quang PN, Targets of the cyclin-dependent kinase Cdk1. Nature. 2003;425:859-864.
279 van Leuken R, Clijsters L, Wolthuis R. To cell cycle, swing the APC/C. Biochim Biophys Acta. 2008;1786:49-59.
280 Sullivan M, Morgan DO. Finishing mitosis, one step at a time. Nat Rev Mol Cell Biol. 2007;8:894-903.
281 Liu Q, Guntuku S, Cui XS, et al. Chk1 is an essential kinase that is regulated by Atr and required for the G(2)/M DNA damage checkpoint. Genes Dev. 2000;14:1448-1459.
282 Chaturvedi P, Eng WK, Zhu Y, et al. Mammalian Chk2 is a downstream effector of the ATM-dependent DNA damage checkpoint pathway. Oncogene. 1999;18:4047-4054.
283 Sanchez Y, Wong C, Thoma RS, et al. Conservation of the Chk1 checkpoint pathway in mammals: linkage of DNA damage to Cdk regulation through Cdc25. Science. 1997;277:1497-1501.
284 Peng CY, Graves PR, Thoma RS, et al. Mitotic and G2 checkpoint control: regulation of 14-3-3 protein binding by phosphorylation of Cdc25C on serine-216. Science. 1997;277:1501-1505.
285 Xu B, Kim ST, Lim DS, et al. Two molecularly distinct G(2)/M checkpoints are induced by ionizing irradiation. Mol Cell Biol. 2002;22:1049-1059.
286 Bunz F, Dutriaux A, Lengauer C, et al. Requirement for p53 and p21 to sustain G2 arrest after DNA damage. Science. 1998;282:1497-1501.
287 Painter RB, Young BR. Radiosensitivity in ataxia-telangiectasia: a new explanation. Proc Natl Acad Sci USA. 1980;77:7315-7317.
288 Scott D, Spreadborough AR, Roberts SA. Radiation-induced G2 delay and spontaneous chromosome aberrations in ataxia-telangiectasia homozygotes and heterozygotes. Int J Radiat Biol. 1994;66:S157-163.
289 Ford MD, Martin L, Lavin MF. The effects of ionizing radiation on cell cycle progression in ataxia-telangiectasia. Mutat Res. 1984;125:115-122.
290 Bender MA, Rary JM, Kale RP. G2 chromosomal radiosensitivity in ataxia telangiectasia lymphocytes. Mutat Res. 1985;152:39-47.
291 Beamish H, Lavin MF. Radiosensitivity in ataxia-telangiectasia: anomalies in radiation-induced cell cycle delay. Int J Radiat Biol. 1994;65:175-184.
292 Cortez D, Guntuku S, Qin J, et al. ATR and ATRIP: partners in checkpoint signaling. Science. 2001;294:1713-1716.
293 Bartek J, Lukas C, Lukas J. Checking on DNA damage in S phase. Nat Rev Mol Cell Biol. 2004;5:792-804.
294 Borel F, Lohez OD, Lacroix FB, et al. Multiple centrosomes arise from tetraploidy checkpoint failure and mitotic centrosome clusters in p53 and RB pocket protein-compromised cells. Proc Natl Acad Sci USA. 2002;99:9819-9824.
295 Kaufmann WK, Heffernan TP, Beaulieu LM, et al. Caffeine and human DNA metabolism: the magic and the mystery. Mutat Res. 2003;532:85-102.
296 Wang X, Wang H, Iliakis G, et al. Caffeine-induced radiosensitization is independent of nonhomologous end joining of DNA double-strand breaks. Radiat Res. 2003;159:426-432.
297 Wang H, Wang X, Iliakis G, et al. Caffeine could not efficiently sensitize homologous recombination repair-deficient cells to ionizing radiation-induced killing. Radiat Res. 2003;159:420-425.
298 Cortez D. Caffeine inhibits checkpoint responses without inhibiting the ataxia-telangiectasia-mutated (ATM) and ATM- and Rad3-related (ATR) protein kinases. J Biol Chem. 2003;278:37139-37145.
299 Ning S, Knox SJ. G2/M-phase arrest and death by apoptosis of HL60 cells irradiated with exponentially decreasing low-dose-rate gamma radiation. Radiat Res. 1999;151:659-669.
300 Jha MN, Bamburg JR, Bernstein BW, et al. Caffeine eliminates gamma-ray-induced G2-phase delay in human tumor cells but not in normal cells. Radiat Res. 2002;157:26-31.
301 Morrison C, Rieder CL. Chromosome damage and progression into and through mitosis in vertebrates. DNA Repair (Amst). 2004;3:1133-1139.
302 Appel K, Wagner P, Boldyreff B, et al. Mapping of the interaction sites of the growth suppressor protein p53 with the regulatory beta-subunit of protein kinase CK2. Oncogene. 1995;11:1971-1978.
303 Sayed M, Pelech S, Wong C, et al. Protein kinase CK2 is involved in G2 arrest and apoptosis following spindle damage in epithelial cells. Oncogene. 2001;20:6994-7005.
304 Skoufias DA, Andreassen PR, Lacroix FB, et al. Mammalian mad2 and bub1/bubR1 recognize distinct spindle-attachment and kinetochore-tension checkpoints. Proc Natl Acad Sci USA. 2001;98:4492-4497.
305 Ruchaud S, Carmena M, Earnshaw WC. Chromosomal passengers: conducting cell division. Nat Rev Mol Cell Biol. 2007;8:798-812.
306 Mikhailov A, Cole RW, Rieder CL. DNA damage during mitosis in human cells delays the metaphase/anaphase transition via the spindle-assembly checkpoint. Curr Biol. 2002;12:1797-1806.
307 Evans JH. Chromosome aberrations induced by ionizing radiations. Int Rev Cytol. 1962;13:221-321.
308 Radford IR, Broadhurst S. Enhanced induction by X-irradiation of DNA double-strand breakage in mitotic as compared with S-phase V79 cells. Int J Radiat Biol Relat Stud Phys Chem Med. 1986;49:909-914.
309 Chapman JD, Stobbe CC, Gales T, et al. Condensed chromatin and cell inactivation by single-hit kinetics. Radiat Res. 1999;151:433-441.
310 Stobbe CC, Park SJ, Chapman JD. The radiation hypersensitivity of cells at mitosis. Int J Radiat Biol. 2002;78:1149-1157.
311 Lanni JS, Jacks T. Characterization of the p53-dependent postmitotic checkpoint following spindle disruption. Mol Cell Biol. 1998;18:1055-1064.
312 Andreassen PR, Lohez OD, Lacroix FB, et al. Tetraploid state induces p53-dependent arrest of nontransformed mammalian cells in G1. Mol Biol Cell. 2001;12:1315-1328.
313 Meraldi P, Honda R, Nigg EA. Aurora-A overexpression reveals tetraploidization as a major route to centrosome amplification in p53-/- cells. EMBO J. 2002;21:483-492.
314 Schwartz JL, Murnane J, Weichselbaum RR. The contribution of DNA ploidy to radiation sensitivity in human tumour cell lines. Br J Cancer. 1999;79:744-747.
315 Hanahan D, Weinberg RA. The hallmarks of cancer. Cell. 2000;100:57-70.
316 Kim GJ, Chandrasekaran K, Morgan WF. Mitochondrial dysfunction, persistently elevated levels of reactive oxygen species and radiation-induced genomic instability: a review. Mutagenesis. 2006;21:361-367.
317 Brown JM, Attardi LD. The role of apoptosis in cancer development and treatment response. Nat Rev Cancer. 2005;5:231-237.
318 Saito T, Hama S, Izumi H, et al. Centrosome amplification induced by survivin suppression enhances both chromosome instability and radiosensitivity in glioma cells. Br J Cancer. 2008;98:345-355.
319 Kumar P, Coltas IK, Kumar B, et al. Bcl-2 protects endothelial cells against gamma-radiation via a Raf-MEK-ERK-survivin signaling pathway that is independent of cytochrome c release. Cancer Res. 2007;67:1193-1202.
320 Capalbo G, Rodel C, Stauber RH, et al. The role of survivin for radiation therapy. Prognostic and predictive factor and therapeutic target. Strahlenther Onkol. 2007;183:593-599.
321 Okada H, Mak TW. Pathways of apoptotic and non-apoptotic death in tumour cells. Nat Rev Cancer. 2004;4:592-603.
322 Kim R, Emi M, Tanabe K, et al. The role of apoptotic or nonapoptotic cell death in determining cellular response to anticancer treatment. Eur J Surg Oncol. 2006;32:269-277.
323 Nechushtan A, Smith CL, Lamensdorf I, et al. Bax and Bak coalesce into novel mitochondria-associated clusters during apoptosis. J Cell Biol. 2001;153:1265-1276.
324 Verheij M. Clinical biomarkers and imaging for radiotherapy-induced cell death. Cancer Metastasis Rev. 2008;27:471-480.
325 Blankenberg FG. In vivo detection of apoptosis. J Nucl Med. 2008;49(Suppl 2):81S-95S.
326 Kolesnick R, Fuks Z. Radiation and ceramide-induced apoptosis. Oncogene. 2003;22:5897-5906.
327 Miyashita T, Krajewski S, Krajewska M, et al. Tumor suppressor p53 is a regulator of bcl-2 and bax gene expression in vitro and in vivo. Oncogene. 1994;9:1799-1805.
328 Yang JY, Xia W, Hu MC. Ionizing radiation activates expression of FOXO3a, Fas ligand, and Bim, and induces cell apoptosis. Int J Oncol. 2006;29:643-648.
329 Cory S, Adams JM. The Bcl2 family: regulators of the cellular life-or-death switch. Nat Rev Cancer. 2002;2:647-656.
330 Sheikh MS, Burns TF, Huang Y, et al. p53-dependent and -independent regulation of the death receptor KILLER/DR5 gene expression in response to genotoxic stress and tumor necrosis factor alpha. Cancer Res. 1998;58:1593-1598.
331 Gong B, Almasan A. Apo2 ligand/TNF-related apoptosis-inducing ligand and death receptor 5 mediate the apoptotic signaling induced by ionizing radiation in leukemic cells. Cancer Res. 2000;60:5754-5760.
332 Marchetti F, Coleman MA, Jones IM, et al. Candidate protein biodosimeters of human exposure to ionizing radiation. Int J Radiat Biol. 2006;82:605-639.
333 Zeidan YH, Hannun YA. Activation of acid sphingomyelinase by protein kinase Cdelta-mediated phosphorylation. J Biol Chem. 2007;282:11549-11561.
334 Budihardjo I, Oliver H, Lutter M, et al. Biochemical pathways of caspase activation during apoptosis. Annu Rev Cell Dev Biol. 1999;15:269-290.
335 Li H, Zhu H, Xu CJ, et al. Cleavage of BID by caspase 8 mediates the mitochondrial damage in the Fas pathway of apoptosis. Cell. 1998;94:491-501.
336 Wang HG, Pathan N, Ethell IM, et al. Ca2+-induced apoptosis through calcineurin dephosphorylation of BAD. Science. 1999;284:339-343.
337 Garcia A, Cayla X, Guergnon J, et al. A. Fleischer and A. Rebollo, Serine/threonine protein phosphatases PP1 and PP2A are key players in apoptosis. Biochimie. 2003;85:721-726.
338 Zundel W, Giaccia A. Inhibition of the anti-apoptotic PI(3)K/Akt/Bad pathway by stress. Genes Dev. 1998;12:1941-1946.
339 Hockenbery D, Nunez G, Milliman C, et al. Bcl-2 is an inner mitochondrial membrane protein that blocks programmed cell death. Nature. 1990;348:334-336.
340 Finucane DM, Bossy-Wetzel E, Waterhouse NJ, et al. Bax-induced caspase activation and apoptosis via cytochrome c release from mitochondria is inhibitable by Bcl-xL. J Biol Chem. 1999;274:2225-2233.
341 Kluck RM, Esposti MD, Perkins G, et al. The pro-apoptotic proteins, Bid and Bax, cause a limited permeabilization of the mitochondrial outer membrane that is enhanced by cytosol. J Cell Biol. 1999;147:809-822.
342 Roy N, Deveraux QL, Takahashi R, et al. The c-IAP-1 and c-IAP-2 proteins are direct inhibitors of specific caspases. EMBO J. 1997;16:6914-6925.
343 Du C, Fang M, Li Y, et al. Smac, a mitochondrial protein that promotes cytochrome c-dependent caspase activation by eliminating IAP inhibition. Cell. 2000;102:33-42.
344 Verhagen AM, Ekert PG, Pakusch M, et al. Identification of DIABLO, a mammalian protein that promotes apoptosis by binding to and antagonizing IAP proteins. Cell. 2000;102:43-53.
345 Hegde R, Srinivasula SM, Zhang Z, et al. Identification of Omi/HtrA2 as a mitochondrial apoptotic serine protease that disrupts inhibitor of apoptosis protein-caspase interaction. J Biol Chem. 2002;277:432-438.
346 Salvesen GS, Dixit VM. Caspases: intracellular signaling by proteolysis. Cell. 1997;91:443-446.
347 Thornberry NA, Lazebnik Y. Caspases: enemies within. Science. 1998;281:1312-1316.
348 Liu X, Kim CN, Yang J, et al. Induction of apoptotic program in cell-free extracts: requirement for dATP and cytochrome c. Cell. 1996;86:147-157.
349 Widlak P, Garrard WT. Discovery, regulation, and action of the major apoptotic nucleases DFF40/CAD and endonuclease G. J Cell Biochem. 2005;94:1078-1087.
350 Dewey WC, Ling CC, Meyn RE. Radiation-induced apoptosis: relevance to radiotherapy. Int J Radiat Oncol Biol Phys. 1995;33(4):781-796.
351 Olive PL, Frazer G, Banath JP. Radiation-induced apoptosis measured in TK6 human B lymphoblast cells using the comet assay. Radiat Res. 1993;136(1):130-136.
352 Stephens LC, Hunter NR, Ang KK, et al. Development of apoptosis in irradiated murine tumors as a function of time and dose. Radiat Res. 1993;135(1):75-80.
353 Schwartz JL, Jordan R, Sedita BA, et al. Different sensitivity to cell killing and chromosome mutation induction by gamma rays in two human lymphoblastoid cell lines derived from a single donor: possible role of apoptosis. Mutagenesis. 1995;10:227-233.
354 Garcia-Barros M, Paris F, Cordon-Cardo C, et al. Tumor response to radiotherapy regulated by endothelial cell apoptosis. Science. 2003;300:1155-1159.
355 Yorimitsu T, Klionsky DJ. Autophagy: molecular machinery for self-eating. Cell Death Differ. 2005;12(Suppl 2):1542-1552.
356 Kondo Y, Kanzawa T, Sawaya R, et al. The role of autophagy in cancer development and response to therapy. Nat Rev Cancer. 2005;5:726-734.
357 Gozuacik D, Kimchi A. Autophagy as a cell death and tumor suppressor mechanism. Oncogene. 2004;23:2891-2906.
358 Searle J, Lawson TA, Abbott PJ, et al. An electron-microscope study of the mode of cell death induced by cancer-chemotherapeutic agents in populations of proliferating normal and neoplastic cells. J Pathol. 1975;116:129-138.
359 Xie Z, Klionsky DJ. Autophagosome formation: core machinery and adaptations. Nat Cell Biol. 2007;9:1102-1109.
360 Geng J, Klionsky DJ. The Atg8 and Atg12 ubiquitin-like conjugation systems in macroautophagy. “Protein modifications: beyond the usual suspects” review series. EMBO Rep. 2008;9:859-864.
361 Rosner M, Hanneder M, Siegel N, et al. The mTOR pathway and its role in human genetic diseases. Mutat Res. 2008;659:284-292.
362 Steck PA, Pershouse MA, Jasser SA, et al. Identification of a candidate tumour suppressor gene, MMAC1, at chromosome 10q23.3 that is mutated in multiple advanced cancers. Nat Genet. 1997;15:356-362.
363 Arico S, Petiot A, Bauvy C, et al. The tumor suppressor PTEN positively regulates macroautophagy by inhibiting the phosphatidylinositol 3-kinase/protein kinase B pathway. J Biol Chem. 2001;276:35243-35246.
364 Backer JM. The regulation and function of Class III PI3Ks: novel roles for Vps34. Biochem J. 2008;410:1-17.
365 Paglin S, Hollister T, Delohery T, et al. A novel response of cancer cells to radiation involves autophagy and formation of acidic vesicles. Cancer Res. 2001;61:439-444.
366 Albert JM, Kim KW, Cao C, et al. Targeting the Akt/mammalian target of rapamycin pathway for radiosensitization of breast cancer. Mol Cancer Ther. 2006;5:1183-1189.
367 Cao C, Subhawong T, Albert JM, et al. Inhibition of mammalian target of rapamycin or apoptotic pathway induces autophagy and radiosensitizes PTEN null prostate cancer cells. Cancer Res. 2006;66:10040-10047.
368 Daido S, Yamamoto A, Fujiwara K, et al. Inhibition of the DNA-dependent protein kinase catalytic subunit radiosensitizes malignant glioma cells by inducing autophagy. Cancer Res. 2005;65:4368-4375.
369 Bursch W, Ellinger A, Kienzl H, et al. Active cell death induced by the anti-estrogens tamoxifen and ICI 164 384 in human mammary carcinoma cells (MCF-7) in culture: the role of autophagy. Carcinogenesis. 1996;17:1595-1607.
370 Janicke RU, Sprengart ML, Wati MR, et al. Caspase-3 is required for DNA fragmentation and morphological changes associated with apoptosis. J Biol Chem. 1998;273:9357-9360.
371 Scarlatti F, Bauvy C, Ventruti A, et al. Ceramide-mediated macroautophagy involves inhibition of protein kinase B and up-regulation of beclin 1. J Biol Chem. 2004;279:18384-18391.
372 Liang XH, Jackson S, Seaman M, et al. Induction of autophagy and inhibition of tumorigenesis by beclin 1. Nature. 1999;402:672-676.
373 Qu X, Yu J, Bhagat G, et al. Promotion of tumorigenesis by heterozygous disruption of the beclin 1 autophagy gene. J Clin Invest. 2003;112:1809-1820.
374 Yue Z, Jin S, Yang C, et al. Beclin 1, an autophagy gene essential for early embryonic development, is a haploinsufficient tumor suppressor. Proc Natl Acad Sci U S A. 2003;100:15077-15082.
375 Moretti L, Yang ES, Kim KW, et al. Autophagy signaling in cancer and its potential as novel target to improve anticancer therapy. Drug Resist Updat. 2007;10:135-143.
376 Vercammen D, Brouckaert G, Denecker G, et al. Dual signaling of the Fas receptor: initiation of both apoptotic and necrotic cell death pathways. J Exp Med. 1998;188:919-930.
377 Holler N, Zaru R, Micheau O, et al. Fas triggers an alternative, caspase-8-independent cell death pathway using the kinase RIP as effector molecule. Nat Immunol. 2000;1:489-495.
378 Bernstein C, Bernstein H, Payne CM, et al. DNA repair/pro-apoptotic dual-role proteins in five major DNA repair pathways: fail-safe protection against carcinogenesis. Mutat Res. 2002;511:145-178.
379 Zong WX, Ditsworth D, Bauer DE, et al. Alkylating DNA damage stimulates a regulated form of necrotic cell death. Genes Dev. 2004;18:1272-1282.
380 Yu SW, Wang H, Poitras MF, et al. Mediation of poly(ADP-ribose) polymerase-1-dependent cell death by apoptosis-inducing factor. Science. 2002;297:259-263.
381 de Bruin EC, Medema JP. Apoptosis and non-apoptotic deaths in cancer development and treatment response. Cancer Treat Rev. 2008;34:737-749.
382 Kramer G, Erdal H, Mertens HJ, et al. Differentiation between cell death modes using measurements of different soluble forms of extracellular cytokeratin 18. Cancer Res. 2004;64:1751-1756.
383 Debucquoy A, Libbrecht L, Roobrouck V, et al. Morphological features and molecular markers in rectal cancer from 95 patients included in the European Organisation for Research and Treatment of Cancer 22921 trial: prognostic value and effects of preoperative radio (chemo) therapy. Eur J Cancer. 2008;44:791-797.