Radiation-Induced Liver Disease

Published on 19/07/2015 by admin

Filed under Radiology

Last modified 22/04/2025

Print this page

rate 1 star rate 2 star rate 3 star rate 4 star rate 5 star
Your rating: none, Average: 0 (0 votes)

This article have been viewed 2459 times

 Vessels within zone may appear normal (no mass effect)

image Usually low density on NECT and CECT
image May have mixed hypervascular and hypovascular foci
• Region of radiation damage that is hypodense on portal venous phase may become hyperdense with prolonged enhancement on delayed phase

image Due to ↓ vascular perfusion, ↓ hepatic venous drainage, and subsequent stasis of contrast medium
• MR, especially T1WI with in- and opposed-phase GRE, is best means of distinguishing RILD from steatosis

TOP DIFFERENTIAL DIAGNOSES

• Focal steatosis
• Hepatic infarction

PATHOLOGY

• Patients receiving single 1,200-rad dose of external beam radiation or a 4,000 to 5,500-rad fractionated dose over 6 weeks can develop RILD
• Hepatic arterial administration of yttrium-90 glass microspheres

image Emit radiation to perfused hepatic area persisting for 64-hour half-life

CLINICAL ISSUES

• Complete clinical recovery typically seen within 60 days, but there may be permanent hepatocyte loss, fat deposition, fibrosis, and obliteration of central veins
image
(Left) Axial CECT shows a vertically oriented zone of low attenuation extending from the cranial to caudal aspect of the liver in a straight line image, following external radiation therapy for lymphoma.

image
(Right) Axial CECT shows a straight line of demarcation of damaged liver image 
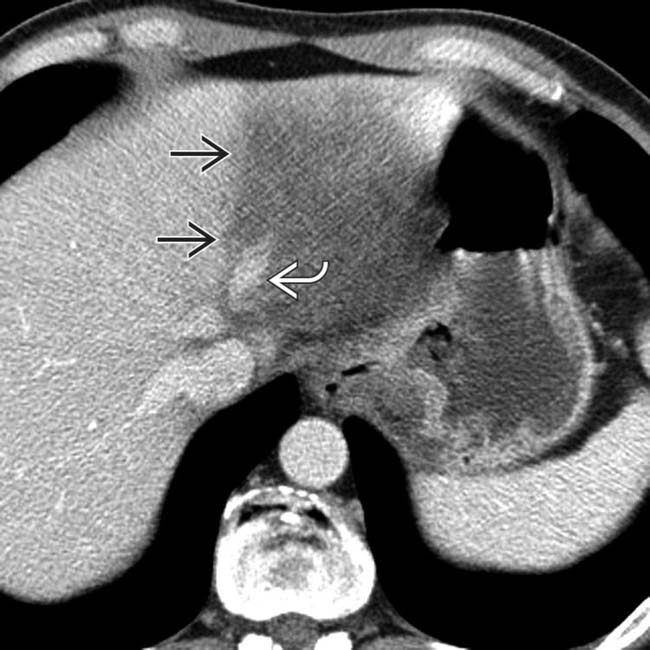
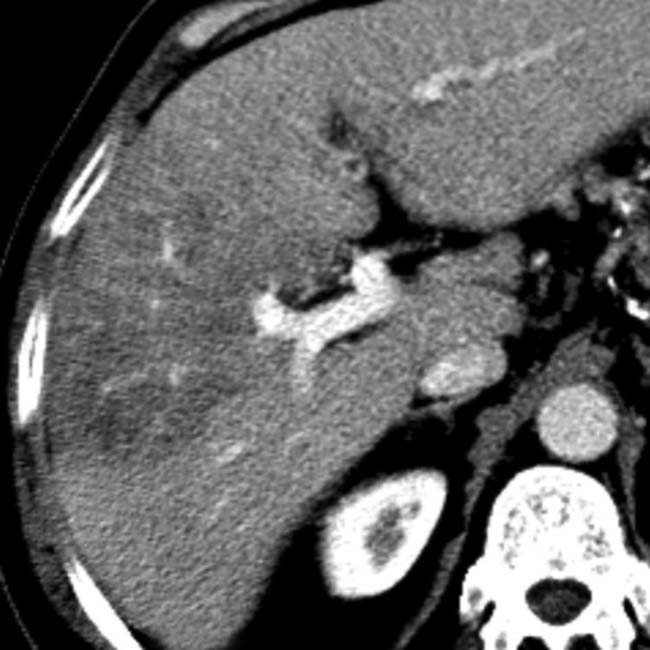
in the left lobe due to external radiation therapy for esophageal carcinoma. Note the normal appearance of the left hepatic vein image within the zone of radiation-induced liver disease (RILD).
image
(Left) Axial CECT shows decreased attenuation within the posterior segments of the liver, with a straight line of demarcation image 
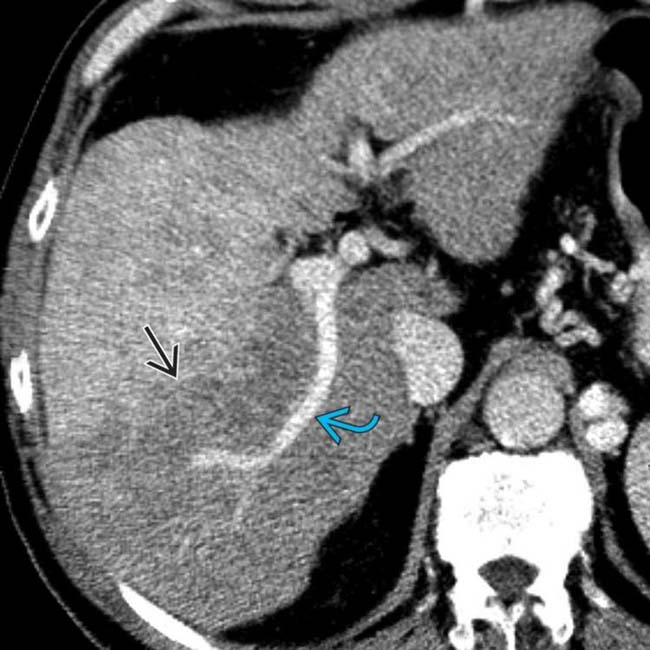
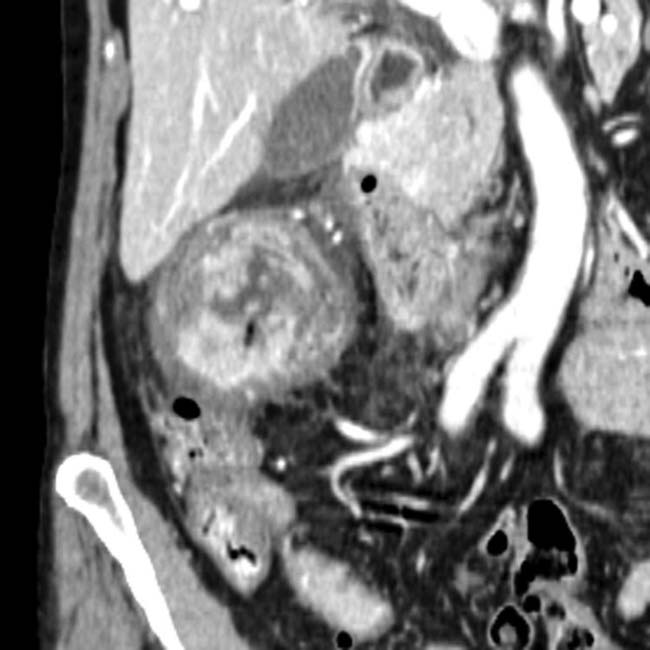
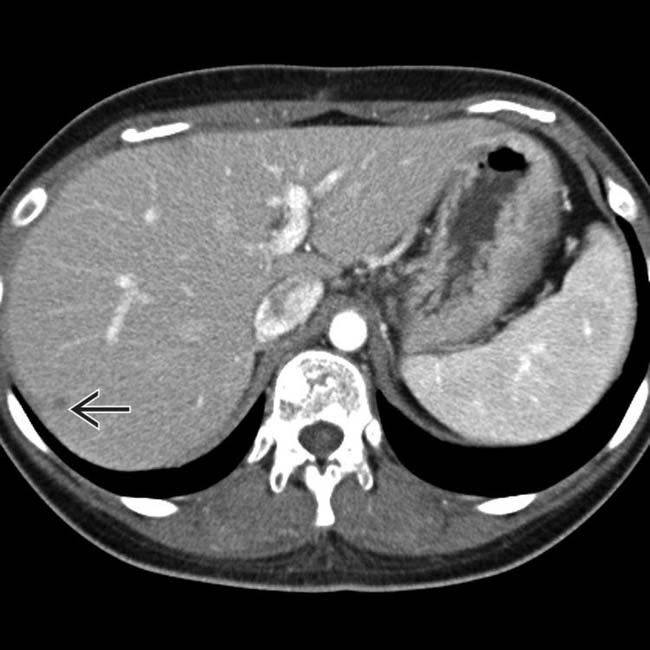
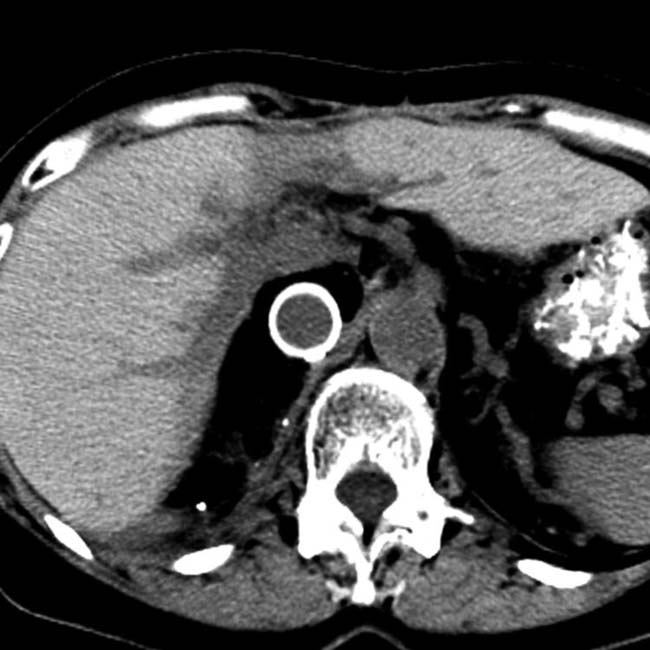
corresponding to the segments that had received yttrium-90 microsphere embolization for hepatocellular carcinoma (HCC). Note the normal appearance of the posterior right portal vein image within the damaged liver.
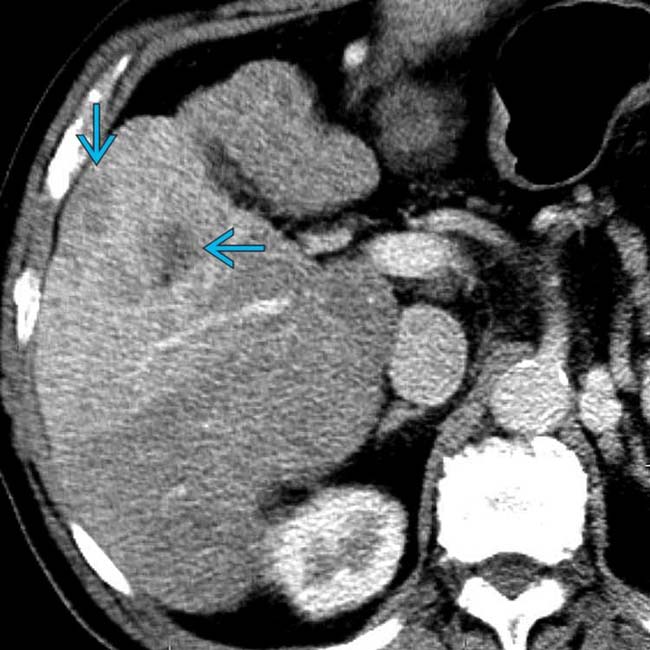
image
(Right) CECT section from the same case shows viable satellite foci of HCC within the untreated anterior segments of liver image.

TERMINOLOGY

Abbreviations

• Radiation-induced liver disease (RILD)

Definitions

• Syndrome characterized by development of anicteric ascites ∼ 2 weeks to 4 months after hepatic irradiation
• Form of venoocclusive disease due to fibrous obliteration of terminal hepatic venules → postsinusoidal obstruction

IMAGING

General Features

• Best diagnostic clue

image Sharp line of demarcation between normal and abnormal parenchyma corresponds to radiation port or vascular distribution of yttrium-90 microspheres

CT Findings

• NECT

image Sharply defined band of low attenuation corresponding to treatment port

– Probably due to hepatocellular necrosis, edema, and steatosis
image If hepatic congestion is severe, patchy congestion simulating tumor nodules may be seen
image In patients with diffuse hepatic steatosis, irradiated area may appear as region of increased attenuation

– May be due to loss of fat in irradiated hepatocytes or regional edema
image Over time, sharp borders of irradiated zone become more irregular and indistinct (peripheral parenchyma regenerates)

– Eventually, irradiated area may become atrophic
• CECT

image Enhancement pattern of irradiated liver may vary depending on preexisting hepatic pathology
image Intense enhancement of irradiated parenchyma may be seen in acute phase injury

– Due to ↑ arterial flow and reduced portal flow
image Region of radiation damage that is hypodense on portal venous phase may become hyperdense with prolonged enhancement on delayed phase

– Due to ↓ vascular perfusion, ↓ hepatic venous drainage, and subsequent stasis of contrast medium
image Narrowing and irregularity of hepatic vessels (sinusoidal congestion and perisinusoidal edema)

– Vessels within zone may appear normal (no mass effect)

MR Findings

• T1WI

image Zone of ↓ intensity on T1WI, ↑ on T2WI

Imaging Recommendations

• Best imaging tool

image NECT and CECT or MR T1WI GRE with in- and out-of-phase imaging
• Protocol advice

image MR, especially T1WI with in- and opposed-phase GRE, is best means of distinguishing RILD from steatosis

DIFFERENTIAL DIAGNOSIS

Focal Steatosis

• May be geographic, band- or wedge-shaped
• Preservation of enhancing vessels within “lesion”
• Suppression of signal on opposed-phase GRE MR

Hepatic Infarction

• Segmental or geographic hypodense area with straight margins with absent or heterogeneous enhancement

PATHOLOGY

General Features

• Etiology

image Patients receiving single 1,200-rad dose of external beam radiation or a 4,000 to 5,500-rad fractionated dose over 6 weeks can develop RILD
image Hepatic arterial administration of yttrium-90 glass microspheres

– Emit radiation to perfused hepatic area persisting for 64-hour half-life

Microscopic Features

• Venoocclusive disease
• Massive panlobar congestion, hyperemia, hemorrhage, and mild proliferative change in sublobular central veins

image Stasis secondary to injury of these veins

CLINICAL ISSUES

Presentation

• Hepatomegaly, ascites, fatigue

Demographics

• Epidemiology

image Now more commonly seen with advent of 3D treatment planning and bone marrow transplantation with total body radiation

Natural History & Prognosis

• Complete clinical recovery typically within 60 days

image Complete resolution or progression to atrophy of involved segments and, rarely, cirrhosis

DIAGNOSTIC CHECKLIST

Consider

• Factors that influence variability in liver damage

image Irradiated liver volume, radiation fraction size, cytotoxic agents, and nutritional status
image
(Left) Arterial phase CECT shows a heterogeneous hypervascular lesion image 
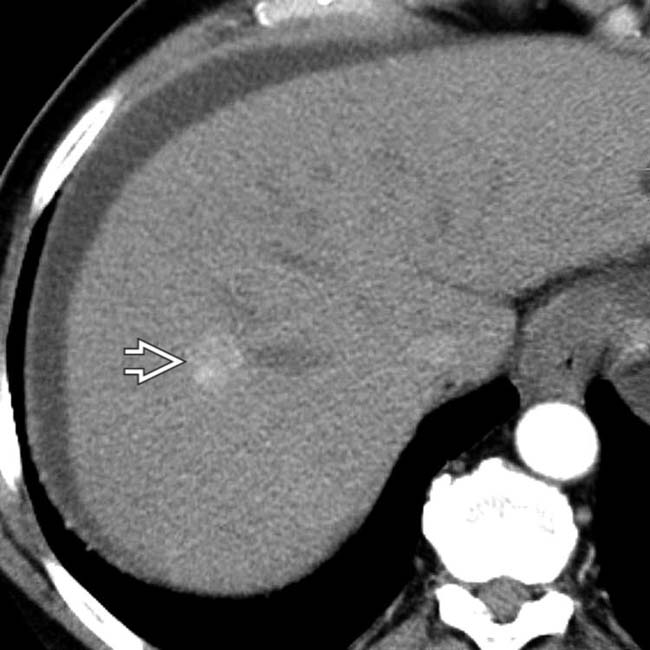
in a 66-year-old man with HCC, prior to the onset of therapy.

image
(Right) Portal venous phase imaging from the same case shows normal-appearing adjacent liver.
image
(Left) Repeat nonenhanced CT scan during therapy with hepatic arterial infusion of yttrium-90 microspheres shows a wedge-shaped zone of decreased attenuation image 
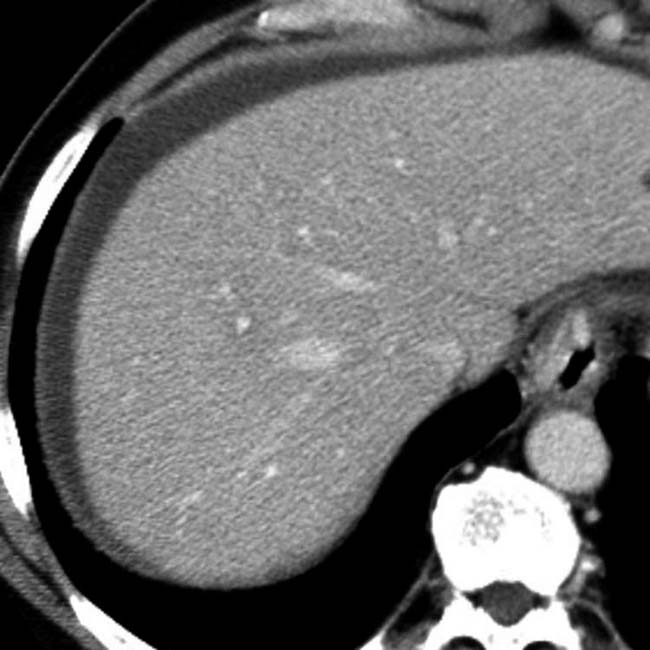
in the distribution of the right anterior hepatic artery in which the radioactive microspheres had been placed.
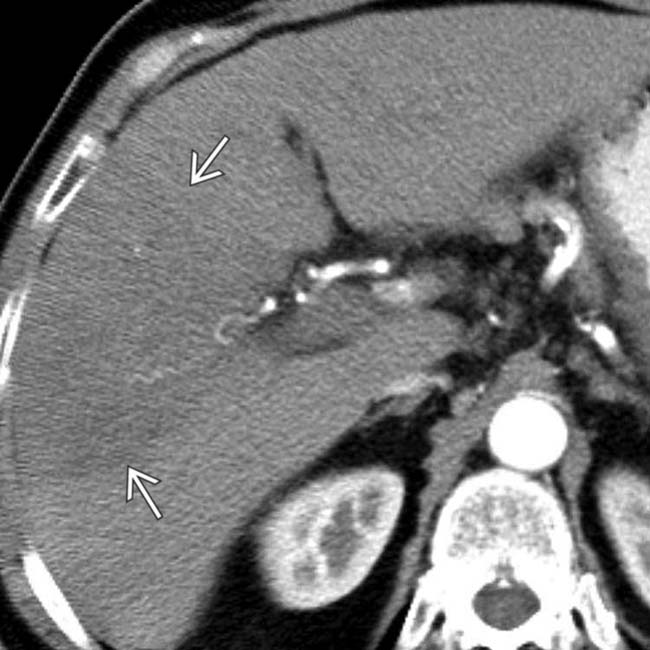
image
(Right) An arterial phase CT image from the same study shows persistence of the wedge-shaped zone of radiation-induced liver injury. Note the straight line demarcation of the zone of injury image.
image
(Left) A venous phase CT section from the same study shows that the HCC nodule image is less vascular than on pretreatment images. Note persistence of the straight line of demarcation image of the treated segment of liver.

image
(Right) Final venous phase CECT section from the same study shows intact blood vessels within the zone of radiation-induced injury. The patient remained clinically asymptomatic with only mild elevation of hepatic transaminase enzymes.
image
(Left) Axial CECT in a 65-year-old man who had radiation therapy for esophageal carcinoma and metastases to the left lobe shows mixed hypo- and hyperdense lesions in the left and caudate lobes, with a straight line of demarcation from normal liver image 
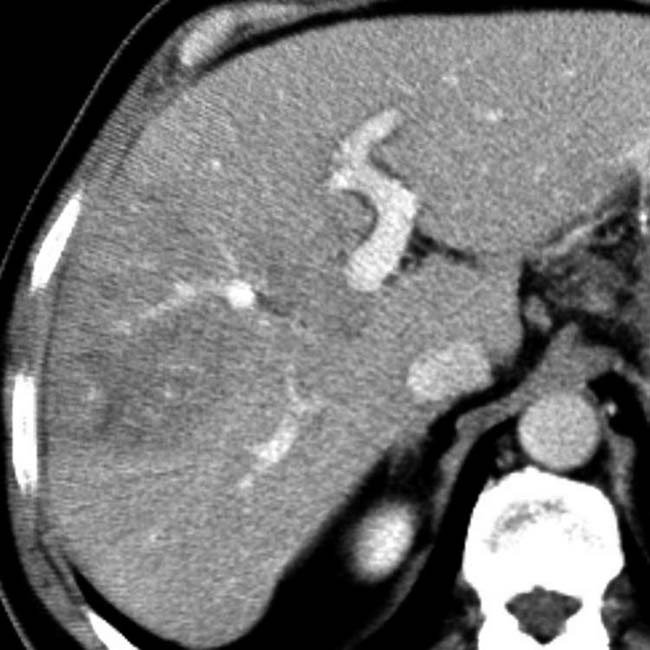
corresponding to the radiation therapy port.

image
(Right) Venous phase CT in the same case shows mixed density lesions in the pattern of the radiation port image
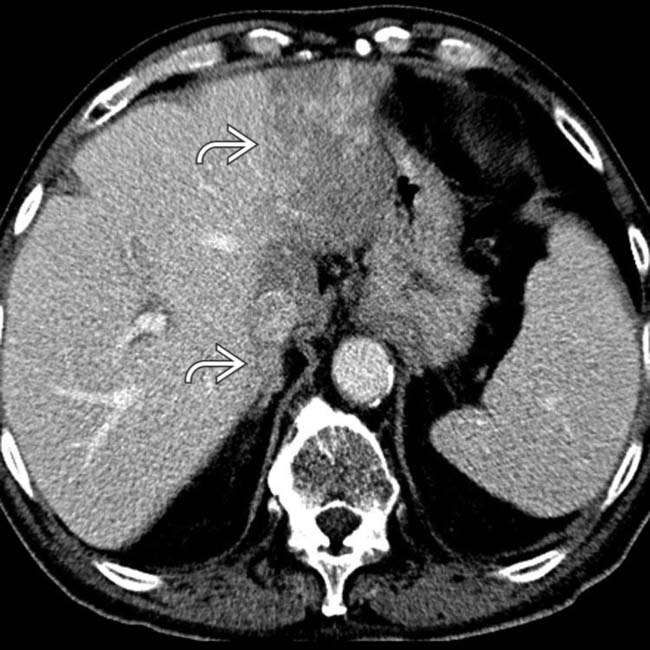
, not corresponding to any anatomical divisions of the liver, all due to radiation hepatitis.
image
(Left) Axial CECT in a 26-year-old woman with hepatic metastases image 
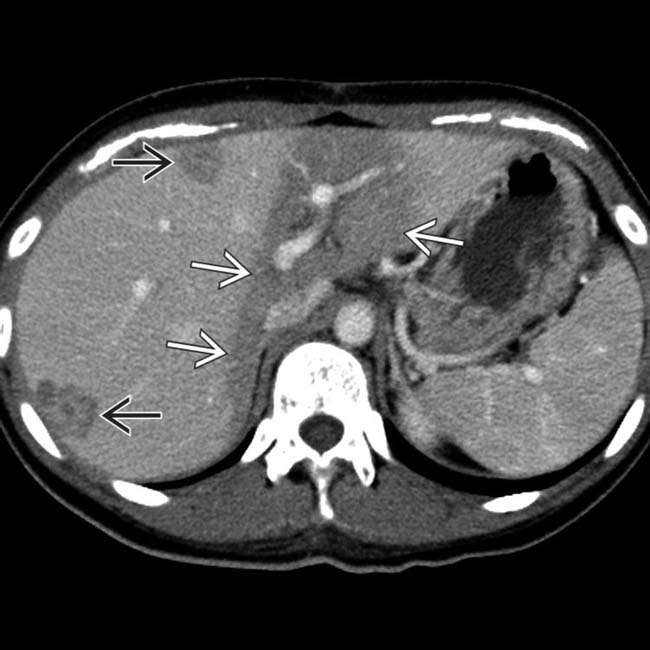
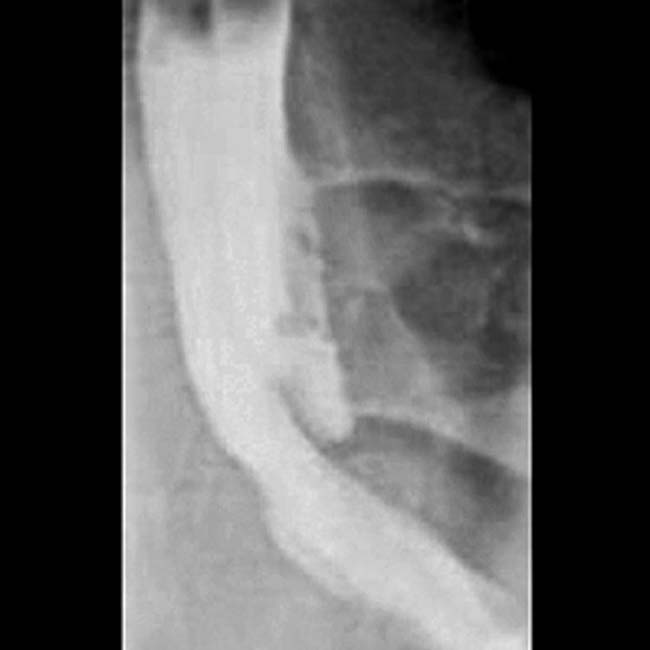
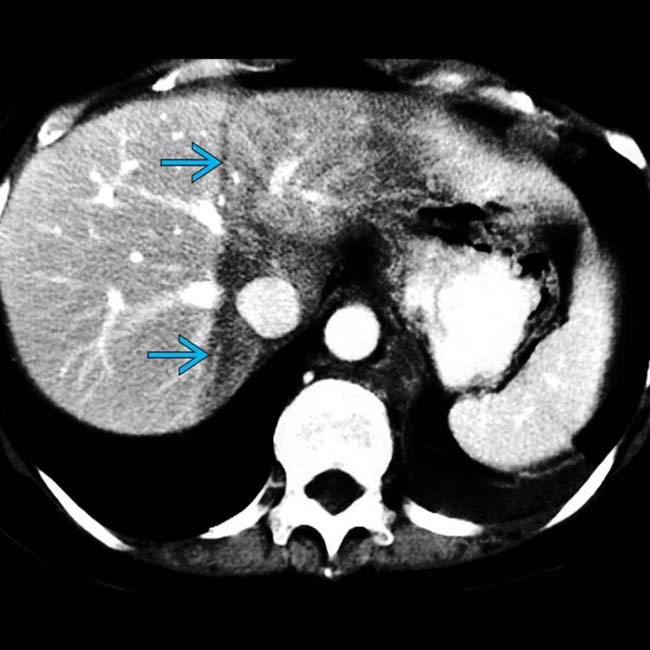
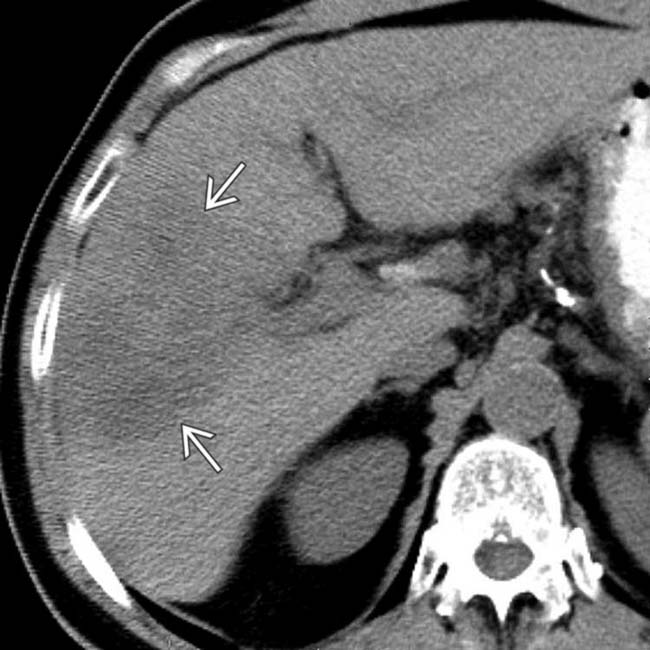
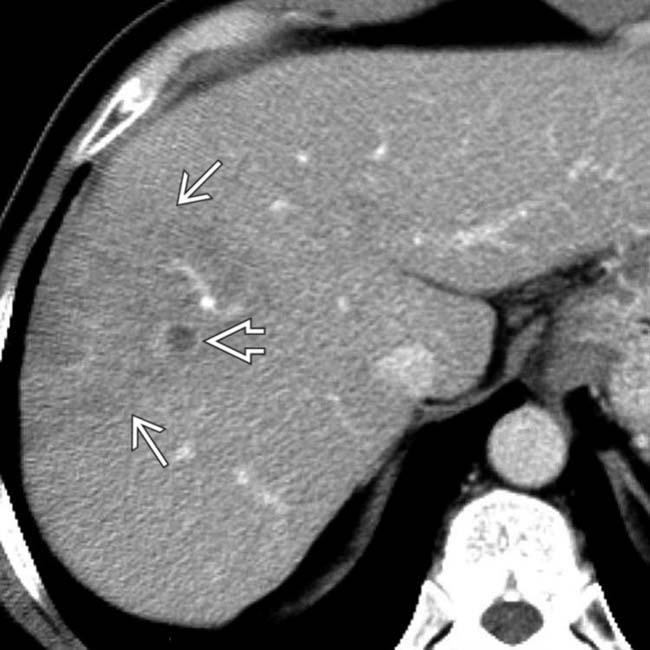
from nasopharyngeal carcinoma shows a peculiar low-attenuation band through the center of the liver image. Note the lack of mass effect on the large hepatic and portal vein branches traversing this zone.

image
(Right) The same CECT section viewed on bone windows shows 1 of the vertebral metastases image 
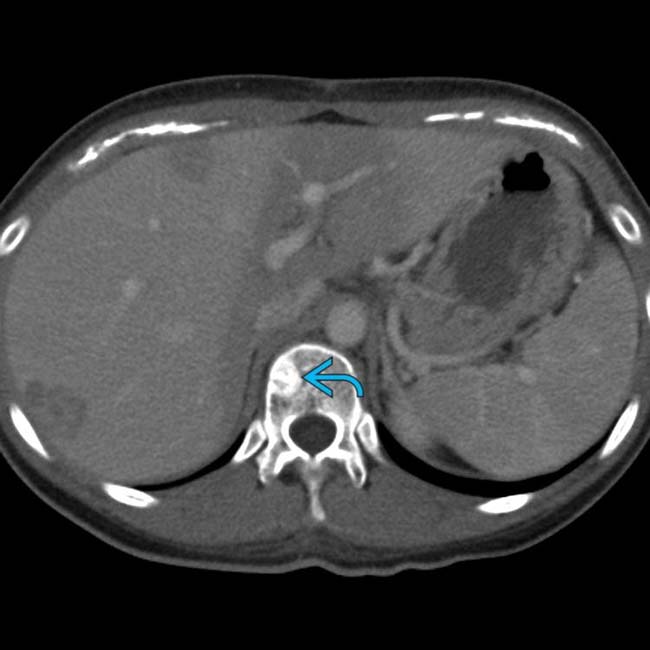
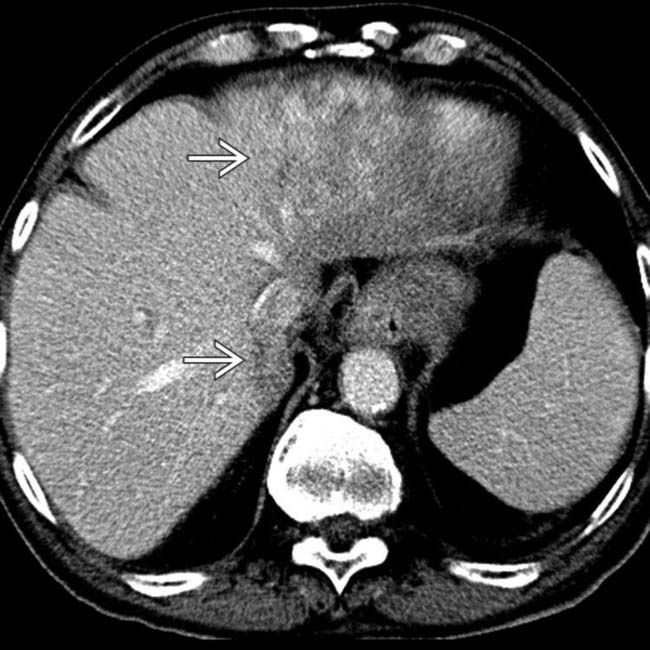
that had been treated with external beam radiation therapy.
image
(Left) Coronal reformatted CT section from the same study shows the band of hypodense liver image 
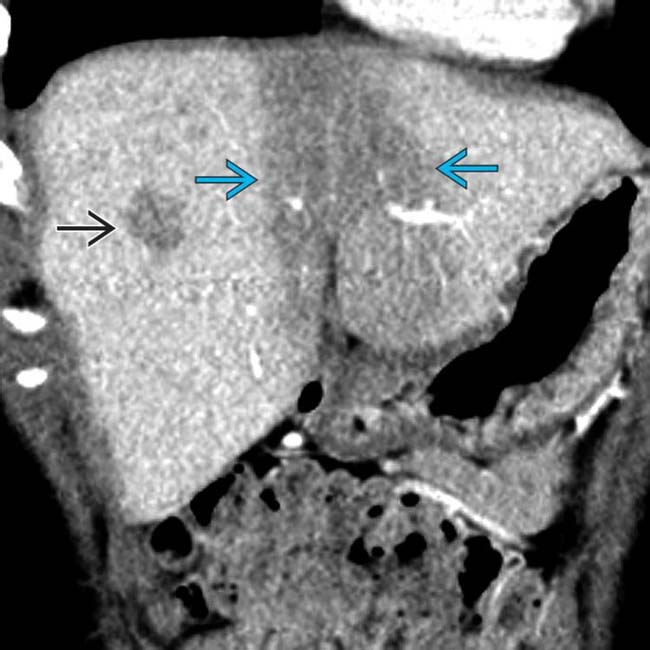
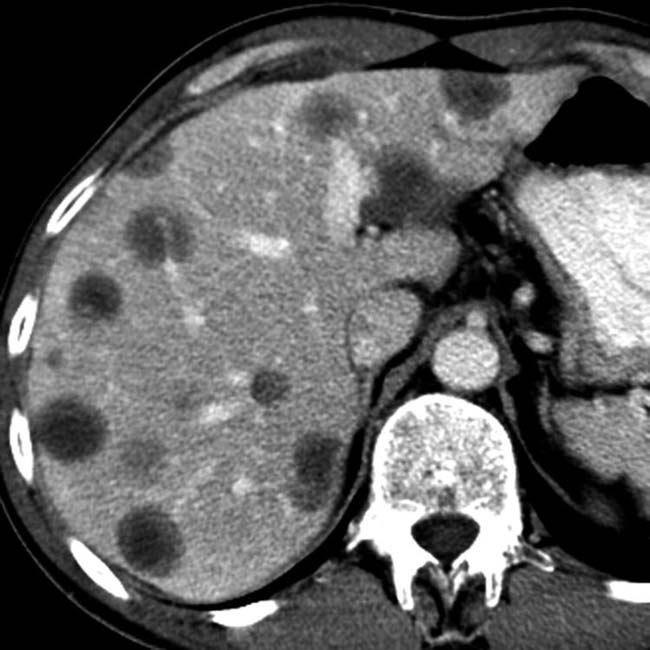
that represents radiation-induced injury. Again, note the lack of mass effect on vessels within the injured liver, as well as hepatic metastases image.

image
(Right) Representative axial CECT section from the same case 4 months later shows resolution of the radiation injury and decreased size of 1 of the hepatic metastases image, the latter representing the effects of chemotherapy rather than the radiation therapy.
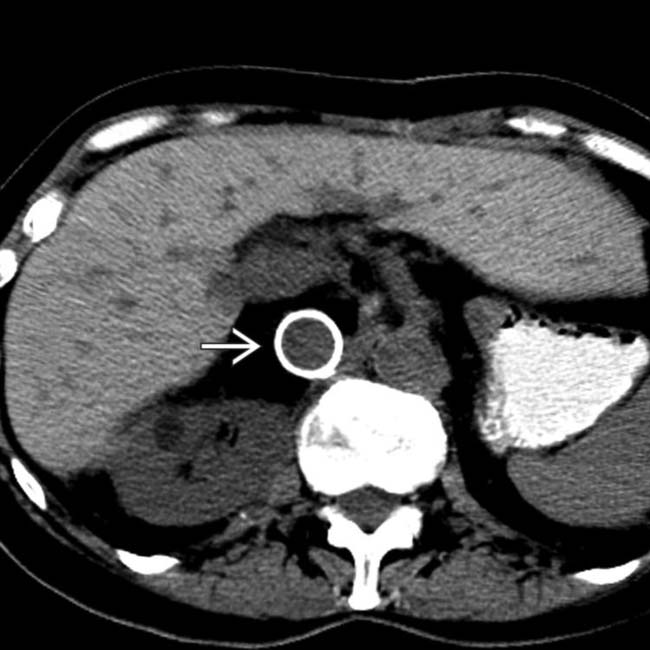
image
Axial NECT following a resection of primary sarcoma of IVC and prior to radiation therapy shows the synthetic graft image.

image
Axial NECT several months after surgical resection and radiation therapy for sarcoma of IVC shows a band of low attenuation and volume loss in the left lobe corresponding to the radiation port.
image
Axial CECT shows a heterogeneous mass image 
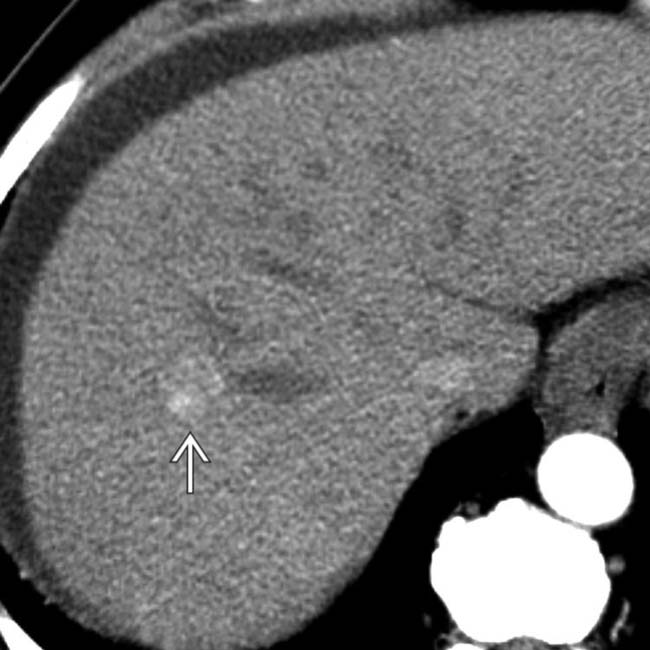
enhancing during the arterial phase, demonstrating hepatocellular carcinoma.
image
Axial CECT shows a patient with hepatocellular carcinoma (HCC) following hepatic arterial embolization of yttrium-90 microspheres. The wedge of hypodensity in segments 5 and 8 represents radiation hepatitis.

Share this: