Chapter 68 Q-T Interval, QT Dynamicity, and QT Variability
Q-T Interval
The Q-T interval includes the QRS complex; nevertheless, the entire Q-T interval is considered a measure of repolarization because the repolarization process already takes place during the QRS complex for the early activated regions of the myocardium.1,2 Because the process of depolarization and repolarization in the myocardium is sequential, certain regions are depolarized earlier and repolarization starts earlier in them compared with other regions. The most optimal approach to quantify the duration of repolarization represented as the Q-T interval is to obtain this measurement simultaneously from all 12 leads of the standard ECG.1,2 The Q-T interval should be measured from the earliest onset of the QRS complex in any lead to the latest offset of the T wave in any lead, thereby providing a total measure of repolarization duration.1–3 This approach is exercised in some automatic algorithms incorporated in ECG machines, but manual measurements of the Q-T interval usually rely on a single lead (most often lead II), which under-represents Q-T interval duration. In the case of a flat T wave in lead II, lead V5 is most frequently chosen as an alternative because electrical forces of V5 resemble those of lead II.
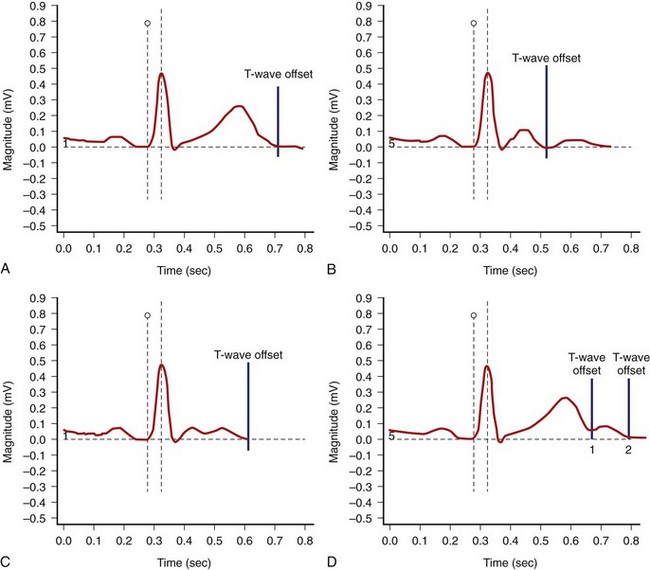
The end of the T wave is defined as the point at which the descending or ascending arm of the T wave terminates, usually at the level of the isoelectric line, or as the nadir between the T and U waves.1–4 When the T and U waves merge or when the T wave has a bifid appearance with two components, careful inspection of repolarization duration in all 12 leads may be helpful in determining the proper approach to quantify the Q-T interval.5,6 In some cases, a QTU duration should be reported, with acknowledgment that the measurement includes a second component that may be part of the T wave or superimposed U wave (Figure 68-1). In case of repolarization morphologies, with the presence of a second component of the T wave or the U wave, some investigators suggest using the rule that the U wave usually should be at least 150 ms behind the peak of the T wave, whereas closer deflections may be considered the second component of the T wave.5,6 However, no systematic data are available to validate this rule.
The Q-T interval duration is different among standard 12 leads, and QT dispersion has been measured in numerous studies as a possible marker of arrhythmogenic conditions.7,8 However, because of the conceptual and methodologic limitations of QT dispersion, this method has not been approved as a standard tool in clinical practice or drug studies. Inter-lead differences in repolarization morphology, rather than just Q-T interval duration, seem to better reflect the complexity of the repolarization process.9–11 Inter-lead differences in repolarization morphology could be quantified by using various methods, including principal component analysis and area-based analysis of the repolarization segment.9–11 Principal component analysis of the repolarization segment allows quantifying the length (λ1) and width (λ2) of the T-wave loop.9,10 The roundness of the T-wave loop in its preferential plane (λ2/λ1) has been considered an index of increased T-wave complexity.
QTc Formulas
Bazett’s formula, describing a curvilinear association between the Q-T and R-R intervals (QTc = QT/[RR1/2]), is most frequently used.12 Fridericia’s formula (QTc = QT/[RR1/3]), or the cubic root formula, is used in studies evaluating the effects of medications on the Q-T interval.13 Both formulas adjust the Q-T interval to reflect repolarization duration at a heart rate of 60 beats/min. Bazett’s QTc formula has limitations of overestimating the repolarization duration at fast heart rates and underestimating it at slow heart rates. Fridericia’s formula causes less misjudgment; however, clinicians are not comfortable using this formula on a daily basis because of the need for a cubic root equation and, more importantly, because of limited clinical data on normal values and the diagnostic and prognostic significance of this measurement. Other QTc formulas have been proposed (Box 68-1).12–17
Box 68-1 Examples of QT Correction Formulas
In drug studies, QTc corrected by Fridericia’s formula is the most frequently used, but the analysis of QT-RR regression based on the subject-specific QT-RR relationship plots is attracting increasing interest.18,19 The RR bin method is yet another approach that measures the Q-T interval in absolute value for matched R-R intervals for recordings off and on drugs without the need for correction formulas.20,21 Both methods are particularly valuable when evaluating drugs affecting heart rates.
Reference QTc Values
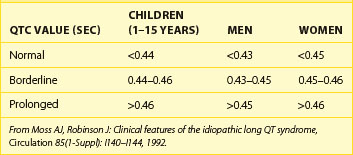
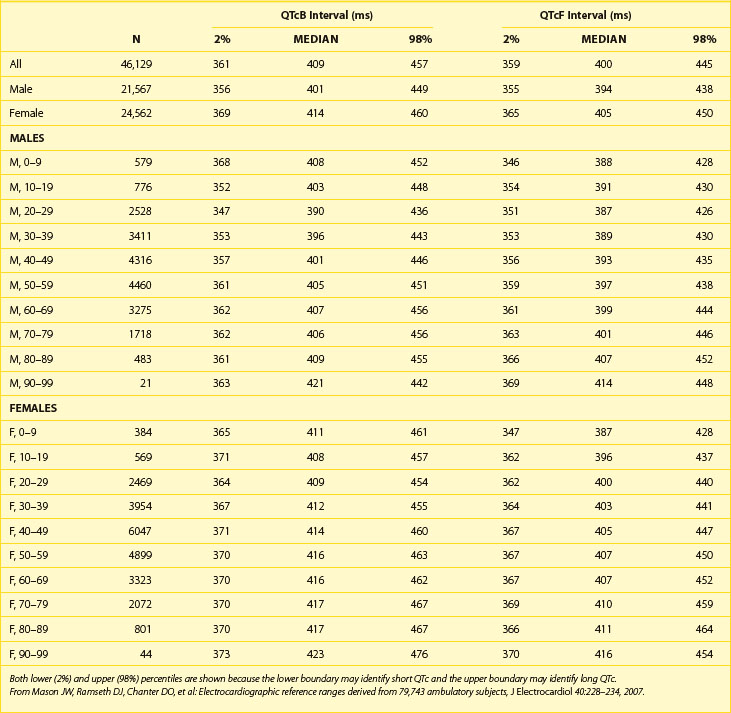
Table 68-1 shows abnormal QTc values (using Bazett heart rate correction) by age and gender. Women and children have a longer duration of repolarization than men.22 Gender-related differences in QT are predominantly caused by a shorter Q-T interval duration in men than women at age 15 to 55 years, not because of Q-T interval prolongation in women.16 Data from a large cohort of more than 46,000 healthy individuals participating in pharmaceutical QT studies, as reported by Mason et al, are fully supportive of the initial ranges of QTc values reported by Moss et al.22,23 Table 68-2 shows values for QTcB (Bazett corrected QTc) and QTcF (Fridericia corrected QTc) for age-specific and gender-specific groups from this large cohort. In general, the 98th percentile value for QTcF is approximately 10 ms shorter than the respective value for QTcB for a given age and gender group. Factors influencing gender differences in QTc duration may include slower heart rate in men, different density of potassium ion channels in the male myocardium versus the female myocardium, effects of female hormones contributing to longer Q-T interval duration in women, and possibly the effect of male hormones contributing to the shorter Q-T interval duration in men. Differences by age also exist, with healthy older adults demonstrating a longer QTc duration compared with younger individuals.
T-Wave Morphology
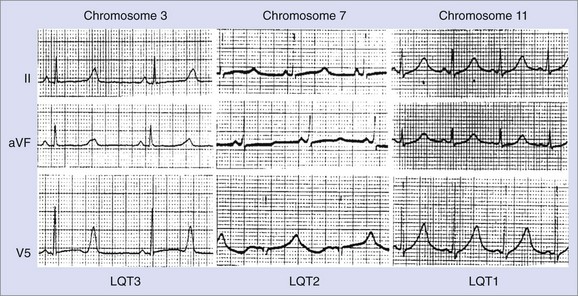
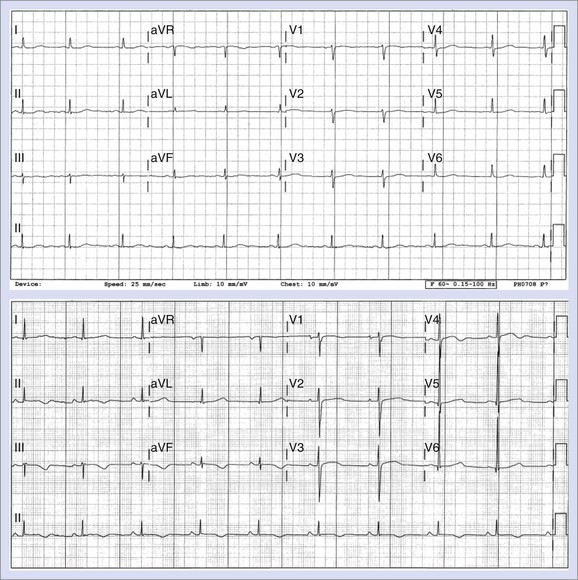
Changes in T-wave morphology are frequently observed in association with myocardial ischemia, hypertrophy, overload, and genetic alterations in repolarization. LQTS shows variations of T-wave morphology, which could be related to the type of affected ion channel and the magnitude of ion channel dysfunction as well as other factors, such as age, heart rate, and the status of the autonomic nervous system. Specific genetic types of LQTS could be associated with distinct ECG patterns of repolarization.24,25 Figure 68-2 shows specific patterns associated with distinct genetic types of the disorder: LQT1, characterized by wide, broad-based T waves; LQT2, usually showing low-amplitude and frequently notched T waves; and LQT3, characterized by a relatively long ST segment followed by a peaked, frequently tall T wave. In the Rochester ECG Core Lab, we use a 3-digit code (Box 68-2), which is a classification to characterize the T wave and the Q-T interval visually.26 The first digit represents a description of T-wave morphology, the second digit provides information about its polarity, and the third digit indicates whether the U wave is present or whether the TU complex should be measured because of the presence of the second component of the T wave or the U wave merging with the T wave. Recognizing abnormal T-wave morphology may be particularly useful in diagnosing patients with borderline QTc duration (420 to 470 ms). In such patients, the presence of an abnormal (notched, flat) T wave may indicate the possibility of LQTS (Figure 68-3).
Box 68-2 Coding of QT/T-Wave Morphology
From Zareba W, Moss AJ, Rosero SZ, et al: Electrocardiographic findings in patients with diphenhydramine overdose, Am J Cardiol 80:1168–1173, 1997.)
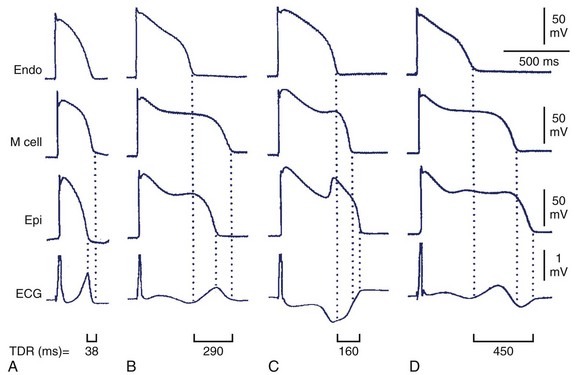
Decreased T-wave amplitude with an increased presence of notches may be observed in drug-induced changes in repolarization. Drug-induced changes in T-wave morphology reflect changes in the transmural gradient of repolarization with propensity to arrhythmogenesis (Figure 68-4).27,28 Therefore the identification of drug-induced changes in repolarization morphology in clinical studies should always trigger attention because those changes may indicate a propensity to proarrhythmia.
Drug-Induced Q-T Interval Prolongation
Several cardiac and noncardiac medications may cause QTc prolongation and cause torsades de pointes (TdP) (Table 68-3).29 They usually block the IKr current, whereas others exert such action if administered together with a drug affecting the function of the cytochrome P-450 enzymatic system. A number of quinidine-induced sudden cardiac deaths (SCDs) and, subsequently, the results of the Cardiac Arrhythmia Suppression Trial (CAST) brought further attention to the proarrhythmic effects of antiarrhythmic drugs.30 The antihistamine drug terfenadine was recognized as the first noncardiac medication causing TdP and SCD.31 Terfenadine blocks the IKr current (as well as the Na+ current and the L-type calcium channel), causing a mean 6-ms QTc prolongation, which should not have clinical implications. Cardiac events were reported in patients taking terfenadine, almost exclusively when used in combination with other medications (ketoconazole, antibiotics) also metabolized by the same enzymatic system of the cytochrome P-450 3A4. Such a combination causes an increase in plasma concentration of terfenadine because of inhibition of its metabolism by a concomitantly administered drug with subsequent substantial QTc prolongation (>60 ms in the majority of reported cases) and TdP. Among noncardiac drugs, several antipsychotic drugs block the IKr current and cause QTc prolongation, and some of them were reported to be associated with SCD.32
| CATEGORY | DRUGS |
|---|---|
| Antihistamines | Astemizole, terfenadine |
| Anti-infectives | Amantadine, clarithromycin, chloroquine, erythromycin, grepafloxacin, moxifloxacin, pentamidine, sparfloxacin, trimethoprim-sulfamethoxazole |
| Anti-neoplastics | Tamoxifen, arsenic trioxide |
| Anti-arrhythmics | Quinidine, sotalol, procainamide, amiodarone, bretylium, disopyramide, flecainide, ibutilide, moricizine, tocainide, dofetilide, ranolazine, vernakalant, and dronedarone |
| Anti-lipemic agents | Probucol |
| Calcium channel blockers | Bepridil |
| Diuretics | Indapamide |
| Gastrointestinal agents | Cisapride |
| Hormones | Fludrocortisone, vasopressin |
| Anti-depressants | Amitriptyline, amoxapine, clomipramine, imipramine, nortriptyline, protriptyline |
| Anti-psychotics | Chlorpromazine, haloperidol, perphenazine, quetiapine, risperidone, sertindole, thioridazine, ziprasidone, doxepin, methadone |
Updated information on QT prolonging drugs can be found at www.qtdrugs.org.
From Zareba W: Drug induced QT prolongation, Cardiol J 14:523–533, 2007.
Box 68-3 lists common factors predisposing to QTc prolongation and TdP.29 Females with faster resting heart rates and a longer QTc interval compared with men are particularly prone to drug-induced TdP. Older patients and those with underlying heart diseases (cardiomyopathies) or electrolyte abnormalities, especially hypokalemia and bradycardia, are particularly at an increased risk for drug-induced QTc prolongation and TdP.
The U.S. Food and Drug Administration (FDA) and the Committee for Proprietary Medicinal Products (CPMP) of the European Agency for the Evaluation of Medicinal Products mandate evaluating all new drugs for their potential QTc-prolonging effects.33,34 Each drug must be evaluated individually after full consideration of the drug’s risks in relation to its benefits for the population at risk. Drugs that show some QTc-prolonging effects in phase I or phase II studies may require further testing in a thorough QT study. The thorough QT study consists of repeated monitoring of QT and RR parameters as well as T-wave morphology during administration of a tested drug and during administration of moxifloxacin, an antibiotic with known QTc-prolonging effects used as a positive control (to validate the ability of the ECG core lab to detect the expected repolarization changes). Drugs with QTc prolongation showing upper confidence intervals exceeding 10 ms may require additional safety measures during the next phases of development, such as specific labeling with regard to the QTc-prolonging effect, or may not be recommended to enter the market.
From Zareba W: Drug induced QT prolongation, Cardiol J 14:523–533, 2007.
QTc Prolongation in Risk Stratification
LQTS was the first entity in which the association between QTc prolongation and arrhythmic events was appreciated.35–39 For every 10-ms increase of QTc duration, a 5% to 7% exponential increase of the risk of cardiac events exists.35–37 LQTS patients with QTc greater than 500 ms are particularly prone to developing cardiac events defined as aborted cardiac arrest or death.40 However, approximately one third of LQTS gene carriers have normal or borderline QTc values, and they may also experience these events.35–40 This indicates that the magnitude of QTc duration is not the only factor when evaluating the risk of arrhythmic events. QTc duration above 500 ms or prolongation by more than 60 ms in response to a drug indicates an increased risk of TdP in the case of drug-induced QTc prolongation.41
Prolonged QTc is also considered a risk factor in other patient populations. In the Rotterdam Study, a cohort of 3105 men and 4878 women aged 55 years and older was observed over several years.42 An abnormal QTc prolongation (>450 ms in men, >470 ms in women) was found to be associated with a threefold increased risk of SCD after adjustment for age, gender, body mass index, hypertension, cholesterol or high-density lipoprotein (HDL) ratio, diabetes mellitus, myocardial infarction (MI), heart failure, and heart rate (Figure 68-5). Data from The Framingham study, however, did not support this association.43 The Cardiovascular Health Study showed an association between QTc of greater than 450 ms and total mortality, and the Strong Heart Study showed that a QTc of 460 ms or greater was associated with a twofold increased risk of SCD and total mortality.44,45
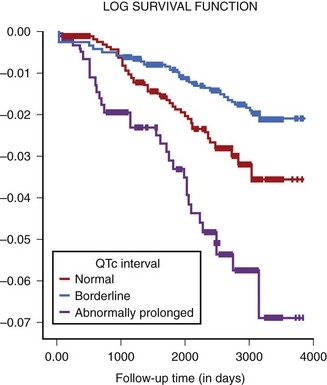
FIGURE 68-5 Risk of sudden death and QTc in older subjects enrolled in the Rotterdam study.
(From Straus SM, Kors JA, De Bruin ML, et al: Prolonged QTc interval and risk of sudden cardiac death in a population of older adults, J Am Coll Cardiol 47:362–367, 2006.)
The predictive value of QTc prolongation in patients with coronary artery disease (CAD) and heart failure is inconsistent.46–51 Most of the studies are not able to confirm the practical usefulness of QTc prolongation for predicting cardiac events in patients with underlying coronary disease and cardiomyopathy because these conditions alter repolarization; therefore QTc prolongation reflects the severity of the disease rather than the risk of cardiac events.46–51
QT Dynamicity
The dependency of the repolarization process on heart rate represents a repolarization dynamic. During exercise, the uncorrected Q-T interval shortens with decreasing R-R intervals. In the case of progressively increasing or decreasing heart rate, the Q-T interval shows a linear correlation with heart rate within physiological limits. However, in cases of abrupt RR changes, the Q-T interval does not change adequately, and a lag of QT adaptation to changing heart rate exists. Abrupt R-R interval changes, especially caused by ventricular premature beats, may precede the onset of ventricular tachycardia (VT). The presence of a short-long-short sequence may prolong the action potential duration (reflected as QTc prolongation on surface ECG), facilitating early afterdepolarizations (EADs) and triggering VT. Adjustment of the QT to changing heart rate is a dynamic phenomenon consisting of fast adaptation and slow adaptation phases. Franz et al showed that after a rapid change in heart rate, the fast adaptation phase of repolarization usually lasts 30 to 60 seconds and is followed by a 2-minute slow adaptation.52 This adjustment also seems highly individual and, among other factors, depends on the nature of heart rate changes. Repolarization adapts faster to increasing heart rate than it does to decreasing heart rate. This differential response is known as repolarization hysteresis.53 Measures of repolarization hysteresis are proposed for diagnosing LQTS in patients who usually show a larger difference in QT duration between exercise and recovery compared with control subjects.54
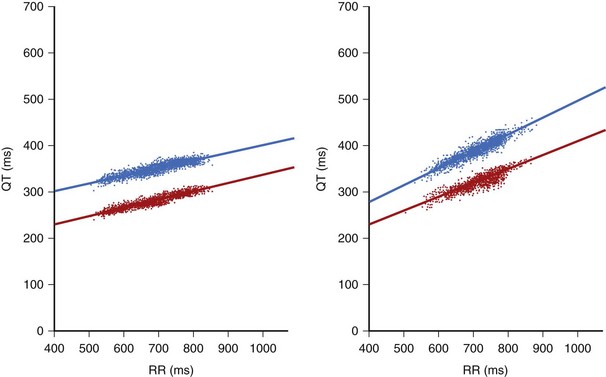
Continuous recording of R-R intervals and corresponding Q-T intervals in Holter recordings brought an increased interest in the analysis of the dynamic behavior of repolarization: the slope of the linear regression between Q-T and R-R intervals (Figure 68-6). Usually, R-R and Q-T intervals included in a 30- or 60-second epoch of the ECG are calculated and averaged to diminish the possible influence of erroneous measurements and to decrease the effect of sudden and short-acting changes in R-R interval on Q-T interval duration.55 These averaged Q-T and R-R intervals may then be linearly fitted from the period of prolonged recording, typically 24 hours of Holter monitoring. Both the QT apex (QTa) and QT end (QTe) can be measured. A steeper slope indicates excessive prolongation of QT at longer R-R cycle lengths and adequate or excessive shortening of QT at shorter R-R cardiac cycles (see Figure 68-6). A flat slope indicates that the Q-T interval is less dependent on the R-R cycle and fails to adequately shorten at faster heart rates (shorter cycle). Both features may contribute to an increased risk of arrhythmias. A steeper QT/RR slope indicates decreased vagal tone and increased sympathetic activity, which may contribute to a higher vulnerability of the myocardium to arrhythmias. Lengthening of the QT at slower rates may be associated with an arrhythmogenic increase in the dispersion of refractoriness in the myocardium, whereas excessive shortening of QT at fast heart rates may facilitate arrhythmia by diminished heterogeneity of refractoriness. QT dynamics reflect both the rate dependence of ventricular repolarization as well as the modulation of this dependence by a variety of factors, such as the autonomic nervous system, hormones, metabolic equilibrium, disease entities, and drugs. A significant diurnal variation of QT/RR has been reported with the QT/RR slope usually evaluated separately for day and night.56
Prognostic Value of QT/RR Slopes
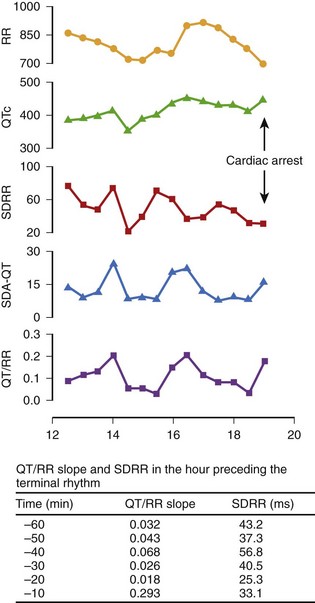
Analysis of Q-T interval duration only by surface ECG may not correspond to what happens in the period directly preceding malignant arrhythmias. Singh et al reported an abrupt increase in the QT/RR slope associated with a prolonged QTc and reduced heart rate variability in the interval immediately preceding the onset of ventricular fibrillation (VF) that led to cardiac arrest in a 71-year old man with hypertension and chronic renal failure.57 The QT/RR slope increased from 0.032 at 60 minutes before VF to 0.293 minutes, as observed 10 minutes before cardiac arrest (Figure 68-7). Sredniawa et al described an abrupt increase in the QT/RR slope (from 0.223 to 0.483) in the period preceding a burst of frequent ventricular ectopic beats on Holter monitoring in patients with CAD and documented cardiac arrest caused by sustained VT.58 Transitory QT lengthening may express a temporal imbalance of the autonomic nervous system, which may lead to heterogeneity of the ventricular refractory periods and may predispose to the development of re-entry phenomena.
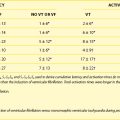
The prognostic value of QT dynamics in predicting cardiac and arrhythmic events was evaluated in several studies. The prognostic value of the QT/RR slope in the prediction of SCD was evaluated by the Groupe d’Etude du Pronostic de l’Infarctus (GREPI) study.59 Abnormal QT/RR slope, evaluated 9 to 14 days after infarction, was found to be an independent risk marker for SCD during an average 7-year follow-up. A steeper QT/RR slope (>0.18 during the day) was associated with total mortality and SCD, indicating that excessive shortening at fast rates, excessive lengthening at slow rates, or both may contribute to arrhythmic events (Figure 68-8). The increased QT/RR slope was the most powerful predictor when tested simultaneously with clinical variables in the Cox multivariate model. Of note, the hazard ratio (HR) was three times higher for SCD than for all-cause mortality (HR, 6.07 vs. 2.25, respectively). In the European Myocardial Infarct Amiodarone Trial (EMIAT) study, QT dynamicity was assessed in patients with prior MI and a left ventricular ejection fraction (LVEF) of 40% or higher and was compared between patients with arrhythmic cardiac death (ACD) and non-ACD during a mean follow-up of 21 months.60 The QT slopes were significantly higher in the ACD group, but only an increased morning QT/RR slope differentiated patients with ACD from those with non-ACD (QT/RR slope, 0.272 vs. 0.239, respectively). Therefore QT dynamicity distinguished patients with prior MI who died of ACD from survivors and also predicted the type of death.
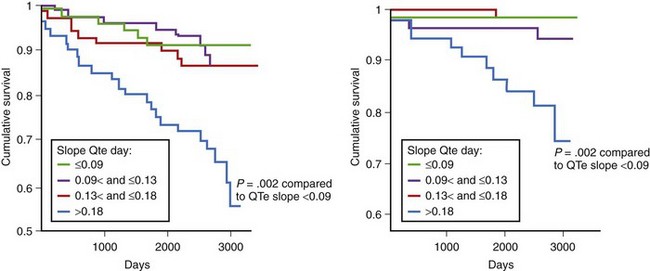
Pathak et al demonstrated that an increased QT/RR slope (>0.28) assessed over 24 hours was predictive for SCD in patients with chronic class II to III heart failure caused by ischemic (43%) or idiopathic (57%) cardiomyopathy with a mean LVEF of 28%.61 Of note, similar to studies in patients with prior MI, abnormal QT dynamicity was related more to SCD than to total mortality. The HR of 24-hour QT dynamicity (QTe) was more than 50% higher for SCD than for total mortality (HR, 3.4 vs. 2.2 in univariate analysis). Analysis of repolarization dynamics was performed in the Multicenter Ultrasound Stenting in Coronaries (MUSIC) study, which analyzed 542 patients with mild to moderate heart failure (49% with ischemic cardiomyopathy; mean LVEF, 37%).62 The mean value of the QTa/RR slope was 0.172, and that of QT/RR was 0.193. During the 44-month follow-up, 119 deaths occurred, including 47 classified as SCDs. Nonsurvivors were characterized by steeper QT/RR slopes. In this study, increased QT/RR slopes during the daytime (>0.20 for QTa and >0.22 for QTe) were independently associated with increased total mortality during an average 44-month follow-up (HR, 1.57 and 1.58 for QTa and QT, respectively) (Figure 68-9). None of the dynamic repolarization parameters was associated with increased risk of SCD.
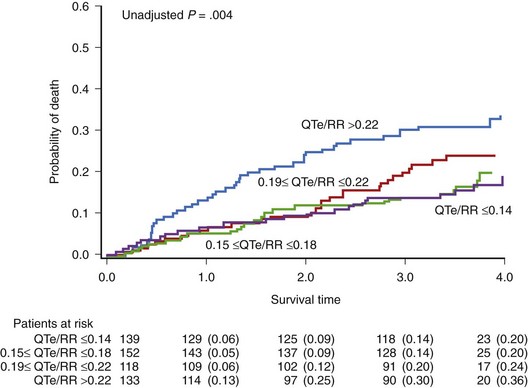
FIGURE 68-9 Probability of death according to the QTe/RR slope value in patients with congestive heart failure.
(From Cygankiewicz I, Zareba W, Vazquez R, et al: Prognostic value of QT/RR slope in predicting mortality in patients with congestive heart failure, J Cardiovasc Electrophysiol 19:1066–1072, 2008.)
The independent prognostic value of QT dynamicity in patients with idiopathic dilated cardiomyopathy was reported by Iacoviello et al, who found that abnormal QT dynamicity was significantly associated with arrhythmic events (VT, VF, or SCD) during a mean 39-month follow-up.63 At multivariate analysis, only the QT slope (>0.19), decreased LVEF, and nonsustained VT were independent predictors of poor outcome.
QT Variability
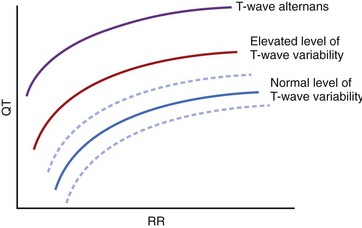
QT variability consists of beat-to-beat changes in repolarization duration and morphology appearing without the 2 : 1 pattern typical of T-wave alternans. Beat-to-beat changes in QT duration and T-wave morphology can easily be seen in post-extrasystolic pauses or significant variations in the R-R interval. However, QT duration varies by milliseconds on a beat-to-beat basis even in healthy subjects with regular heart rates. These beat-to-beat changes in QT duration and T-wave morphology can be quantified by computerized ECG methods. A healthy person has a small level of beat-to-beat variation of action potential duration, mostly related to fluctuations of autonomic modulation.64 QT variability depends on both Q-T and R-R interval duration; QTc prolongation, R-R shortening, or both occurring simultaneously may contribute to excessive QT variability and T-wave alternans (Figure 68-10). QT variability cannot be entirely explained by changes in the autonomic nervous system. Beat-to-beat changes in the action potential duration depend on instantaneous changes in ion channel activity. Even with a stable R-R interval, repolarization changes, caused by variations in the number of involved channels, are possible.65 Cardiomyopathy, ischemia, and LQTS may alter the number of involved channels, and changes in cycle length may further potentiate the beat-to-beat variability of repolarization.
A time-stretching algorithm was developed by Berger et al to quantify changes in repolarization duration and morphology.66 In this method, beat-to-beat Q-T interval variability is measured by 256-second recordings of surface ECGs. A QT variability index (QTVI) is calculated as the logarithm of the ratio of normalized QT variance to heart rate variance. These authors demonstrated that patients with dilated cardiomyopathy had higher QT variability compared with control subjects. Couderc et al developed a T-wave endpoint-independent method to quantify repolarization variability based on wavelet transformation.67 The wavelet-based method showed that patients with LQTS (SCN5A carriers) have significantly increased repolarization variability both in time and amplitude compared with noncarriers.67 Subsequently, our group developed a time-domain technique to quantify T-wave variability based on a beat-to-beat change in T-wave amplitude without the need to identify the end of the T wave.68 The variation of mean amplitude inside each of the four windows encompassing the repolarization segment is analyzed across beats, and the level of variability is computed in each window on the basis of the estimated variance of the average amplitude across beats in the selected window. The square root value is reported and expressed in microvolts. The prognostic significance of this method was validated in the second Multicenter Automatic Defibrillator Implantation Trial (MADIT II) cohort.68 Increased QT variability has been demonstrated in patients with heart failure, dilated cardiomyopathy, hypertrophic cardiomyopathy, coronary disease, or LQTS as well as in patients with anxiety, depression, or panic disorders.69–75 QT variability increases before drug-induced TdP in experimental conditions.76,77 QT variability was also reported to be influenced by external factors such as air pollution.78
Prognostic Value of QT Variability
In 1998, Atiga et al analyzed QTVI in 95 patients undergoing electrophysiological study.79 The QTVI was higher in patients with structural heart disease than in controls (–0.7 ± 0.7 vs. –1.1 ± 0.5; P < .05). It also was higher in patients who died suddenly during a 2-year follow-up period than in other patients with heart disease (0.0 ± 0.6 vs. –0.8 ± 0.5; P < .05). After adjustment for significant clinical covariates, increased QTVI (≥0.1) was the only parameter identifying patients at risk of arrhythmic events (odds ratio [OR], 12.5; P = .004). The event-free survival rate was 67% in patients with QTVI of 0.1 or higher compared with 85% in those with QTVI less than 0.1. Of note, as a predictor, QTVI outperformed the following parameters tested simultaneously in studied patients: QT dispersion, T-wave alternans during atrial pacing, VT inducibility, signal-averaged ECG, heart rate variability, and ejection fraction.
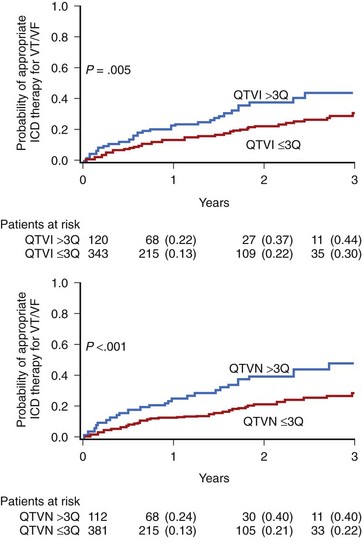
In the MADIT II substudy by Haigney et al, QT variability was assessed in a 10-minute resting ECG recording.80 A high-risk QT variability subgroup was defined by identifying patients from the highest QTVI distribution (>75th percentile). This analysis showed an independent prognostic value of QTVI (>−0.52 log units) to predict an increased risk of arrhythmic events in patients with prior MI and severe left ventricular dysfunction (LVEF <30%). The mean QTVI and QTVN (QT variability numerator) were significantly higher in patients requiring an appropriate therapy for VF or VT (−0.80 ± vs. −0.94 ± 0.60; P = .037; and 0.39 ± 0.59 vs. 0.25 ± 0.56; P = .001 for QTVI and QTVN, respectively) (Figure 68-11). Multivariate Cox analysis showed that both QTVI and QTVN were independent risk factors for VT or VF (HR, 1.80 and 2.18, respectively), after adjustment for significant clinical covariates. Our group developed a new method to estimate T-wave variability that was tested in a group of 275 patients with ICDs from the MADIT II trial. T-wave variability greater than 0.59 µV was an independent risk predictor of ICD therapy for VT or VF.68 Patients with increased T-wave variability had a 47% probability of appropriate ICD therapy compared with 29% in those with T-wave variability of 59 µV or less during a mean 3-year follow-up.
Piccirillo et al demonstrated that abnormal QT variability can identify a high risk of SCD among 396 asymptomatic patients with congestive heart failure caused by ischemic cardiomyopathy with an LVEF between 35% and 40% and New York Heart Association (NYHA) class I.81 A QTVI of 80th percentile or greater (−0.47) indicated a high independent risk for SCD (HR, 4.6; CI, 1.5 to 13.4; P = .006).
QT/RR slope analyses require precise identification of the end of the T wave, whereas both the above-mentioned methods of QT variability—QT variability or lability developed by Berger et al and T-wave variability developed by Couderc et al—do not require precise identification of the end of the T wave because they both rely on quantifying QT and T-wave morphology on a beat-to-beat basis.66,68 At the same time, it must be noted that limitations to quantifying beat-to-beat QT or T-wave variability in recordings with flat T waves, with non-sinus rhythms, or with excessive noise, do exist. T-wave alternans is yet another case of T-wave variability with a 2 : 1 pattern, but this phenomenon is covered elsewhere in this text. Nevertheless, recent data indicate that QT variability, not T-wave alternans, is associated with post-infarction remodeling of the myocardium predisposing to arrhythmogeneicity, further supporting the concept that QT variability is a natural phenomenon suitable for analysis in dynamic ECGs.82
Key References
Berger RD, Kasper EK, Baughman KL, et al. Beat-to-beat QT interval variability. Novel evidence for repolarization lability in ischemic and nonischemic dilated cardiomyopathy. Circulation. 1997;96:1557-1565.
Chevalier P, Burri H, Adeleine P, et al. QT dynamicity and sudden death after myocardial infarction: Results of long term follow up study. J Cardiovasc Electrophysiol. 2002;14:227-233.
de Luna AB. Clinical electrocardiography: A textbook, updated ed 2. Armonk, NY: Futura Publishing Company, Inc; 1998.
Goldenberg I, Moss AJ, Zareba W. QT interval: How to measure it and what is “normal,”. J Cardiovasc Electrophysiol. 2006;17:333-336.
Haigney MC, Zareba W, Gentlesk PJ, et al. QT interval variability and spontaneous ventricular tachycardia or fibrillation in the Multicenter Automatic Defibrillator Implantation Trial (MADIT) II patients, and the MADIT II Investigators. J Am Coll Cardiol. 2004;44:1481-1487.
Kligfield P, Gettes LS, Bailey JJ, et al. Recommendations for the standardization and interpretation of the electrocardiogram: Part I: The electrocardiogram and its technology a scientific statement from the American Heart Association Electrocardiography and Arrhythmias Committee, Council on Clinical Cardiology; the American College of Cardiology Foundation; and the Heart Rhythm Society endorsed by the International Society for Computerized Electrocardiology. J Am Coll Cardiol. 2007;49:1109-1127.
Krahn AD, Klein GJ, Yee R. Hysteresis of the RT interval with exercise. A new marker for the long QT syndrome? Circulation. 1997;96:1551-1556.
Mason JW, Ramseth DJ, Chanter DO, et al. Electrocardiographic reference ranges derived from 79,743 ambulatory subjects. J Electrocardiol. 2007;40:228-234.
Moss AJ, Robinson J. Clinical features of the idiopathic long QT syndrome. Circulation. 1992;85(1-Suppl):I140-I144.
Moss AJ, Zareba W, Benhorin J, et al. ECG T-wave patterns in genetically distinct forms of the hereditary long QT syndrome. Circulation. 1995;92:2929-2934.
Pérez Riera AR, Ferreira C, Filho CF, et al. The enigmatic sixth wave of the electrocardiogram: The U wave. Cardiol J. 2008;15:408-421.
Priori SG, Mortara DW, Napolitano C, et al. Evaluation of the spatial aspects of T-wave complexity in the long-QT syndrome. Circulation. 1997;96:3006-3012.
Rautaharju PM, Zhou SH, Wong S, et al. Sex differences in the evolution of electrocardiographic QT interval with age. Can J Cardiol. 1992;8:690-695.
Zareba W. Drug induced QT prolongation. Cardiol J. 2007;14:523-533.
Zareba W, Moss AJ, Schwartz PJ, et al. Influence of genotype on the clinical course of the long-QT syndrome. International Long-QT Syndrome Registry Research Group. N Engl J Med. 1998;339:960-965.
1 de Luna AB. Clinical electrocardiography: A textbook, updated ed 2. Armonk, NY: Futura Publishing Company, Inc; 1998.
2 Kligfield P, Gettes LS, Bailey JJ, et al. Recommendations for the standardization and interpretation of the electrocardiogram: Part I: The electrocardiogram and its technology a scientific statement from the American Heart Association Electrocardiography and Arrhythmias Committee, Council on Clinical Cardiology; the American College of Cardiology Foundation; and the Heart Rhythm Society endorsed by the International Society for Computerized Electrocardiology. J Am Coll Cardiol. 2007;49:1109-1127.
3 Moss A. Measurement of the QT interval and the risk associated with QTc interval prolongation: A review. Am J Cardiol. 1993;72:23B-25B.
4 Goldenberg I, Moss AJ, Zareba W. QT interval: How to measure it and what is “normal,”. J Cardiovasc Electrophysiol. 2006;17:333-336.
5 Lepeschkin E. The U wave of the electrocardiogram. Mod Concepts Cardiovasc Dis. 1969;38:39-45.
6 Pérez Riera AR, Ferreira C, Filho CF, et al. The enigmatic sixth wave of the electrocardiogram: The U wave. Cardiol J. 2008;15:408-421.
7 Zareba W, Moss AJ, le Cessie S. Dispersion of ventricular repolarization and arrhythmic cardiac death in coronary artery disease. Am J Cardiol. 1994;74:550-553.
8 Zareba W. Dispersion of repolarization: Time to move beyond QT dispersion. Ann Noninvasive Electrocardiol. 2000;5:373-381.
9 Priori SG, Mortara DW, Napolitano C, et al. Evaluation of the spatial aspects of T-wave complexity in the long-QT syndrome. Circulation. 1997;96:3006-3012.
10 Okin PM, Devereux RB, Fabsitz RR, et al. : Principal component analysis of the T wave and prediction of cardiovascular mortality in American Indians: The Strong Heart Study. Circulation. 2002;105:714-719.
11 Couderc JP, McNitt S, Xia J, et al. Repolarization morphology in adult LQT2 carriers with borderline prolonged QTc interval. Heart Rhythm. 2006;3:1460-1466.
12 Bazett HC. An analysis of time relations of electrocardiograms. Heart. 1920;7:353-367.
13 Fridericia LS. Duration of systole in electrocardiogram. Acta Med Scand. 1920;53:469-475.
14 Sagie A, Larson MG, Goldberg RJ, et al. An improved method for adjusting the QT interval for heart rate (the Framingham Heart Study). Am J Cardiol. 1992;70:797-801.
15 Hodges M, Salerno D, Erlien D. Bazett’s QT correction reviewed: Evidence that a linear QT correction for heart rate is better. J Am Coll Cardiol. 1983;1:694.
16 Rautaharju PM, Zhou SH, Wong S, et al. Sex differences in the evolution of electrocardiographic QT interval with age. Can J Cardiol. 1992;8:690-695.
17 Karjalainen J, Viitasalo M, Manttari M, et al. Relation between QT intervals and heart rates from 40-to 120 beats/min in rest electrocardiogram of men and a simple method to adjust QT interval values. J Am Coll Cardiol. 1994;23:1547-1553.
18 Batchvarov VN, Ghuran A, Smetana P, et al. QT-RR relationship in healthy subjects exhibits substantial intersubject variability and high intrasubject stability. Am J Physiol Heart Circ Physiol. 2002;282:H2356-H2363.
19 Malik M, Hnatkova K, Batchvarov V. Differences between study-specific and subject-specific heart rate corrections of the QT interval in investigations of drug induced QTc prolongation. Pacing Clin Electrophysiol. 2004;27:791-800.
20 Extramiana F, Maison-Blanche P, Haggui A, et al. Control of rapid heart rate changes for electrocardiographic analysis: Implications for thorough QT studies. Clin Cardiol. 2006;29:534-539.
21 Fossa AA, Zhou M. Assessing QT prolongation and electrocardiography restitution using a beat-to-beat method. Cardiol J. 2010;17:230-243.
22 Moss AJ, Robinson J. Clinical features of the idiopathic long QT syndrome. Circulation. 1992;85(1-Suppl):I140-I144.
23 Mason JW, Ramseth DJ, Chanter DO, et al. Electrocardiographic reference ranges derived from 79,743 ambulatory subjects. J Electrocardiol. 2007;40:228-234.
24 Moss AJ, Zareba W, Benhorin J, et al. ECG T-wave patterns in genetically distinct forms of the hereditary long QT syndrome. Circulation. 1995;92:2929-2934.
25 Yan GX, Antzelevitch C. Cellular basis for the normal T wave and the electrocardiographic manifestations of the long-QT syndrome. Circulation. 1998;98:1928-1936.
26 Zareba W, Moss AJ, Rosero SZ, et al. Electrocardiographic findings in patients with diphenhydramine overdose. Am J Cardiol. 1997;80:1168-1173.
27 Emori T, Antzelevitch C. Cellular basis for complex T waves and arrhythmic activity following combined IKr and IKs block. J Cardiovasc Electrophysiol. 2001;12:1369-1378.
28 Liu T, Brown BS, Wu Y, et al. : Blinded validation of the isolated arterially perfused rabbit ventricular wedge in preclinical assessment of drug-induced proarrhythmias. Heart Rhythm. 2006;3:948-956.
29 Zareba W. Drug induced QT prolongation. Cardiol J. 2007;14:523-533.
30 The CAST Investigators. Increased mortality due to encainide or flecainide in a randomized trial of arrhythmia suppression after myocardial infarction. N Engl J Med. 1989;321:406-412.
31 Woosley RL, Chen Y, Freiman JP, Gillis RA. Mechanism of the cardiotoxic actions of terfenadine. JAMA. 1993;269:1532-1536.
32 Zareba W, Lin D. Anti-psychotic Drugs and QT interval prolongation. Psychiatric Quarterly. 2003;74:291-306.
33 Haverkamp W, Breithardt G, Camm AJ, et al. The potential for QT prolongation and proarrhythmia by non-antiarrhythmic drugs: Clinical and regulatory implications: Report on a policy conference of the European Society of Cardiology. Eur Heart J. 2000;21:1216-1231.
34 International Conference on Harmonisation. Guidance on E14 clinical evaluation of QT/QTC interval prolongation and proarrhythmic potential for non-antiarrhythmic drugs availability. Fed Regist. 2005;70:61134-61135.
35 Moss AJ, Schwartz PJ, Crampton RS, et al. The long QT syndrome. Prospective longitudinal study of 328 families. Circulation. 1991;84:1136-1144.
36 Zareba W, Moss AJ, le Cessie S, et al. Risk of cardiac events in family members of patients with long QT syndrome. J Am Coll Cardiol. 1995;26:1685-1691.
37 Zareba W, Moss AJ, Schwartz PJ, et al. Influence of genotype on the clinical course of the long-QT syndrome. International Long-QT Syndrome Registry Research Group. N Engl J Med. 1998;339:960-965.
38 Priori SG, Schwartz PJ, Napolitano C, et al. Risk stratification in the long-QT syndrome. N Engl J Med. 2003;348:1866-1874.
39 Zareba W, Cygankiewicz I. Long QT syndrome and short QT syndrome. Prog Cardiovasc Dis. 2008;51:264-278.
40 Sauer AJ, Moss AJ, McNitt S, et al. Long QT syndrome in adults. J Am Coll Cardiol. 2007;49:329-337.
41 Fenichel RR, Malik M, Antzelevitch C, et al. Drug-induced torsade de pointes and implications for drug development. J Cardiovasc Electrophysiol. 2004;15:475-495.
42 Straus SM, Kors JA, De Bruin ML, et al. Prolonged QTc interval and risk of sudden cardiac death in a population of older adults. J Am Coll Cardiol. 2006;47:362-367.
43 Goldberg RJ, Bengtson J, Chen ZY, et al. Duration of the QT interval and total and cardiovascular mortality in healthy persons (the Framingham Heart Study experience). Am J Cardiol. 1991;67:55-58.
44 Robbins J, Nelson JC, Rautaharju PM, Gottdiener JS. The association between the length of the QT interval and mortality in the cardiovascular health study. Am J Med. 2003;115(9):689-694.
45 Okin PM, Devereux RB, Howard BV, et al. : Assessment of QT interval and QT dispersion for prediction of all-cause and cardiovascular mortality in American Indians: The Strong Heart Study. Circulation. 2000;101:61-66.
46 Algra A, Tijssen JG, Roelandt JR, et al. QTc prolongation measured by standard 12-lead electrocardiography is an independent risk factor for sudden death due to cardiac arrest. Circulation. 1991;83:1888-1894.
47 Attar MN, Wong K, Groves DG, et al. Clinical implications of QRS duration and QT peak prolongation in patients with suspected coronary disease referred for elective cardiac catheterization. Ann Noninvasive Electrocardiol. 2008;13:106-112.
48 Davey P. QT interval and mortality from coronary artery disease. Prog Cardiovasc Dis. 2000;42:359-384.
49 Davey P. QT interval lengthening in cardiac disease relates more to left ventricular systolic dysfunction than to autonomic function. Eur J Heart Fail. 2000;2:265-271.
50 Montanez A, Ruskin JN, Hebert PR, et al. : Prolonged QTc interval and risks of total and cardiovascular mortality and sudden death in the general population: A review and qualitative overview of the prospective cohort studies. Arch Intern Med. 2004;164:943-948.
51 Breidthardt T, Christ M, Matti M, et al. QRS and QTc interval prolongation in the prediction of long-term mortality of patients with acute destabilised heart failure. Heart. 2007;93:1093-1097.
52 Franz MR, Swerdlow CD, Liem LB, et al. Cycle length dependence of human action potential in vivo. Effects of single extrastimuli, sudden sustained rate acceleration and deceleration, and different steady-state frequencies. J Clin Invest. 1988;82:972-979.
53 Lau CP, Freedman AR, Fleming S, et al. Hysteresis of the ventricular paced QT interval in response to abrupt changes in pacing rate. Cardiovasc Res. 1988;22:67-72.
54 Krahn AD, Klein GJ, Yee R. Hysteresis of the RT interval with exercise. A new marker for the long QT syndrome? Circulation. 1997;96:1551-1556.
55 Badilini F, Maison-Blanche P, Childers R, et al. QT interval analysis on ambulatory electrocardiogram recordings. A selective beat averaging approach. Med Biol Eng Comput. 1999;37:71-79.
56 Extramiana F, Maison-Blanche P, Haggui A, et al. Control of rapid heart rate changes for electrocardiographic analysis: Implications for thorough QT studies. Clin Cardiol. 2006;29:534-539.
57 Singh JP, Sleight P, Kardos A, Hart G. QT interval dynamics and heart rate variability preceding a case of cardiac arrest. Heart. 1997;77:375-377.
58 Sredniawa B, Jarski P, Musialik-Lydka A, et al. QT dynamics and the risk of sudden arrhythmic cardiac death in ischemic heart disease. Pacing Clin Electrophysiol. 2004;27(Pt1):827-828.
59 Chevalier P, Burri H, Adeleine P, et al. QT dynamicity and sudden death after myocardial infarction: Results of long term follow up study. J Cardiovasc Electrophysiol. 2002;14:227-233.
60 Milliez P, Leenhardt A, Maison Blanche P, et al. : Usefulness of ventricular repolarization dynamicity in patients with ischemic cardiomyopathy (from the European Myocardial Infarct Amiodarone Trial). Am J Cardiol. 2005;95:821-826.
61 Pathak A, Curnier D, Fourcade J, et al. : QT dynamicity: A prognostic factor for sudden death in chronic heart failure. Eur J Heart Fail. 2005;7:269-275.
62 Cygankiewicz I, Zareba W, Vazquez R, et al. Prognostic value of QT/RR slope in predicting mortality in patients with congestive heart failure. J Cardiovasc Electrophysiol. 2008;19:1066-1072.
63 Iacoviello M, Forleo C, Guida P, et al. Ventricular repolarization dynamicity provides independent prognostic information toward major arrhythmic events in patients with idiopathic dilated cardiomyopathy. J Am Coll Cardiol. 2007;50:225-231.
64 Zareba W. QT-RR slope: Dynamics of repolarization in the risk stratification. J Cardiovasc Electrophysiol. 2003;14:234-235.
65 Zareba W, Badilini F, Moss AJ. Automatic detection of spatial and dynamic heterogeneity of repolarization. J Electrocardiol. 1994;27(Suppl):66-72.
66 Berger RD, Kasper EK, Baughman KL, et al. Beat-to-beat QT interval variability. Novel evidence for repolarization lability in ischemic and nonischemic dilated cardiomyopathy. Circulation. 1997;96:1557-1565.
67 Couderc JP, Zareba W, Burattini L, Moss AJ. Beat-to-beat repolarization variability in LQTS patients with SCN5A sodium channel gene mutation. Pacing Clin Electrophysiol. 1999;22:1581-1592.
68 Couderc JP, Zareba W, McNitt S, et al. Repolarization variability in the risk stratification of MADIT II patients. Europace. 2007;9:717-723.
69 Vrtovec B, Starc V, Starc R. Beat-to-beat QT interval variability in coronary patients. J Electrocardiol. 2000;33:119-125.
70 Cuomo S, Marciano F, Migaux ML, et al. Abnormal QT interval variability in patients with hypertrophic cardiomyopathy: can syncope be predicted? J Electrocardiol. 2004;37:113-119.
71 Hiromoto K, Shimizu H, Mine T, et al. Correlation between beat-to-beat QT interval variability and impaired left ventricular function in patients with previous myocardial infarction. Ann Noninvasive Electrocardiol. 2006;11:299-305.
72 Desai N, Raghunandan DS, Mallavarapu M, et al. Beat-to-beat heart rate and QT variability in patients with congestive cardiac failure: Blunted response to orthostatic challenge. Ann Noninvasive Electrocardiol. 2004;9:323-329.
73 Yeragani VK, Tancer M, Uhde T. Heart rate and QT interval variability: Abnormal alpha-2 adrenergic function in patients with panic disorder. Psychiatry Res. 2003;121:185-196.
74 Carney RM, Freedland KF, Stein P, et al. Effects of depression on QT interval variability after myocardial infarction. Psychosomatic Med. 2003;65:177-180.
75 Haigney MC, Alam S, Tebo S, et al. Intravenous cocaine and QT variability. J Cardiovasc Electrophysiol. 2006;17:610-616.
76 Thomsen MB, Volders PG, Beekman JD, et al. Beat-to-beat variability of repolarization determines proarrhythmic outcome in dogs susceptible to drug-induced torsades de pointes. J Am Coll Cardiol. 2006;48:1268-1276.
77 Thomsen M, Oros A, Schoenmakers M, et al. Proarrhythmic electrical remodeling is associated with increased beat-to-beat variability of repolarization. Cardiovasc Res. 2007;73:521-530.
78 Henneberger A, Zareba W, Ibald-Mulli A, et al. Repolarization changes induced by air pollution in ischemic heart disease patients. Environ Health Perspect. 2005;113:440-446.
79 Atiga WL, Calkins H, Lawrence JH, et al. Beat-to-beat repolarization lability identifies patients at risk for sudden cardiac death. J Cardiovasc Electrophysiol. 1998;9:899-908.
80 Haigney MC, Zareba W, Gentlesk PJ, et al. and the MADIT II Investigators: QT interval variability and spontaneous ventricular tachycardia or fibrillation in the Multicenter Automatic Defibrillator Implantation Trial (MADIT) II patients. J Am Coll Cardiol. 2004;44:1481-1487.
81 Piccirillo G, Magri D, Matera S, et al. QT variability strongly predicts sudden cardiac death in asymptomatic subjects with mild or moderate left ventricular dysfunction: A prospective study. Eur Heart J. 2007;28:1344-1350.
82 Floré V, Claus P, Antoons G, et al. Microvolt T-wave alternans and beat-to-beat variability of repolarization during early post-ischemic remodeling in a pig heart. Heart Rhythm. 2011;8(7):1050-1057.