CHAPTER 340 Prognosis after Traumatic Brain Injury
Prognosis is an essential element of medicine, and estimates of prognosis are a frequent component in clinical decision making. Therapeutic and diagnostic actions all aim to improve prognosis. In ancient Greece, the quality of care was judged not so much by the result of treatment but rather by whether the result was as the doctor had predicted. Much interest has been focused on prognosis after traumatic brain injury (TBI), but it has always been considered difficult to say what the probable course of events will be in an individual patient. A seminal advance in the field of prognostic analysis in TBI was provided by the Glasgow group in the 1970s after the classic papers on the Glasgow Coma Scale (GCS),1 which allows quantification of impairment of consciousness, and the Glasgow Outcome Scale (GOS),2 which standardizes the assessment of outcome after severe brain damage.
Estimates derived from evidence-based analysis of large datasets are preferable to relying on the “gut” feeling of a physician, whose experience, no matter how vast, can never match the information contained in the data from thousands of patients entered into a database. Physicians’ estimates of prognosis are often unduly optimistic, unnecessarily pessimistic, or inappropriately ambiguous.3–6 Perhaps, however, the greatest application of prognostic analysis is not at the level of the individual patient but rather at the “group” level for quantifying and classifying the severity of brain injury, as a reference for evaluating quality of care, and for stratification and covariate adjustment in clinical trials.
Methodologic Issues in Prognostic Studies
Predictors
In many studies, continuous or categorical predictors are collapsed into a binary variable by using threshold values. For example, the association between age and outcome has frequently been analyzed at a threshold value of 50 years. This approach has disadvantages.7 First, it is unnatural: would risks really be very different for patients who had their 50th birthday yesterday versus having their birthday tomorrow? In addition, a patient 30 years of age may have a different risk than a patient 49 years old. Yet both are below a threshold of 50. Second, from a methodologic perspective, collapsing an ordinal or continuous scale into a binary variable (dichotomization) leads to loss of information and is therefore statistically inefficient. In general, it is better to exploit the full information available. The same principle applies to the approach to analysis of outcome.
Missing Data
The best solution for missing values is of course to ensure that no data are missing. If we nonetheless have missing data, a common statistical approach is to delete patients with missing values from the analysis. This is often referred to as a complete case analysis.8,9 Complete case analysis discards information from patients who have information on some (but not all) predictors. It is hence statistically inefficient, especially when we consider multiple predictors. Moreover, complete case analysis may lead to bias because of systematic differences between patients with complete and patients with missing data. Bias occurs when absence of a predictor is associated in some way with the outcome.10
Most statisticians now agree that we may opt for a more sophisticated statistical approach to deal with missing values in predictive regression models: single or multiple imputation.11 Imputation methods substitute the missing values with plausible values so that the completed data can then be analyzed with standard statistical techniques. As in any statistical analysis, sensible judgement of the analyst based on knowledge of the subject and the research question is important. In practice, many clinicians are unaware of the problems inherent in complete case analyses and are ignorant of modern developments for dealing with missing data, in particular, the use of multiple imputation methods.
Outcome Measures for Prognostic Studies in Patients with Traumatic Brain Injury
Most, if not all prognostic studies of TBI have used the GOS or mortality as end points. In most cases the GOS, which may be considered an ordinal scale with five categories, was collapsed into a dichotomous variable differentiating unfavorable from favorable outcome (Table 340-1). In the use of a dichotomous outcome measure, statistical power is greatest when there is a 50 : 50 distribution between outcome categories.
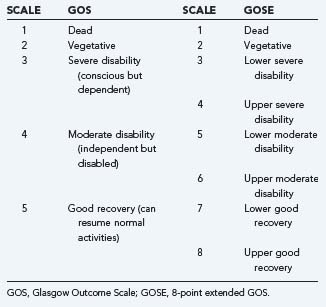
In TBI it is better to quantify prognostic effects across the full range of the GOS rather than after dichotomization into a binary variable. For this purpose, proportional odds methodology is appropriate.12 The 8-point extended GOS (GOSE) has been introduced to increase the sensitivity of outcome assessment. The use of a structured interview is further advocated to obtain more consistency in outcome assignment.13 In severe TBI, the outcome distribution according to the 5-point GOS is U shaped, with most patients either in the lowest (dead) or highest (good recovery) categories. This U-shaped distribution of outcome has promoted the common practice of dichotomizing the GOS for analysis. There is still insufficient knowledge on how introduction of the GOSE may have changed the outcome distribution. It should be noted that the potentially increased sensitivity of the GOSE is totally lost when this is again dichotomized to a binary scale.
Despite the increased sensitivity of the GOSE, it remains a fairly global scale with broad categories aiming to capture functional reintegration without discriminating between physical and mental disabilities. More specific tools for outcome assessment include the Functional Independence Measure (FIM),14 neuropsychological tests, and quality-of-life assessments. The FIM is considered more appropriate for monitoring the course of a patient through rehabilitation, and neuropsychological tests are considered mandatory for assessing cognitive function, which is so often disturbed after TBI. Generic health-related quality-of-life measures, such as the 36-item short-form health survey (SF-36), are routinely used in many fields of medicine but have not yet become common in assessment of outcome after TBI. These generic health scales may not actually capture relevant domains after TBI, and for this reason the disease specific QOLIBRI scale (Quality of Life after Brain Injury) has been introduced.15 By definition, quality-of-life scales report the subjective experience of the patient or caretaker and consequently provide a different perspective from the possibly more objective assessment by health care professionals. Currently, there is much interest in the development of composite outcome measures for TBI in which the advantages of more detailed information from the components can be summarized. Further research is required to determine the ultimate benefits from this approach, both for prognostic analysis and in the context of clinical trial design.
Approaches to Prognostic Analysis
The relationship between predictors and outcome can be quantified in several ways (Tables 340-2 and 340-3).
| MEASURE | DEFINITION | INTERPRETATION |
|---|---|---|
Relative risk (RR) |
Risk for outcome in a group with a predictor/Risk for outcome without a predictor | For example, an RR of 2 means that the group with the predictor has twice the risk of the group without the predictor. When the predictor is continuous, RR represents the increase per unit |
Odds ratio (OR) |
Ratio of the odds for a better versus a poorer outcome in the presence of the parameter (a/b) as compared with the odds in the absence of the parameter (c/d) | If the prognostic factor is not associated with outcome, the OR will be 1. In reporting the OR, the 95% confidence interval (CI) is frequently included. Statistical significance of the relationship is present if the CI does not include the value 1 |
R2 |
Model sum of squares/Total sum of squares (Sum of squares is parameters of the regression model) | Percentage of variability in the outcome that is explained by the predictor or predictors |
Sensitivity |
Number of true positives/Total number with the outcome | Proportion of patients with the outcome who have the predictor (true positive) |
Specificity |
Number of true negatives/Total number without the outcome | Proportion of patients without the outcome who do not have the predictor (true negative) |
Positive predictive value (PPV) |
Number of true positives/Number of positives | Proportion of patients with the predictor who do have the outcome |
Negative predictive value (NPV) |
Number of true negatives/Number of negatives | Proportion of patients without the predictor who do not have the outcome. |
Data from Vittinghoff E. Regression Methods in Biostatistics: Linear, Logistic, Survival, and Repeated Measures Models. New York: Springer; 2005; and Altman DG. Practical Statistics for Medical Research. New York: Chapman & Hall; 1991.
TABLE 340-3 2 × 2 Table for Explanation of Performance Measures
| DEAD | ALIVE | |
|---|---|---|
| Predictor present | a | b |
| Predictor absent | c | d |
Building Blocks for Prognostic Analysis
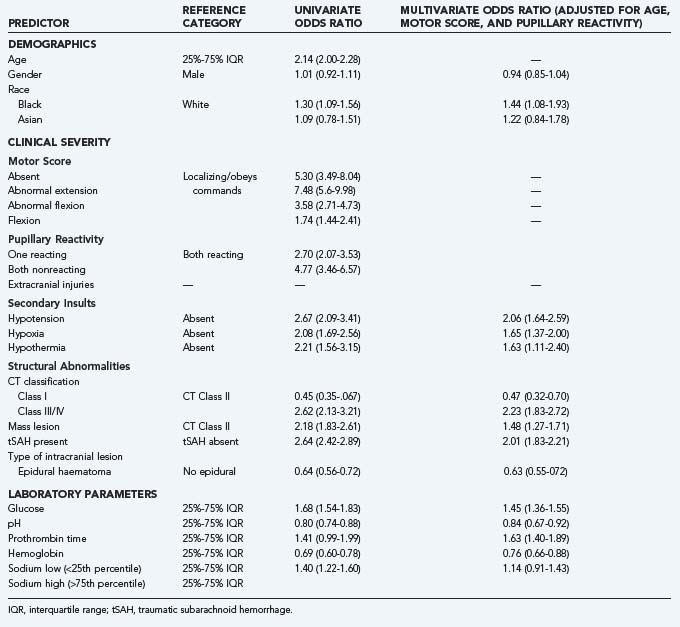
A wealth of literature has focused on the associations between predictors and outcome in univariate analysis. Most studies have concentrated on patients with severe and moderate TBI. Fewer studies have included multivariable analysis, and two systematic reviews on prognostic modeling have shown the shortcomings of many of the studies that reported on prognostic models previously. Much information on the univariate association between predictors and outcome is contained in the section “Early Indicators of Prognosis in Severe Traumatic Brain Injury” of the Brain Trauma Foundation’s Guidelines on Management and Prognosis of Severe Head Injury, first published in July 2000. More recently, the IMPACT study group reported the results of extensive prognostic analyses performed in a meta-analysis of individual patient data from eight randomized controlled trials and three observational series that included more than 9000 patients.16 A series of papers reported details correlating the GOS and demographic characteristics,17 cause of injury,18 GCS and pupil response,19 secondary insults,20 blood pressure,21 computed tomography (CT) scan features,22 and laboratory parameters.23 The results of multivariable analyses reporting also on the added predictive value were presented in the same series by Murray and colleagues.24
Conceptually, the main predictors of outcome after TBI can be grouped together into “building blocks,” some of which are modifiable and some not (Table 340-4).
| BUILDING BLOCKS | ITEMS | MODIFIABLE |
|---|---|---|
| Genetic constitution | Apolipoprotein E | No |
| Demographics | Age Gender Race |
No |
| Clinical severity | Glasgow Coma Scale score Pupillary reactivity Extracranial injuries |
No |
| Secondary insults | Hypotension (blood pressure) Hypoxia Hypothermia |
Yes |
| Structural abnormalities | CT classification Traumatic subarachnoid hemorrhage Type of intracranial lesion |
Sometimes |
| Laboratory parameters | Glucose Sodium pH Coagulation parameters Hemoglobin |
Yes |
| Biomarkers | Items under development | Uncertain |
CT, computed tomography.
The strength of the association of these predictors with outcome in both univariate and multivariate analyses as reported by the IMPACT investigators is summarized in Table 340-5.
Current knowledge on these “building blocks” and parameters is summarized in the following sections.
Genetic Constitution
In this era of discovery of the human genome, several genes and their polymorphisms are under investigation in patients with TBI. The presence of the apolipoprotein E4 allele is associated with poorer functional recovery.25 Other genes for which evidence exists for an association with poorer outcome are P53, COMT, DND2, and CACNA1A.26
Demographic Factors
Age is the strongest and most extensively studied predictor of outcome after TBI. Many publications on prognostic effects exist, all stating that older age is correlated with poorer outcome (Fig. 340-1). It is remarkable that most studies have analyzed the association between age and outcome with threshold values. Different thresholds varying from 30 to 60 years of age have been used.27–37 Studies using higher threshold levels report poorer outcome in the upper age group, and a mortality rate of greater than 75% has been described in patients older than 60 years with severe TBI.38–40 A continuous age dependency was described in only few publications in the past.41–43
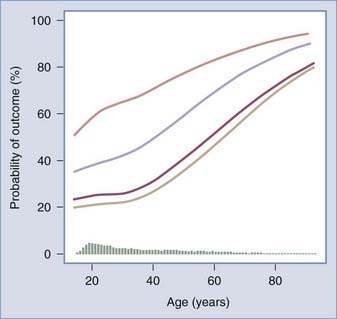
FIGURE 340-1 Continuous association between age and outcome.
(From Mushkudiani NA, Engel DC, Steyerberg EW, et al. Prognostic value of demographic characteristics in traumatic brain injury: Results from the IMPACT study. J Neurotrauma. 2007;24:259-269.)
Males are more prone to sustain a TBI because of higher risk for road traffic accidents and assaults, but a clear association between gender and outcome assessed by the GOS has not been shown for TBI. This, however, does not exclude the possibility that there may be some effect of gender on outcome. In a meta-analysis, Farace and Alves found poorer outcome in females surviving severe TBI than in males.44 Experimental studies, however, indicate that progesterone may have a neuroprotective effect, and consequently, prognosis in females may be better if TBI is sustained at a time of the menstrual cycle when progesterone levels are high.
The possible association between race and outcome after TBI has not been extensively studied. Two smaller studies showed poorer outcome in black patients,45,46 but others did not find a clear association.34,47,48 The IMPACT study group, in contrast, studying data from 5320 patients, found a statistically significant association between race and outcome, with black patients having a poorer outcome.17 It was hypothesized that this might be due to differences in severity or cause of injury. Such, however, proved not to be the case, and after adjustment for cause of injury, age, motor score, and pupils, the prognostic effect was even stronger (Table 340-6).
TABLE 340-6 Strength of the Association between Race and Outcome after Traumatic Brain Injury
| TYPE OF ANALYSIS | ODDS RATIO | CONFIDENCE INTERVAL |
|---|---|---|
| Univariate | 1.30 | 1.09-1.56 |
| Adjusted for cause of injury | 1.31 | 1.08-1.57 |
| Adjusted for age, motor score, and pupils | 1.44 | 1.08-1.93 |
| Adjusted for 7 clinical predictors* | 1.45 | 1.07-1.96 |
* Age, Glasgow Coma Scale motor score, pupils, hypoxia, hypotension, computed tomographic classification, traumatic subarachnoid hemorrhage.
These data are convincing and leave little room for doubt, but what the underlying reason for this association is can only be speculated. The response to injury may be different because of genetic constitution and biologic differences, or possibly access to acute49 and postacute47 care may be more limited.
A weak association between level of education and outcome has been reported.17,46 Mushkudiani and coworkers, however, clearly showed that this weak association could be explained by other factors and disappeared on adjustment.
Clinical Severity
Clinical severity is an important prognostic factor that in theory at least, can be assessed in all patients. Severity in patients with TBI is related to both extracranial and intracranial injuries. The overall severity of extracranial injuries is commonly assessed with the Abbreviated Injury Score (AIS)50 or the Injury Severity Score (ISS).51 Although an adverse effect of the presence of extracranial injuries on outcome after TBI is well documented,52 the prognostic value of overall injury severity and extracranial injuries has not been well documented in the literature. Walder and associates found a stronger association between the AIS and outcome than assessment of the GCS alone.53
The clinical severity of intracranial injuries is reflected by the level of consciousness as assessed by the GCS.1 Many studies have demonstrated an association between lower scores on the GCS and poorer outcome. In patients with more severe injuries, the motor component of the GCS has the greatest predictive value because eye and verbal responses are commonly absent in these patients. It should be recognized that GCS scores may fluctuate early after injury, with some patients deteriorating and others improving. From a perspective of prognosis, assessment of the GCS should therefore be related to a given time period, depending on the intent for estimating prognosis. For purposes of classification and summarizing baseline characteristics before in-hospital therapeutic interventions, the GCS is commonly assessed on admission after primary respiratory and hemodynamic stabilization. Reliable assessment of the GCS, however, may be obscured in the acute setting by confounders such as medical sedation, paralysis, or intoxication.19,54,55 Marmarou and coauthors reported a stronger association with outcome for an abnormal absent motor response than for an absent motor response.19 The most likely explanation for this is that the category of patients scored as having an absent motor reaction will include “false-absent” scores because of the confounding effects of sedation and paralysis.
Abnormalities in pupillary reactivity reflect brainstem compression and are strongly associated with poorer outcome.16 Marmarou and colleagues reported that pupillary reactivity was a more stable parameter in the early phase after injury than the GCS score because it is less prone to the influences of sedation and paralysis.
Secondary Insults
The injured brain is more vulnerable than a normal, healthy brain to systemic secondary insults such as hypoxia and hypotension. In the experimental but also in the clinical situation, the occurrence of secondary insults increases the degree of secondary damage after injury. The presence of secondary insults is associated with poorer outcome,28,56,57 and the depth, duration, and number of hypotensive insults all cumulate toward poorer outcome.20,58,59 Most studies have focused on early hypotensive and hypoxic events in which hypotension was defined as any episode with a systolic blood pressure lower than 90 mm Hg. The association between the actual blood pressure on admission and outcome has been further analyzed in a continuous manner by the IMPACT study group.21 These studies, which incorporated data from 6801 patients, showed that the relationship between blood pressure and outcome is continuous: low blood pressure and high blood pressure are both associated with a poorer outcome. After adjustment for age, motor score, and pupillary reactivity, the effects of higher blood pressure, however, largely disappeared, thus indicating that this association is most likely secondary to increasing severity of the injury. Various studies have shown that the combination of hypoxia and hypotension has a greater adverse effect on outcome than can be explained by either insult alone; the effects, however, appear to be subadditive rather than synergistic.
Structural Abnormalities
CT is the investigation of choice in the acute phase after TBI to identify the presence and extent of structural damage. The relevance of CT scanning for the purpose of classification and prediction has increased with the growing difficulties in reliable assessment of clinical severity according to the GCS.54,60,61 The prognostic value of individual CT characteristics in patients with TBI, including status of the basal cisterns, midline shift, the presence and type of intracranial lesions, and traumatic subarachnoid hemorrhage (tSAH), is well documented. In 1991, Marshall and associates introduced a descriptive system of CT classification (Table 340-7) that focuses on the presence or absence of a mass lesion and differentiates diffuse injuries by signs of increased intracranial pressure (ICP), such as compression of the basal cisterns and midline shift.62
| STRUCTURAL DAMAGE | COMPUTED TOMOGRAPHY |
|---|---|
| Diffuse injury I | No visible pathology |
| Diffuse injury II | Cisterns present, midline shift of 0-5 mm, and/or lesion densities present or no mass lesion >25 cm3 |
| Diffuse injury III (swelling) | Cisterns compressed or absent with a midline shift of 0-5 mm or no mass lesion >25 cm3 |
| Diffuse injury IV (shift) | Midline shift >5 mm, no mass lesion >25 cm3 |
| Evacuated mass lesion | Any lesion surgically evacuated |
| Nonevacuated mass lesion | High- or mixed-density lesion >25 cm3, not surgically evacuated |
This classification is also strongly related to outcome, with the poorest prognosis in patients with CT category IV (signs of raised ICP plus shift) and the best outcome in patients without visible structural abnormalities. The Marshall CT classification, however, has limitations, such as the broad differentiation between diffuse injuries and mass lesions and the lack of specification of the type of mass lesion. Thus, this classification might mask signs of raised ICP in addition to a mass lesion and does not fully use the prognostic information contained in the individual CT characteristics scored. Maas and coworkers proposed a score chart for assessing the risk for poorer outcome based on individual CT characteristics and showed that such a chart results in better discrimination between patients with better versus poorer outcome than does the descriptive Marshall classification (Table 340-8).63 This advantage was confirmed in subsequent work by Flint and colleagues.64 The prognostic relevance of tSAH was extensively described by Kakarieka and associates after extensive analysis of the nimodipine studies. Later work confirmed the presence of tSAH as one of the strongest CT predictors of outcome after TBI.65 Most studies, however, have concentrated on the presence or absence of tSAH without differentiation of the location (basal cisterns versus cortical) or extent. Cortical tSAH is frequently associated with underlying contusions, and its relevance is probably different from that of tSAH in the basal cisterns, which may incur an increased risk for vasospasm. More detailed analysis of tSAH and outcome after TBI should be a priority for the future.
TABLE 340-8 Rotterdam Prognostic Computed Tomographic Score
| PREDICTOR VALUE | SCORE |
|---|---|
| Basal Cisterns | |
| Normal | 0 |
| Compressed | 1 |
| Absent | 2 |
| Midline Shift | |
| No shift or shift ≤5 mm | 0 |
| Shift >5 mm | 1 |
| Epidural Mass Lesion | |
| Present | 0 |
| Absent | 1 |
| Intraventricular Blood or tSAH | |
| Absent | 0 |
| Present | 1 |
| Sum score* | Σ + 1 |
tSAH, traumatic subarachnoid hemorrhage.
* The sum score can be used to obtain the predicted probability of mortality from the formula below. We chose to add plus 1 to make the grading numerically consistent with the grading of the motor score of the Glasgow Coma Scale and with the Marshall CT classification. The corresponding probabilities are calculated with the following formula: Probability (mortality) = 1/[1 + e−(−2.60+0.80×sum score)].
Laboratory Parameters
Relatively few studies have investigated the relationship between laboratory parameters on admission and final outcome. This may seem surprising inasmuch as analysis of the prognostic value of laboratory parameters is particularly relevant because these parameters are routinely measured and objective. Abnormal values may also be modifiable. Various studies have shown a strong relationship between a poorer outcome and higher glucose values, low hemoglobin, low platelets, and coagulation disturbances. The results from the IMPACT studies have demonstrated that the addition of laboratory values to a prognostic model increases discrimination. These studies showed the greatest discriminatory properties for coagulation abnormalities and glucose (see Table 340-5). Although laboratory values may be modifiable, the observed association between abnormal values and poorer outcome, however, does not by definition mean that correcting these abnormal values will indeed improve outcome. The observed abnormality may simply be an expression or surrogate marker of the severity of injury. Prospective studies, preferably randomized controlled trials, are required to prove such an effect. Currently, there is great interest in various biomarkers released from damaged or necrotic neurons and glial cells in the brain. Various experimental and preliminary clinical studies have confirmed this potential.
Prognostic Models
Usefulness
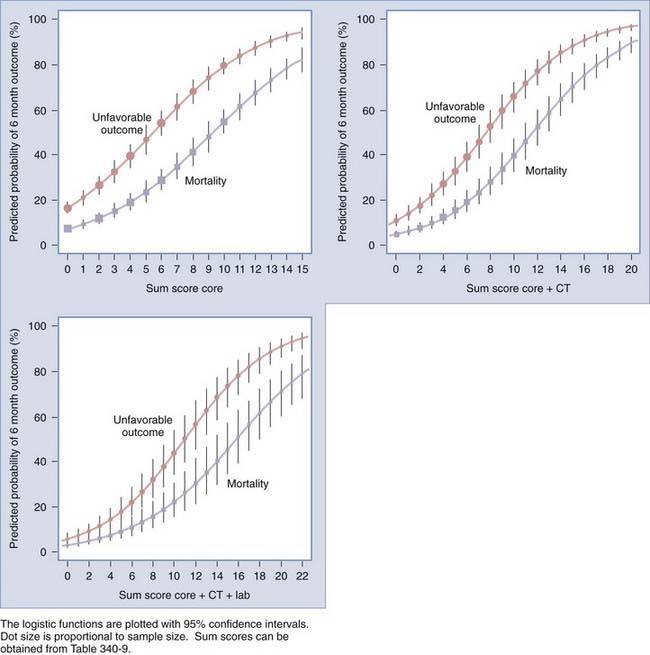
FIGURE 340-2 Predicted probabilities of mortality and unfavorable outcome at 6 months after TBI in relation to the sum scores from the core, extended, and laboratory models. The logistic functions are plotted with 95% confidence intervals. Dot size is proportional to sample size. Sum scores can be obtained from Table 340-9. CT, computed tomography.
Various prediction models have been proposed for use in patients after TBI. Two systematic reviews, however, showed many shortcomings in model development and validation.66,67 The methodologic shortcomings in the development of prognostic models may be considered one of the major factors that have delayed more general acceptance of such models into clinical practice. Specific attention to the methodology of model development is therefore required. There are seven logically distinct steps in the development of valid prediction models with regression analysis:
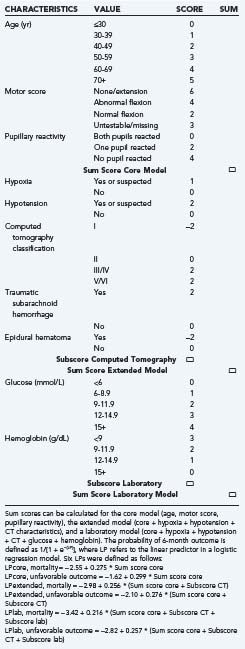
Recently, two prediction models, developed from large patient series and externally validated, have been published: models presented by the MRC CRASH trial collaborators68 and a prediction model proposed by the IMPACT study group.69 The CRASH model also included patient data from low- and middle-income countries. Importantly, both models were developed from data available on admission, before provision of specialist care. They are therefore ideally suited for a baseline calculation of prognostic risk. Both models showed good performance in terms of both discrimination and calibration. Both approaches confirmed that the largest amount of prognostic information was contained in a core set of three predictors: age, motor score, and pupillary reactivity. The IMPACT study group further evaluated the additional benefit of adding more “building blocks,” such as structural imaging (CT characteristics), secondary insults, and laboratory data. Better performance was noted in a model that included this information.
The CRASH and IMPACT models are available on the Internet (www.crash2.lshtm.ac.uk/risk%20calculator/index.html and www.tbi-impact.org).
The IMPACT model is also presented as a simple score chart for sequential application of the models (Table 340-9). This score chart can be used to obtain an approximate prediction in individual patients. The predictive risk can then be derived by reading the predicted probability from nomograms.69
Andrews PJ, Sleeman DH, Statham PF, et al. Predicting recovery in patients suffering from traumatic brain injury by using admission variables and physiological data: a comparison between decision tree analysis and logistic regression. J Neurosurg. 2002;97:326-336.
Butcher I, Maas AI, Lu J, et al. Prognostic value of admission blood pressure in traumatic brain injury; results from the IMPACT study. J Neurotrauma. 2007;24:294-302.
Butcher I, McHugh GS, Lu J, et al. Prognostic value of cause of injury in traumatic brain injury: results from the IMPACT study. J Neurotrauma. 2007;24:281-286.
Farace E, Alves WM. Do women fare worse: a metaanalysis of gender differences in traumatic brain injury outcome. J Neurosurg. 2000;93:539-545.
Little RJA, Rubin DB. Statistical Analysis with Missing Data, 2nd ed. Hoboken, NJ: Wiley; 2002.
Maas AI, Hukkelhoven CW, Marshall LF, et al. Prediction of outcome in traumatic brain injury with computed tomographic characteristics: a comparison between the computed tomographic classification and combinations of computed tomographic predictors. Neurosurgery. 2005;56:1173-1182.
Maas AI, Steyerberg EW, Butcher I, et al. Prognostic value of computerized tomography scan characteristics in traumatic brain injury: results from the IMPACT study. J Neurotrauma. 2007;24:303-314.
Marmarou A, Lu J, Butcher I, et al. Prognostic value of the Glasgow Coma Scale and pupil reactivity in traumatic brain injury assessed pre-hospital and on enrollment: an IMPACT analysis. J Neurotrauma. 2007;24:270-280.
Marmarou A, Lu J, Butcher I, et al. IMPACT database of traumatic brain injury: design and description. J Neurotrauma. 2007;24:239-250.
Marshall LF, Marshall SB, Klauber MR. A new classification of head injury based on computerized tomography. J Neurosurg. 1991;75:S14-S20.
McHugh GS, Engel DC, Butcher I, et al. Prognostic value of secondary insults in traumatic brain injury: results from the IMPACT study. J Neurotrauma. 2007;24:287-293.
McMahon CG, Yates DW, Campbell FM, et al. Unexpected contribution of moderate traumatic brain injury to death after major trauma. J Trauma. 1999;141:891-895.
MRC CRASH Trial CollaboratorsPerel P, Arango M, Clayton T, et al. Predicting outcome after traumatic brain injury: practical prognostic models based on large cohort of international patients. BMJ. 2008;336:425-429.
Murray GD, Butcher I, McHugh GS, et al. Multivariate prognostic analysis in traumatic brain injury: results from the IMPACT study. J Neurotrauma. 2007;24:329-337.
Mushkudiani NA, Engel DC, Steyerberg EW, et al. Prognostic value of demographic characteristics in traumatic brain injury: results from the IMPACT study. J Neurotrauma. 2007;24:259-269.
Mushkudiani NA, Hukkelhoven CWPM, Hernandez AV. A systematic review finds methodological improvements necessary for prognostic models in determining traumatic brain injury outcomes. J Clin Epidemiol. 2008;61:331-343.
Perel P, Edwards P, Wentz R, et al. Systematic review of prognostic models in traumatic brain injury. MBC Med Inform Decis Mak. 2006.
Royston P, Altman DG, Sauerbrei W. Dichotomizing continuous predictors in multiple regression: a bad idea. Stat Med. 2006;25:127-141.
Signorini DF, Andrews PJ, Jones PA, et al. Predicting survival using simple clinical variables: a case study in traumatic brain injury. J Neurol Neurosurg Psychiatry. 1999;66:20-25.
Steyerberg EW, Mushkudiani N, Perel P, et al. Predicting outcome after traumatic brain injury: Development and international validation of prognostic scores based on admission characteristics. PLoS Med. 2008;5:e165.
Stocchetti N, Pagan F, Calappi E, et al. Inaccurate early assessment of neurological severity in head injury. J Neurotrauma. 2004;21:1131-1140.
Van Beek JG, Mushkudiani NA, Steyerberg EW, et al. Prognostic value of admission laboratory parameters in traumatic brain injury: results from the IMPACT study. J Neurotrauma. 2007;24:315-328.
Von Steinbuechel N, Petersen C, Bullinger M. Assessment of health-related quality of life in persons after traumatic brain injury—development of the Qolibri, a specific measure. Acta Neurochir Suppl. 2005;93:43-49.
Wilson JTL, Pettigrew LEL, Teasdale GM. Structured interviews for the Glasgow Outcome Scale and the extended Glasgow Outcome Scale: guidelines for their use. J Neurotrauma. 1998;15:573-585.
1 Teasdale G, Jennett B. Assessment of coma and impaired consciousness. A practical scale. Lancet. 1974;2:81-84.
2 Jennett B, Bond M. Assessment of outcome after severe brain damage. Lancet. 1975;1:480-484.
3 Barlow P, Teasdale G. Prediction of outcome and the management of severe head injuries: the attitudes of neurosurgeons. Neurosurgery. 1986;19:989-991.
4 Chang RWS, Lee B, Jacobs S. Accuracy of decisions to withdraw therapy in critically ill patients: clinical judgement versus a computer model. Crit Care Med. 1989;17:1091-1097.
5 Dawes RM, Faust D, Meehl RE. Clinical versus actuarial judgement. Science. 1989;243:1668-1674.
6 Kaufmann MA, Buchmann B, Scheideggeer D, et al. Severe head injury: should expected outcome influence resuscitation and first day decisions? Resuscitation. 1992;23:199-206.
7 Royston P, Altman DG, Sauerbrei W. Dichotomizing continuous predictors in multiple regression: a bad idea. Stat Med. 2006;25:127-141.
8 Little RJA, Rubin DB. Statistical Analysis with Missing Data, 2nd ed. Hoboken, NJ: Wiley; 2002.
9 Greenland S, Finkle WD. A critical look at methods for handling missing covariates in epidemiologic regression analyses. Am J Epidemiol. 1995;142:1255-1264.
10 Vach W, Blettner M. Biased estimation of the odds ratio in case-control studies due to the use of ad hoc methods of correcting for missing values for confounding variables. Am J Epidemiol.. 1991;134:895-907.
11 Steyerberg EW. Clinical Prediction Models: A Practical Approach to Development, Validation, and Updating. New York: Springer; 2008.
12 McCullaugh P. Regression-models for ordinal data. J R Statist Soc Ser B Methodol. 1980;42:109-142.
13 Wilson JTL, Pettigrew LEL, Teasdale GM. Structured interviews for the Glasgow Outcome Scale and the extended Glasgow Outcome Scale: guidelines for their use. J Neurotrauma. 1998;15:573-585.
14 Gabbe BJ, Simpson PM, Sutherland AM, et al. Functional measures at discharge: are they useful predictors of longer term outcomes for trauma registries? Ann Surg. 2008;247:854-859.
15 Von Steinbuechel N, Petersen C, Bullinger M. Assessment of health-related quality of life in persons after traumatic brain injury—development of the Qolibri, a specific measure. Acta Neurochir Suppl. 2005;93:43-49.
16 Marmarou A, Lu J, Butcher I, et al. IMPACT database of traumatic brain injury: design and description. J Neurotrauma. 2007;24:239-250.
17 Mushkudiani NA, Engel DC, Steyerberg EW, et al. Prognostic value of demographic characteristics in traumatic brain injury: results from the IMPACT study. J Neurotrauma. 2007;24:259-269.
18 Butcher I, McHugh GS, Lu J, et al. Prognostic value of cause of injury in traumatic brain injury: results from the IMPACT study. J Neurotrauma. 2007;24:281-286.
19 Marmarou A, Lu J, Butcher I, et al. Prognostic value of the Glasgow Coma Scale and pupil reactivity in traumatic brain injury assessed pre-hospital and on enrollment: an IMPACT analysis. J Neurotrauma. 2007;24:270-280.
20 McHugh GS, Engel DC, Butcher I, et al. Prognostic value of secondary insults in traumatic brain injury: results from the IMPACT study. J Neurotrauma. 2007;24:287-293.
21 Butcher I, Maas AI, Lu J, et al. Prognostic value of admission blood pressure in traumatic brain injury; results from the IMPACT study. J Neurotrauma. 2007;24:294-302.
22 Maas AI, Steyerberg EW, Butcher I, et al. Prognostic value of computerized tomography scan characteristics in traumatic brain injury: results from the IMPACT study. J Neurotrauma. 2007;24:303-314.
23 Van Beek JG, Mushkudiani NA, Steyerberg EW, et al. Prognostic value of admission laboratory parameters in traumatic brain injury: results from the IMPACT study. J Neurotrauma. 2007;24:315-328.
24 Murray GD, Butcher I, McHugh GS, et al. Multivariate prognostic analysis in traumatic brain injury: results from the IMPACT study. J Neurotrauma. 2007;24:329-337.
25 Alexander S, Kerr ME, Kim Y, et al. Apolipoprotein E4 allele presence and functional outcome after severe traumatic brain injury. J Neurotrauma. 2007;24:790-797.
26 Jordan BD. Genetic influences on outcome following traumatic brain injury. Neurochem Res. 2007;32:905-915.
27 Vollmer DG, Torner JC, Eisenberg HM, et al. Age and outcome following traumatic coma: why do older patients fare worse? J Neurosurg. 1991;75:S37-S49.
28 Chesnut RM, Marshall LF, Klauber MR, et al. The role of secondary brain injury in determining outcome from severe head injury. J Trauma. 1993;34:216-222.
29 Gordon E, Von Holst H, Rudehill A. Outcome of head injury in 2298 patients treated in a single clinic during a 21-year period. J Neurosurg Anesthesiol. 1995;7:235-247.
30 Signorini DF, Andrews PJ, Jones PA, et al. Predicting survival using simple clinical variables: a case study in traumatic brain injury. J Neurol Neurosurg Psychiatry. 1999;66:20-25.
31 Ono J, Yamaura A, Kubota M, et al. Outcome prediction in severe head injury: analyses of clinical prognostic factors. J Clin Neurosci. 2001;8:120-123.
32 Andrews PJ, Sleeman DH, Statham PF, et al. Predicting recovery in patients suffering from traumatic brain injury by using admission variables and physiological data: a comparison between decision tree analysis and logistic regression. J Neurosurg. 2002;97:326-336.
33 Ratanalert S, Chompikul J, Hirunpat S, et al. Prognosis of severe head injury: an experience in Thailand. Br J Neurosurg. 2002;16:487-493.
34 Schreiber MA, Aoki N, Scott BG, et al. Determinants of mortality in patients with severe blunt head injury. Arch Surg. 2002;137:285-290.
35 Bahloul M, Chelly H, Ben Hmida M, et al. Prognosis of traumatic head injury in South Tunisia: a multivariate analysis of 437 cases. J Trauma. 2004;57:255-261.
36 Demetriades D, Kuncir E, Murray J, et al. Mortality prediction of head Abbreviated Injury Score and Glasgow Coma Scale: analysis of 7,764 head injuries. J Am Coll Surg. 2004;199:216-222.
37 Kirkness CJ, Burr RL, Mitchell PH, et al. Is there a sex difference in the course following traumatic brain injury? Biol Res Nurs. 2004;5:299-310.
38 Narayan RK, Greenberg RP, Miller JD, et al. Improved confidence of outcome prediction in severe head injury. A comparative analysis of the clinical examination, multimodality evoked potentials, CT scanning, and intracranial pressure. J Neurosurg. 1981;54:751-762.
39 Lavati A, Farina ML, Vecchi G, et al. Prognosis of severe head injuries. J Neurosurg. 1982;57:779-783.
40 Berger MS, Pitts LH, Lovely M, et al. The outcome from severe head injury in children and adolescents. J Neurosurg. 1985;62:194-199.
41 Combes P, Fauvage B, Colonna M, et al. Severe head injuries: an outcome prediction and survival analysis. Intensive Care Med. 1996;22:1391-1395.
42 Gómez PA, Lobato RD, Boto GR, et al. Age and outcome after severe head injury. Acta Neurochir (Wien). 2000;142:373-380.
43 Hukkelhoven CW, Steyerberg EW, Rampen AJ, et al. Patient age and outcome following severe traumatic brain injury: an analysis of 5600 patients. J Neurosurg. 2003;99:666-673.
44 Farace E, Alves WM. Do women fare worse: a metaanalysis of gender differences in traumatic brain injury outcome. J Neurosurg. 2000;93:539-545.
45 Jorge RE, Robinson RG, Starkstein SE, et al. Influence of major depression on 1-year outcome in patients with traumatic brain injury. J Neurosurg. 1994;81:726-733.
46 Wagner AK, Sasser HC, Hammond FM, et al. Intentional traumatic brain injury: epidemiology, risk factors, and associations with injury severity and mortality. J Trauma. 2000;49:404-410.
47 Burnett DM, Kolakowsky-Hayner SA, Slater D, et al. Ethnographic analysis of traumatic brain injury patients in the national Model Systems database. Arch Phys Med Rehabil. 2003;84:263-267.
48 Johnstone B, Mount D, Gaines T. Race differences in a sample of vocational rehabilitation clients with traumatic brain injury. Brain Inj. 2003;17:95-104.
49 Bazarian JJ, Pope C, McClung J, et al. Ethnic and racial disparities in emergency department care for mild traumatic brain injury. Acad. Emerg. Med. 2003;10:1209-1217.
50 Association for the Advancement of Automotive Medicine. The Abbreviated Injury Scale, 1990 revision. Des Plaines, IL: Association for the Advancement of Automotive Medicine; 1990.
51 Baker SP, O’Neill B, Haddon WJr, et al. The injury severity score: a method for describing patients with multiple injuries and evaluating emergency care. J Trauma. 1974;14:187-196.
52 McMahon CG, Yates DW, Campbell FM, et al. Unexpected contribution of moderate traumatic brain injury to death after major trauma. J Trauma. 1999;141:891-895.
53 Walder AD, Yeoman PM, Turnbull A. The abbreviated injury scale as a predictor of outcome of severe head injury. Intensive Care Med. 1995;21:606-609.
54 Balestreri M, Czosnyka M, Chatfield DA, et al. Predictive value of Glasgow Coma Scale after brain trauma: change in trend over the past ten years. J Neurol Neurosurg Psychiatry. 2004;75:161-162.
55 Stocchetti N, Pagan F, Calappi E, et al. Inaccurate early assessment of neurological severity in head injury. J Neurotrauma. 2004;21:1131-1140.
56 Miller JD, Sweet RC, Narayan R, et al. Early insults to the injured brain. JAMA. 1978;240:439-442.
57 Walia S, Sutcliffe AJ. The relationship between blood glucose, mean arterial pressure and outcome after severe head injury: an observational study. Injury. 2002;33:339-344.
58 Manley G, Knudson MM, Morabito D, et al. Hypotension, hypoxia, and head injury: frequency, duration, and consequences. Arch Surg. 2001;136:1118-1123.
59 Chesnut RM. Secondary brain insults after head injury: clinical perspectives. New Horizons. 1995;3:366-375.
60 Buechler CM, Blostein PA, Koestner A, et al. Variation among trauma centers’ calculation of Glasgow Coma Scale score: results of a national survey. J Trauma. 1998;45:429-432.
61 Moskopp D, Staehle C, Wassmann H. Problems of the Glasgow Coma Scale with early intubated patients. Neurosurg Rev. 1995;18:253-257.
62 Marshall LF, Marshall SB, Klauber MR. A new classification of head injury based on computerized tomography. J Neurosurg. 1991;75:S14-S20.
63 Maas AI, Hukkelhoven CW, Marshall LF, et al. Prediction of outcome in traumatic brain injury with computed tomographic characteristics: a comparison between the computed tomographic classification and combinations of computed tomographic predictors. Neurosurgery. 2005;56:1173-1182.
64 Flint AC, Manley GT, Gean AD, et al. Post-operative expansion of hemorrhagic contusions after unilateral decompressive craniectomy in severe traumatic brain injury. J Neurotrauma. 2008;25:503-512.
65 Kakarieka A, Braakman R, Schakel EH. Clinical significance of the finding of subarachnoid blood on CR scan after head injury. Acta Neurochir (Wien). 1994;129:1-5.
66 Perel P, Edwards P, Wentz R, et al. Systematic review of prognostic models in traumatic brain injury. MBC Med Inform Decis Mak. 2006.
67 Mushkudiani NA, Hukkelhoven CWPM, Hernandez AV. A systematic review finds methodological improvements necessary for prognostic models in determining traumatic brain injury outcomes. J Clin Epidemiol. 2008;61:331-343.
68 MRC CRASH Trial CollaboratorsPerel P, Arango M, Clayton T, et al. Predicting outcome after traumatic brain injury: practical prognostic models based on large cohort of international patients. BMJ. 2008;336:425-429.
69 Steyerberg EW, Mushkudiani N, Perel P, et al. Predicting outcome after traumatic brain injury: Development and international validation of prognostic scores based on admission characteristics. PLoS Med. 2008;5:e165.