CHAPTER 2 PRINCIPLES OF NEUROPSYCHOMETRIC ASSESSMENT
It might legitimately be asked why this chapter was written by both a neurologist and a neuropsychologist. The answer, in part, is that a neurologist who has worked closely with neuropsychologists is perhaps in the best position to interpret the discipline to his or her colleagues; neuropsychology is often a “black box” to neurologists, to a greater extent than neuropsychologists themselves may realize. This can lead to uncritical acceptance of neuropsychologists’ conclusions without the productive interaction that characterizes, for example, neuroradiological review sessions. At the other extreme, the real added value of expert neuropsychological assessment may be discounted by those unconvinced of its validity. In any event, the value of neuropsychological assessment is considerably increased when the neurologist requesting it understands its strengths, limitations and pitfalls, and the sort of data on which its conclusions are based.
COGNITIVE DOMAINS AND NEUROPSYCHOLOGICAL TESTS
Cognitive Domains
Cognitive domains are constructs (intellectual conceptualizations to explain observed phenomena, such as gravity) invoked to provide a coherent framework for analysis and testing of cognitive functions. The various cognitive processes in each domain are more or less related and are more or less independent of processes in other domains. Although these domains do not have strict, entirely separable neuroanatomical substrates, they do each depend on particular (but potentially overlapping) neural networks.1 In view of the way in which cognitive domains are delineated, it is not surprising that there is some variation in their stated number and properties, but commonly recognized ones with their potential neural substrates are listed in Table 2-1.
TABLE 2-1 Commonly Assessed Cognitive Domains and Their Potential Neural Substrate
| Domain | Main Neural Substrate |
|---|---|
| Attention | Ascending reticular activating system, superior colliculus, thalamus, parietal lobe, anterior cingulate cortex, and the frontal lobe |
| Language | Classical speech zones, typically in the left dominant hemisphere, including Wernicke’s and Broca’s areas, and the angular gyrus |
| Memory | Hippocampal-entorhinal cortex complex |
| Frontal regions | |
| Left parietal cortex | |
| Object recognition (visual) | Ventral visual system: occipital regions to anterior pole of temporal lobe |
| Spatial processing | Posterior parietal cortex, frontal eye fields, dorsal visual system |
| Inferotemporal/midtemporal and polar temporal cortex | |
| Executive functioning | Frontal-subcortical circuits, including dorsolateral prefrontal, orbital frontal, and anterior cingulate circuits |
Neuropsychological Assessment of Individual Cognitive Domains
In practice, although many neuropsychological tests assess predominantly one domain, very few in routine clinical use are pure tests of a single domain, and almost all can be performed poorly for several reasons. For example, inability to copy the Rey Complex Figure might result from impairments of volition, comprehension, planning, or praxis, as well as from some form of the most obvious cause of visual impairment. Assignment of particular tests to particular domains is therefore to some extent arbitrary; many tests are capable of being assigned to more than one domain. The interested reader is referred to Lezak and colleagues (2004) and Spreen and Strauss (1998) for details of individual tests. Multidimensional tests, such as the Mini-Mental State Examination (MMSE), may be subjected to factor analysis. This type of analysis identifies groupings of test items that correlate with each other and may well assess aspects of the same domain. In this way, the range of domains assessed by such a test may be identified.
Prerequisites for Meaningful Testing
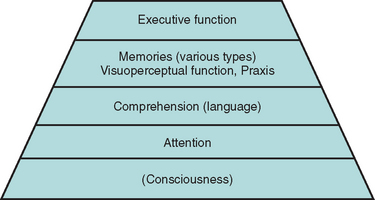
Adequate testing within some domains requires that some others are sufficiently intact. For example, a patient whose sustained, focused attention (concentration) is severely compromised by a delirium is unable to register a word list adequately. Consequently, delayed recall is impaired, even in the absence of a true amnesia or its usual structural correlates. A patient with sufficiently impaired comprehension may perform poorly on the Wisconsin Card Sorting Test because the instructions were not understood, rather than because hypothesis generation was compromised. These considerations give rise to the concept of a pyramid of cognitive domains, with valid testing at each level dependent on the adequacy of lower level performance2 (Fig. 2-1).
In addition to intact attention and comprehension, patient performance may be compromised by poor motivation—for example, as a result of depression or in the setting of potential secondary gain—or by anxiety. Neurological impairments (e.g., poor vision, ataxia), psychiatric comorbid conditions, preexisting cognitive impairments (e.g., mental retardation), specific learning difficulties or lack of education (e.g., resulting in illiteracy), and lack of mastery of the testing language can all interfere with valid testing and must be carefully considered by the neuropsychologist in interpreting test results.3
BASIC PRINCIPLES OF PSYCHOMETRICS
Test Validity
All readers presumably score 75% on this test, which is therefore absolutely reliable but quite invalid as a test of semantic knowledge.
Concurrent validity, another form of criterion validity often used instead, involves comparing test results with a nontest parameter of relevance, such as sustained, directed attention in children with their class disciplinary records. Ecological validity, a related concept, reflects the predictive value of the test for performance in real-world situations. For example, neuropsychological tests of visual attention and executive function, but not of other domains, have been found to have reasonable ecological validity for predicting driving safety, in comparison with the “gold standard” of on-road testing.4
Content validity concerns checking the test items against the boundaries and content of the domain (or portion of the domain) to be assessed. Face validity exists when, to a layperson (such as the subject undergoing testing), a test seems to measure what it is purported to measure. Thus, a driving simulator has good face validity as a test of on-road safety, whereas an overlapping figures test of figure/ground discrimination may not, even though it may actually be relevant to perceptual tasks during driving. More detailed discussions of reliability and validity were given by Mitrushina and associates (2005), Halligan and colleagues (2003), or Murphy and Davidshofer (2004).
Symptom Validity Testing
Symptom validity testing is rather different and is used as a method to reveal nonorganic deficits (e.g., malingering). It relies on the fact that patients with no residual ability in a domain, who are forced to respond to items randomly or by guessing, can nevertheless sometimes be correct by chance. Performance at statistically significantly worse than chance levels can be explained only by some retention of ability in that domain, with that ability being used (consciously or unconsciously) to produce incorrect answers. This forced-choice/statistical analysis concept should already be familiar to neurologists, as it underlies much of psychophysically correct sensory testing. (A fine example is the University of Pennsylvania Smell Identification Test [UPSIT] for evaluation of olfaction.5)
Other methods for detecting nonorganic deficits also exist; they depend on recognition of deviation from the usual patterns of cognitive impairment (e.g., recognition memory’s being worse than spontaneous recall) or discrepancy between scores on explicit tests of a domain and behavior or other tests implicitly dependent on that domain (e.g., dysfluency appearing only when “language” is tested). This subject is covered in more detail elsewhere.6
Ceiling and Floor Effects
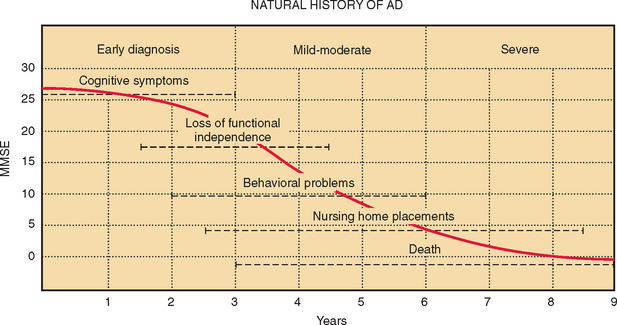
Two further difficulties may limit the use of neuropsychological measures: lack of discrimination across the range of abilities expected and practice effects on repeated testing. An ideal test would reveal a linear decline in ability in the tested domain, from the supremely gifted to the profoundly impaired. In practice, this is rarely, if ever, achieved. Some tests discriminate well between patients with different severities of obvious impairment but are problematic in attempts to detect subtle disorders and fail to stratify the normal population appropriately. This is known as a ceiling effect. On the other hand, some tests sensitive to subtle declines and capable of stratifying the normal population, are too difficult for patients with more profound deficits. Real differences in their residual abilities may be missed. This is a floor effect. Some tests have both ceiling and floor effects, leading to a sigmoid curve of scores versus ability. If patients with Alzheimer’s disease are assumed to decline at a constant rate, then on average, over time, the MMSE shows both ceiling and floor effects (Fig. 2-2).
Practice Effects
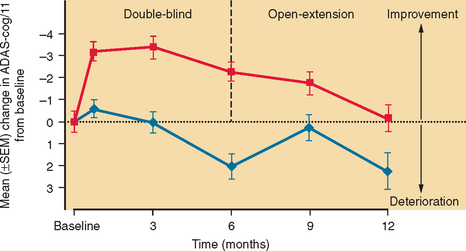
Practice effects arise when the act of taking a test more than once results in an improvement in the subject’s true score. Repeated assessments over time are often desirable, to determine whether a deficit is static or declining or to monitor treatment or recovery. Such serial assessment is virtually impossible with some tests because of practice effects. For example, once the patient has been exposed to the Wisconsin Card Sorting Test and has learned that the examiner periodically changes the correct sorting rule without divulging this to the patient, much of the challenge and novelty of this test is lost. Repeated exposure to a test, particularly over a short period, may result in overt learning. This probably accounts for the initial rise in MMSE and Alzheimer’s Disease Assessment Scale, Cognitive subscale (ADAS-Cog) scores in the placebo recipients in trials of cholinesterase inhibitors in Alzheimer’s disease, for example (Fig. 2-3).
The use of alternative forms, such as the Crawford version of the Rey Auditory Verbal Learning Test, may overcome some of these difficulties,7 but not all alternative versions of tests really are equivalent (e.g., the Taylor alternative version of the complex figure is easier to recall than the original Rey Complex Figure itself; see Chapter 12 in Mitrushina et al [2005]). Furthermore, learning may be implicit (procedural), in such a way that patients become more proficient at a type of test with practice in the absence of conscious remembering. This may improve scores even on true alternative versions.
Comparison with Appropriate Normative Data
For tests to be useful in making clinical predictions about an individual, particularly on the first assessment, it is essential that individuals’ scores be compared with appropriate normative data. Many test scores in normal populations show systematic variation with demographic variables, such as age, years of education, and gender, and these must be accounted for before interpretation is possible. This may be done by using either stratified norms or regression equations with the relevant variables factored in. It is essential that the “normal” population sampled to provide the normative data is relevant to the patient being tested. For example, a stratification category of native English speakers “>60 years” with an average of 16 years of education is hardly an appropriate normative population against which to compare an 89-year-old patient with only 5 years of education who learned English as an adult immigrant. The selection of appropriate norms is covered in detail in the handbook by Mitrushina and associates (2005).
Testing patients whose language of preference is not that of the test (and the examiner) is particularly plagued with pitfalls: Direct translation on the spot introduces too much random variability. Versions in the target language must first be validated and norms established in that population, allowing for differences in word usage and familiarity. In the case of nonverbal tests, it must be shown that scores are equivalent in the different target groups. Even a carefully translated test may end up measuring something different from the original version.8 These considerations can considerably restrict test choice in assessment in these patients.
Reporting of Test Scores
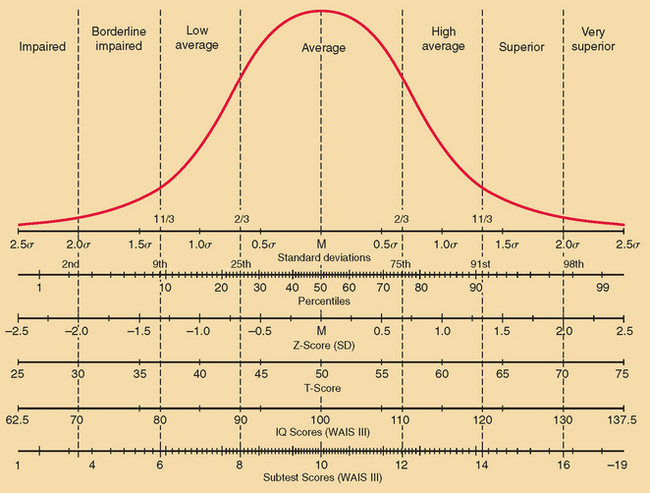
Once appropriate norms are identified, the test scores have to be reported in an intelligible manner. This is commonly done in terms of standard deviations from the mean for the appropriate normative sample, by using Z scores, T scores, or IQ scores. A Z score of −1½ would indicate a score 1½ standard deviations (SD) below average, whereas one of +2 would indicate a score 2 SD above average. T scores have the mean set at 50 and 1 SD set at 10. Hence, a T score of 70 is 2 SD above average. IQ scores have the mean set at 100, and 1 SD set at 15. Hence, an IQ score of 85 is 1 SD below average. Of course, reporting scores in terms of SD assumes that the measured variable is normally distributed in the population. This is not the case with, for example, the Boston Naming Test or the Rey Complex Figure Test copy, for which results from the normal population are positively skewed (see Mitrushina et al [2005]). Reporting by percentiles—the percentage of the normative population whose scores fall below that score level—avoids this difficulty: If a score is below the second percentile, it would indicate impairment, regardless of the distribution of test scores. On the other hand, for tests with a normal distribution of scores, reporting by percentiles does tend to overemphasize unimportant differences near the mean and underemphasize more extreme deviations. For example, the real difference between the first and the 10th percentile levels is likely to be much more important (and larger) than the real difference between the 41st and 50th percentiles. However, other tests have their own idiosyncratic scoring systems (e.g., MMSE: maximum score 30/30; ADAS-Cog: maximum score 0/70). Neuropsychologists also frequently report scores by bands with descriptive labels (such as superior, above average, borderline, etc.). The relationship between some of these various scoring methods for a test with normally distributed scores is shown in Figure 2-4.
Decision Theory
The concepts of sensitivity, specificity, and, more particularly for decision making, positive and negative predictive value and likelihood ratio are as important for neuropsychological tests as for any other form of diagnostic testing in medicine. Their definitions are provided in Table 2-2. The important effect of base rate (prevalence) on these values must also be remembered. For example, the base rate of Alzheimer’s disease in 75-year-old patients with memory complaints is much higher than that in 45-year-olds worried that they are not staying on top of their jobs, so that poor performance on a brief verbal memory test has a much higher positive predictive value in the older population.
| a = true positive scores |
| b = false positive scores |
| c = false negative scores |
| d = true negative scores |
| Prevalence = (a + c)/(a + b + c + d) |
| Sensitivity = a/(a + c) |
| Specificity = d/(b + d) |
| Positive predictive value = a/(a + b) |
| Negative predictive value = d/(c + d) |
| Likelihood ratio (positive) = posttest odds/pretest odds |
| = sensitivity/{1 − specificity} |
| = {a/(a + c)}/{1 − [d/(b + d)]} |
Cutoffs and Receiver Operating Characteristic Curves
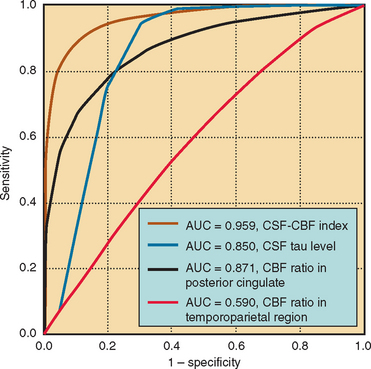
When a test cutoff point is set (as is often done for the MMSE or the Modified Mini-Mental State Examination, to distinguish demented from nondemented subjects), there is a trade-off between sensitivity and specificity. This may be formalized as a receiver operating characteristic (ROC) curve, on which sensitivity is plotted against 1 − specificity for each proposed cutoff point. The optimal cutoff point for the purpose (e.g., individual diagnosis, requiring high specificity, or community screening, requiring high sensitivity) can then be ascertained from this graph. For example, Monsch and colleagues (1995) used ROC analysis to determine that the optimal cutoff score for the MMSE in a geriatric outpatient service is 25/26.9 The utility of different measures of the same parameter can also be compared (e.g., see Fig. 2-5), or the effects of adding another test of the same parameter studied; the test or combination that has the greatest area under the ROC curve is the most accurate discriminator.
MEASURING DEFICITS AND CHANGES
Methods of Establishing a Baseline
Most patients have not previously undergone neuropsychological assessment when they are referred, and so there is no established personal baseline against which they can be compared when they are assessed. There are several approaches to this problem. Using demographically stratified norms (see section on Comparison with Appropriate Normative Data) is helpful, and there are even demographic formulas available in some countries, including the United States, to enable estimation of premorbid IQ.10 However, these still involve comparison with a group, which may not be completely appropriate for a given individual.
A second approach is to estimate premorbid ability from performance on a cognitive task known to be (relatively) resistant to cognitive decline, such as semantic knowledge. The National Adult Reading Test (of pronunciation of irregularly spelled words)11 and its U.S. variants, as well as the vocabulary subtest of the Wechsler Adult Intelligence Scale and its successors, have been used for this purpose.
A large variation between Z scores in different domains might suggest that the lower scores are the result of deterioration and that the higher scores (the patient’s best performance), qualified by all available qualitative information about the patient’s premorbid achievements and abilities, provide a reasonable estimate of the patient’s overall cognitive ability. For example, sometimes an individual’s occupational history is helpful: some otherwise normal older individuals may have difficulty copying a cube, but such difficulty in a former architect, draftsperson, or mathematics teacher would indeed be cause for concern. This best performance approach is discussed by Lezak and colleagues (2004, pp 97-99). The pitfalls in relying on the best test score in the absence of such further qualifying information have been illustrated by Mortensen and associates (1991).12
Measuring Change
One simple way of determining whether a change in test score is significant is the standard deviation method, in which it is assumed that any score change of more than 1 SD is significant. Although this often does reveal truly significant changes, it is less accurate in doing so than are a number of more sophisticated methods.13 In part, this potential inaccuracy arises from the random error component of the actual test scores themselves.
Even if a test does not display practice effects, or if truly parallel (alternative) forms are available, only part of a patient’s actual test score consists of the true score, whereas part consists of random variability. The reliability coefficient (rxx) of a test is a measure of the proportion of the total variance of a test score that results from variance in the true score. If a subject took such a test multiple times, the average score would approximate the true score. The extent to which a single observed total score represents that patient’s true score can be estimated with the standard error of measurement (SEM), which increases as the total test variance (σx) increases and decreases as the reliability coefficient (rxx) increases (indicating a decrease in that portion of the total variance due to random variance), according to the formula SEM − σx √1 − rxx. This means that confidence intervals (e.g., 95%) can be placed on an individual score, or two scores obtained on separate occasions can be compared to determine whether they are likely to represent a true change.
Reliable change indices (RCIs), calculated from data on normal subjects or—better—from populations containing individuals identified as undergoing significant change according to an external “gold standard” (e.g., reaching criterion for diagnosis of dementia) have been devised that account for measurement error, practice effects, and regression to the mean.13 Regression equation-based measures have also been developed.13 Overall, these perform more satisfactorily, although none is ideal.
STRATEGIES IN NEUROPSYCHOLOGICAL ASSESSMENT
Neuropsychological assessment would be extremely protracted and exhausting (and thereby inaccurate) for both tester and patient, not to mention prohibitively expensive, if all domains were assessed in all possible detail. Some strategy for keeping time and costs to acceptable levels is therefore required. One possibility is to use a standard battery, such as the Halstead-Reitan or Luria-Nebraska battery.14,15 The difficulty with this approach is that testing may occupy several hours, but the particular referral problems are still insufficiently clarified at the end. Another approach is hypothesis driven, on the basis of referral details and the history from the patient. This makes intrinsic sense to physicians: a patient complaining of diplopia and unsteadiness of gait will rightly be given a more thorough neurological examination than will a patient complaining of dyspnea, pleuritic chest pain, and productive cough.
Many assessors use a combination of screening tests across the range of cognitive domains, concentrating on those that seem most relevant (e.g., episodic memory in Alzheimer’s disease). This flexible approach may be modified in midsession: As pointed out in the Cognitive Domains and Neuropsychological Tests section, an abnormal performance may well have a number of possible causes, each of which must then be assessed. Often, the Wechsler Adult Intelligence Scale–Third Edition and the Wechsler Memory Scale–Third Edition, or a selection of items from these, are used for screening. Although the Wechsler Adult Intelligence Scale was designed to assess the range of abilities in the normal population rather than to investigate patients with particular cognitive deficits, test administration is very well standardized, and the normative data are extensive (although not stratified by educational level); therefore, these tests are an attractive option for this purpose. Their merits and pitfalls are discussed by Lezak and colleagues (2004, pp 648-660). Some multidomain bedside screening mental status tests used by nonneuropsychologists, such as the Mattis Dementia Rating Scale16 and the Cognistat (formerly called the Neurobehavioral Cognitive State Examination),17 are designed on a “tripwire” (“screen + metric”) basis, with a challenging item given first and, only if the screening item is failed, easier ones then given to establish the degree of impairment in that domain. This approach can save time for both examiner and patient.
Computerized versions of some individual tests are in widespread use (e.g., the Continuous Performance Test and the Wisconsin Card Sorting Test). In view of the duration and expense of neuropsychological assessment, however, it is not surprising that attempts have been made to computerize the entire testing process. An example is the Cambridge Neuropsychological Test Automated Battery.18 The drawbacks of this approach, however, include not only the loss of flexibility, and therefore the ability to perform hypothesis-generated testing, but also the loss of the potentially very valuable information derived from consideration of referral details, the history from patient and informant, and observation during the test procedure. Consideration of all these features by a trained practitioner is the basis of neuropsychological assessment, as distinct from the more limited neuropsychological testing. An experienced neuropsychologist is able to detect evidence of impulsivity, poor or fluctuating attention, poor planning, and so forth. These observations are particularly important when assessing patients with the dysexecutive syndrome (see Chapter 7: Executive Function and its Assessment), in whom the manner of test performance is often more revealing than the result. Furthermore, anxiety, fatigue, and depression adversely affect performance on many neuropsychological tests; detection of and allowance for or minimization of these process factors are important parts of the neuropsychologist-patient interaction.
OPTIMAL USE OF NEUROPSYCHOLOGY
Neuropsychology is supremely useful for determining whether a patient is impaired in a particular domain or domains (e.g., “Does my HIV [human immunodeficiency virus]–positive patient have early features of AIDS [acquired immunodeficiency syndrome]–dementia complex?”). It may identify mild impairments in the absence of obvious neuroimaging changes (e.g., after traumatic brain injury or in some patients with mild cognitive impairment). It is also useful for determining the pattern of involvement across cognitive domains. The latter information can suggest particular diagnoses or refine the differential diagnosis (e.g., “This pattern of deficits is most consistent with semantic dementia”), and can also suggest likely problem areas—and, as important, areas of retained strength—that can be used to inform rehabilitation and compensatory strategies. Although neuropsychological tests are typically not tests of decision-making capacity per se, useful inferences regarding the possible or likely presence of problems in this area can be drawn. Neuropsychological assessment can be employed preoperatively (e.g., for epilepsy or tumor surgery) to document the extent of cognitive problems and again postoperatively to determine whether worsening (or new deficits) have resulted from the procedure. Serial assessments can be performed to monitor the progression of a condition (e.g., mild cognitive impairment) or the effectiveness of treatment (e.g., central nervous system vasculitis). Lastly, through variations of symptom validity testing, and by studying the pattern of failures on easier versus harder tasks, conscious or unconscious simulation of deficit can be detected.
SUMMARY
Halligan PW, Kischka U, Marshall JC. Handbook of Clinical Neuropsychology. Oxford, UK: Oxford University Press, 2003.
Lezak MD, Howieson DB, Loring DW. Neuropsychological Assessment, 4th ed. New York: Oxford University Press, 2004.
Mitrushina M, Boone KB, Razani J, et al. Handbook of Normative Data for Neuropsychological Assessment, 2nd ed. New York: Oxford University Press, 2005.
Murphy KR, Davidshofer CO. Psychological Testing: Principles and Applications, 6th ed. Englewood Cliffs, NJ: Prentice Hall, 2004.
Spreen O, Strauss E. A Compendium of Neuropsychological Tests: Administration, Norms, and Commentary, 2nd ed. New York: Oxford University Press, 1998.
1 Mesulam MM. From sensation to cognition. Brain. 1998;121:1013-1052.
2 Crowe SF. Neuropsychological Effects of the Psychiatric Disorders. Amsterdam: Harwood Press, 1998;11.
3 Groth-Marnat G. Neuropsychological Assessment in Clinical Practice. New York: John Wiley & Sons, 2000;95.
4 Whelihan WM, DiCarlo M, Paul RH. The relationship of neuropsychological functioning to driving competence in older persons with early cognitive decline. Arch Clin Neuropsychol. 2005;20:217-228.
5 Doty RL, Shaman P, Kimmelman CP, et al. University of Pennsylvania Smell Identification Test: a rapid quantitative olfactory function test for the clinic. Laryngoscope. 1984;94:176-178.
6 Rodgers R, editor. Clinical Assessment of Malingering and Deception, 2nd ed., New York: Guilford Press, 1997.
7 Crawford JR, Steward LE, Moore JW. Demonstration of savings on the AVLT and development of a parallel form. J Clin Exp Neuropsychol. 1989;11:975-981.
8 Ferraro FR, editor. Minority and Cross-Cultural Aspects of Neuropsychological Assessment. Studies on Neuropsychology, Development, and Cognition. Lisse, The Netherlands: Swets and Zeitlinger, 2002.
9 Monsch AU, Fold NS, Ermini-Fünfschilling DE, et al. Improving the diagnostic accuracy of the Mini-Mental State Examination. Acta Neurol Scand. 1995;92:145-150.
10 Barona A, Chastain R. An improved estimate of premorbid IQ for blacks and whites on the WAIS-R. Int J Clin Neuropsychol. 1986;8:169-173.
11 Nelson HE, Willison JR. The National Adult Reading Test (NART): Test Manual, 2nd ed. Windsor, UK: NEFR Nelson, 1991.
12 Mortensen EL, Gade A, Reinisch JM. “Best Performance Method” in clinical neuropsychology. J Clin Exp Neuropsychol. 1991;13:361-371.
13 Frerichs RJ, Tuokko HA. A comparison of methods for measuring cognitive change in older adults. Arch Clin Neuropsychol. 2005;20:321-333.
14 Reitan RM, Wolfson D. The Halstead-Reitan Neuropsychological Test Battery: Theory and Clinical Applications, 2nd ed. Tucson: Neuropsychology Press, 1993.
15 Golden CJ, Purisch AD, Hammeke TA. Luria-Nebraska Neuropsychological Battery: Forms I and II. Los Angeles: Western Psychological Press, 1991.
16 Mattis S. Dementia Rating Scale (DRS). Odessa, FL: Psychological Assessment Resources, 1988.
17 Kiernan RJ, Mueller J, Langston JW. Cognistat (Neurobehavioral Cognitive Status Examination). Lutz, FL: Psychological Assessment Resources, 1995.
18 Robbins TW, James M, Owen AM, et al. Cambridge Neuropsychological Test Automated Battery (CANTAB): a factor analytic study of a large sample of normal elderly volunteers. Dementia. 1994;5:266-281.