Chapter 3 Principles of Modern Neuroimaging
• Noncontrast head computed tomography (CT) is the imaging test of choice in the evaluation of acute neurological disease such as head trauma, hemorrhage, and acute hydrocephalus.
• Noncontrast head CT can also detect early signs of ischemic stroke, including sulcal effacement, and insular ribbon and dense MCA (middle cerebral artery) signs.
• In CT perfusion (CTP) of acute stroke, areas of ischemic penumbra show prolonged mean transit times (MTTs) and normal cerebral blood volume (CBV). These areas are potentially salvageable with neurointerventional therapies.
• Intravenous contrast agent is useful in the detailed evaluation of vascular structures, as well as for identification of blood-brain barrier breakdown, such as occurs with mass lesions and infection.
• Vascular flow-voids are best seen on T2-weighted magnetic resonance imaging (MRI), and edema is best assessed with fluid attenuated inversion recovery (FLAIR) imaging.
• Gradient echo (GRE) sequences highlight blood products in assessment of subtle hemorrhage or small cavernous malformations.
• Functional MRI detects changes in blood oxygenation in areas of the brain involved in specific tasks such as speech, vision, or movement.
• Areas of restricted diffusion (such as acute stroke) appear bright on diffusion sequences and dark on ADC (apparent diffusion coefficient) maps. These sequences also distinguish between ring-enhancing lesions; central areas of abscess and lymphoma are bright on diffusion, but those of glioma and metastasis are not.
• Diffusion tensor imaging (DTI) measures organized fluid movement along white matter tracts and can aid in the surgical resection of lesions in eloquent cortex.
• Seizure foci show ictal hyperperfusion and interictal hypoperfusion in single-photon emission computed tomography (SPECT) imaging.
Even though the number of randomized controlled studies and cost effectiveness analyses regarding the use of imaging in neurosurgical practice remains small, this is changing. In an effort to provide clinicians with easy access to the latest data on the most effective imaging modalities for a particular clinical question, the American College of Radiology has established a set of criteria to evaluate the use of imaging in patient care, called the ACR Appropriateness Criteria.1 These criteria are composed by consensus among a panel of experts in radiology with input from nonradiology experts based on critical reviews of the literature. The criteria are available online through a searchable database based on patient symptom and imaging modality using a free search engine (http://acsearch.acr.org/).2
This chapter aims to describe the fundamentals of currently used imaging techniques and to highlight the advantages of different techniques in neurosurgical illness. Important considerations of radiation exposure and risks of contrast agents are discussed briefly. Next, a survey of key general imaging findings pertinent to neurosurgeons are described in detail in the sections on computed tomography (CT). The section on magnetic resonance imaging (MRI) approaches the topic from a different angle, highlighting advantages of specific imaging sequences. Angiographic modalities of CT and MRI are then addressed. Advanced imaging techniques including diffusion tensor imaging (DTI), spectroscopy, and functional MRI are also briefly discussed.
Principles
Radiography
Discovered by Wilhelm Roentgen in 1895, x-rays are photons carrying electromagnetic energy which are created by an anode-cathode system within a vacuum.3 These photons are of higher energy and shorter wavelength than visible light. When photons collide with atoms of varying sizes, they either pass through or are absorbed. Larger (heavier, radiopaque) atoms, such as calcium or metals, are more likely to absorb the energy of the photons than smaller (lighter, radiolucent) atoms and small molecules, such as water or air. When a patient is positioned in a beam of x-rays, the x-rays will be differentially absorbed based on the tissue components (bone, soft tissue, aerated sinuses). Photons that pass through the patient strike a detector and create an x-ray image, producing a two-dimensional projected image of the different attenuation properties of body tissue.
Computed Tomography
Sir Godfrey Hounsfield and Dr. Allan Cormack invented the first computed axial tomographic scanner in 1972, which earned them the Nobel Prize for Medicine in 1979.4 Computed tomography (CT) scanners have advanced significantly since that time, rapidly increasing in speed and resolution. Modern scanners use a rotating x-ray tube and detector array that revolve around the body, obtaining tissue attenuation information from beams or rays of tissues within a slab. Standard axial images are obtained by applying a reconstruction algorithm, typically filtered back projection, to reconstruct the two-dimensional image.5 Sagittal, coronal, or oblique imaging planes can be reconstructed from the axial sequences by computer reformatting. Radiodense contrast material administered intravenously or parenterally can outline hollow structures such as blood vessels or the digestive system.
CT density is quantitatively measured in Hounsfield units (HU).5 Hounsfield units describe a linear scale of attenuation that is constant across scanner platforms, with water and air given arbitrary values of 0 and −1000, respectively. Materials with increased x-ray attenuation with respect to water have a positive HU value, and those with less x-ray attenuation than water have a negative HU value (Table 3.1).4,6
| Tissue | Hounsfield Units |
|---|---|
| Air | −1000 |
| Fat | −(60-100) |
| Water | 0 |
| White matter | 35 |
| Gray matter | 45 |
| Blood—acute hemorrhage | 50-70 |
| Calcium | >150 |
| Dense bone | 1000 |
| Metal | >>1000 |
CT images can be viewed in different ways to accentuate different tissues. Window level describes the center point of the gray scale, and window width describes the range of CT values displayed.6 For example, gray matter has an attenuation of approximately 35 HU, and white matter attenuation is approximately 45 HU. In order to differentiate gray matter from white matter, a narrow window is needed to highlight small changes in HU values. On the other hand, if detailed evaluation of dense material such as bone is desired, a wide window better delineates the margins. Window level and width are easily manipulated using most imaging viewing software.
In addition to window width and level, CT scans are generally processed using different reconstruction filters, frequently referred to as bone and standard algorithms.5 Both filters can be applied to a single acquisition of data, allowing accentuation of different structures. Standard algorithm is a method of averaging adjacent pixels to accentuate soft tissue detail. Standard algorithm images are useful for evaluating gray-white matter differentiation and for detecting blood. Bone algorithm images are processed to maximize edges, thus accentuating high-density materials such as calcium and metal. Bone algorithm images are also useful for evaluating lung parenchyma due to the differences in attenuation between aerated lung and small soft tissue attenuation structures such as blood vessels and pulmonary nodules.
Issues with Computed Tomography
Radiation Exposure
There is increasing awareness among health care providers and the general public of radiation exposure from medical imaging and the carcinogenic potential of x-rays. This is in part related to the dramatic increase in the utilization of CT over the past few decades. According to the American College of Radiology White Paper on Radiation Dose in Medicine7 approximately 3 million CT studies were performed in 1980, compared to approximately 60 million in 2005. Although CT has undoubtedly contributed positively to the care of patients, the cumulative radiation dose may have increased the risk of cancer in exposed patients, and up to 1% of U.S. cancers may be related to medical exposures. Based on studies of Japanese atomic bomb survivors, cancer risk increases with exposures as low as 50 mSv (millisieverts). Millisieverts are a measure of effective radiation dose, which is weighted for tissue sensitivity to the negative effects of radiation.8
Cancer risk depends on tissue type, and neural tissue is relatively resistant. Exposure to more radiosensitive tissues may also occur with neuroimaging. For example, exposure of the cornea may lead to cataracts in a dose-dependent fashion. The lens of the eye receives a dose of 40 to 50 mGy (milliGray, a measure of absorbed dose) per head CT,9,10 which can be reduced by eye shielding. Lens opacities have been seen with as little exposure as 500 mGy (10 CT scan equivalents), with vision-limiting cataracts forming at doses greater than 4 Gy (approximately 80 CT scan equivalents). Children are more susceptible than adults.
Iodinated Contrast Agents
Iodinated contrast material may be associated with contrast-induced nephropathy (CIN) in patients with renal failure, particularly those with diabetes mellitus. Strategies to reduce the risk of CIN include volume expansion through intravenous or oral fluids. Sodium bicarbonate infusion and prophylactic N-acetylcysteine have also shown efficacy compared to normal saline infusion.11 In patients with diminished renal function, reduced doses of contrast agent or iso-osmolar nonionic contrast agent can be considered. Of course, the best prevention of CIN is the avoidance of intravenous contrast material altogether, although this is not always feasible.
Another potential complication of iodinated contrast agent is contrast reaction. The incidence of contrast reaction after CT contrast scan is 0.2% to 0.7% (approximately 1/225).12,13 Contrast reactions may be mild or severe. Most reactions are mild, including nausea, vomiting, or rash. Severe reactions occur infrequently, with an incidence of approximately 0.05% (1/2000) for low osmolar iodinated contrast agent.12,13 Severe contrast reactions include bronchospasm, laryngeal edema, and cardiovascular collapse.
In patients with a history of moderate or severe contrast allergy, premedication strategies decrease, but do not eliminate, the risk of recurrent contrast reaction. Premedication strategies include prednisone (50 mg by mouth at 13, 7, and 1 hour prior to contrast injection) or methylprednisolone (32 mg by mouth at 12 and 2 hours before contrast injection), along with diphenhydramine (50 mg 1 hour prior to injection).14
Magnetic Resonance Imaging
Magnetic resonance imaging (MRI) was developed by a host of innovative scientists over multiple decades of development from a scientific tool to a medical imaging necessity. MRI is based on the principles of nuclear magnetic resonance (NMR), first discovered by Felix Bloch and Edward Purcell, for which they were awarded the Nobel Prize in physics in 1952. NMR can be utilized to characterize and differentiate tissues based on their intrinsic NMR signal. Using NMR techniques, chemist Paul C. Lauterbur and physicist Sir Peter Mansfield developed the gradients and mathematical formulations required for rapid 2-dimensional MR images, publishing the first images in 197315 and 1974.16 Drs. Raymond Damadian, Larry Minkoff, and Michael Goldsmith were also instrumental in the development and refining of this technology for use in humans.17 For their pioneering work in MRI development, Drs. Lauterbur and Mansfield shared the Nobel Prize in physiology or medicine in 2003.
The detailed physics principles underlying MRI are highly complex and beyond the scope of this chapter. In brief,18 a powerful electromagnetic field is created within the bore of an MRI machine, typically along the cranial-caudal (z) axis. Protons that are present in the human body predominantly as hydrogen atoms in water molecules reach equilibrium aligned along the direction of this magnetic field (longitudinal magnetization). A radiofrequency (RF) pulse is applied at a resonance frequency specific to the protons within the main magnetic field (B-zero), causing them to absorb energy and change their alignment toward the horizontal/vertical plane (x-y axes), called transverse magnetization. When the RF pulse ends, the protons first dephase in the x-y direction (free-induction decay, the basis of T2 signal) at a rate dependent on the molecular structure of the sample. The protons then realign along the z-axis (spin-lattice relaxation, the basis of T1 signal) at a slower rate, which is dependent on the molecular structure surrounding the proton. As the protons realign toward equilibrium, they emit RF energy that is detected by antennas (receiver coil) surrounding the patient in the scanner. By inducing small changes in frequency and phase of the proton resonance frequency that vary as a function of proton position, the MRI system reconstructs the precise location of each signal within the patient. The MRI system thus produces cross-sectional images through the patient where each pixel (corresponding to a defined volume of tissue, or voxel) depends upon the magnetic microenvironment of the corresponding tissue.
From this general principle, a variety of pulse sequences have been developed to emphasize different tissue characteristics.18 A pulse sequence refers to a specific pattern of RF pulses that may vary in timing, order, repetition, and direction. Basic pulse sequences include spin echo, inversion recovery including short tau inversion recovery (STIR) and fluid attenuated inversion recovery (FLAIR), and gradient echo imaging. The clinical applications of those sequences most pertinent to neuroradiology are described in this chapter.
MR angiography (MRA) can be performed by several techniques, including time-of-flight, phase-contrast, and gadolinium-enhanced MRA. In time-of-flight angiography, protons in moving blood are tagged in one tissue slab by applying an RF pulse to change their longitudinal magnetization.18 Tagged protons are subsequently detected in a different tissue slab that has not experienced the RF pulse. The direction of blood flow can be selected by applying a saturation pulse to null the longitudinal magnetization from protons traveling in the opposite direction. For example, to selectively visualize tagged blood protons moving superiorly within the cervical arteries, a saturation pulse is applied superior to the scan volume (e.g., within the head) to neutralize the longitudinal magnetization of the tagged protons within the intracranial compartment before they travel inferiorly in the cervical veins.
Phase contrast angiography is another method to detect moving protons such as those in blood or CSF.18 Phase contrast imaging depends on applying bipolar gradients to protons, so that stationary protons experience both positive and negative gradients, with no net phase change. Moving protons experience only one gradient before moving out of the field, resulting in positive or negative excitation.
Issues with Magnetic Resonance Imaging
There are several resources available to determine whether a particular implant is compatible or considered safe to scan with MRI, including a website maintained by the Institute for Magnetic Resonance Safety, Education, and Research (http://mrisafety.com).19 This website includes a free searchable database of the safety profile of many different implants and devices. The radiologist or MRI technologist can also provide valuable advice on MR safety.
Gadolinium Contrast Agents
Gadolinium-based contrast agents used in MRI have associated risks. The risk of contrast reaction after gadolinium-based contrast agent injection is lower than for iodinated contrast, with a reported incidence of 0.04% to 0.07% (approximately 1/2000).12,13 In one large series of contrast reactions after gadolinium-based contrast agent, 88% were considered mild. The overall incidence of severe reactions (those requiring epinephrine for treatment) was 0.001% to 0.01% of injections (approximately 1/20,000).
A relatively recent development in the use of gadolinium-based contrast agents has been the recognition of the link between contrast administration and nephrogenic systemic fibrosis (NSF) in patients with renal failure. NSF is a progressive fibrosing disease affecting the skin and soft tissues, often of the extremities. NSF may also affect striated muscle and the diaphragm.20,21 There is no clearly effective treatment. This entity is believed to be associated with gadolinium deposition in tissues and is not prevented by dialysis.22 The risk of NSF may vary depending on the particular contrast agent, but this is still under investigation.
NSF is rare, with an incidence of 1% to 7% in patients with renal dysfunction12,21 who receive gadolinium. It is associated with severe acute renal failure or chronic renal failure with an estimated glomerular filtration rate (GFR) of less than 15 to 30 mL/minute. It is also associated with renal or liver transplantation.20 Because of this association, gadolinium agents should be used with caution in patients with compromised renal function and should be avoided if possible in patients with GFR less than 30 mL/minute. As research in this area continues to evolve, discussion of these cases with the local radiologist is recommended.
Clinical Imaging
Radiography
Shunt series are the most commonly encountered of these studies and include radiographs of the shunt components in two planes. Shunt series are used to evaluate the nature of the shunt, including the location of the ventricular and distal catheters, drainage location (e.g., atrial, peritoneal, pleural), and the type and setting of the shunt valve, as well as to identify causes of shunt dysfunction.23 Shunt catheters, valves, and tubing can be quickly examined for kinks or disruption, without the cost or radiation exposure of CT or the time and cost of MRI. The type and setting of most implanted shunt valves can also be determined based on radiographic appearance.
Computed Tomography
The nonenhanced head CT has become the workhorse of acute neuroimaging, due to its wide availability, speed, and relatively low cost. CT provides rapid imaging of many intracranial processes and is excellent for the detection of intracranial hemorrhage, mass lesions, and evaluation of the ventricular system. CT is highly sensitive for calcifications, fat, and air, as well as metallic foreign bodies. In addition, CT allows rapid evaluation of the sequelae of intracranial pathology, including mass effect and brain herniation. Potential drawbacks of head CTs include radiation exposure and cost. In addition, MRI is more sensitive at detecting many parenchymal processes such as stroke, subtle enhancement, and small masses.
Noncontrast Imaging
Mass Effect and Herniation
There are several types of brain herniation, including subfalcine, uncal, transtentorial (upward and downward), and tonsillar herniation (Fig. 3.1). Brain can also herniate extracranially through a skull defect. CT is excellent at detecting all types of brain herniation.
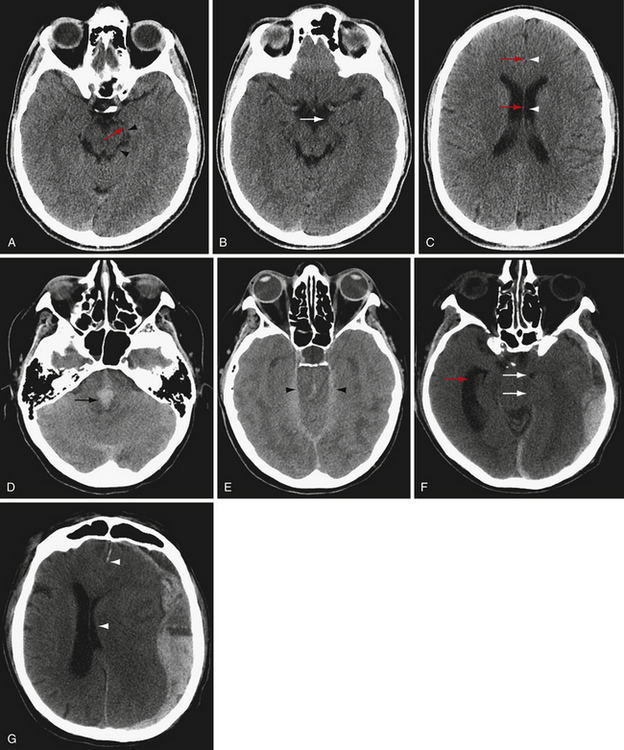
Subfalcine herniation occurs from a space-occupying lesion in the cerebral hemisphere causing the cingulate gyrus to be pushed under the rigid falx cerebri into the contralateral cranial vault24 (Fig. 3.1G). Subfalcine herniation commonly occurs with frontal lobe and parietal lesions. If midline shift is severe, the anterior cerebral arteries may be compressed, potentially leading to infarction. Subfalcine herniation is often measured as midline shift at either the level of the septum pellucidum, foramen of Monro, or third ventricle. It is important to measure midline shift at the same location to assess for changes between scans.
Uncal herniation is a type of unilateral descending transtentorial herniation involving the uncus, a component of the mesial temporal lobe that appears as a focal convexity at the anterior margin of the parahippocampal gyrus (Fig. 3.1B). Uncal herniation occurs when the mesial temporal lobe herniates medially and inferiorly, usually because of a temporal lobe or middle cranial fossa mass (Fig. 3.1F). To diagnose uncal herniation, find the suprasellar cistern and look for medial displacement of the uncus with compression of the ipsilateral perimesencephalic cistern. In severe cases, the herniated uncus will compress the ipsilateral cerebral peduncle24 and the brainstem may be shifted to the opposite side. There may be entrapment of the contralateral temporal horn of the lateral ventricle as CSF outflow is compressed. Recognizing and alleviating uncal herniation before progression to brainstem compression are important to minimize severe neurological consequences.
Transtentorial herniation is assessed by evaluating the basilar cisterns around the midbrain, including perimesencephalic cistern, ambient cistern, and quadrigeminal plate cistern.24 In the case of severely increased intracranial pressure or focal mass effect, the brain herniates downward through the tentorial incisura, first resulting in narrowing, then effacement of the basilar cisterns. If intracranial pressure continues to increase, the herniated brain will compress the brainstem (Fig. 3.1D and E), with narrowing of the transverse diameter of the midbrain. Transtentorial herniation may lead to compression of branches of the posterior cerebral artery against the tentorium with temporal or occipital infarction. Hydrocephalus may occur if the cerebral aqueduct is compressed. Severe transtentorial herniation may result in hemorrhages within the brainstem (Duret’s hemorrhages), which are a sign of grave prognosis.
If intracranial mass effect arises in the posterior fossa, cerebellar contents can herniate upward through the tentorial incisura.24 This displacement is usually accompanied by tonsillar herniation, the downward herniation of the cerebellar tonsils through the foramen magnum. Upward tentorial herniation appears similar to downward tentorial herniation on axial images at the level of the incisura, but a mass lesion in the posterior fossa will be present. Tonsillar herniation appears on axial CT as crowding of the contents at the foramen magnum with effacement of the perimedullary cistern. Sagittal reconstructions may be particularly helpful in delineating upward transtentorial herniation and cerebellar tonsillar herniation.
Hemorrhage
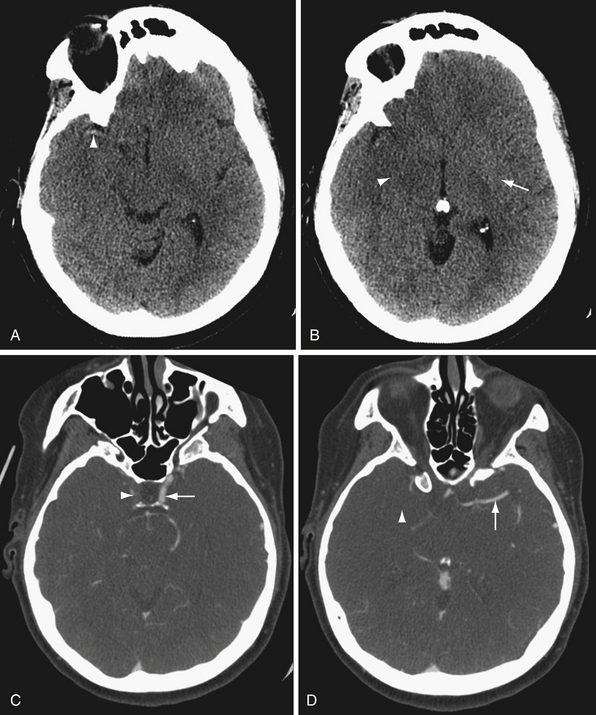
CT is highly sensitive for detecting intracranial hemorrhage. In general, acute hemorrhage (within hours of injury) is hyperdense to brain, with Hounsfield units in the range of 50 to 7025 (Fig. 3.2A). As the blood products break down and are reabsorbed, the density of the hematoma decreases. Subacute blood products (1-6 weeks) may appear isodense to brain (Fig. 3.2B). As the hematoma becomes chronic, the density approaches that of CSF. In the case of chronic subdural hematoma, there may be blood products of different density or fluid-fluid levels due to hemorrhages of different ages (Fig. 3.2C).
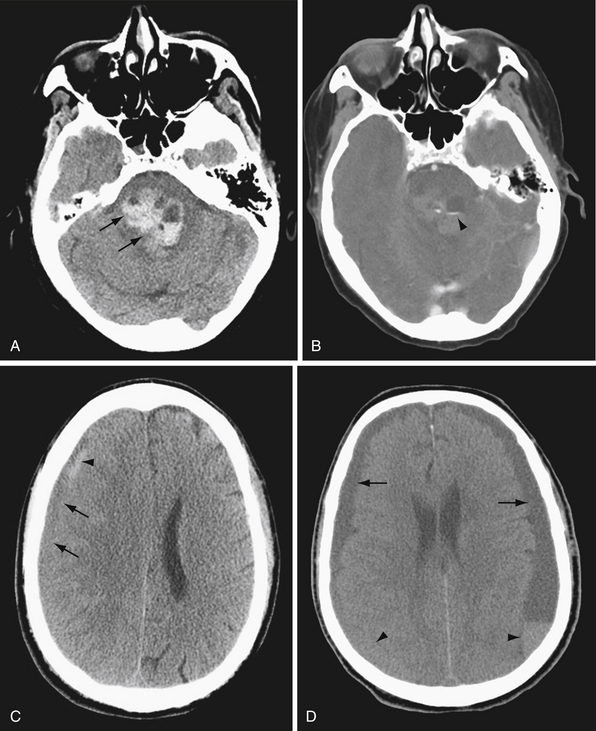
Hyperacute blood (ongoing bleeding or imaging immediately after hemorrhage) is heterogeneous in appearance (see Fig. 3.2A). If contrast agent is given as part of the study, active hemorrhage is evident as contrast extravasation. Acute hemorrhage may occasionally appear isodense in the setting of anemia or coagulopathy.
CT is also excellent for determining the location of hemorrhage (Fig. 3.3). In general, different compartments within the cranium include the epidural space, between the dura and inner table of the calvarium; the subdural space, between the dura and arachnoid membranes; the subarachnoid space, between the arachnoid membrane and brain surface; within the brain parenchyma; and within the ventricles. The location and pattern of bleeding can yield vital clues to the underlying cause of hemorrhage.
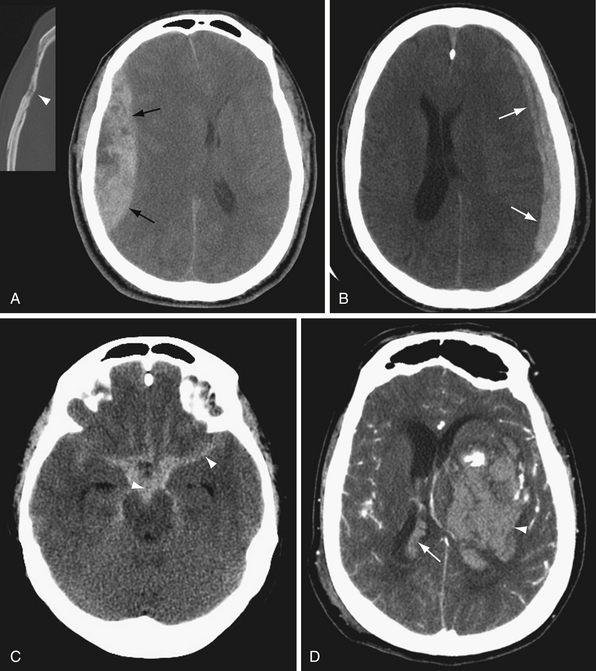
Trauma can result in hemorrhage in any of the above-named compartments. Epidural and subdural hemorrhages commonly occur after trauma. Epidural hemorrhage is associated with arterial bleeding, classically related to a skull fracture and often temporal in location. Epidural hemorrhage can also be present in the setting of venous sinus injury. Subdural hemorrhage can result even from minor trauma, and classically results from tearing of the subdural veins, especially in the elderly who have experienced cerebral atrophy.
Edema
Edema manifests on CT as decreased brain parenchymal attenuation due to increased water content. Vasogenic edema appears as low attenuation areas of the white matter with accompanying gyral enlargement and sulcal effacement. The cortical ribbon is preserved, and gray-white matter differentiation is accentuated. Vasogenic edema is associated with mass lesions, venous congestion, and hemorrhage, among other things. Cytotoxic edema is manifested as gyral enlargement with loss of gray-white differentiation. Cytotoxic edema is associated with ischemia, infarction, and anoxic brain injury. Diffuse cerebral edema is manifested by diffuse sulcal and cisternal effacement with loss of gray-white matter differentiation. Diffuse cerebral edema may result from acute traumatic brain injury or severe, widespread anoxic injury.
Infarction
CT is relatively insensitive for acute stroke. Nevertheless, CT is important in the evaluation of acute stroke, primarily to identify or exclude other causes of neurological deficit such as hemorrhage or mass lesion.26 Early signs of ischemia by CT include sulcal effacement, indicating focal cerebral edema in the ischemic tissue, and loss of gray-white differentiation (Fig. 3.4). Careful examination of the gray-white junction on CT using a narrow window width to accentuate the difference in attenuation between gray and white matter is vital for early detection of ischemia/infarction. In early ischemia, this gray-white differentiation is obscured owing to cytotoxic edema. A second look at the CT in the brain area corresponding to symptoms may also increase sensitivity. Post-contrast-enhanced CT is generally not indicated in the evaluation of stroke, as the enhancement seen in subacute strokes may confound early diagnosis.
Classic signs of a middle cerebral artery (MCA) territory stroke include the insular ribbon sign and the dense MCA sign. The insular ribbon sign refers to loss of gray-white differentiation of the insular cortex. Similarly, effacement of the lateral margin of the putamen or caudate head may provide early indication of an MCA infarction (see Fig. 3.4).
The dense MCA sign is seen with an acute thrombus in the middle cerebral artery. Because calcified atherosclerotic plaque is also dense, care should be taken to compare the affected MCA to the contralateral MCA to increase the specificity of this sign. A similar sign indicating basilar artery occlusion is also described but is less sensitive. Ultimately, if there is a question of a branch occlusion of the circle of Willis, vascular evaluation such as CTA or MRA should be pursued.
Hydrocephalus
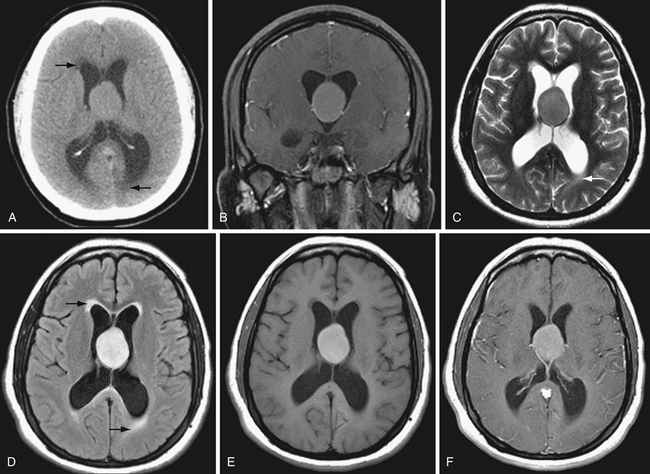
The ventricular system is seen well on noncontrast CT. Ventricular size depends in part on the age of the patient and the extent of cerebral parenchymal volume loss. It is important to evaluate ventricular size in relation to sulcal size. Enlarged ventricles with preserved sulci and widely patent basilar cisterns may simply reflect cerebral volume loss. Even slightly increased ventricular size in a young person with effaced sulci and cisterns is much more concerning for hydrocephalus (Fig. 3.5). Secondary signs of hydrocephalus include transependymal CSF flow, where pressurized CSF collects in the parenchymal interstitial space, particularly around the frontal horns.
Contrast-Enhanced Computed Tomography
Iodinated contrast agent may be useful in some situations. For example, in patients with a suspected mass lesion such as tumor or abscess, contrast enhancement will better demonstrate the lesion. Contrast also increases the sensitivity of CT for small masses. Contrast can be helpful in the evaluation of infection after craniotomy by highlighting peripheral enhancement of fluid collections. In general, MRI is more sensitive than CT for mass lesions. The advantages of contrast-enhanced CT over MR include availability and rapidity of the examination, ability to perform CT in unstable patients or patients with contraindications to MR (e.g., metal implants), and the ability to perform CT in larger patients than many MRI scanners can accommodate.
Computed Tomographic Angiography
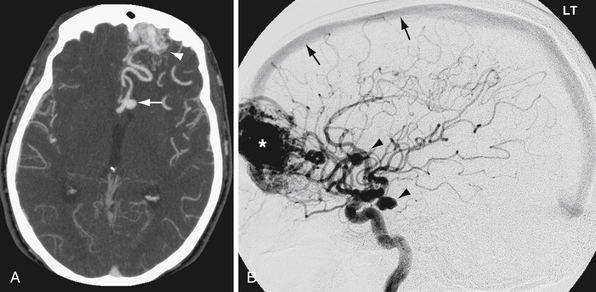
CTA offers the advantages of wide availability, speed of acquisition, and avoidance of many of the potential complications of conventional angiography such as stroke and vascular dissection. Angiography does provide useful physiological information that CTA does not, such as blood flow dynamics. For example, angiography can detect delayed flow through a vascular stenosis, or arteriovenous shunting in arteriovenous malformations and dural arteriovenous fistulas (Fig. 3.6). Angiography also exquisitely reveals the arterial supply and venous drainage pattern in these cases.
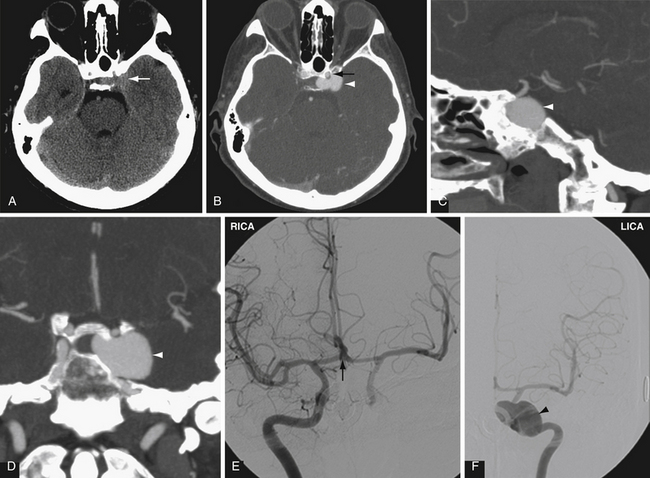
In many centers, CTA is replacing conventional angiography in the evaluation of subarachnoid hemorrhage. CTA is not as sensitive as conventional angiography for the detection of small aneurysms,27 but newer multislice scanners with three-dimensional reformation may increase the sensitivity of CTA.28 In addition, CTA provides additional anatomical information, such as the relationship of an aneurysm to the bony skull base and presence of a thrombosed component (Fig. 3.7).
Computed Tomography Perfusion
Perfusion CT (CTP) is a type of contrast-enhanced CT study in which serial images are obtained through a section of brain parenchyma during the administration of intravenous contrast agent. Maps of cerebral blood flow (CBF, measured in mL/100 g tissue/minute), mean transit time (MTT, measured in seconds), and cerebral blood volume (CBV, measured in mL/100 g tissue) can be derived using the central volume principle.29 Briefly, the tissue residual function, based on parenchymal contrast enhancement per pixel as a function of time, and the arterial input function, based on arterial contrast enhancement (typically an anterior cerebral artery), can be deconvolved using a singular value decomposition method to derive CBV and MTT. CBF can then be calculated from the equation:

Qualitative analysis of colorized perfusion maps reveal areas of the brain with altered perfusion. Quantitative analysis of perfusion parameters can also be performed to obtain numerical values of CBF, CBV, and MTT.30 Table 3.2 contains normal values for each parameter.31
| Parameter | Value | Units |
|---|---|---|
| CBF | 30-70 | mL/100 g/min |
| CBV | 2.2-4.2 | mL/100 g |
| MTT | 3-6 | sec |
CBF, cerebral blood flow; CBV, cerebral blood volume; MTT, mean transit time.
A common clinical application of perfusion CT is to assess for potentially salvageable tissue (penumbra) in acute stroke patients. With ischemia, cerebral blood flow decreases. Tissue is considered ischemic when CBF is less than 20 mL/100 g/minute. As CBF falls below 10 mL/100 g/minute, the ischemic threshold is passed and the tissue suffers irrevocable damage.32 When evaluating a stroke patient, comparison of the CBV and either TTP or MTT maps is most helpful for detecting infarct penumbra.33
The CBV map best correlates with the size of subsequent core infarction.33,34 There is a correlation between the infarct core determined by CBV map and the area of restricted diffusion by MRI. The MTT map is the most accurate for detecting regions of decreased perfusion.33 The infarct penumbra is the brain parenchyma with prolonged MTT (>6 seconds)32 but relatively normal CBV (i.e., MTT abnormality minus the infarct core). Patients with a large infarct penumbra may benefit from intra-arterial thrombolysis or other aggressive therapies.
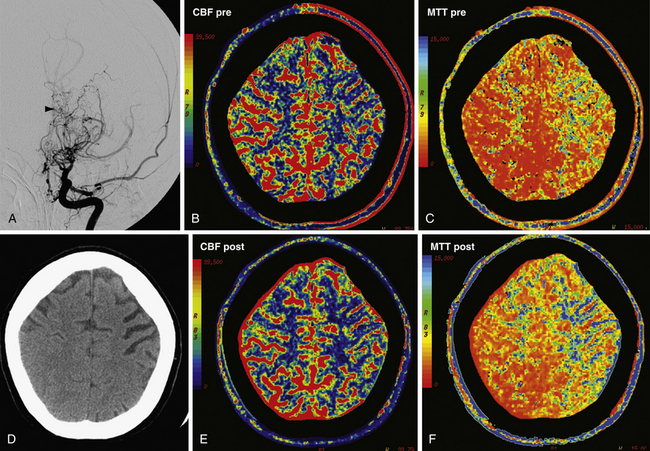
Perfusion CT is also used in assessing cerebrovascular reserve.32 Similar to xenon-CT with acetazolamide challenge, patients can undergo perfusion CT at baseline and following either acetazolamide or CO2 challenge. Administration of either agent results in cerebrovascular dilatation. In a person with impaired perfusion to a portion of brain parenchyma, the physiological mechanism of cerebral autoregulation compensates by dilating cerebral vasculature, lowering cerebrovascular resistance and maximizing CBF to the region of ischemic tissue. Cerebrovascular reserve refers to how much capacity the cerebrovasculature has for additional vasodilatation. In a person with no cerebrovascular reserve, no additional vasodilatation is possible. When given vasodilating agents, normally perfused brain will experience vasodilatation and increased CBF. Areas without cerebrovascular reserve already are at maximal cerebrovascular dilatation and will experience relatively decreased CBF compared to the normal areas (Fig. 3.8). Steal phenomena may occur when areas without cerebrovascular reserve experience a decrease in CBF due to the increased perfusion to normal areas. Patients without cerebrovascular reserve may benefit from further therapies aimed at revascularization.
Magnetic Resonance Imaging
MRI is a sensitive method for detecting many abnormalities of the brain. MRI provides excellent soft tissue contrast and is sensitive for infarction, hemorrhage, and small masses, among other things. Because MRI is used for such a variety of pathologies, this chapter focuses on the strengths of different MRI sequences for diagnosis. MRI research continues to advance, with the development of new and faster pulse sequences. The basics of MR physics are very briefly described.
T1-Weighted Imaging
T1-weighted images are commonly used to assess anatomy. On T1 sequences, gray matter is darker (hypointense) than white matter. Certain substances demonstrate inherent T1 shortening, meaning they appear brighter (hyperintense) relative to other structures (Fig. 3.9). Substances that appear bright on T1 sequences include fat, methemoglobin, some calcifications, melanin (as can be seen in melanoma metastases), proteinaceous fluid, and gadolinium contrast agents. In some cases, blood flow can cause T1 signal hyperintensity even in the absence of contrast administration, particularly at the skull base. This flow-related enhancement or flow artifact is caused by unsaturated protons moving into the imaging plane.35
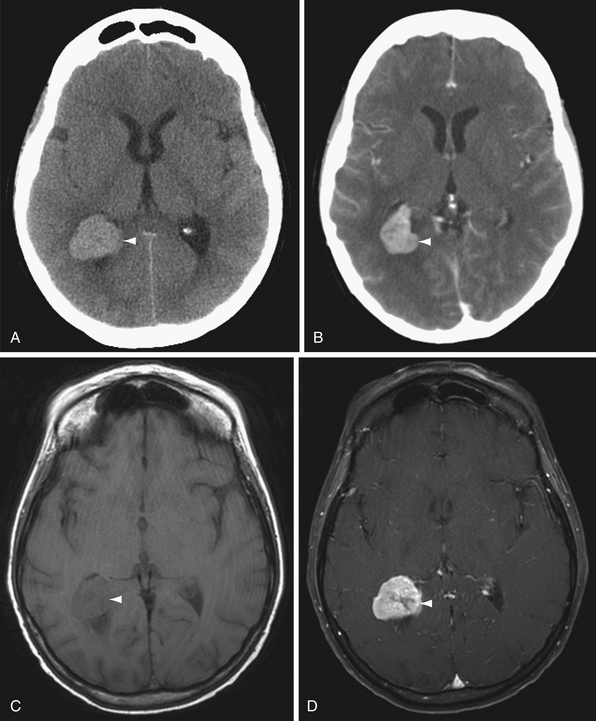
T1-weighted images are also used to evaluate enhancement after intravenous gadolinium contrast administration. Breakdown of the blood-brain barrier allows intravenous gadolinium contrast to accumulate in the extravascular space within tissue, resulting in contrast enhancement on MRI (Fig. 3.10). Detection of tumors is a common reason to use contrast material, but abscesses, hematomas, demyelinating lesions, and subacute infarcts may all have areas of blood-brain barrier disruption, and therefore may also enhance. If the area of concern is within the bone marrow, including the calvarium, skull base, and spine, postcontrast fat suppression is helpful to null the inherent T1 signal hyperintensity due to bone marrow fat content, allowing optimal visualization of gadolinium enhancement.
T2-Weighted Imaging
T2-weighted images and the closely related FLAIR sequence are commonly used to assess for fluid and edema. Many pathological processes in the brain are bright on T2 and FLAIR sequences, including edema, neoplasms, gliosis, and demyelinating lesions, among other entities. The FLAIR sequence is essentially a T2-weighted sequence in which simple fluid signal from CSF, for example, has been nulled and appears dark rather than bright as on T2. Proteinaceous fluid incompletely nulls and therefore appears brighter than CSF on FLAIR, allowing for differentiation of a CSF-filled space from a space containing proteinaceous fluid. However, FLAIR imaging is susceptible to CSF flow-related artifacts, particularly in the posterior fossa where T2 is often most useful for finding small posterior fossa and brainstem lesions.
T2∗-Weighted Imaging
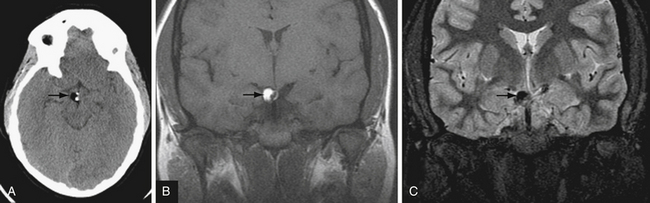
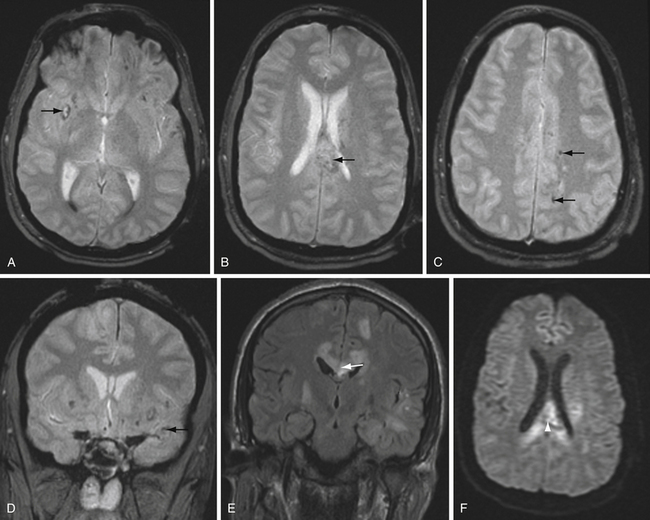
T2∗-weighted gradient echo sequence highlights areas of magnetic field inhomogeneity that cause magnetic susceptibility artifacts. Areas of field inhomogeneity result in signal dropout and appear dark black. These areas may be caused by imperfections in the magnet, but also can be caused by certain ferromagnetic or paramagnetic material such as metal and blood products. Calcium causes susceptibility artifacts as well, but these areas of susceptibility are less intense than metal and blood products. T2∗ sequences are highly sensitive for small areas of hemorrhage, and are useful for detecting subtle or old microhemorrhages from hypertension, cerebral amyloid angiopathy, diffuse axonal injury, and cavernous malformations (Fig. 3.11).
Susceptibility-weighted imaging is a newer sequence that provides high-resolution images highlighting areas of altered magnetic susceptibility such as hemorrhage, calcium, and blood vessels.36 The advantages of this sequence include the ability to reformat in multiple planes and high sensitivity. In fact, susceptibility-weighted imaging is more sensitive than standard T2∗ sequences in detecting small microhemorrhages37 and can also detect a variety of vascular malformations.38 The high sensitivity of susceptibility-weighted imaging may also be a disadvantage, because there are many potentially distracting areas of signal dropout that do not represent hemorrhage.
Diffusion-Weighted Imaging
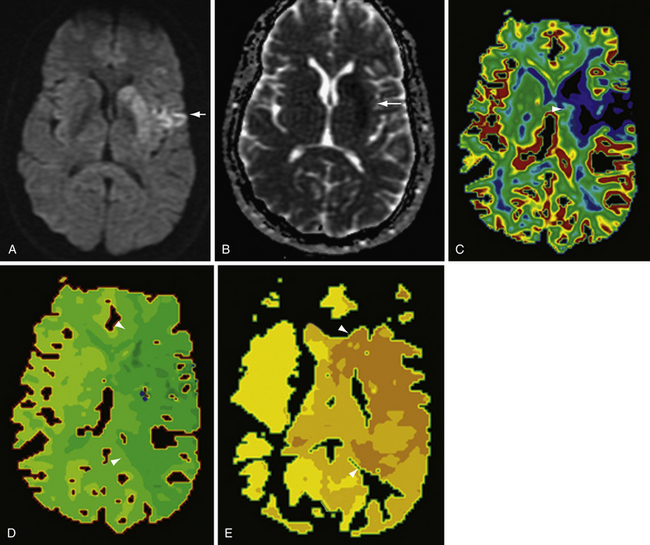
Diffusion-weighted imaging (DWI) is inherently a series of T2-weighted sequences that detect movement of protons in water molecules by applying opposite gradient pulses in each of three orthogonal directions. If there is no net movement of water molecules, their underlying T2 signal intensity is preserved, resulting in hyperintense DWI signal. Conversely, net movement of water molecules along the direction of the applied gradients39 causes dephasing with underlying T2 signal loss, resulting in hypointense DWI signal. In regions in which brownian movement of water molecules is constrained, DWI signal is increased (called restricted diffusion) owing to lack of net movement. However, because DWI sequences contain T2-weighting, areas within the brain with high inherent T2 signal intensity can also show increased signal on DWI sequence, so-called T2 shine-through. To distinguish T2 shine-through from true restricted diffusion, consult the apparent diffusion coefficient (ADC) map. Areas of T2 shine-through will be bright on both DWI and its corresponding ADC map, whereas areas of restricted diffusion appear bright on DWI and dark on ADC.
The most important cause of restricted diffusion on DWI is acute ischemia. Although commonly thought to reflect areas of infarct core, a recent systematic review found reversible DWI lesions in 24% of patients in reviewed studies,40 half of whom had received thrombolytic therapy. This finding suggests that DWI hyperintense lesions in acute stroke may reflect both ischemic core and some reversibly ischemic tissue.
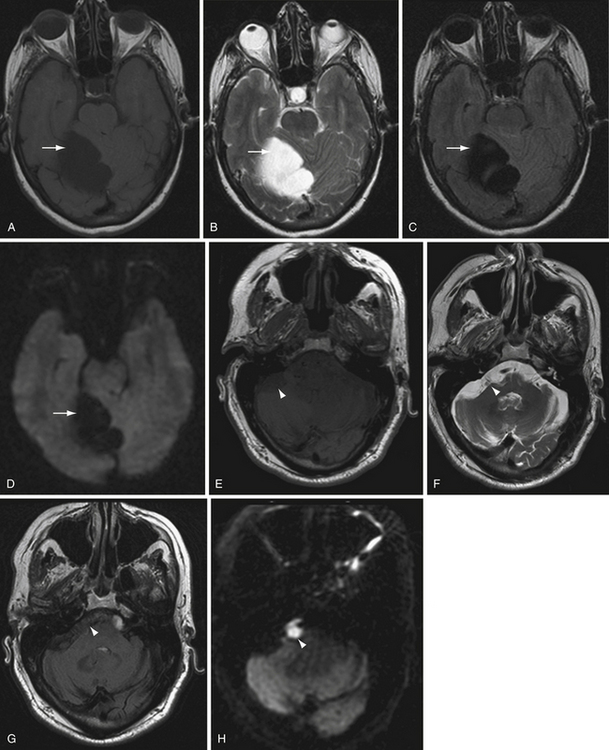
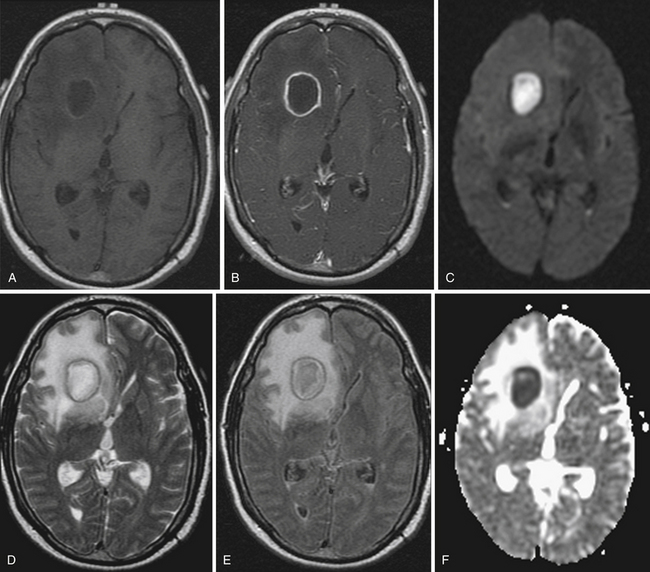
Restricted diffusion can also be present in cerebral abscesses, diffuse axonal injury, active demyelination, and highly cellular tumors such as CNS lymphoma. DWI is particularly helpful in two classic cases. The differential diagnosis for a ring-enhancing parenchymal mass frequently includes intracranial neoplasm such as metastasis or high-grade astrocytoma as well as cerebral abscess. The central nonenhancing component of a pyogenic abscess classically demonstrates markedly restricted diffusion, with decreased ADC values (Fig. 3.12). This differentiates abscess from neoplasm, in which DWI signal is usually, but not always, normal or elevated.
Another classic situation in which DWI is particularly helpful is in differentiating an epidermoid cyst from arachnoid cyst, for example, in the cerebellopontine angle cistern. Epidermoid cysts exhibit bright DWI signal (Fig. 3.13).41 Arachnoid cysts follow CSF on all sequences, and will therefore have low DWI signal.
Blood Degradation on Magnetic Resonance Imaging
Parenchymal hematomas can have a confusing MR appearance because of the changes in imaging appearance over time.25,42 The state of hemoglobin affects the magnetic properties of iron by changes in the oxidation state, resulting in changes in T1 and T2 signal properties. Knowledge of the pattern of changes can be helpful for establishing the time course of hemorrhage evolution as well as preventing misdiagnosis of hemorrhage as a different mass lesion (Table 3.3).
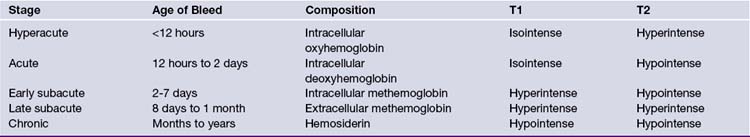
Hyperacute hemorrhage is liquid and predominantly contains intracellular oxygenated hemoglobin. At this stage, the hemorrhage is isointense on T1 and bright on T2. During the acute phase (approximately 12 hours to 2 days), the hemoglobin becomes progressively deoxygenated, and the hematoma becomes dark on T2 while remaining isointense on T1. As the hematoma continues to break down in the early subacute phase (2 to 7 days), the hemoglobin is denatured to methemoglobin, which initially remains in the intracellular compartment. Methemoglobin appears hyperintense on T1 but remains dark on T2. As the red blood cells lyse in the late subacute phase (approximately 8 days to 1 month), the extracellular methemoglobin becomes bright on T2 and remains bright on T1. Finally, as the hematoma further evolves into the chronic stage (months to years), the iron from degraded hemoglobin is stored within hemosiderin and ferritin, and becomes dark on both T1 and T2.42
Magnetic Resonance Angiography
Noncontrast MRA of the neck uses a two-dimensional TOF technique, because flow in the neck occurs primarily in the superoinferior direction. The larger region of interest requires acquisition of images in multiple slabs. If there is movement between the acquisitions of adjacent slabs, there will be stair-step artifact along the course of the vessel that can limit interpretation. One way to avoid this artifact is to perform gadolinium bolus MRA of the neck. In this case, direct coronal acquisition through the cervical vessels during peak arterial enhancement phase of the contrast bolus can be performed. Images from either MRA technique are reformatted to provide three-dimensional images with maximum intensity projections (MIP reformatted images).
The differences in contrast and noncontrast MRA of the neck can be illustrated by comparing vessel occlusion with subclavian steal syndrome (Fig. 3.14). In the case of vessel occlusion, there will be no flow-related signal on TOF sequence because there are no tagged protons traveling through the occluded vessel. In addition, there will be no contrast opacification of the occluded vessel (see Fig. 3.14, carotid artery).
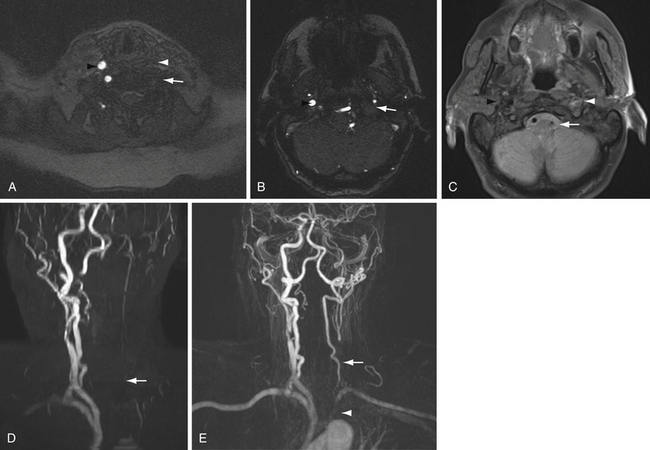
Conversely, in the case of subclavian steal there is reversal of flow in the affected vertebral artery. In this case, a two-dimensional TOF sequence through the vessel will not detect flow-related signal, because flow in the vessel runs superior to inferior. A saturation pulse superior to the cervical vessels is applied to remove flow-related signal in the cervical veins, which may overlap and thereby obscure the cervical arteries. Because the flow in the left vertebral artery also runs superior to inferior in the case of subclavian steal, the tagged protons in this flow-reversed vertebral artery are also suppressed on two-dimensional TOF MRA. However, the flow-reversed vertebral artery continues to opacify with contrast on gadolinium-bolus MRA, because the vessel remains patent (see Fig. 3.14).
Noncontrast TOF or phase contrast sequences through the dural venous sinuses can also be performed to evaluate intracranial venous structures (MR venography, MRV). In general, imaging in both the axial and coronal planes is recommended to detect flow in the superior sagittal sinus as well as the transverse sinuses.
Magnetic Resonance Perfusion
A complementary perfusion technique to CT perfusion is MR perfusion. MR perfusion is performed by one of two methods, either with intravenous contrast agent or by using arterial spin labeling. In contrast-enhanced MR perfusion, images are acquired during rapid contrast bolus transit through the entire brain. The dynamic susceptibility contrast (DSC) technique uses a T2∗-sensitive pulse sequence to image the contrast agent over time as it passes through the brain parenchyma. Gadolinium causes signal loss on T2∗-sensitive sequences due to the paramagnetic effects of gadolinium. This signal loss is plotted against time to reveal a signal intensity curve. The negative enhancement integral is the calculated area under this curve, which corresponds to the cerebral blood volume.43 From this graph, perfusion maps equivalent to CBV, CBF, and MTT can be derived.43 If the perfusion images are acquired using a T1-based pulse sequence, the technique is called dynamic contrast-enhanced (DCE) MR perfusion. In this technique, perfusion maps are derived in a similar fashion to perfusion CT, as described previously.40
Both dynamic susceptibility contrast and dynamic contrast-enhanced MR perfusion have been used in a variety of clinical settings, including stroke and the evaluation of unknown brain lesions. In acute stroke imaging, a mismatch between perfusion and diffusion abnormalities on MRI is thought to represent ischemic penumbra; that is, brain tissue that is ischemic but not yet infarcted. The perfusion abnormality has been defined in many ways, most commonly as delayed time to peak (TTP),44 but also as an area of prolonged MTT. The infarct core is generally defined as the area of restricted diffusion. Patients in whom there exists a large ischemic penumbra may benefit from intra-arterial thrombolysis or other therapies intended to salvage the at-risk tissue defined by the penumbra (Fig. 3.15).
Arterial spin labeling perfusion MR is a different technique in which contrast material is not given, but arterial water is tagged by an inverted pulse applied proximal to the imaging plane.45 As these magnetically tagged protons flow into the imaging slabs covering the brain, they equilibrate with tissues, acting as a diffusible tracer. Images acquired with and without spin labeling are subtracted, resulting in a map of relative concentration of arterial water, corresponding to a cerebral blood flow map. Quantitative values of CBF in mL/100 g tissue/minute can be calculated.
Arterial spin labeling (ASL) perfusion MR has been used for many applications, including stroke. Comparing CBF maps either visually or by quantitative analysis of CBF values to DWI maps can also demonstrate areas of perfusion-diffusion mismatch, thought to correlate to ischemic penumbra.46 Other indications for ASL perfusion MR reported in the literature include assessing chronic ischemia, epilepsy, neoplasms, vascular malformations, and luxury perfusion.47,48
Functional Magnetic Resonance Imaging
Functional MRI (fMRI) is a technique in which serial images of the brain are obtained while a patient performs a functional task. Pulse sequences are maximized for the detection of increased blood oxygenation level, felt to represent activation of a brain area.49 The signal changes detected are extremely small, and repetitive performance of the task with accumulation of the imaging data is required to achieve adequate signal-to-noise for analysis.
Functional MRI has been used in a variety of clinical settings.49 fMRI has been used to lateralize language and memory in patients with epilepsy in whom surgical treatment is planned. Functional cortex can be mapped prior to surgery in cases of planned tumor resection when the tumor lies within or near eloquent areas. This technique is also widely used in research studies to evaluate and localize different brain functions. Undoubtedly, new uses of fMRI will continue to be developed as research in this field progresses.
Diffusion Tensor Imaging
Diffusion tensor imaging is a sophisticated version of diffusion-weighted imaging in which detection of the movement of water molecules is performed in six or more directions rather than the standard three dimensions, as with DWI.50 In the brain, water molecules tend to exhibit motion preferentially in certain directions over others according to the underlying cellular architecture, a property termed anisotropy that is mapped according to fractional anisotropy (FA mapping). Areas with high fractional anisotropy (relatively closer to an FA value of 1.0) show a strong directionality of water molecular movement, whereas areas with low fractional anisotropy (closer to an FA value of zero) show relatively less directionality of water motion. Most often, water molecular motion appears to be organized along known white matter tracts. By analyzing the movement of water molecules throughout the brain, a map of these fiber tracts can be constructed (DTI tractography).
DTI has been used in neurosurgical practice to map important fiber tracts in patients with tumors in eloquent areas. The technique of isolating important fiber tracts by selecting key anatomical areas and mapping pathways of anisotropic water movement between them can help to identify the location of important white matter fiber tracts with respect to the mass lesion. Using techniques such as these may facilitate safe maximal resection.51 However, it must be emphasized that the fiber tracts revealed by diffusion tractography are not the actual white matter tracts themselves, but instead a representation of white matter tracts based on the analysis of anisotropic water movement.
Magnetic Resonance Spectroscopy
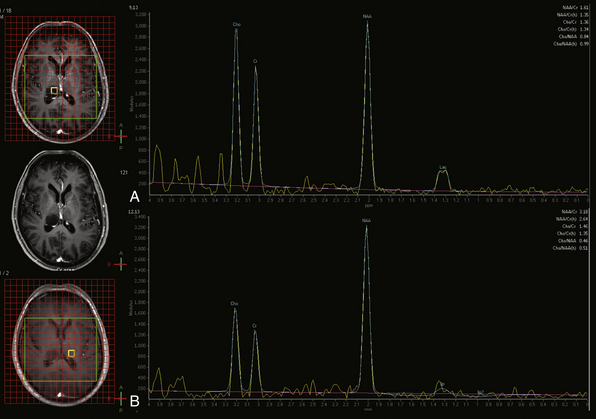
MR spectroscopy (MRS) is a method of sampling a volume of brain tissue for known metabolites. In clinical MRS, proton (1H) MRS is most commonly used because of the abundance of protons in tissue. MR spectroscopy can be acquired in several different fashions. In single voxel MRS, a single volume of tissue is selected for study. This tissue can be sampled at different echo times (TE) to highlight different metabolites. The echo times used in short TE studies are approximately 35 msec, whereas long TE studies frequently use either 144 msec or 288 msec. MRS at any of these echo times shows metabolite peaks corresponding to N-acetyl aspartate (NAA), creatine (Cr), choline (Cho), lactate (Lac), and lipid (Lip) if present. At 144 msec, the lactate peak often projects (inverts) below the baseline rather than above, and it frequently displays a doublet peak pattern, helping to differentiate it from the broader, adjacent lipid peak. Short TE studies also reveal the peaks of additional metabolites including glutamine and glutamate (Glx) and myoinositol (mI), among others.
Different metabolites are felt to represent different physiological processes.52 Creatine is generally used as an internal reference peak for cellular metabolism and, as a first approximation, is assumed to be relatively stable in concentration throughout the parenchyma. NAA is often used as a marker of neuronal integrity, whereas choline is frequently used as a marker for cellular membrane turnover reflecting cellular proliferation. Lactate indicates the presence of anaerobic glycolysis. Myoinositol is a marker of myelin degradation. Lipids may indicate necrosis or disruption of myelin.
The pattern of the spectral peaks can help determine whether a lesion is neoplastic in nature, for example.53 Elevated Cho:Cr peak height ratio, depressed NAA, and presence of lactate are all findings associated with neoplasia (Fig. 3.16). However, one of the diagnostic challenges with MRS is that changes in relative metabolic peak height for the various metabolites may be nonspecific as to etiology, and in such cases MRS spectra should always be interpreted in the context of other available imaging data.
Nuclear Medicine Studies
SPECT is a nuclear medicine imaging modality that can be used to detect changes in brain perfusion,54 among other things. For brain SPECT, a tracer agent is tagged with a radionuclide and inhaled or intravenously injected. The agent accumulates in brain parenchyma proportionate to cerebral blood flow in a given region of brain tissue. As the radionuclide decays, photons are emitted. Areas with relatively higher cerebral blood flow such as gray matter accumulate more radiotracer and therefore emit more photons than relatively lower flow areas such as white matter. These photons are detected by gamma cameras positioned around the head, and the information is reconstructed into tomographic slices. The intensity of each voxel in SPECT imaging represents the relative uptake of the radiotracer. Because voxels are compared to each other, actual blood flow is not directly measured, and brain SPECT in its usual clinical form is a qualitative test (with the exception of inhaled xenon gas; see later discussion).
In addition to the detection of cerebral perfusion, the SPECT technique can be applied to other compounds and other areas of the body. For instance, the density of radiolabeled leukocytes in a lesion suspicious for abscess can support that diagnosis.55 Brain SPECT can also be used for molecular imaging. For example, a radiolabeled receptor ligand, such as a neurotransmitter, can be used to localize receptor activity.56
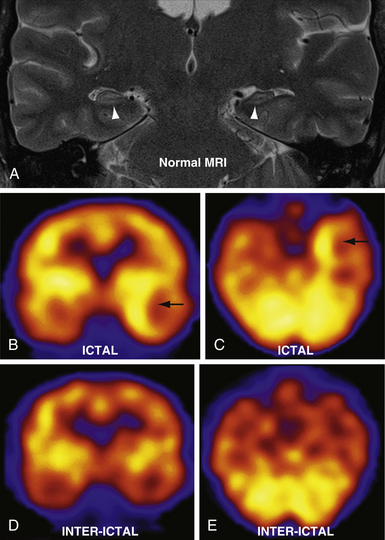
In clinical practice, brain SPECT is most often used in cases of epilepsy, cerebrovascular disease, and the evaluation of dementia. Seizures can significantly increase focal cerebral blood flow in epileptogenic tissue57 (Fig. 3.17). Because 99Tc tracers are rapidly taken up by brain tissue and remain there for up to 6 hours, the radionuclide can be injected within a minute of seizure onset, and SPECT imaging can then subsequently be performed when the seizure is over and the patient is stable. The perfusion during a seizure (ictal SPECT) is compared to perfusion between seizures (interictal SPECT). Seizure foci show ictal hyperperfusion and interictal hypoperfusion, which can be useful when electroencephalography (EEG) or clinical data are conflicting or nonspecific, or to highlight the epileptic focus in secondary generalized seizure disorders. In addition, lack of perfusion changes in a patient with clinical seizure-like activity may imply pseudoseizure or other nonepileptogenic phenomena. Combined with MRI and EEG, SPECT is a useful adjunct in the presurgical evaluation of epilepsy patients.58
Cerebrovascular disease and stroke can also be evaluated with brain SPECT.59 SPECT can be used to define ischemic penumbra in an ongoing stroke, although CT and MR perfusion are more commonly used for this purpose owing to their relatively wider availability, more rapid acquisition times, and higher spatial resolution.60 Brain SPECT can also be used to evaluate cerebrovascular reserve in a patient with chronic cerebral ischemia. Such tests require the introduction of a vasodilatory agent (acetazolamide or inhaled 5% CO2), followed by the injection of radionuclide tracer. In normally perfused tissue, administration of a vasodilator causes hyperperfusion. In areas supplied by diseased vasculature, hyperperfusion does not occur, as the affected vessels are either unable to dilate, or are already maximally dilated, and in fact hypoperfusion induced by the steal phenomenon may be observed. Revascularization procedures may be considered in such patients.61
Cerebral vasospasm has also been studied using SPECT. Vasospasm is a well-known complication of subarachnoid hemorrhage, and can cause ischemia or infarction.62,63 Cerebral angiography is the gold standard for the diagnosis of cerebral vasospasm, but SPECT has also been used to evaluate hypoperfusion in the setting of suspected vasospasm.64 A recent study of SPECT obtained within 24 hours of angiographically confirmed vasospasm failed to confirm the predictive utility of SPECT, however, thus potentially limiting the role of brain SPECT imaging in vasospasm.65
Finally, nuclear medicine studies including SPECT can be used as a noninvasive corroborative test in the evaluation of brain death.66 In brain death there is absent cerebral perfusion manifesting as an intracranial compartment devoid of any radiotracer uptake. The majority of head and neck blood flow is routed to the external carotid circulation, resulting in the characteristic “hot nose” sign. This test must be interpreted in conjunction with high clinical suspicion of brain death, as brain SPECT alone is not sufficient to diagnose brain death.67
ACR Appropriateness Criteria. Neurologic Imaging. American College of Radiology; 2010. Accessed March 1, 2010, at http://www.acr.org/SecondaryMainMenuCategories/quality_safety/app_criteria.aspx
de Lucas E.M., Sanchez E., Gutierrez A., et al. CT protocol for acute stroke: tips and tricks for general radiologists. Radiographics. 2008;28:1673-1687.
Kidwell C.S., Wintermark M. Imaging of intracranial haemorrhage. Lancet Neurol. 2008;7:256-267.
Laine F.J., Shedden A.I., Dunn M.M., Ghatak N.R. Acquired intracranial herniations: MR imaging findings. AJR Am J Roentgenol. 1995;165:967-973.
Shih L.C., Saver J.L., Alger J.R., et al. Perfusion-weighted magnetic resonance imaging thresholds identifying core, irreversibly infarcted tissue. Stroke. 2003;34:1425-1430.
Please go to expertconsult.com to view complete list of references.
1. Jamal T., Gunderman R.B. The American College of Radiology appropriateness criteria (R): the users’ perspective. JACR J Am Coll Radiol. 2008;5(3):158-160.
2. ACR Appropriateness Criteria. Neurologic Imaging. American College of Radiology; 2010. Accessed March 1, 2010, at http://www.acr.org/SecondaryMainMenuCategories/quality_safety/app_criteria.aspx
3. Bushberg J.T., Seibert J.A., Leidholdt J., et al. Introduction to Medical Imaging, 2nd ed. Philadelphia: Lippincott Williams & Wilkins; 2002,. Chap. 1
4. Grossman R.I., Yousem D.M., editors. Techniques in Neuroimaging. Neuroradiology: The Requisites, 2nd ed., Philadelphia: Mosby, 2003.
5. Bushberg J.T., Seibert J.A., Leidholdt J., et al. Computed Tomography. The Essential Physics of Medical Imaging, 2nd ed. Philadelphia: Lippincott Williams & Wilkins; 2002. Chap. 13
6. Barnes J.E. AAPM tutorial: characteristics and control of contrast in CT. Radiographics. 1992;12:825-837.
7. Amis J., Butler P.F., Applegate K.E., et al. American College of Radiology white paper on radiation dose in medicine. JACR J Am Coll Radiol. 2007;4(5):272-284.
8. Pierce D.A., Preston D.L. Radiation-related cancer risks at low doses among atomic bomb survivors. Radiat Res. 2000;154:178-186.
9. Hopper K.D., Neuman J.D., King S.H., Kunselman A.R. Radioprotection to the eye during CT scanning. AJNR Am J Neuroradiol. 2001;22:1194-1198.
10. Diekmann S., Siebert E., Juran R., et al. Dose exposure of patients undergoing comprehensive stroke imaging by multidetector-row CT: comparison of 320-detector row and 64-detector row CT scanners. AJNR Am J Neuroradiol. 2010;31(6):1003-1009.
11. Reddan D., Laville M., Garovic V.D. Contrast-induced nephropathy and its prevention: what do we really know from evidence-based findings? J Nephrol. 2009;22:333-351.
12. American College of Radiology. Manual on Contrast Media. Reston, VA: American College of Radiology; 2008. Version 6
13. Hunt C.H., Hartman R.P., Hesley G.K. Frequency and severity of adverse effects of iodinated and gadolinium contrast materials: retrospective review of 456,930 doses. AJR Am J Roentgenol. 2009;193(4):1124-1127.
14. King B.F.Jr. Intravascular contrast media and premedication. In: Bush W.H.Jr., Krecke K.N., King B.F.Jr., Bettmann M.A., editors. Radiology Life Support (Rad-LS). New York: Oxford University Press, 1999.
15. Lauterbur P.C. Image formation by induced local interactions: examples of employing nuclear magnetic resonance. Nature. 1973;242:190-191.
16. Lauterbur P.C. Magnetic resonance zeugmatography. Pure Appl Chem. 1974;40:149-157.
17. Damadian R., Goldsmith M., Minkoff L. NMR in cancer: XVI. Fonar image of the live human body. Physiolog Chem Physics. 1977;9:97-100.
18. Bushberg J.T., Seibert J.A., Leidholdt J., et al. Nuclear Magnetic Resonance. The Essential Physics of Medical Imaging, 2nd ed. Philadelphia: Lippincott Williams & Wilkins; 2002,. Chap. 14
19. Shellock F.G. Institute for Magnetic Resonance Safety, Education, and Research. 2010. [cited 2010 March 1]. Available from http://mrisafety.com/
20. Perez-Rodriguez J., Lai S., Ehst B.D., et al. Nephrogenic systemic fibrosis: incidence, associations, and effect of risk factor assessment—report of 33 cases. Radiology. 2009;250(2):371-377.
21. Sadowski E.A., Bennett L.K., Chan M.R., et al. Nephrogenic systemic fibrosis: risk factors and incidence estimation. Radiology. 2007;243(1):148-157.
22. Wiginton C.D., Kelly B., Oto A., et al. Gadolinium-based contrast exposure, nephrogenic systemic fibrosis, and gadolinium detection in tissue. AJR Am J Roentgenol. 2008;190(4):1060-1068.
23. Browd S.R., Ragel B.T., Gottfried O.N., Kestle J.R.W. Failure of cerebrospinal fluid shunts: Part I: obstruction and mechanical failure. Pediatr Neurol. 2006;34(2):83-92.
24. Laine F.J., Shedden A.I., Dunn M.M., Ghatak N.R. Acquired intracranial herniations: MR imaging findings. AJR Am J Roentgenol. 1995;165:967-973.
25. Osborn A.G., Blaser S.I., Salzman K.L., et al. Intracerebral Hematoma. Diagnostic Imaging: Brain. Altona, Manitoba: Amirsys; 2004.
26. de Lucas E.M., Sanchez E., Gutierrez A., et al. CT protocol for acute stroke: tips and tricks for general radiologists. Radiographics. 2008;28(6):1673-1687.
27. Chappell E.T., Moure F.C., Good M.C. Comparison of computed tomographic angiography with digital subtraction angiography in the diagnosis of cerebral aneurysm: a meta-analysis. Neurosurgery. 2003;52(3):624-631.
28. Franklin B., Gasco J., Uribe T., et al. Diagnostic accuracy and inter-rater reliability of 64-multislice 3D-CTA compared to intra-arterial DSA for intracranial aneurysms. J Clin Neurosci. 2010;17(5):579-583.
29. Cenic A., Nabavi D.G., Craen R.A., et al. Dynamic CT measurement of cerebral blood flow: a validation study. AJNR Am J Neuroradiol. 1999;20:63-73.
30. Wintermark M., Thiran J.-P., Maeder P., et al. Simultaneous measurement of regional cerebral blood flow by perfusion CT and stable xenon CT: a validation study. AJNR Am J Neuroradiol. 2001;22:904-914.
31. Wintermark M., Chiolero R., van Melle G., et al. Relationship between brain perfusion computed tomography variables and cerebral perfusion pressure in severe head trauma patients. Crit Care Med. 2004;32(7):1579-1587.
32. Hoeffner E.G., Case I., Jain R., et al. Cerebral perfusion CT: technique and clinical applications. Radiology. 2004;251(3):632-644.
33. Wintermark M., Flanders A.E., Velthuis B., et al. Perfusion-CT assessment of infarct core and penumbra: receiver operating characteristic curve analysis in 130 patients suspected of acute hemispheric stroke. Stroke. 2006;37:979-985.
34. Matthias K., Kraus M., Theek C., et al. Quantitative assessment of the ischemic brain by means of perfusion-related parameters derived from perfusion CT. Stroke. 2001;32:431-437.
35. Hashemi R.H., Bradley W.G.Jr., Lisanti C.J. MRI: The Basics. Philadelphia: Lippincott Williams & Wilkins; 2004.
36. Haacke E.M., Xu Y., Cheng Y.-C.N., Reichenbach J. Susceptibility-weighted imaging (SWI). Magn Reson Med. 2004;52:612-618.
37. Nandigam R.N.K., Viswanathan A., Delgado P., et al. MR imaging of cerebral microbleeds: effect of susceptibility-weighted imaging, section thickness, and field strength. AJNR Am J Neuroradiol. 2009;30:338-343.
38. Tsui Y.-K., Tsai F.Y., Hasso A.N., et al. Susceptibility-weighted imaging for differential diagnosis of cerebral vascular pathology: a pictorial review. J Neurol Sci. 2009;287:7-16.
39. Schaefer P.W., Grant P.E., Gonzalez R.G. Diffusion-weighted MR imaging of the brain. Radiology. 2000;217:331-345.
40. Kranz P.G., Eastwood J.D. Does diffusion-weighted imaging represent the ischemic core? An evidence-based systemic review. AJNR Am J Neuroradiol. 2009;30:1206-1212.
41. Lai P.-H., Hsu S.-S., Ding S.-W., et al. Proton magnetic resonance spectroscopy and diffusion-weighted imaging in intracranial cystic mass lesions. Surg Neurol. 2007;68(S1):25-36.
42. Kidwell C.S., Wintermark M. Imaging of intracranial haemorrhage. Lancet Neurol. 2008;7:256-267.
43. Zaharchuk G. Theoretical basis of hemodynamic MR imaging techniques to measure cerebral blood volume, cerebral blood flow, and permeability. AJNR Am J Neuroradiol. 2007;28:1850-1858.
44. Shih L.C., Saver J.L., Alger J.R., et al. Perfusion-weighted magnetic resonance imaging thresholds identifying core, irreversibly infarcted tissue. Stroke. 2003;34:1425-1430.
45. Deibler A.R., Pollock J.M., Kraft R.A., et al. Arterial spin-labeling in routine clinical practice. Part 1: technique and artifacts. AJNR Am J Neuroradiol. 2008;29(7):1235-1241.
46. Chalela J.A., Alsop D.C., Gonzalez-Atavales J.B., et al. Magnetic resonance perfusion imaging in acute ischemic stroke using continuous arterial spin labeling. Stroke. 2000;31:680-687.
47. Deibler A.R., Pollock J.M., Kraft R.A., et al. Arterial spin-labeling in routine clinical practice. Part 3: hyperperfusion patterns. AJNR Am J Neuroradiol. 2008;29:1428-1435.
48. Deibler A.R., Pollock J.M., Kraft R.A., et al. Arterial spin-labeling in routine clinical practice. Part 2: hypoperfusion patterns. AJNR Am J Neuroradiol. 2008;29:1235-1241.
49. Sunaert S., Thomas B. An introduction to clinical functional magnetic resonance imaging of the brain. In: Rombouts S.A.R.B., Barkhof F., Scheltens P., editors. Clinical Applications of Functional MRI. New York: Oxford University Press, 2007.
50. Pierpaoli C., Jezzard P., Basser P.J., et al. Diffusion tensor MR imaging of the human brain. Radiology. 1996;201:637-648.
51. Wu J.-S., Mao Y., Zhou L.-F., et al. Clinical evaluation and follow-up outcome of diffusion tensor imaging-based functional neuronavigation: a prospective, controlled study in patients with gliomas involving pyramidal tracts. Neurosurgery. 2007;61(5):935-949.
52. Brandao L.A., Domingues R.C. MR Spectroscopy of the Brain. Philadelphia: Lippincott Williams & Wilkins; 2004.
53. Nelson S.J. Multivoxel magnetic resonance spectroscopy of brain tumors. Mol Cancer Ther. 2003;2:497-507.
54. Masdeu J.C., Arbizu J. Brain single photon emission computed tomography: technological aspects and clinical applications. Semin Neurol. 2008;28:423-434.
55. Grimstad I.A., Hirschberg H., Rootwelt K. 99mTc-hexamethylpropyleneamine oxime leukocyte scintigraphy and C-reactive protein levels in the differential diagnosis of brain abscesses. J Neurosurg. 1992;77:732-736.
56. Hammoud D.A., Hoffman J.M., Pomper M.G. Molecular neuroimaging: from conventional to emerging techniques. Radiology. 2007;245:21-42.
57. Cascino G.D., So E.L., Buchhalter J.R., Mullan B.P. The current place of single photon emission computed tomography in epilepsy evaluations. Neuroimaging Clin North Am. 2004;14:553-561.
58. La Fougere C., Rominger A., Forster S., et al. PET and SPECT in epilepsy: a critical review. Epilepsy Behav. 2009;15:50-55.
59. Brass L.M., Walovitch R.C., Joseph J.L., et al. The role of single photon emission computed tomography brain imaging with 99mTc-bicisate in the localization and definition of mechanism of ischemic stroke. J Cereb Blood Flow Metab. 1994;14(Suppl 1):S91-S98.
60. Masdeu J.C. Imaging of stroke with SPECT. In: Babikian V., Wechsler L., Higashida R.T., editors. Imaging Cerebrovascular Disease. Boston: Butterworth-Heinemann; 2003:131-144.
61. Kuroda S., Kamiyama H., Abe H., et al. Acetazolamide test in detecting reduced cerebral perfusion reserve and predicting long-term prognosis in patients with internal carotid artery occlusion. Neurosurgery. 1993;32:912-918. discussion 918–919
62. Kassell N.F., Sasaki T., Colohan A.R., Nazar G. Cerebral vasospasm following aneurysmal subarachnoid hemorrhage. Stroke. 1985;16:562-572.
63. Komotar R.J., Zacharia B.E., Valhora R., et al. Advances in vasospasm treatment and prevention. J Neurol Sci. 2007;261:134-142.
64. Rajendran J.G., Lewis D.H., Newell D.W., Winn H.R. Brain SPECT used to evaluate vasospasm after subarachnoid hemorrhage: correlation with angiography and transcranial Doppler. Clin Nucl Med. 2001;26:125-130.
65. Kincaid M.S., Souter M.J., Treggiari M.M., et al. Accuracy of transcranial Doppler ultrasonography and single-photon emission computed tomography in the diagnosis of angiographically demonstrated cerebral vasospasm. J Neurosurg. 2009;110:67-72.
66. Facco E., Zucchetta P., Munari M., et al. 99mTc-HMPAO SPECT in the diagnosis of brain death. Intens Care Med. 1998;24:911-917.
67. Mrhac L., Zakko S., Parikh Y. Brain death: the evaluation of semi-quantitative parameters and other signs in HMPAO scintigraphy. Nucl Med Commun. 1995;16:1016-1020.