[level-membership-for-pulmolory-and-respiratory-category]CHAPTER 2
Principles of drug action
After reading this chapter, the reader will be able to:
1. Define key terms that pertain to principles of drug action
2. Define the drug administration phase
3. Describe the various routes of administration available
4. Define the pharmacokinetic phase
5. Discuss the key factors in the pharmacokinetic phase (e.g., absorption, distribution, metabolism, and elimination)
6. Describe the first-pass effect
7. Differentiate between systemic and inhaled drugs in relation to the pharmacokinetic phase
9. Define the pharmacodynamic phase
10. Discuss the importance of structure-activity relationships
11. Discuss the role of drug receptors
Chemical or drug that binds to a receptor and creates an effect on the body.
Chemical or drug that binds to a receptor but does not create an effect on the body; it blocks the receptor site from accepting an agonist.
Amount of drug that reaches the systemic circulation.
Method by which a drug is made available to the body.
Use of the intestine.
Initial metabolism in the liver of a drug taken orally before the drug reaches the systemic circulation.
Allergic or immune-mediated reaction to a drug, which can be serious, requiring airway maintenance or ventilatory assistance.
Abnormal or unexpected reaction to a drug, other than an allergic reaction, as compared with the predicted effect.
Taking a substance, typically in the form of gases, fumes, vapors, mists, aerosols, or dusts, into the body by breathing in.
Limited to the area of treatment (e.g., inhaled drug to treat constricted airways).
Lung availability/total systemic availability ratio (L/T ratio)
Amount of drug that is made available to the lung out of the total available to the body.
Any way other than the intestine, most commonly an injection (e.g., intravenous, intramuscular, subcutaneous, intrathecal, or intraosseous).
Mechanisms of drug action by which a drug molecule causes its effect in the body.
Study of genetic factors and their influence on drug response.
Time course and disposition of a drug in the body, based on its absorption, distribution, metabolism, and elimination.
Cell component that combines with a drug to change or enhance the function of the cell.
Structure-activity relationship (SAR)
Relationship between a drug’s chemical structure and the outcome it has on the body.
Drug interaction that occurs from two or more drug effects that are greater than if the drugs were given alone.
Pertains to the whole body, whereas the target for the drug is not local, possibly causing side effects (e.g., capsule of acetaminophen for a headache).
Rapid decrease in response to a drug.
Difference between the minimal therapeutic and toxic concentrations of a drug; the smaller the difference, the greater chance the drug will be toxic.
Decreasing intensity of response to a drug over time.
Use of the skin or mucous membrane (e.g., lotion).
Use of the skin (e.g., patch).
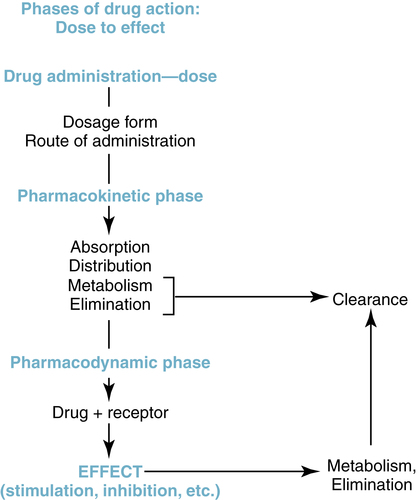
The entire course of action of a drug, from dose to effect, can be understood in three phases: drug administration phase, pharmacokinetic phase, and pharmacodynamic phase. This useful conceptual framework, based on the principles offered by Ariëns and Simonis,1 organizes the steps of a drug’s action from drug administration (method by which a drug dose is made available to the body) through effect and ultimate elimination from the body. This framework is illustrated in Figure 2-1 and provides an overview of the interrelationship of the three phases of drug action, each of which is discussed in this chapter.
Drug administration phase
Drug dosage forms
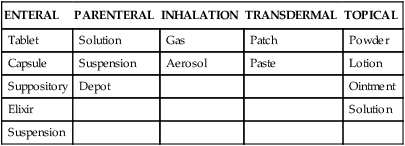
The drug administration phase entails the interrelated concepts of drug formulation (e.g., compounding a tablet for particular dissolution properties) and drug delivery (e.g., designing an inhaler to deliver a unit dose). Two key topics of this phase are the drug dosage form and the route of administration. The drug dosage form is the physical state of the drug in association with nondrug components. Tablets, capsules, and injectable solutions are common drug dosage forms. The route of administration is the portal of entry for the drug into the body, such as oral (enteral), injection, or inhalation. The form in which a drug is available must be compatible with the route of administration desired. The injectable route (e.g., intravenous route) requires a liquid solution of a drug, whereas the oral route can accommodate capsules, tablets, or liquid solutions. Some common drug formulations for each of the common routes of drug administration are listed in Table 2-1.
TABLE 2-1
Common Drug Formulations for Various Routes of Administration
| ENTERAL | PARENTERAL | INHALATION | TRANSDERMAL | TOPICAL |
| Tablet | Solution | Gas | Patch | Powder |
| Capsule | Suspension | Aerosol | Paste | Lotion |
| Suppository | Depot | Ointment | ||
| Elixir | Solution | |||
| Suspension |
Drug formulations and additives
A drug is the active ingredient in a dose formulation, but it is usually not the only ingredient in the total formulation. For example, in a capsule of an antibiotic, the capsule itself is a gelatinous material that allows the drug to be swallowed. The capsule material disintegrates in the stomach, and the active drug ingredient is released for absorption. The rate at which the active drug is liberated from a capsule or tablet can be controlled during the formulation process, by altering drug particle size or by using a specialized coating or formulation matrix. Aerosolized agents for inhalation and treatment of the respiratory tract also contain ingredients other than the active drug, such as preservatives, propellants for metered dose inhaler (MDI) formulations, dispersants (surfactants), and carrier agents with dry powder inhalers (DPIs). Table 2-2 presents the various formulations with different ingredients for the β-adrenergic bronchodilator albuterol. In the nebulizer solution, benzalkonium chloride is a preservative, and sulfuric acid adjusts the pH of the solution. In the CFC-MDI, chlorofluorocarbons are propellants and oleic acid is a dispersing agent. In the HFA MDI, a hydrofluoroalkane is used in place of chlorofluorocarbon.
TABLE 2-2
| DOSAGE FORM | ACTIVE DRUG | INGREDIENTS |
| Nebulizer solution | Albuterol sulfate | Benzalkonium chloride, sulfuric acid |
| MDI CFC | Albuterol-ipratropium | Trichloromono-fluoromethane, dichlorodifluoro-methane, oleic acid |
| Tablets | Albuterol sulfate | Lactose, butylparaben, sugar |
| MDI HFA | Albuterol | 1,1,1,2-Tetrafluoroethane, ethanol, oleic acid |
CFC, Chlorofluorocarbons; HFA, hydrofluoroalkane; MDI, metered dose inhaler.
Routes of administration
Enteral
The term enteral refers literally to the small intestine, but the enteral route of administration is more broadly applicable to administration of drugs intended for absorption anywhere along the gastrointestinal tract. The most common enteral route is by mouth (oral) because it is convenient, is painless, and offers flexibility in possible dosage forms of the drug, as seen in Table 2-1. The oral route requires the patient to be able to swallow; therefore, airway-protective reflexes should be intact. If the drug is not destroyed or inactivated in the stomach and can be absorbed into the bloodstream, distribution throughout the body and a systemic effect can be achieved. Other enteral routes of administration include suppositories inserted in the rectum, tablets placed under the tongue (sublingual), and drug solutions introduced though an indwelling gastric tube.
Parenteral (injectable)
• Intravenous (IV): Injected directly into the vein, allowing nearly instantaneous access to the systemic circulation. Drugs can be given as a bolus, in which case the entire dose is given rapidly, leading to a sharp increase in the plasma concentration, or a steady infusion can be used to avoid this precipitous increase.
• Intramuscular (IM): Injected deep into a skeletal muscle. Because the drug must be absorbed from the muscle into the systemic circulation, the drug effects occur more gradually than with intravenous injection, although typically more rapidly than by the oral route.
• Subcutaneous (SC): Injected into the subcutaneous tissue beneath the epidermis and the dermis.
• Intrathecal (IT): Injected into the arachnoid membrane of the spinal cord to diffuse throughout the spinal fluid.
Inhalation
Drugs can be given by inhalation for either a systemic effect or a local effect in the lung. Two of the most common drug formulations given by this route are gases, which usually are given by inhalation for anesthesia (a systemic effect), and aerosolized agents intended to target the lung or respiratory tract in the treatment of respiratory disease (local effect). The technology and science of aerosol drug delivery to the respiratory tract continue to develop and are described in detail in Chapter 3. Box 2-1 provides a summary of devices commonly used for inhaled aerosol drug delivery. The general rationale for aerosolized drug delivery to the airways for treating respiratory disease is the local delivery of the drug to the target organ, with reduced or minimal body exposure to the drug and, it is hoped, reduced prevalence or severity of possible side effects.
Pharmacokinetic phase
Absorption
After traversing these layers, a drug can reach the smooth muscle or glands of the airway. The mechanisms by which drugs move across membrane barriers include aqueous diffusion, lipid diffusion, active or facilitated diffusion, and pinocytosis. Generally, a drug must be sufficiently water-soluble to reach a lipid (cell) membrane and sufficiently lipid-soluble to diffuse across the cell barrier. Figure 2-2 illustrates these basic mechanisms, which are briefly discussed.
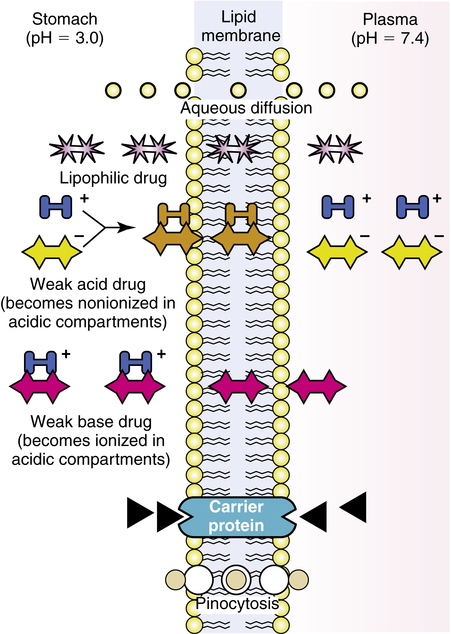
Lipid diffusion
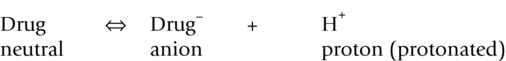
Weak acid: Because an acid contributes protons (H+ ions), the protonated form is neutral, or nonionized.
Weak base: Because a base accepts protons (H+ ions), the unprotonated form is neutral, or nonionized.
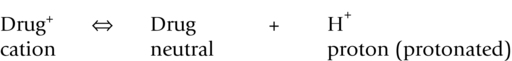
• The protonated weak acid is neutralized by the addition of H+ ions in an acidic environment, is nonionized, and is lipid-soluble.
• The protonated weak base gains a charge by adding H+ ions in an acidic environment, is ionized, and is not lipid-soluble.
Figure 2-2 conceptually illustrates the principle of lipid diffusion and absorption for weak acids and bases.
Distribution
The plasma concentration of a drug is partially determined by the rate and extent of absorption versus the rate of elimination for a given dose amount. The volume in which the drug is distributed also determines the concentration achieved in plasma. Those compartments and their approximate volumes in a 70-kg adult are given in Table 2-3.
TABLE 2-3
Volumes (Approximate) of Major Body Compartments
| COMPARTMENT | VOLUME (L) |
| Vascular (blood) | 5 |
| Interstitial fluid | 10 |
| Intracellular fluid | 20 |
| Fat (adipose tissue) | 14-25 |
Volume of distribution
< ?xml:namespace prefix = "mml" />
EXAMPLE
To achieve a concentration of theophylline of 15 mg/L with a VD of 35 L, we calculate a dose of:
The following points should be noted:
• The preceding calculation assumes that the dose is completely available to the body. This may be true if a dose is given intravenously, but there may be less than 100% bioavailability if a dose is given orally.
• This is a loading dose, and subsequent doses to maintain a level of concentration depend on the rate of absorption versus the rates of metabolism and excretion (discussed in the next sections).
• VD may change as a function of age or disease state.
• The concept of VD is not directly helpful in topical drug administration and delivery of aerosolized drugs intended to act directly on the airway surface. VD for topical deposition in the airway is not measured, and the drug is deposited locally in the respiratory tract, with some drugs absorbed from the airway into the blood.
Metabolism
The processes by which drug molecules are metabolized, or biotransformed, constitute a complex area of biochemistry that is beyond the scope of this text. Common pathways for the biotransformation of drugs are listed in Box 2-2. Generally, phase 1 biochemical reactions convert the active drug to a more polar (water-soluble) form, which can be excreted by the kidney. Drugs that are transformed in a phase 1 reaction may be transformed further in a phase 2 reaction, which combines (conjugates) a substance (e.g., glucuronic acid) with the metabolite to form a highly polar conjugate. For some drugs, biotransformation is accomplished by just phase 1 or phase 2 metabolism without prior transformation by the other phase. Metabolites are often less biologically active than the parent drug. Nevertheless, some drugs are inactive until metabolized (e.g., enalapril) or produce metabolites that are more toxic than their progenitors (e.g., breakdown products of acetaminophen).
Enzyme induction and inhibition
Chronic administration or abuse of drugs that are metabolized by the enzyme systems in the liver can induce (increase) or inhibit the levels of the enzymes (enzyme induction and inhibition). Examples of drugs or agents that can induce or inhibit CYP enzymes are listed in Table 2-4.
TABLE 2-4
Drugs Causing Induction or Inhibition of Cytochrome P450 (CYP) Enzymes
| CYTOCHROME P450 ISOENZYME | INDUCERS | INHIBITORS |
| CYP1A2 | Phenytoin | Ciprofloxacin |
| Rifampin | Diltiazem | |
| CYP2D6 | Ranitidine | |
| Fluoxetine | ||
| CYP3A4 | Carbamazepine | Diltiazem |
| Corticosteroids | Fluoxetine | |
| Rifampin | Erythromycin |
First-pass effect
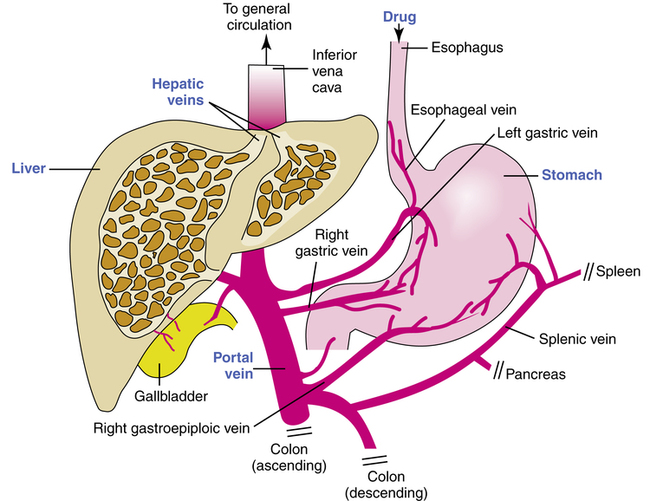
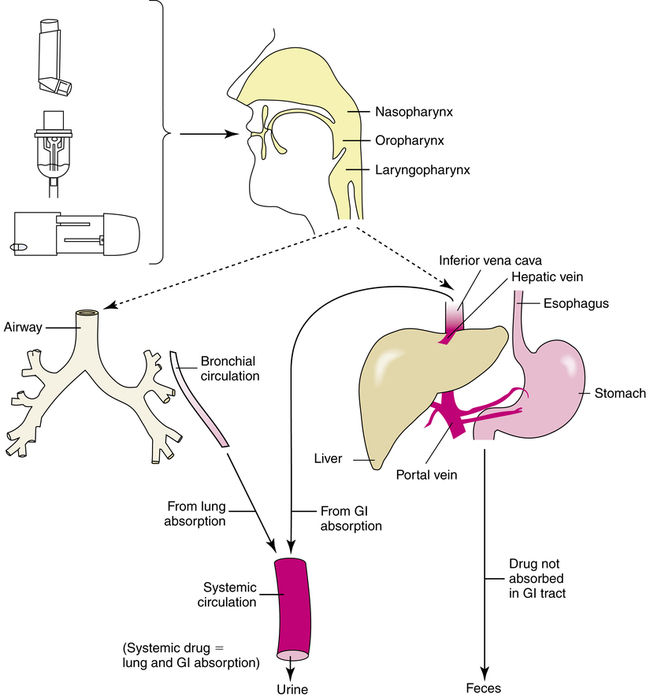
Another clinically important effect of the liver on drug metabolism is referred to as the first-pass effect of elimination. When a drug is taken orally and absorbed into the blood from the stomach or intestine, the portal vein drains this blood directly into the liver (Figure 2-3). The blood from the liver is drained by the right and left hepatic veins directly into the inferior vena cava and on into the general circulation.
Elimination

Plasma half-life
The plasma half-life (T½) (the time required for the plasma concentration of a drug to decrease by one-half) is a measure of how quickly a drug is eliminated from the body. More pertinent to dosing schedules, however, T½ indicates how quickly a drug can accumulate and reach steady-state plasma levels. Drugs with a short T½ (e.g., amoxicillin) reach steady-state levels quickly and must be given more frequently to maintain plasma levels, whereas the opposite is true of drugs with a long T½, such as digoxin. Table 2-5 lists selected drugs in common use with their plasma half-lives.
TABLE 2-5
Plasma Half-lives of Common Drugs
| DRUG | HALF-LIFE (hr) |
| Acetaminophen | 2 |
| Amoxicillin | 1.7 |
| Azithromycin | 40 |
| Digoxin | 39 |
| Gabapentin | 6.5 |
| Morphine | 1.9 |
| Paroxetine | 17 |
| Terbutaline | 14 |
Time-plasma curves
The concentration of a drug in the plasma over time can be graphed as a time-plasma curve (Figure 2-4). The shape of this curve describes the interplay of the kinetic factors of absorption, distribution, metabolism, and elimination. These curves can indicate whether the dose given is sufficient to reach and maintain a critical threshold of concentration needed for the desired therapeutic effect. Such a curve can also be plotted for concentrations of an aerosol drug in respiratory tract secretions. However, the duration of the clinical effect rather than the concentration of the drug is often represented in studies of aerosol drugs, particularly bronchodilators. The clinical effect is more helpful than a blood level in describing the pharmacokinetics of inhaled aerosols, which rely on topical delivery with a local effect in the airway.
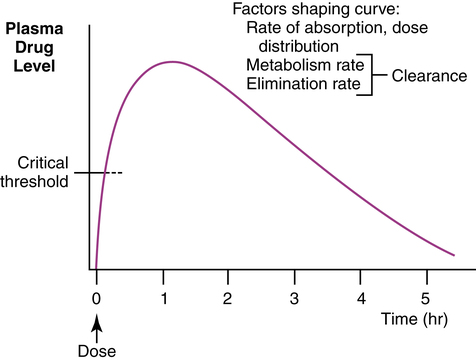
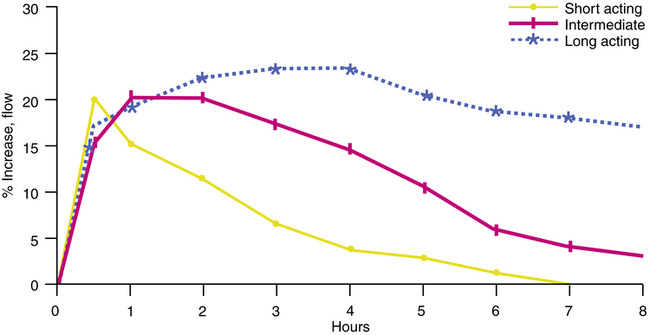
Figure 2-5 illustrates hypothetical curves for the peak effect and duration of effect of three bronchodilator drugs on expiratory flow rates. The short-acting curve could represent a drug such as isoetharine, a catecholamine bronchodilator. On the basis of its time curve, this agent is too short-acting for maintenance therapy but could be useful for a before-and-after pulmonary function evaluation, where rapid peak effect and short duration would be desirable. The intermediate curve could represent an agent such as albuterol, with a peak effect of 30 to 60 minutes by inhalation and a duration of action of approximately 4 to 6 hours. These kinetics are useful for as-required bronchodilation or for maintenance therapy if a subject uses the drug four times daily. The kinetics indicate that bronchodilation with albuterol, an intermediate-acting drug, would not be maintained during an entire night. Finally, a long-acting agent such as the bronchodilator salmeterol could provide a 12-hour duration of effect, although time to peak effect is slower (less than 2 hours). These kinetics are useful for convenient twice-daily dosing and around-the-clock bronchodilation. This example illustrates how pharmacokinetics of an inhaled aerosol can help determine the choice of a particular drug for a given clinical application and the dosing schedule needed for the therapeutic effect. Other factors in the choice of a drug, whether inhaled aerosol or oral/injectable, include the side-effect profile, the individual’s reaction to the drug, allergies, and compliance factors (patient adherence to dosing instructions) such as delivery formulations and dose timing.
Pharmacokinetics of inhaled aerosol drugs
Local versus systemic effect
Inhaled aerosols are deposited on the surface of the upper or lower airway and are a form of topically administered drug. As topically deposited agents, inhaled aerosols can be intended either for a local effect in the upper or lower airway or for a systemic effect as the drug is absorbed and distributed in the blood. A local effect is exemplified by a nasally inhaled vasoconstricting agent (decongestant), such as oxymetazoline (Afrin), or by an inhaled bronchodilator aerosol, such as albuterol (Proventil-HFA, Ventolin-HFA, Proair HFA), to dilate the lower airways. A systemic effect might be exemplified by the administration of inhaled zanamivir (Relenza) to treat influenza, inhaled morphine for pain control, or inhaled insulin aerosol for systemic control of diabetes.2
Distribution of inhaled aerosols
Because a portion of an inhaled aerosol is swallowed, the inhalation route leads to gastrointestinal absorption as well as lung absorption of the drug (Figure 2-6). After inhalation of an aerosol by a spontaneously breathing patient with no artificial airway, a proportion of the aerosol impacts in the oropharynx and is swallowed, and a proportion is inhaled into the airway. The traditional percentages given for stomach and airway proportions, based on Newman’s classic measures3 in 1981 with an MDI, are approximately 90% (stomach) and 10% (airway). Similar percentages have been found with other aerosol delivery devices.
Approximately 50% to 60% of the drug impacts in the mouth or oropharynx and contributes to the 90% reaching the stomach. These amounts are used in discussing the pathways of metabolism for an inhaled drug. Although the remaining 10% is traditionally accepted as the proportion of inhaled drug reaching the lower respiratory tract with current delivery devices, the exact percentage can vary with different delivery devices or techniques of patient use from 10% to 30%. Lung deposition with an inhaled corticosteroid, budesonide (Pulmicort), has been reported as 15% with a pressurized MDI (pMDI) and 32% with a DPI (Pulmicort Turbuhaler; AstraZeneca, Wilmington, Delaware).4 Use of reservoir devices with MDIs or delivery through endotracheal tubes can significantly change oropharyngeal impaction or airway delivery (see Chapter 3).
Oral portion (stomach).
The swallowed aerosol drug is subject to gastrointestinal absorption, distribution, and metabolism as with an orally administered drug. The aerosol drug can be absorbed from the stomach and metabolized in the liver (see Figure 2-6), producing a first-pass effect. The drug may also be inactivated in the intestinal wall as it is absorbed into the portal circulation. The site of absorption in the gastrointestinal tract is determined by the principles governing diffusion of drugs through lipid membranes. Generally, if the first-pass metabolism is high, systemic levels are due only to lung absorption; if the first-pass metabolism is low and drug is swallowed, there is a higher systemic level from gastrointestinal tract absorption, which may increase side effects in the body. The first-pass metabolism of three common inhaled aerosol drugs is as follows:
Lung availability/total systemic availability ratio
The clinical or therapeutic effect of a bronchoactive aerosol comes from the inhaled drug deposited in the airways. The systemic or extrapulmonary side effects come from the total amount of drug absorbed into the system. The total systemic drug level is due to airway absorption plus the amount absorbed from the gastrointestinal tract. The L/T ratio can quantify and compare the efficiency of drug delivery systems targeting the respiratory tract. Any action that reduces the swallowed portion of the inhaled drug, such as a reservoir device (spacer, holding chamber), or high first-pass metabolism, can increase the L/T ratio. Factors that can increase the L/T ratio are summarized in Box 2-3. A perfectly efficient inhalation device would deliver all of the drug to the lung and none to the oropharynx or gastrointestinal tract, giving a ratio of 1 (lung availability = total systemic availability; all systemic drug comes only from the lung absorption).
This concept was proposed in 1991 by Borgström5 and elaborated by Thorsson.6 An example, based on the data of Thorsson for albuterol inhalation using two different delivery devices, is given in Figure 2-7. Using an MDI, approximately 30% of the inhaled drug reaches the lung, with 70% going to the stomach. With complete absorption from the stomach, half of this 70% is broken down in the liver, so that 35% reaches the systemic circulation. The total amount of the original 100% dose reaching the circulation is 65% (lung, 30%; stomach and liver, 35%). Because 30% of the 65% comes from the lung, this gives an L/T ratio of 30/65 = 0.46.
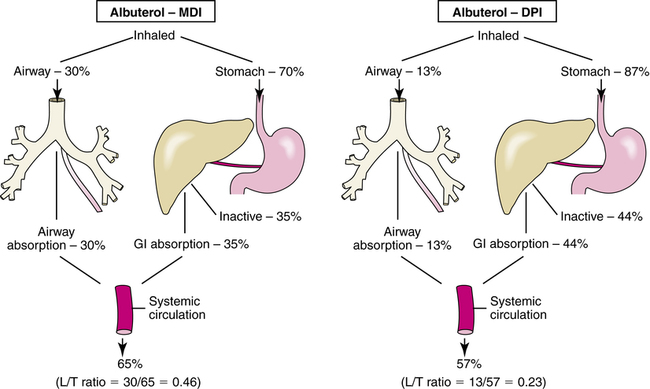
The data for the DPI, using a Rotahaler (GlaxoSmithKline, Research Triangle Park, North Carolina), which is no longer available, gives an L/T ratio of 0.23 (lung, 13%; stomach and liver, 44%). On the basis of these ratios, inhalation of albuterol via an MDI gives more efficient lung delivery with less systemic availability compared with inhalation via a DPI such as the Rotahaler. With the MDI, 46% of the systemic exposure is due to the lung, whereas with the DPI, 23% is due to the lung. A high L/T ratio is desired; Table 2-6 gives examples of various L/T ratios, along with lung deposition for several drugs and delivery devices.
TABLE 2-6
Lung Availability/Total Systemic Availability (L/T) Ratios for Several Inhaled Drugs with Various Aerosol Delivery Devices*
| DRUG | DEVICE | LUNG DEPOSITION (%) | L/T RATIO | SUBJECTS |
| Albuterol | pMDI | 18.6 | 0.36 | Patients—good coordinators |
| 7.2 | 0.17 | Patients—poor coordinators | ||
| BAI (pMDI) | 20.8 | 0.41 | Patients—poor coordinators | |
| Turbuhaler | 23.2 | 0.45 | Healthy volunteers | |
| Budesonide | pMDI (CFC) | 15.0 | 0.66 | Healthy subjects |
| Turbuhaler | 32.0 | 0.87 | Healthy subjects | |
| MDI (HFA)† | 59.0 | 0.92 | Patients |
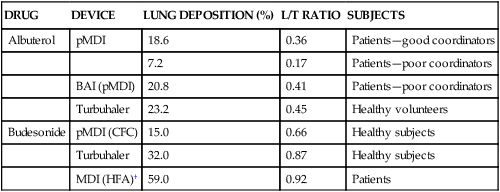
BAI, Breath-actuated inhaler; CFC, chlorofluorocarbon; HFA, hydrofluoroalkane; pMDI, pressurized metered dose inhaler.
*All drug amounts are expressed as percentages of metered or nominal dose.
†Data from Harrison LI: Local versus total systemic bioavailability of beclomethasone dipropionate CFC and HFA metered dose inhaler formulations, J Aerosol Med 15:401, 2002 [erratum in J Aerosal Med 2003; 16:97].
Data from Borgström L: Local versus total systemic bioavailability as a means to compare different inhaled formulations of the same substance, J Aerosol Med 11:55, 1998.
The L/T ratio is determined by the rate of first-pass metabolism and the efficiency of the inhalation device in placing drug in the airway. A high L/T ratio can be achieved even with poor lung delivery and efficient stomach absorption if there is a high first-pass effect on the swallowed drug. Comparisons of L/T ratios must be between the same drugs with different delivery devices. Two drugs with different first-pass metabolism rates can have different L/T ratios even if the airway deposition or delivery device is the same. A good example is provided in Table 2-6 by comparing albuterol and terbutaline, both administered with a Turbuhaler(DPI). Albuterol and terbutaline have first-pass metabolism rates of 50% and 90%, respectively. With approximately the same lung delivery of 22% to 23% for both drug-device systems, the L/T ratio is 0.45 for albuterol but 0.79 for terbutaline. The improved L/T ratio of terbutaline compared with albuterol is not caused by a difference in device efficiency but by the higher rate of metabolism of terbutaline that reduces systemic blood levels from gastrointestinal absorption. The L/T ratio also suggests that aerosol delivery devices should be evaluated together with the drug to be used. “Each combination of active drug and device is a unique pharmaceutical formulation, as both the drug itself and the device can influence the overall properties of the formulation.”5 The L/T ratio does not determine whether systemic toxicity or side effects will occur. First, systemic effects depend on the amount of active drug absorbed into the system, whether from the lung or gastrointestinal tract. An inhaled corticosteroid, such as flunisolide, is rapidly metabolized in a first-pass effect. As a result, the swallowed portion gives minimal systemic levels. Good absorption of the aerosol drug from the lungs in sufficiently high doses could cause systemic effects, however. Second, delivery to the oropharynx and gastrointestinal tract by a less efficient aerosol delivery device or method may be irrelevant if the drug is largely inactivated when taken orally and causes no local oropharyngeal effects. Catecholamine bronchodilators would be examples of such a drug. The L/T ratio indicates clearly how close an aerosol drug delivery system comes to the ideal of having all of the systemic drug exposure come from only the lung dose.
Pharmacodynamic phase
Structure-activity relationships
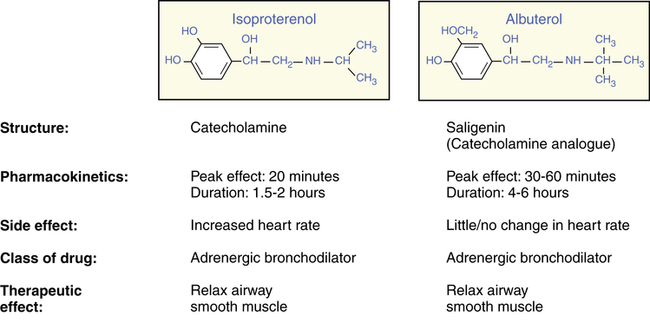
The structures of isoproterenol and albuterol are illustrated in Figure 2-8, with a summary of two critical differences in their pharmacokinetic profile and one critical difference in their side effects (heart rate increase). Although the two structures are very similar, and both are in the same family of β-adrenergic bronchodilators (see Chapter 6 for a discussion of this class of drugs), they are different. Isoproterenol is a catecholamine, which is metabolized rapidly as it is absorbed in the airway by the enzyme catechol O-methyltransferase (COMT), giving it a short duration of action. Albuterol, a saligenin, is not a substrate for the enzyme COMT but is instead metabolized through sulfate conjugation, a slower process. This difference is caused by the substitution of HOCH2 for the OH group at the carbon-3 position. In addition, the structures of the two side chains are sufficiently different to change their receptor selectivity. Isoproterenol matches to receptors found in the airway (β2 receptors) and the heart (β1 receptors), whereas albuterol is more selective for receptors in the airway only. In recommended doses, albuterol has little or no effect on heart rate; however, isoproterenol usually causes an increase in heart rate.
Nature and type of drug receptors
Drug receptors
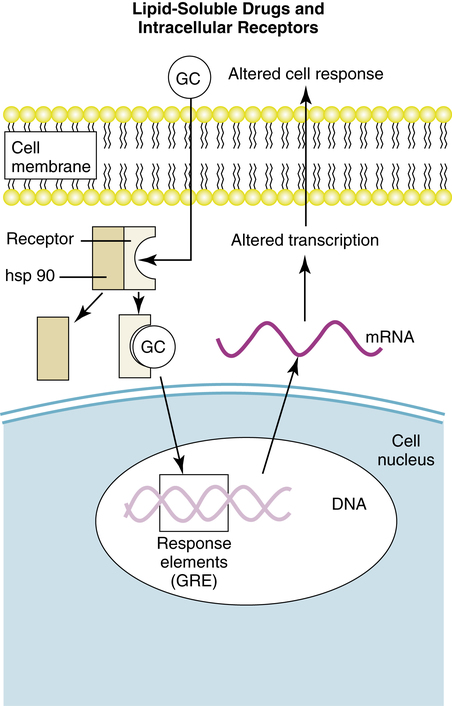
1. Lipid-soluble drugs cross the cell membrane and act on intracellular receptors, to initiate the drug response. Examples: Corticosteroids, vitamin D, thyroid hormone.
2. The drug attaches to the extracellular portion of a protein receptor, which projects into the cell cytoplasm (a “transmembrane protein”) and activates an enzyme system, such as tyrosine kinase, in the intracellular portion to initiate an effect. Examples: Insulin, platelet-derived growth factor (PDGF).
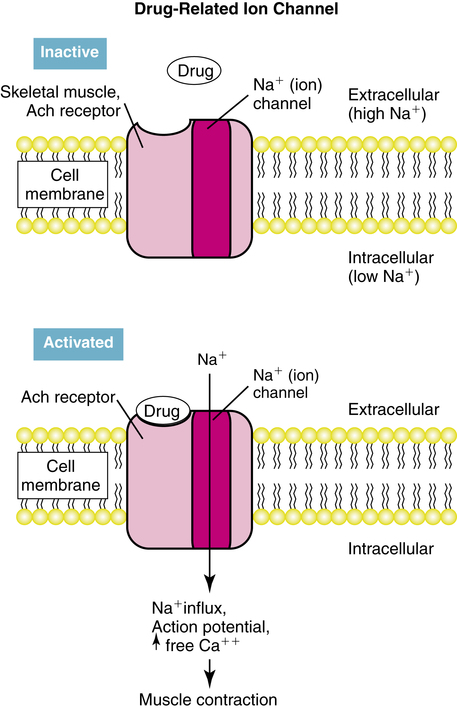
3. The drug attaches to a surface receptor, which regulates the opening of an ion channel. Examples: Acetylcholine receptors on skeletal muscle, γ-aminobutyric acid (GABA).
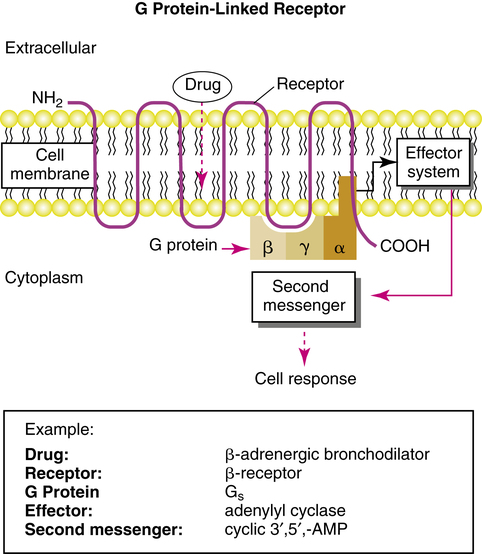
4. The drug attaches to a transmembrane receptor that is coupled to an intracellular enzyme by a G protein (guanine nucleotide-regulating protein). Examples: β-adrenergic agents, acetylcholine at parasympathetic nerve endings.
Lipid-soluble drugs and intracellular receptor activation
Intracellular receptor activation by lipid-soluble drugs is the basis on which corticosteroids, an important class of drugs in respiratory care, cause a cell response. Examples of corticosteroid drugs are inhaled beclomethasone and flunisolide and oral prednisone. In this drug-receptor mechanism, the drug is sufficiently lipid-soluble to cross the lipid bilayer of the cell membrane, diffuse into the cytoplasm, and attach to an intracellular polypeptide receptor. The drug-receptor complex translocates to the cell nucleus and binds to specific DNA sequences termed hormone response elements, which can either stimulate or repress the transcription of genes in the nucleus. An example of such drug-receptor signaling is illustrated in Figure 2-9 for glucocorticoid drugs, such as inhaled flunisolide or oral prednisone. The glucocorticoid diffuses across the cell membrane and attaches to a receptor in the cytoplasm. Attachment of the drug to the receptor causes displacement of certain proteins, termed heat shock proteins, and a change in the receptor configuration to an active state. The newly coupled drug-receptor complex moves or translocates to the nucleus of the cell, where it pairs with other drug-receptor complexes, which then bind to a glucocorticoid response element (GRE) of the cell’s DNA. This binding initiates or represses transcription of target genes and cell response (see Chapter 11 for a discussion of the mechanism and effects of glucocorticoids).
Drug-regulated ion channels
Another process of drug signal transduction regulates the flow of ions such as sodium or potassium through cell membrane channels. This can be seen in Figure 2-10. The drug binds to a receptor on the cell membrane surface. The receptor has a portion above or on the surface of the cell membrane and extends through the membrane into the cytoplasm of the cell. When activated by the drug (or by an endogenous ligand), the receptor opens an ion channel to allow increased transmembrane conductance of an ion. An example of such a receptor is that for acetylcholine, a neurotransmitter, on skeletal muscle. This acetylcholine receptor is termed a nicotinic receptor because it responds to the substance nicotine as well as acetylcholine. Attachment of acetylcholine or nicotine opens an ion channel and allows the high sodium (Na+) concentration in extracellular fluid to flow into the lower concentration of the cell. This produces a reversal of voltage, or depolarization, and a corresponding muscle twitch. Acetylcholine is the neurotransmitter for voluntary muscle contraction and movement, and stimulation by nicotine can increase skeletal muscle tremor.
Receptors linked to g proteins
G protein–linked receptors mediate bronchodilation and bronchoconstriction in the airways, in response to endogenous stimulation by neurotransmitters epinephrine and acetylcholine. These same airway responses can be elicited by adrenergic bronchodilator drugs (discussed in Chapter 6) or blocked by acetylcholine-blocking (anticholinergic) agents such as ipratropium bromide (discussed in Chapter 7). G proteins and G protein–linked receptors also mediate the effects of other chemicals, including the effects of histamine and glucagon, and the phototransduction of light in retinal rods and cones. Drug receptor signaling with G protein–linked receptors involves three main components: drug receptor, G protein, and effector system. When a drug attaches to a G protein–linked receptor, these three components interact to cause a cellular response to the drug. The effector system triggers the cell response ultimately by activating or inhibiting a second messenger within the cell. Figure 2-11 shows the main elements of a G protein–linked receptor. Each of the major elements in this signaling mechanism complex is described briefly, along with the dynamics of their interaction.
Receptors that couple with G proteins have been well characterized and show a similar structure, in which a polypeptide chain crosses the cell membrane seven times, giving a serpentine appearance to the receptor. The polypeptide chain has an amino (NH2, or N)-terminal site outside the cell membrane and a carboxyl (COOH, or C) terminus inside the cell. Although the seven transmembrane segments of the receptor are illustrated in Figure 2-12 as side by side, the receptor appears to form a cylindrical structure if viewed perpendicular to the surface of the cell membrane, with the transmembrane loops forming the sides of the cylinder. The drug usually couples to the receptor at a site surrounded by the transmembrane regions of the receptor protein, that is, within the interior of the cylinder. The receptor activates a G protein on the cytoplasmic (inner) surface of the cell membrane. The site of the interaction of the G protein with the receptor polypeptide is thought to be at the third cytoplasmic loop of the receptor chain.
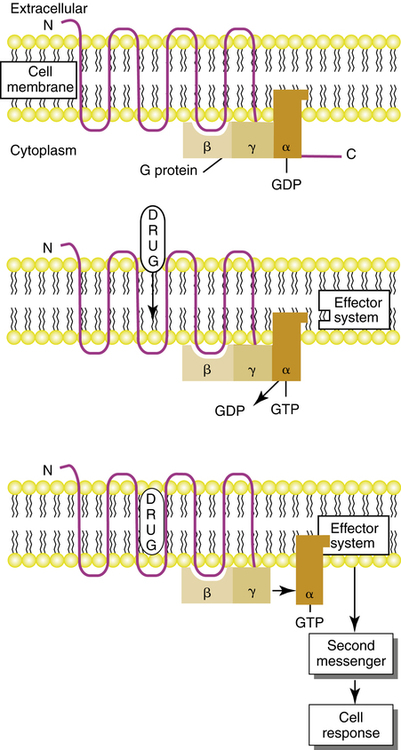
The dynamics of cell signaling by G protein–linked receptors are illustrated schematically in Figure 2-12. When there is no drug attached to the receptor site, the α subunit of the G protein is bound to guanosine diphosphate (GDP), and the G protein is in an inactive state. When a drug attaches to the receptor, there is a change in the receptor conformation that causes the release of GDP and the binding of guanosine triphosphate (GTP) to the α subunit. This is the active state for the G protein. The GTP-bound α subunit dissociates, or unlinks, from the β-γ portion and couples with the effector system to stimulate or inhibit a second messenger within the cell. The GTP bound to the α subunit is hydrolyzed by a GTPase enzyme, dissociates from the effector, and reassociates with the β-γ dimer. The G protein–linked receptor is then ready for reactivation.
Details on specific G proteins, their effector systems, and their second messengers are presented for neurotransmitters such as epinephrine and acetylcholine in the nervous system (see Chapter 5) and for the classes of drugs that link to such receptors, such as adrenergic bronchodilators (see Chapter 6) and anticholinergic bronchodilators (see Chapter 7).
Dose-response relationships
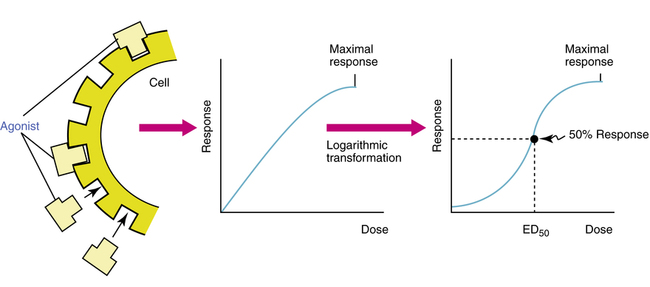
The response to a drug is proportional to the drug concentration. As drug concentration increases, the number of receptors occupied increases, and the drug effect also increases up to a maximal point; this is graphed as a dose-response, or concentration-effect, curve (Figure 2-13). Increasing amounts of drug increase the response in a fairly direct fashion; however, the rate of response usually diminishes as the dose increases, until a plateau of maximal effect is reached. Such a convex, or hyperbolic, curve is normally transformed mathematically by using the logarithm of the dose so that a sigmoid curve is obtained. The linear mid-portion of a sigmoid curve allows easier comparison of the dose-response curve for different drugs. In particular, the dose at which 50% of the response to the drug occurs is indicated in Figure 2-13 and is referred to as the ED50, the dose of drug that produces 50% of the maximal effect. This value may also be denoted as the EC50, for effective concentration giving 50% of maximal response.
Potency versus maximal effect
Dose-response curves are the basis for defining and illustrating several concepts used to characterize and compare drugs. Two concepts that allow comparison of drugs are potency and maximal effect, both illustrated in Figure 2-14.
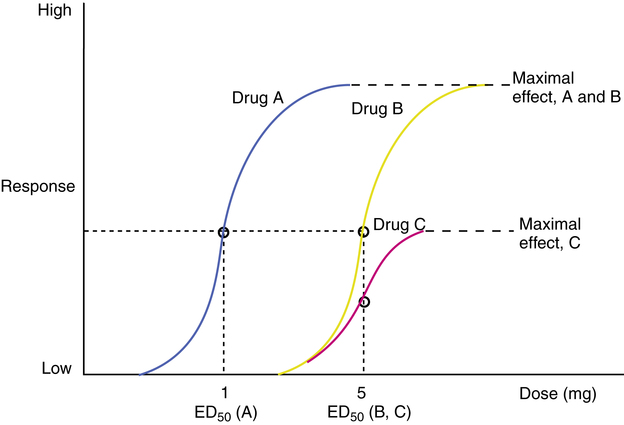
Potency: Refers to the concentration (EC50) or dose (ED50) of a drug producing 50% of the maximal response of the drug. The potency of two drugs, A and B, can be compared on the basis of the ED50 values of the two drugs: relative potency, A and B = ED50 (B)/ED50 (A).
Maximal effect: The greatest response that can be produced by a drug, a dose above which no further response can be elicited.
The lower the ED50 for a given drug, the more potent the drug is, as seen in Figure 2-14. Curves for drugs A and B show different potencies. If the ED50 for drug B is 5 mg and for drug A is 1 mg, then drug A is five times more potent than drug B:

Drug B requires five times the amount of drug A to produce 50% of its maximal effect. Potency is not the same as maximal effect, also illustrated in Figure 2-14. Potency is relatively defined using the ED50 values of two drugs, whereas maximal effect is absolutely defined as a physiologic or clinical response. The curves indicate that drugs B and C have the same potency; that is, the same dose produces 50% of the maximal response. However, drug B has a greater maximal effect than drug C. Because the ED50 is the dose causing a response that is half the maximal response of the same drug, two drugs can have different maximal responses but the same ED50 (and the same potency), as seen in Figure 2-14.
Therapeutic index
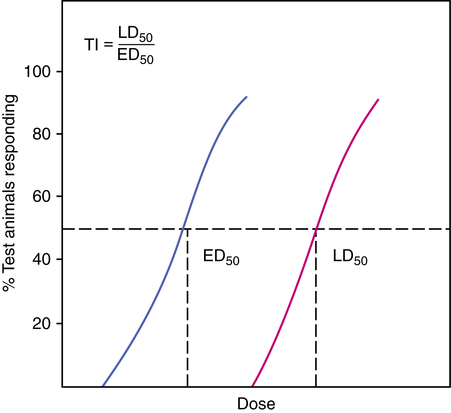
The therapeutic index (TI) can be defined as the ratio of the LD50 to the ED50 for a given drug, with ED50 and LD50 indicating half of the test subjects rather than a 50% clinical response. The TI is also based on the dose-response curve of a drug. Instead of a graded clinical or physiologic response such as an increase in heart rate, however, we substitute an all-or-nothing response of improvement for each subject, or toxicity/death for each subject. In this case, the ED50 represents the dose of the drug at which half of the test subjects improve. Similarly, the LD50 is the lethal dose for 50% of the test population. Doses are established for a test population of animals (as illustrated in Figure 2-15).
Agonists and antagonists
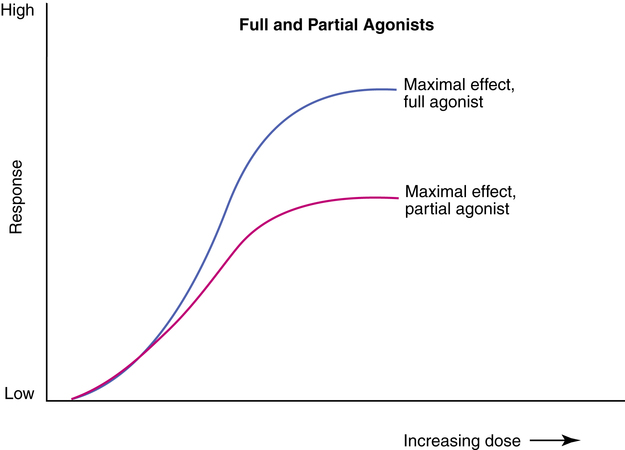
An agonist is a drug or chemical that binds to a corresponding receptor (has affinity) and initiates a cellular effect or response (has efficacy). An antagonist is a drug or chemical that is able to bind to a receptor (has affinity) but causes no response (zero efficacy). Because the antagonist drug is occupying the receptor site, it can prevent other drugs or an endogenous chemical from reaching and activating the receptor site. By doing so, an antagonist inhibits or blocks the agonist at the receptor. Agonists are divided further into full and partial agonists. A full agonist is a drug that gives a higher maximal response than a partial agonist. The dose-response curves for a partial agonist and a full agonist are represented in Figure 2-16. Both have receptor affinity, but a partial agonist has less efficacy than a full agonist.
Drug interactions
• Chemical antagonism: Direct chemical interaction between drug and biologic mediator, which inactivates the drug. An example is chelation of toxic metals by a chelating agent.
• Functional antagonism: Can occur when two drugs each produce an effect, and the two effects cancel each other. For example, methacholine can stimulate parasympathetic (muscarinic) receptors in the airways, causing bronchoconstriction; epinephrine can stimulate β2 receptors in the airways, causing bronchodilation.
• Competitive antagonism: Occurs when a drug has affinity for a receptor but no efficacy and at the same time blocks the active agonist from binding to and stimulating the receptor. For example, fexofenadine is a competitive antagonist to histamine on specific receptors (H1) on bronchial smooth muscle and the nasopharynx and is used to treat allergies to pollens.
The following terms are used to describe positive interactions between two drugs:
• Synergism: Occurs when two drugs act on a target organ by different mechanisms of action, and the effect of the drug pair is greater than the sum of the separate effects of the drugs.
• Additivity: Occurs when two drugs act on the same receptors, and the combined effect is the simple linear sum of the effects of the two drugs, up to a maximal effect.
• Potentiation: A special case of synergism in which one drug has no effect but can increase the activity of the other drug.
Terms for drug responsiveness
• Idiosyncratic effect: Effect that is the opposite of, or unusual, or an absence of effect, compared with the predicted usual effect in an individual.
• Hypersensitivity: Allergic or immune-mediated reaction to a drug, which can be serious, requiring airway maintenance or ventilatory assistance.
• Tolerance: Decreasing intensity of response to a drug over time.
• Tachyphylaxis: Rapid decrease in responsiveness to a drug.
Pharmacogenetics
Several examples can be given from drugs commonly seen in respiratory and critical care:
• Isoniazid: Antituberculosis drug that varies in its rate of metabolism and inactivation among individuals, with rapid and slow inactivators seen. The proportion of rapid versus slow inactivators is about 50/50 among white and black individuals, but Inuit and some Asian people tend to be rapid inactivators.
• Succinylcholine: Neuromuscular paralyzing agent used during surgery. Succinylcholine is normally metabolized by a butyrylcholinesterase enzyme (pseudocholinesterase). Approximately 1 in 3000 individuals has a genetically determined variant of this enzyme. As a result, a patient may take several hours to recover from the drug and begin to breathe spontaneously, rather than the several minutes usually seen. Mechanical ventilatory support would be required until spontaneous breathing is adequate.
• Isoflurane: Inhalation anesthetic that (similar to several other, related anesthetics) can cause malignant hyperthermia in genetically susceptible individuals. Patients with an atypical variant of a calcium release channel can die as a result of this serious complication of general anesthesia, which involves a rapid increase in body temperature and increased oxygen consumption.
 SELF-ASSESSMENT QUESTIONS
1. If a drug is in liquid solution, what routes of administration are available for its delivery, considering only its dosage form?
2. Although generic drug equivalents all have the same amount of active drug, do formulations of the same drug from different manufacturers all have the same ingredients?
3. If 200 mg of a drug results in a plasma concentration of 10 mg/L, what is the calculated volume of distribution (VD)?
4. If the VD of a drug such as phenobarbital is 38 L/70 kg, and an effective concentration is 10 mg/L, what loading dose would be needed for an average adult (assuming total bioavailability)?
5. If an inhaled aerosol has zero gastrointestinal absorption of active drug and only lung absorption, what is the L/T ratio?
6. True or False: A patient uses a reservoir device with an inhaled aerosol, and there is no swallowed portion of the drug; therefore, there are no systemic side effects.
7. Which receptor system signal mechanism is responsible for the effects caused by β-receptor activation, such as those seen with adrenergic bronchodilators (e.g., albuterol)?
 CLINICAL SCENARIO
[/level-membership-for-pulmolory-and-respiratory-category][not-level-membership-for-pulmolory-and-respiratory-category]CHAPTER 2
Principles of drug action
After reading this chapter, the reader will be able to:
1. Define key terms that pertain to principles of drug action
2. Define the drug administration phase
3. Describe the various routes of administration available
4. Define the pharmacokinetic phase
5. Discuss the key factors in the pharmacokinetic phase (e.g., absorption, distribution, metabolism, and elimination)
6. Describe the first-pass effect
7. Differentiate between systemic and inhaled drugs in relation to the pharmacokinetic phase
9. Define the pharmacodynamic phase
10. Discuss the importance of structure-activity relationships
11. Discuss the role of drug receptors
Chemical or drug that binds to a receptor and creates an effect on the body.
Chemical or drug that binds to a receptor but does not create an effect on the body; it blocks the receptor site from accepting an agonist.
Amount of drug that reaches the systemic circulation.
Method by which a drug is made available to the body.
Use of the intestine.
Initial metabolism in the liver of a drug taken orally before the drug reaches the systemic circulation.
Allergic or immune-mediated reaction to a drug, which can be serious, requiring airway maintenance or ventilatory assistance.
Abnormal or unexpected reaction to a drug, other than an allergic reaction, as compared with the predicted effect.
Taking a substance, typically in the form of gases, fumes, vapors, mists, aerosols, or dusts, into the body by breathing in.
Limited to the area of treatment (e.g., inhaled drug to treat constricted airways).
Lung availability/total systemic availability ratio (L/T ratio)
Amount of drug that is made available to the lung out of the total available to the body.
Any way other than the intestine, most commonly an injection (e.g., intravenous, intramuscular, subcutaneous, intrathecal, or intraosseous).
Mechanisms of drug action by which a drug molecule causes its effect in the body.
Study of genetic factors and their influence on drug response.
Time course and disposition of a drug in the body, based on its absorption, distribution, metabolism, and elimination.
Cell component that combines with a drug to change or enhance the function of the cell.
Structure-activity relationship (SAR)
Relationship between a drug’s chemical structure and the outcome it has on the body.
Drug interaction that occurs from two or more drug effects that are greater than if the drugs were given alone.
Pertains to the whole body, whereas the target for the drug is not local, possibly causing side effects (e.g., capsule of acetaminophen for a headache).
Rapid decrease in response to a drug.
Difference between the minimal therapeutic and toxic concentrations of a drug; the smaller the difference, the greater chance the drug will be toxic.
Decreasing intensity of response to a drug over time.
Use of the skin or mucous membrane (e.g., lotion).
Use of the skin (e.g., patch).
The entire course of action of a drug, from dose to effect, can be understood in three phases: drug administration phase, pharmacokinetic phase, and pharmacodynamic phase. This useful conceptual framework, based on the principles offered by Ariëns and Simonis,1 organizes the steps of a drug’s action from drug administration (method by which a drug dose is made available to the body) through effect and ultimate elimination from the body. This framework is illustrated in Figure 2-1 and provides an overview of the interrelationship of the three phases of drug action, each of which is discussed in this chapter.
Drug administration phase
Drug dosage forms
The drug administration phase entails the interrelated concepts of drug formulation (e.g., compounding a tablet for particular dissolution properties) and drug delivery (e.g., designing an inhaler to deliver a unit dose). Two key topics of this phase are the drug dosage form and the route of administration. The drug dosage form is the physical state of the drug in association with nondrug components. Tablets, capsules, and injectable solutions are common drug dosage forms. The route of administration is the portal of entry for the drug into the body, such as oral (enteral), injection, or inhalation. The form in which a drug is available must be compatible with the route of administration desired. The injectable route (e.g., intravenous route) requires a liquid solution of a drug, whereas the oral route can accommodate capsules, tablets, or liquid solutions. Some common drug formulations for each of the common routes of drug administration are listed in Table 2-1.
TABLE 2-1
Common Drug Formulations for Various Routes of Administration
| ENTERAL | PARENTERAL | INHALATION | TRANSDERMAL | TOPICAL |
| Tablet | Solution | Gas | Patch | Powder |
| Capsule | Suspension | Aerosol | Paste | Lotion |
| Suppository | Depot | Ointment | ||
| Elixir | Solution | |||
| Suspension |
Drug formulations and additives
A drug is the active ingredient in a dose formulation, but it is usually not the only ingredient in the total formulation. For example, in a capsule of an antibiotic, the capsule itself is a gelatinous material that allows the drug to be swallowed. The capsule material disintegrates in the stomach, and the active drug ingredient is released for absorption. The rate at which the active drug is liberated from a capsule or tablet can be controlled during the formulation process, by altering drug particle size or by using a specialized coating or formulation matrix. Aerosolized agents for inhalation and treatment of the respiratory tract also contain ingredients other than the active drug, such as preservatives, propellants for metered dose inhaler (MDI) formulations, dispersants (surfactants), and carrier agents with dry powder inhalers (DPIs). Table 2-2 presents the various formulations with different ingredients for the β-adrenergic bronchodilator albuterol. In the nebulizer solution, benzalkonium chloride is a preservative, and sulfuric acid adjusts the pH of the solution. In the CFC-MDI, chlorofluorocarbons are propellants and oleic acid is a dispersing agent. In the HFA MDI, a hydrofluoroalkane is used in place of chlorofluorocarbon.
TABLE 2-2
| DOSAGE FORM | ACTIVE DRUG | INGREDIENTS |
| Nebulizer solution | Albuterol sulfate | Benzalkonium chloride, sulfuric acid |
| MDI CFC | Albuterol-ipratropium | Trichloromono-fluoromethane, dichlorodifluoro-methane, oleic acid |
| Tablets | Albuterol sulfate | Lactose, butylparaben, sugar |
| MDI HFA | Albuterol | 1,1,1,2-Tetrafluoroethane, ethanol, oleic acid |
CFC, Chlorofluorocarbons; HFA, hydrofluoroalkane; MDI, metered dose inhaler.
Routes of administration
Enteral
The term enteral refers literally to the small intestine, but the enteral route of administration is more broadly applicable to administration of drugs intended for absorption anywhere along the gastrointestinal tract. The most common enteral route is by mouth (oral) because it is convenient, is painless, and offers flexibility in possible dosage forms of the drug, as seen in Table 2-1. The oral route requires the patient to be able to swallow; therefore, airway-protective reflexes should be intact. If the drug is not destroyed or inactivated in the stomach and can be absorbed into the bloodstream, distribution throughout the body and a systemic effect can be achieved. Other enteral routes of administration include suppositories inserted in the rectum, tablets placed under the tongue (sublingual), and drug solutions introduced though an indwelling gastric tube.
Parenteral (injectable)
• Intravenous (IV): Injected directly into the vein, allowing nearly instantaneous access to the systemic circulation. Drugs can be given as a bolus, in which case the entire dose is given rapidly, leading to a sharp increase in the plasma concentration, or a steady infusion can be used to avoid this precipitous increase.
• Intramuscular (IM): Injected deep into a skeletal muscle. Because the drug must be absorbed from the muscle into the systemic circulation, the drug effects occur more gradually than with intravenous injection, although typically more rapidly than by the oral route.
• Subcutaneous (SC): Injected into the subcutaneous tissue beneath the epidermis and the dermis.
• Intrathecal (IT): Injected into the arachnoid membrane of the spinal cord to diffuse throughout the spinal fluid.
Inhalation
Drugs can be given by inhalation for either a systemic effect or a local effect in the lung. Two of the most common drug formulations given by this route are gases, which usually are given by inhalation for anesthesia (a systemic effect), and aerosolized agents intended to target the lung or respiratory tract in the treatment of respiratory disease (local effect). The technology and science of aerosol drug delivery to the respiratory tract continue to develop and are described in detail in Chapter 3. Box 2-1 provides a summary of devices commonly used for inhaled aerosol drug delivery. The general rationale for aerosolized drug delivery to the airways for treating respiratory disease is the local delivery of the drug to the target organ, with reduced or minimal body exposure to the drug and, it is hoped, reduced prevalence or severity of possible side effects.
Pharmacokinetic phase
Absorption
After traversing these layers, a drug can reach the smooth muscle or glands of the airway. The mechanisms by which drugs move across membrane barriers include aqueous diffusion, lipid diffusion, active or facilitated diffusion, and pinocytosis. Generally, a drug must be sufficiently water-soluble to reach a lipid (cell) membrane and sufficiently lipid-soluble to diffuse across the cell barrier. Figure 2-2 illustrates these basic mechanisms, which are briefly discussed.
Lipid diffusion
Weak acid: Because an acid contributes protons (H+ ions), the protonated form is neutral, or nonionized.
Weak base: Because a base accepts protons (H+ ions), the unprotonated form is neutral, or nonionized.
• The protonated weak acid is neutralized by the addition of H+ ions in an acidic environment, is nonionized, and is lipid-soluble.
• The protonated weak base gains a charge by adding H+ ions in an acidic environment, is ionized, and is not lipid-soluble.
Figure 2-2 conceptually illustrates the principle of lipid diffusion and absorption for weak acids and bases.
Distribution
The plasma concentration of a drug is partially determined by the rate and extent of absorption versus the rate of elimination for a given dose amount. The volume in which the drug is distributed also determines the concentration achieved in plasma. Those compartments and their approximate volumes in a 70-kg adult are given in Table 2-3.
TABLE 2-3
Volumes (Approximate) of Major Body Compartments
| COMPARTMENT | VOLUME (L) |
| Vascular (blood) | 5 |
| Interstitial fluid | 10 |
| Intracellular fluid | 20 |
| Fat (adipose tissue) | 14-25 |
