CHAPTER 12 Principles and new developments in molecular biology
Introduction
Expedited by completion of the draft version of the Human Genome Project in 2001 (Lander et al 2001, Venter et al 2001), the last decade has witnessed unprecedented advances in experimental methods in an ambitious effort to link genomics with whole-organism physiology and pathophysiology. The genome amongst individuals is 99.9% homologous, with diversity of function generated through postgenomic regulation at the mRNA and protein level. Detailed analysis of the human genome shows it to consist of approximately 3.1 billion base pairs (Little 2005). Of the genes, approximately 24,000, far fewer than the number expected, encode proteins with phenotypic diversity generated by multiple splice variants. It is estimated that over 800 additional genes are transcribed into small microRNAs (miRNA), although significantly more encode non-coding RNA (Little 2005). Clearly, the draft sequence has provided tantalising insight into the mysterious organization and complexity of the human genome that will be gradually unravelled for years to come.
Global Screening and Analysis
Traditionally, pursuit of scientific enquiry has been hypothesis-driven, which by its nature deconstructs complex biological systems into manageable ‘bite-sized’ studies with a very specific research question. In our wider quest to understand systems biology and networks, a reductionist approach is ill suited to investigating the integrative nature of whole-organism physiology, specifically the interactions between genes, protein and function. Given the immense volume of sequence data generated by the Human Genome Project, an escalation in research targeted towards population-based, high-throughput screening of gene expression has since been observed. The emphasis on networks, rapid advances in -omic technologies and high-dimensional biology has produced unparalleled insight into the relationships between the genome, transcriptome, proteome and, more recently, the metabolome. These innovative approaches have also necessitated unprecedented dependence on the discipline of bioinformatics. Table 12.1 lists key websites that are the backbone of such investigations requiring information on gene and protein sequences, gene annotation, sequence homology, microarray analysis etc. Many of these are freely available, with two of the most comprehensive and popular sources of sequence information being the National Center for Biotechnological Information (NCBI) and Ensembl.
Table 12.1 Commonly used web-based tools and databases for genome analysis
| Function/ institute | Software | URL (http://…) |
|---|---|---|
| Nucleotide/protein sequence data | NCBI | www.ncbi.nlm.nih.gov |
| European Bioinformatics Institute | EMBL | www.ebi.ac.uk |
| Expert protein analysis system | Expasy | www.expasy.ch |
| Human and other genome sequences | Ensembl | www.ensembl.org |
| Human genome sequence data | NCBI | www.ncni.nlm.nih.gov/genome |
| Basic local alignment search tool | BLAST | www.ncbi.nlm.nih.gov/blast |
| ESTs, full-length clones, libraries | IMAGE | www.geneservice.co.uk/products/image/index.jsp |
| Human gene expression | HuGE | www.HugeIndex.org |
| Online Mendelian inheritance in man | OMIM | www.ncbi.nlm.nih.gov/omim |
| Haplotype map project | HapMap | www.hapmap.org |
| Microarray gene expression data | MGED | www.mged.org |
| Stanford microarray database | SMD | smd.stanford.edu/ |
| Microarray manufacture | Affymetrix | www.affymetrix.org, www.dnachip.org/ |
| Primer design | Primer 3 | primer3.sourceforge.net/ |
EST, expressed sequence tag.
Microarray technology
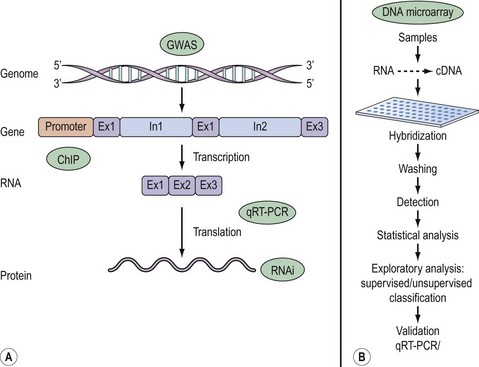
Gene sequence data in isolation provide little information on protein function. ‘Functional genomics’, the term used to describe the relationship between genes and physiological mechanisms on a global rather than individual basis, has evolved to probe these interactions. In particular, pioneering research using genechip technology enabling simultaneous global gene expression of thousand of genes (Schena et al 1995, Brown and Botstein 1999) has been at the forefront of functional genomics, and is the mainstay of high-throughput assays. It is a powerful means of identifying subsets of genes that are either up- or downregulated in a particular research scenario (Duggan et al 1999, Hegde et al 2000). Specifically, gene expression may be compared: (1) in different tissues/cells, (2) under developmental regulation (fetal versus adult) and on ageing, (3) in normal and disease states, and (4) in response to, for example, drug treatments, environmental cues etc.
Practical Aspects and Analysis
Microarrays
The success of DNA microarray technology exploits the complementarity of Watson–Crick base pairing that underlies hybridization of sample cDNA to either short oligonucleotide or cDNA sequences immobilized in a grid-like fashion on a solid substrate (Duggan et al 1999, Hegde et al 2000). Typically, a glass slide, nylon membrane or silicon wafer is the preferred format, although bead-based arrays are also available. For cDNA arrays, probe sequences principally derive from the IMAGE (Integrated Molecular Analysis of Genomes and their Expression) clone library arising from the Human Genome Project. These arrays include known genes whose function is as yet unknown, and expressed sequence tags whose full sequence and function are yet to be determined. High-density oligonucleotide arrays, such as those provided by Affymetrix, may be fabricated in situ by solid-phase chemical synthesis combined with photolithography. The sequences on Affymetric chips derive from ‘refseq’ — the definitive version of the gene sequence — contained within the NCBI suite of programs (Table 12.1). Currently, the latest arrays from Affymetrix offer unparalleled whole-genome analysis with over 700,000 probes representing over 28,000 human genes on a single array. Despite the diversity of microarrays available, some may not include the gene of interest to the specific research group, leading to the loss of key information in the study of gene pathways. An alternative strategy is to manufacture tailored arrays that include a smaller set of known genes of interest.
Once a research question has been formulated, the basic steps in a DNA microarray experiment, illustrated in Figure 12.1, commence with extraction and reverse transcription of total RNA or mRNA into cDNA from samples under investigation. Sample cDNA is then labelled either with radioactive or fluorescent probes and hybridized to the array. The main advantage of radioactive over fluorescent labelling is the enhanced sensitivity of the former. A currently popular approach involves differential labelling of test and control sample cDNA with the fluorophores Cy3 and Cy5. Following stringent washing to remove non-specific binding, image analysis of the emitted signal is performed either by quantitative phosphorimaging of radioactively labelled samples or by powerful laser scanning of fluorescence. These raw data are subsequently processed to generate scatter plots that offer a quick and easy means of surveying unaltered, up- or downregulated genes. A gene expression matrix, consisting of data organized in rows and columns reflecting the output of each individual gene in a particular sample, allows the data to be ranked and probabilities determined in order to identify individual fold changes in gene expression as a result of a biological effect. Typically, more than a two-fold change in transcript expression is taken to indicate biological relevance.
Inherent in these methods is the technical variation arising from a number of sources including RNA quality, variable probe labelling, high background etc. Distinguishing between real experimental changes and those due to technical variation is achieved by some form of normalization designed to remove bias and to ensure that the results obtained are an accurate depiction of a true biological effect. Normalization generally requires subtraction of background intensity from the signal of each gene. Other forms of normalization include comparison of gene expression against a known set of reference (housekeeping) genes included on the array that demonstrate constant expression irrespective of tissue type and conditions. The Human Gene Expression database (Table 12.1) is a useful source of information of such genes expressed in a variety of tissues.
Statistical analysis
An alternative approach is to use fold change, in which the within-treatment variance is ignored. The problem with this is that variances do matter and vary between genes and treatments. Moreover, fold change may stem from an initially low level of expression, possibly reducing the biological significance of the change. A method of improving the power of the t-test is to use a Bayesian statistical approach that uses prior knowledge of within-treatment measurement (Baldi et al 1998). In the case of arrays, this is achieved by assuming that genes with similar expression levels have similar measurement errors (Baldi and Long 2001). In addition, the data are not viewed in isolation but in the context of known biological interactions.
Given the caveats that apply to the use of the t-test for statistical analysis of array data, an alternative method used to derive probability values that has been applied to microarray data is the use of permutation tests. Unlike the t-test, permutation tests do not require data to be normally distributed nor variances to be equal, and are therefore more likely to detect real changes in expression. Tusher et al (2001) have developed a method that uses permutation tests known as ‘Significance Analysis of Microarrays’ (SAM), where each gene is assigned a score taking into account its expression and standard deviation. The uptake of the SAM method has been greatly facilitated by the availability of an Excel plug-in. It also provides information on the false discovery rate, which corrects for false-positive results in order to eliminate random changes in gene expression.
Exploratory data analysis and data models
Since the aim of most microarray experiments is to identify differential gene expression compared with a control sample/condition, some means of organizing genes into meaningful subsets forms part of exploratory analysis. For example, a comparison between normal and endometriotic tissue may unveil changes in multiple genes involved in inflammation or cell adhesion. Similarly, treating a cell line with steroids may lead to a downregulation of genes encoding inflammatory cytokines. Exploratory analysis investigates such relationships using unsupervised or supervised classification to identify patterns of gene expression based on similarity measurements, yet providing little or no information on the statistical significance of the findings. Supervised classification is distinct from unsupervised methods since it involves making prior assumptions about the data sets but may introduce bias (Shipp et al 2002).
Broadly speaking, unsupervised methods that include cluster analysis (Kerr and Churchill 2007) or principal components analysis (Hilsenbeck et al 1999) identify groups of genes that change and cluster them into cognate groups. One of the shortfalls of this approach is that genes that do show changes with expression but have no perceived function may be overlooked. This is more so when one considers that it is likely that several genes may be implicated in a physiological response. A further problem is in identifying the best model within which to place the individual gene expression changes. Genes may be clustered using hierarchical clustering (Eisen et al 1998), two-way clustering (Alon et al 1999), k-mean clustering, principal components analysis (Tavazoie et al 1999) and self-organizing maps (Tamayo et al 1999). It is also preferable to determine the validity of applying particular clustering algorithms to one’s data by carrying out bootstrap or jack knife analysis (Reimers 2005). Detailed mathematical arguments relating to supervised and unsupervised methods are beyond the scope of this chapter; readers are referred to the preceding references and the following sources for further information: Reimers (2005), D’Haeseleer (2005), Thalamuthu et al (2006) and Kerr et al (2008).
Limitations of microarrays
Although the use of microarrays has dramatically altered the field of molecular biology, it is no easy task to compare data across groups and arrays due to the variation in arrays used, normalization protocols employed, and statistical analyses and exploratory models applied. In an attempt to reach a consensus on sharing and storing array data, Brazma et al (2001) have launched Minimum Information About A Microarray Experiment (MIAME) as a mechanism for recording detailed relevant information on the execution and analysis of array experiments made publicly available for use by independent researchers.
DNA microarrays remain a popular experimental tool, such that the technology has now extended to array-based global analysis of miRNAs, DNA methylation, genome-wide scanning and proteins. A further modification of this method for analysing histone modifications and gene-promoter sequence binding is based on chromatin immunoprecipitation (ChIP), which utilizes formaldehyde fixation to provide a snapshot of protein–DNA molecular interactions in situ (Wathelet et al 1998). This method has advantages over traditional in-vitro methods used to study transcription factors (i.e. electrophoretic mobility shift assays) and gene reporter studies that employ synthetic segments of promoter DNA that do not form chromatin with a structure reflective of that in native chromosomal DNA. ChIP-on-ChIP is an array-based method that allows mass screening of gene promoters involved in transcription and repression of genes (Collas 2009), and is a valuable addition to the armoury employed in studying gene regulation.
Validation of Microarray Data
Quantitative polymerase chain reaction
The sensitivity of the PCR has been instrumental in the elucidation of gene expression profiles at a cell and tissue level. Most readers will be familiar with the basis of the PCR which uses Taq polymerase, a thermostable enzyme isolated from the bacterium Thermus aquaticus, to exponentially amplify gene expression. Taq DNA polymerase has intrinsic 5′–3′exonuclease activity, optimal at approximately 72°C, and amplifies at a rate of 30–70 bases per second. The technique uses either template DNA or RNA from various sources (ex-vivo tissue biopsies, cell lines, blood, cloned DNA, microbial DNA) to compare expression of product (amplicon) under varied experimental conditions as decribed earlier. Quantitative PCR (qPCR) has rapidly supplanted conventional ‘endpoint’ PCR (Higuchi et al 1992, Wittwer et al 1997, Kubista et al 2006). It represents a major refinement where assay throughput has been greatly improved with 96- or 384-well plate formats, fluorescence detection and the commercial availability of ready prepared ‘master mixes’ that only require the addition of cDNA to amplify the relevant gene. The process of amplification essentially involves continual cycling between denaturation of double-stranded DNA to generate two single-template strands that undergo annealing to target primers, followed by strand extension and a consequent increase in product copy number.
Fluorescence chemistry in quantitative reverse transcriptase polymerase chain reaction
The two most widely used forms of fluorescence detection for qPCR are as follows.
Data analysis and interpretation in quantitative polymerase chain reaction
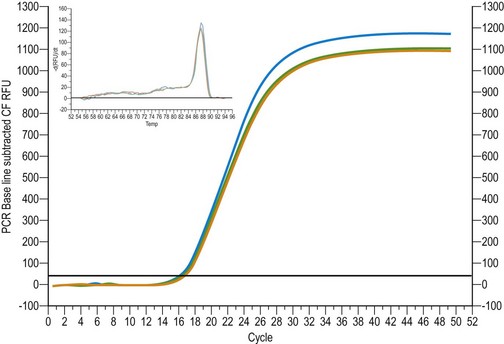
Quantification of the qRT-PCR assay is most accurately determined during the exponential phase of the reaction when amplification products are being generated at a steady optimum rate, approximately 10–20 cycles into the reaction. The software creates an amplification plot with the measured fluorescence signal plotted against the cycle number. The single most important readout of the qRT-PCR is the Ct, and this is the first fluorescence signal that occurs above the threshold limit for fluorescence detection. Differences in Ct values are used to calculate the relative abundance of template between samples, as the Ct value is directly proportional to the amount of template at the start. A crucial factor in qPCR is the amplification efficiency, calculated from the slope of the calibration curve (see below) which should be close to 100% (Higuchi et al 1992).
Absolute quantification
This is a method by which known concentrations of nucleic acids are used to generate a standard curve from which unknown mRNA expression levels for target genes may be determined. For the method, known concentrations of cDNA or copy number are used in a calibration curve to create a standard curve with Ct plotted against log concentration or copy number cDNA. The data in Figure 12.2 illustrate an amplification curve showing E-cadherin expression in human endometrium.
Relative quantification
Also known as the delta delta Ct (ΔΔCt) method, this uses a simpler approach in that there is no requirement for a standard curve and all quantification is based on Ct values expressed relative to a housekeeping or reference gene (Pfaffl 2001). However, this method is only effective if the reference gene of choice is constant in expression between samples or treatment. The amplification efficiencies of both the target and reference genes should be equal. Despite this, it remains a widely used method.
Normalization
As with microarray data, normalization is an essential step in qRT-PCR and is typically performed in relation to a reference gene. As reference genes are known to vary in many different cell types under various conditions, it is good practice to probe samples for more than one single reference gene (Vandesompele et al 2002). A new standard for determining an appropriate reference gene is derived from the GeNorm programme, which takes actual Ct values from a sample for a number of tested reference genes that are stated in the paper and uses an algorithm to assign an M value to determine the most appropriate stable reference gene from those tested (Vandesompele et al 2002).
It is essential that qPCR and RT-qPCR studies are reported accurately. The varied format currently adopted by researchers does not lend itself to critical appraisal and does not permit comparisons to be made easily. As with microarrays, guidelines on the minimum information for publication of quantitative real-time PCR experiments have been developed (Bustin et al 2009). Researchers undertaking qPCR/qRT-PCR are encouraged to comply with the recommendations made in this article.
Genome-Wide Association Studies
Mapping of single nucleotide polymorphisms and links to complex diseases
The abundance of sequence data produced by the Human Genome Project has made possible the use of microarrays in elucidating genomic variations that predict susceptibility to common diseases that include diabetes and cardiovascular disease (Wellcome Trust Case Control Consortium 2007). Thus, genome-wide association studies (GWAS) utilize large-scale, high-throughput methods to perform unbiased parallel genomic analysis of an unprecedented number of biological samples. The expectation is that this approach will be incorporated into personalized medicine or pharmacogenomics where responses to treatment will be predicated on an individual’s genotype.
GWAS is based on the principle that predisposition to common diseases is attributable to a small number of genetic variations, and that large-scale screening of populations or families will identify sequence patterns predictive of disease (Nica and Dermitzakis 2008). Most complex diseases are a consequence of a composite, non-Mendelian inheritance of multiple genes. The most common source of genetic variation within the human genome is the single nucleotide polymorphism (SNP), where the replacement of one nucleotide with another at a related locus potentially alters the downstream protein product encoded. SNPs, approximately 12 million of which reside within the human genome, are the preferred genetic markers due to their abundance, occurring approximately once every 1000 base pairs. Access to the HapMap database — a repository cataloguing the genetic variation in ethnically distinct populations and their link to health and disease (Frazer et al 2007) — has been instrumental in the launch of GWAS studies. Not all SNPs cause disease (Stranger and Dermitzakis 2006) and, interestingly, experimental evidence indicates that SNPs account for only a small proportion of the phenotypic variance, implying association with other non-genetic factors, particularly gene–environment interactions.
Pertinent to female health, the Womens’ Genome Health Study, a full-cohort prospective GWAS, was commenced recently (Ridker et al 2008). The goal of this project is to produce a fully searchable database of SNPs for women in order to identify polymorphism patterns that predict disease in otherwise healthy women. The Women’s Genome Health Study will use the same study population of well-characterized healthy women initially recruited to the Women’s Health Study. These women have already undergone 12 years of monitoring for major health events that include, amongst several others, cardiovascular disease, cancer, diabetes and osteoporosis. Significantly, this study has collated an extensive amount of epidemiological information along with baseline blood samples for several disease biomarkers and DNA for genotyping, as well as dietary and behavioural data that will allow gene–environment and gene–gene interactions to be examined.
Post-Transcriptional Repression and Regulation
The role of microRNA and short, interfering RNA
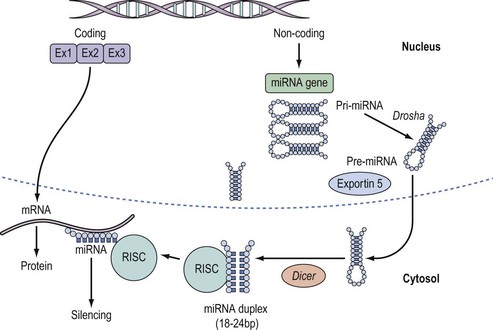
Probably the single most important discovery in cell biology in recent years relates to that of small non-coding RNA molecules, specifically short, interfering RNA (siRNA) and miRNA (Figure 12.3). The landmark paper describing RNA interference (RNAi), where Fire et al (1998) used double-stranded RNA to silence gene expression in Caenorhabditis elegans, has caused a paradigm shift in our interpretation of post-transcriptional regulation. It is estimated that over half of the genes encoding proteins in the human are likely to be regulated by miRNAs, providing a compelling case for further research in this field.
Both miRNA and siRNA are produced endogenously in the nucleus, although siRNA was initially thought to have a solely exogenous origin, deriving principally from viruses. siRNA has since been demonstrated in native cells where it has been termed ‘endo-siRNA’. Interestingly, biogenesis of both siRNA and miRNA proceeds by a similar mechanism, described below, which evokes silencing in association with the Argonaute (Ago) superfamily of proteins (Meister et al 2005, Tomari and Zamore 2005).
miRNAs, in their fully-processed mature form, are short (18–24), single-stranded segments of RNA that bind to the 3′ UTR region of mRNA to induce transcriptional silencing (Carthew and Sontheimer 2009). They are produced in the nucleus from DNA by the action of RNA polymerase II to generate a long (hundreds to thousands of nucleotides), double-stranded precursor, primary RNA or pri-miRNA. The latter is spliced in the nucleus into pre-miRNA (70 nucleotides in length) by the enzyme ‘Drosha’ (Lee et al 2002), then exported to the cytoplasm by an accessory protein, exportin 5. Further processing of pre-miRNA by the enzyme ‘Dicer’ yields a miRNA duplex of approximately 22 nucleotides and a two-nucleotide overhang at the 3’ end (Yi et al 2003, Gregory et al 2005). Entry of this duplex into the RNA-induced silencing complex induces the association of one strand (the guide strand) with Ago where it is unwound and post-transcriptional repression of target mRNA ensues (see Figure 12.2). The other ‘passenger’ strand is degraded. It is interesting that perfect complementary base pairing between miRNA-mRNA results in degradation of the target mRNA, while a slight mismatch of base pairing induces silencing and translational repression (Tomari and Zamore 2005). Whilst the specific mechanisms that determine whether target mRNA is degraded or repressed remain an active area of research, imperfect base pairing has evolved as an ingenious mechanism that explains the multiplicity of targets for miRNA clusters. It should be borne in mind that some miRNA species only have one target.
Apart from their roles in development and stem cell differentiation, miRNAs appear to play a key role in both oncogenesis and tumour suppression. miRNAs involved in oncogenesis involve the mIR-17-92 cluster implicated in a mouse model of lymphoma (He et al 2005). Intriguingly, circulating miRNAs have been detected in blood and serum of cancer patients (Lawrie 2008), thus presenting an opportunity to harness miRNAs for diagnostic, prognostic and therapeutic purposes in the management of a wide range of malignancies.
The emergence of RNAi (Fire et al 1998) and the early success of siRNA in achieving targeted protein knockdown has overcome several obstacles. In practical applications, siRNA has been replaced with short hairpin RNA (shRNA), where the two individual strands of shRNA are linked by a short loop sequence of approximately eight nucleotides. shRNA mimics this short hairpin loop found in most native RNA species, therefore replicating function more faithfully than siRNA. Although siRNA technology holds great promise, one of the problems with its use was the observation that binding of the guide strand to large numbers of genes resulted in altered expression of a host of miRNA species; a phenomenon known as ‘off-targeting’. While this has been largely overcome through improved design of siRNA, another problem surfaced with the finding that shRNA-expressing vectors were dose-dependently linked to increased mortality in experimental animals, indicating overloading of the siRNA pathway. In addition, this study also challenged the notion that siRNA species lack immunogenicity since an immune response that involved Toll-like receptors — the pattern recognition family of Toll-like receptors — could be elicited (Grimm 2009). Despite these concerns, the experimental and potential therapeutic advantages of siRNAs provide a compelling case for their translation to the clinical arena.
Applications to Reproductive Biology
Implantation/fertility
One of the most intractable problems facing reproductive medicine is failed implantation, whether this arises in natural cycles or in assisted reproduction. Transcript profiling studies, summarized in a recent review (Sherwin et al 2006), have sought to define endometrial function and receptivity. More recently, functional genomics has provided new information on molecular phenotyping of normo-ovulatory women (Talbi et al 2006). The authors convincingly demonstrated that microarray methods are as effective as histological methods in dating the endometrium. By using k-means clustering, a unique molecular signature associated with early proliferative, early secretory, mid-secretory and late secretory phase endometrium was also identified. Whilst studies of miRNA in the female reproductive tract are in their infancy, deletion of ‘Dicer’, an enzyme involved in miRNA processing, causes multiple reproductive defects that include reduced ovulation rates, loss of embryo integrity and oviductal cysts (Luense et al 2009). Investigations in humans on the role of ‘Dicer’ may uncover a common function of this enzyme in fertility. Given the ubiquity of RNA silencing, it is likely that developments in understanding failed implantation and subfertility will involve further forays into the field of miRNAs.
Endometriosis
The surgical and medical treatment of endometriosis remains a major area of clinical interest. Current medical strategies seek to induce a pseudomenopause or pseudopregnancy. Newer approaches include the use of aromatase inhibitors, gonadotrophin-releasing hormone antagonists, selective oestrogen modulators and antiprogestins. Alternatively, it might be possible to find new response genes or miRNAs that are differentially expressed in endometriotic lesions compared with eutopic endometrium. A recent investigation showed differential expression of 22 miRNAs in ectopic versus eutopic endometrium (Ohlsson Teague et al 2009). The target pathways appear to involve the c-jun and protein kinase B signalling pathways. On this basis, new therapeutic strategies targeting these cascades or the miRNAs implicated offer new direction in the future treatment of endometriosis.
Ovarian cancer
Ovarian epithelial tumours are of several histological subtypes, broadly being divided into serous and mucinous and by the degree of differentiation. A downregulation of miR-21 and several of the let-7 family of miRNAs in ovarian tumours has been reported, while miR-221 expression was raised (Dahiya et al 2008). A recent investigation has also identified that the mRNA for key enzymes ‘Drosha’ and ‘Dicer’ that catalyse miRNA biogenesis is reduced by 51% and 60%, respectively, in invasive ovarian cancer. Furthermore, high levels of ‘Dicer’ and ‘Drosha’ correlated with increased patient survival (Merritt et al 2008). A study of six types of cancer including ovarian demonstrated that miRNA profiling in tiny volumes (<1 ml) of serum could clearly distinguish between normal donors and cancer patients (Lodes et al 2009). These findings raise the prospect of using less-invasive serum-based assays in ovarian cancer detection and progression.
Conclusions
KEY POINTS
Alon U, Barkai N, Notterman DA, et al. Broad patterns of gene expression revealed by clustering analysis of tumor and normal colon tissues probed by oligonucleotide arrays. Proceeding of the National Academy of Sciences of the United States of America. 1999;96:6745-6750.
Baldi P, Vanier MC, Bower JM. On the use of Bayesian methods for evaluating compartmental neural models. Journal of Computational Neuroscience. 1998;5:285-314.
Baldi P, Long AD. A Bayesian framework for the analysis of microarray expression data: regularized t test and statistical inferences of gene changes. Bioinformatics. 2001;17:509-519.
Brazma A, Hingamp P, Quackenbush J, et al. Minimum information about a microarray experiment (MIAME) — toward standards for microarray data. Nature Genetics. 2001;29:365-371.
Brown PO, Botstein D. Exploring the new world of the genome with DNA microarrays. Nature Genetics. 1999;21:33-37.
Bustin SA, Benes V, Garson JA, et al. The MIQE guidelines: minimum information for publication of quantitative real-time PCR experiments. Clinical Chemistry. 2009;55:611-622.
Carthew RW, Sontheimer EJ. Origins and mechanisms of miRNAs and siRNAs. Cell. 2009;136:642-655.
Collas P. The state-of-the-art of chromatin immunoprecipitation. Methods in Molecular Biology. 2009;567:1-25.
D’Haeseleer P. How does gene expression clustering work? Nature Biotechnology. 2005;23:1499-1501.
Dahiya N, Sherman-Baust CA, Wang TL, et al. MicroRNA expression and identification of putative miRNA targets in ovarian cancer. PLoS ONE. 2008;3:e2436.
Duggan DJ, Bittner M, Chen Y, Meltzer P, Trent JM. Expression profiling using cDNA microarrays. Nature Genetics. 1999;21:10-14.
Eisen MB, Spellman PT, Brown PO, Botstein D. Cluster analysis and display of genome-wide expression patterns. Proceedings of the National Academy of Sciences of the United States of America. 1998;95:14863-14868.
Fire A, Xu S, Montgomery MK, Kostas SA, Driver SE, Mello CC. Potent and specific genetic interference by double-stranded RNA in Caenorhabditis elegans. Nature. 1998;391:806-811.
Frazer KA, Ballinger DG, Cox DR, et al. A second generation human haplotype map of over 3.1 million SNPs. Nature. 2007;449:851-861.
Gregory RI, Chendrimada TP, Cooch N, Shiekhattar R. Human RISC couples microRNA biogenesis and posttranscriptional gene silencing. Cell. 2005;123:631-640.
Grimm D. Small silencing RNAs: state-of-the-art. Advanced Drug Delivery Reviews. 2009;61:672-703.
He L, Thomson JM, Hemann MT, et al. A microRNA polycistron as a potential human oncogene. Nature. 2005;435:828-833.
Hegde P, Qi R, Abernathy K, et al. A concise guide to cDNA microarray analysis. Biotechniques. 2000;29:548-550.
Higuchi R, Dollinger G, Walsh PS, Griffith R. Simultaneous amplification and detection of specific DNA sequences. Biotechnology. 1992;10:413-417.
Hilsenbeck SG, Friedrichs WE, Schiff R, et al. Statistical analysis of array expression data as applied to the problem of tamoxifen resistance. Journal of the National Cancer Institute. 1999;91:453-459.
Kerr MK, Churchill GA. Statistical design and the analysis of gene expression microarray data. Genetical Research. 2007;89:509-514.
Kerr G, Ruskin HJ, Crane M, Doolan P. Techniques for clustering gene expression data. Computers in Biology and Medicine. 2008;38:283-293.
Kubista M, Andrade JM, Bengtsson M, et al. The real-time polymerase chain reaction. Molecular Aspects of Medicine. 2006;27:95-125.
Lander ES, Linton LM, Birren B, et al. Initial sequencing and analysis of the human genome. Nature. 2001;409:860-921.
Lawrie CH. MicroRNA expression in lymphoid malignancies: new hope for diagnosis and therapy? Journal of Cellular and Molecular Medicine. 2008;12:1432-1444.
Lee Y, Jeon K, Lee JT, Kim S, Kim VN. MicroRNA maturation: stepwise processing and subcellular localization. The EMBO Journal. 2002;21:4663-4670.
Little PF. Structure and function of the human genome. Genome Research. 2005;15:1759-1766.
Lodes MJ, Caraballo M, Suciu D, Munro S, Kumar A, Anderson B. Detection of cancer with serum miRNAs on an oligonucleotide microarray. PLoS ONE. 2009;4:e6229.
Luense LJ, Carletti MZ, Christenson LK. Role of Dicer in female fertility. Trends in Endocrinology and Metabolism. 2009;20:265-272.
Meister G, Landthaler M, Peters L, et al. Identification of novel argonaute-associated proteins. Current Biology. 2005;15:2149-2155.
Merritt WM, Lin YG, Han LY, et al. Dicer, Drosha, and outcomes in patients with ovarian cancer. New England Journal of Medicine. 2008;359:2641-2650.
Nica AC, Dermitzakis ET. Using gene expression to investigate the genetic basis of complex disorders. Human Molecular Genetics. 2008;17:R129-R134.
Ohlsson Teague EM, Van der Hoek KH, Van der Hoek MB, et al. MicroRNA-regulated pathways associated with endometriosis. Molecular. Endocrinology. 2009;23:265-275.
Pearson TA, Manolio TA. How to interpret a genome-wide association study. Journal of the American Medical Association. 2008;299:1335-1344.
Pfaffl MW. A new mathematical model for relative quantification in real-time RT-PCR. Nucleic Acids Research. 2001;29:e45.
Reimers M. Statistical analysis of microarray data. Addiction Biology. 2005;10:23-35.
Ridker PM, Chasman DI, Zee RY, et al. Rationale, design, and methodology of the Women’s Genome Health Study: a genome-wide association study of more than 25,000 initially healthy american women. Clinical Chemistry. 2008;54:249-255.
Schena M, Shalon D, Davis RW, Brown PO. Quantitative monitoring of gene expression patterns with a complementary DNA microarray. Science. 1995;270:467-470.
Sherwin R, Catalano R, Sharkey A. Large-scale gene expression studies of the endometrium: what have we learnt? Reproduction. 2006;132:1-10.
Shipp MA, Ross KN, Tamayo P, et al. Diffuse large B-cell lymphoma outcome prediction by gene-expression profiling and supervised machine learning. Nature Medicine. 2002;8:68-74.
Stranger BE, Dermitzakis ET. From DNA to RNA to disease and back: the ‘central dogma’ of regulatory disease variation. Human Genomics. 2006;2:383-390.
Talbi S, Hamilton AE, Vo KC, et al. Molecular phenotyping of human endometrium distinguishes menstrual cycle phases and underlying biological processes in normo-ovulatory women. Endocrinology. 2006;147:1097-1121.
Tamayo P, Slonim D, Mesirov J, et al. Interpreting patterns of gene expression with self-organizing maps: methods and application to hematopoietic differentiation. Proceedings of the National Academy of Sciences of the United States of America. 1999;96:2907-2912.
Tavazoie S, Hughes JD, Campbell MJ, Cho RJ, Church GM. Systematic determination of genetic network architecture. Nature Genetics. 1999;22:281-285.
Thalamuthu A, Mukhopadhyay I, Zheng X, Tseng GC. Evaluation and comparison of gene clustering methods in microarray analysis. Bioinformatics. 2006;22:2405-2412.
Tomari Y, Zamore PD. Perspective: machines for RNAi. Genes and Development. 2005;19:517-529.
Tusher VG, Tibshirani R, Chu G. Significance analysis of microarrays applied to the ionizing radiation response. Proceedings of the National Academy of Sciences of the United States of America. 2001;98:5116-5121.
Vandesompele J, De Preter K, Pattyn F et al 2002 Accurate normalization of real-time quantitative RT-PCR data by geometric averaging of multiple internal control genes. Genome Biology 3: RESEARCH0034.11.
Venter JC, Adams MD, Myers EW, et al. The sequence of the human genome. Science. 2001;291:1304-1351.
Wathelet MG, Lin CH, Parekh BS, Ronco LV, Howley PM, Maniatis T. Virus infection induces the assembly of coordinately activated transcription factors on the IFN-beta enhancer in vivo. Molecular Cell. 1998;1:507-518.
Wellcome Trust Case Control Consortium. Genome-wide association study of 14,000 cases of seven common diseases and 3,000 shared controls. Nature. 2007;447:661-678.
Wittwer CT, Herrmann MG, Moss AA, Rasmussen RP. Continuous fluorescence monitoring of rapid cycle DNA amplification. Biotechniques. 1997;22:130-131. 134–138
Yi R, Qin Y, Macara IG, Cullen BR. Exportin-5 mediates the nuclear export of pre-microRNAs and short hairpin RNAs. Genes and Development. 2003;17:3011-3016.


