[level-membership-for-surgery-category]
Chapter 93A Preoperative portal vein embolization
Rationale, indications, and results
Overview
Although recent advances in surgical techniques and perioperative care have significantly improved both short- and long-term outcomes after hepatic resection (Belghiti et al, 2000; Fan et al, 1999; Grazi et al, 2001; Imamura et al, 2003; Jarnagin et al, 2002), postoperative liver volume insufficiency is still a major concern after an extensive liver resection. Both the small size of the remnant liver parenchyma after an extensive liver resection and sinusoidal injury caused by an abrupt increase in portal venous flow/pressure may be implicated in an increased rate of postoperative morbidity associated with cholestasis, ascites, and impaired synthetic function (Panis et al, 1997). These conditions all may lead to a protracted recovery and extended hospital stay and may eventually result in fatal liver failure, although rarely. This concern is even more relevant in patients with obstructive jaundice or underlying liver disease; that is, in those who not only have liver fibrosis or cirrhosis but also liver injury induced by chemotherapy, originally in patients with normal liver (see Chapters 50B, 65, 87, and 90F).
In 1982, we first carried out a preoperative portal vein embolization (PVE) for a patient with hilar bile duct carcinoma with the intention of increasing the operative safety under these circumstances (Makuuchi et al, 1984, 1990). The approach was based on the concept of the hepatic atrophy-hypertrophy complex (see Chapter 5). We attempted to initiate hypertrophy of the future liver remnant (FLR) before resection to induce atrophy in the embolized part of the liver to be resected with compensatory hypertrophy of the nonembolized FLR. Satisfactory initial outcomes led us to extend the indications for PVE to patients with metastatic liver tumors of colorectal origin (Kawasaki et al, 1994a) and for patients undergoing hepatopancreatoduodenectomy (Kawasaki et al, 1994b). Because of its technical simplicity and the consistent attainment of liver hypertrophy after the procedure, PVE has become a standard preoperative intervention worldwide, and its indications have been expanded to patients with hepatocellular carcinoma (HCC) (Aoki et al, 2004; Azoulay et al, 2000a; Lee et al, 1993; Ogata et al, 2006; Tanaka et al, 2000; Yamakado et al, 1997).
Historic Background
The concept of the hepatic atrophy-hypertrophy complex dates back to 1920, when Rous and Larimore (1920) showed that ligation of a major branch of rabbit portal vein resulted in atrophy of the ipsilateral hepatic lobe and hypertrophy of the contralateral lobe. The same phenomenon was observed in experiments involving long-term bile duct obstruction (McMaster & Rous, 1921); however, in contrast to the predictable response to portal venous occlusion, the magnitude of response to bile duct obstruction differs substantially among species (Braasch et al, 1972; Schalm et al, 1956; Steiner & Martinez Batiz, 1962; Stewart et al, 1937).
In 1975, Honjo and colleagues ligated the ipsilateral portal venous branch in patients with HCC in an effort to suppress tumor growth. Although this approach did not succeed in preventing tumor growth, it did produce marked atrophy of the occluded hemiliver. Likewise, our patients experienced an uneventful postoperative clinical course after extensive hepatectomy for hilar bile duct carcinoma involving a branch of the portal vein, causing hemiliver atrophy with corresponding hypertrophy of the contralateral hemiliver (Takayasu et al, 1986). These clinical observations led one of us (M.M.) to attempt PVE application as an adjunct procedure for major hepatectomy.
Hemodynamic Consequences
Total portal venous flow volume was thought to remain unchanged before and after PVE, because liver does not have an intrinsic ability to modulate portal flow, which is a function of extrahepatic (i.e., splanchnic and systemic) factors. This principle was confirmed in a study using a rat model of hemihepatic portal vein ligation and radioactive microsphere technique (Rocheleau et al, 1999) and in a human PVE study using Doppler ultrasound (Denys et al, 2000), proving that the same volume of portal venous flow as that prior to PVE would enter nonembolized liver segments after PVE. Portal pressure in the nonembolized hemiliver is elevated immediately after PVE by 4.9 ± 2.7 cm H2O (Takayama et al, 1997). A similar increment was observed in patients with cirrhosis, who had higher baseline portal pressure (Aoki et al, 2004). Information on chronologic alterations in portal pressure after PVE is unavailable, but the elevation is believed to be transient, with pressure gradually returning to the baseline value in 2 to 3 weeks, as indicated by the portal flow velocity (cm/sec) changes measured by transcutaneous Doppler ultrasound (Goto et al, 1998).
Our concern that an abrupt increase in portal venous pressure after major hepatectomy may result in liver damage is one of the two reasons why we had attempted PVE. This concern seems to have been given little attention compared with a concern that a diminished liver may not meet metabolic demands after resection. We believe that incremental increases in portal venous flow/pressure observed after PVE may increase tolerance in patients to high portal venous flow/pressure after extensive hepatic resection, resulting in an attenuation of liver damage after the subsequent resection (Makuuchi et al, 1991). Other recent studies on living donor liver transplantation (LDLT) have focused on portal pressure and small-for-size syndrome, and high portal pressure immediately after LDLT was reported to be associated with daily volume of ascites (Konishi et al, 2008). Attempts were made to attenuate this problem by splenic arterial ligation or portacaval shunt by some groups (Boillot et al, 2002; Man et al, 2003; Takada et al, 2004; Troisi et al, 2003, 2005).
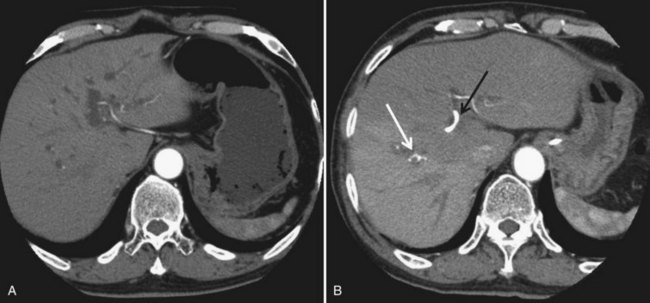
In contrast to portal venous flow, liver is known to have an intrinsic regulatory mechanism to compensate even partially for alteration in portal flow, which is referred to as hepatic arterial buffer response (Lautt, 1985). In the case of PVE with hemihepatic portal vein occlusion or thrombosis of a portal branch, hepatic arterial buffer response is thought to still operate in embolized liver based on studies using dynamic computed tomography (CT) (Fig. 93A.1; Nagino et al, 1998; Wakabayashi et al, 2001), Doppler ultrasound (Denys et al, 2000; Kito et al, 2001), and three-dimensional magnetic resonance angiography (Gülberg et al, 2004), and their findings are in line with the report of a study using a rat model (Rocheleau et al, 1999); however, controversy surrounds the maintenance of hepatic arterial buffer response in nonembolized hemiliver (Denys et al, 2000; Kito et al, 2001; Rocheleau et al, 1999; Wakabayashi et al, 2001). Total liver blood flow, as estimated by a pharmacologic method, remained unchanged throughout the post-PVE period in our previous study (Shimada et al, 2002).
Because hepatic arterial buffer response is a partial compensation, hyperperfusion in a nonembolized hemiliver occurs after PVE, in contrast to hypoperfusion in an embolized hemiliver as expressed per gram of liver tissue. Corresponding hepatocyte regeneration in the nonembolized hemiliver occurs immediately after PVE proportional to the magnitude of the stimulus; however, little is known about when and how the atrophy-hypertrophy complex is terminated. Rocheleau and colleagues (1999) reported that, in a rat model of hemihepatic portal vein ligation, the hepatic atrophy-hypertrophy complex process (i.e., liver weight changes in the ligated and nonligated lobes) continues until total lobar flow per gram of liver tissue is restored. In Western series, planned hepatectomy after PVE had been scheduled when hypertrophy of the nonembolized liver segments seemed to reach their plateau, and full hypertrophy of the nonembolized segments was obtained 7 to 9 weeks after PVE (Azoulay et al, 2000a).
Clinical Course after Portal Vein CHEMOEmbolization
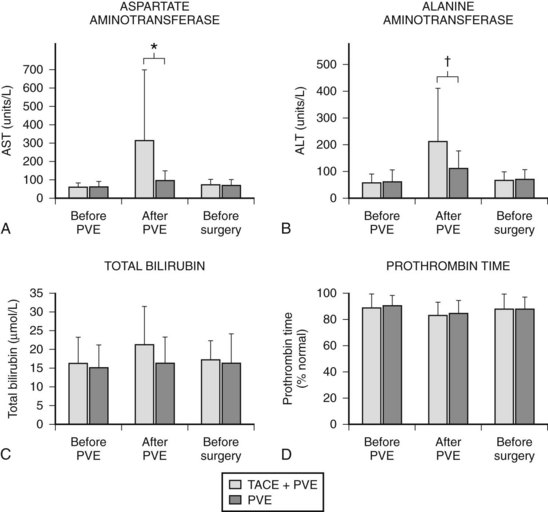
In contrast to transcatheter arterial chemoembolization (TACE), signs and symptoms of postembolization syndrome—such as pain, nausea, and vomiting—are minimal. Most patients experience mild fever after PVE, which subsides within 2 to 3 days. Changes in liver function, as reflected by an increased total bilirubin value and prolonged prothrombin time, are mild and transient, returning to their baseline values 2 to 3 days after PVE. Serum aspartate aminotransferase (AST) and alanine aminotransferase (ALT) values are found to be stable in half of the patients, and in those remaining, values are mildly elevated (1.5 to 3 times the pre-PVE values) on day 1, returning to baseline values in 4 to 7 days after PVE, regardless of the embolization materials used. These findings suggest that inflammatory and necrotic reactions after PVE are minimal, if they are present at all (Imamura et al, 1999a). The exceptions are when absolute ethanol is used for embolization (Shimamura et al, 1997), and when PVE is carried out after TACE (Aoki et al, 2004; Ogata et al, 2006). In both situations, PVE is followed by marked AST and ALT elevations, although both returned to baseline values by the time of scheduled hepatectomy (Fig. 93A.2).
Some have reported on adverse events (complications) or on morbidity rates associated with PVE (Table 93A.1). A multicenter European study of 188 patients who underwent contralateral PVE reported 24 adverse events (12.8%) (Di Stefano et al, 2005). Most adverse events were associated with the PVE technique, including complete portal thrombosis (n = 1), migration of embolic material in the main left portal vein feeding the FLR (n = 2), hemoperitoneum (n = 1), hemobilia (n = 1), rupture of a metastasis into the gallbladder (n = 1), and transient liver failure (n = 6). A recent meta-analysis documented overall morbidity rate for PVE to be 2.2% (Abulkhir et al, 2008). A summary of 37 publications involving 1088 patients showed a total of 497 minor complications and 11 major complications (see Table 93A.1).
Table 93A.1 Complications Following Portal Vein Embolization
| Details | |
|---|---|
| Complication | Number |
| Minor | |
| Abdominal discomfort or pain | 209 |
| Fever | 250 |
| Nausea or vomiting | 26 |
| Ileus | 9 |
| Overflow of embolization materials | 2 |
| Coil displacement | 1 |
| Major | |
| Liver abscess | 3 |
| Cholangitis | 2 |
| Main or left portal vein thrombosis | 2 |
| Subcapsular hematoma | 2 |
| Portal hypertension | 1 |
| Septic necrosis from hepatic artery injury | 1 |
From Abulkhir A, et al, 2008: Preoperative portal vein embolization for major liver resection: a meta-analysis. Ann Surg 247:49-57.
Volumetric Consequences of Portal Vein Embolization
CT scan with contrast enhancement is the most commonly used method for calculating total liver volume (TLV) and FLR volume (FLRV). The nontumorous FLRV/(TLV – Tumor volume), or FLRV/TLV ratio, is a widely used parameter to determine whether PVE is necessary before hepatic resection and to assess the degree of FLR hypertrophy. Vauthey and associates (2002) proposed the use of standard liver volume (SLV), a concept first applied to clinical situations by us in 1995 (Urata et al, 1995). SLV is an alternative method for estimating TLV from a linear regression formula, correlating body surface area or body weight and TLV in healthy subjects (Urata et al, 1995; Vauthey et al, 2002). This formula is based on a concept that optimal liver/body mass ratio in healthy subjects is constant. We first referred to this optimal liver volume as SLV and proposed the application of SLV for recipients of LDLT and also for patients with end-stage liver disease, whose actual liver volumes are either extremely large or small in terms of ideal liver volume to be grafted, such as in cases of primary biliary cirrhosis or fulminant hepatic failure (Urata et al, 1995).
Vauthey and associates (2002) emphasized the importance of SLV as determining indications for PVE, because it may be applied to patients with pathologic liver or obstructive jaundice with dilated bile ducts and may even be calculated in patients with multiple liver metastases. Nevertheless, we adhere to the use of actual TLV for several reasons. First, SLV is a virtual volume estimated by using a formula, and different formulas are used among investigators; r2 in the equation of Vauthey and associates (2002) is 0.49, indicating that their formula explains only half of the interindividual variations for TLV even in healthy subjects. Second, patients with extremely large or small livers in terms of SLV because of underlying liver diseases may not be candidates for liver resection even after PVE. Finally, up-to-date devices such as multislice helical CT with contrast administration allow accurate volumetric measurement by subtracting small tumor volumes and vasculobiliary structures, even to Couinaud’s segment level.
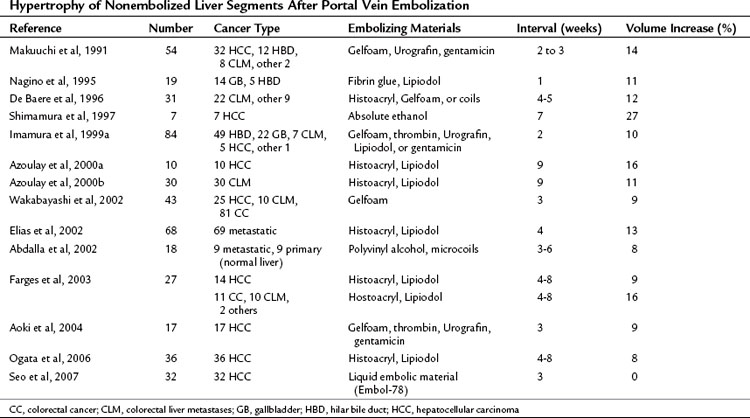
PVE leads to an increment of segmental volume in nonembolized hemiliver and a decrement of segmental volume in embolized hemiliver, homogeneously maintaining a constant TLV (in most studies, TLV remained unchanged after PVE). In case of right hemiliver PVE, regeneration rate of the noncirrhotic liver was 12 cm2/day 2 weeks after PVE (Lee et al, 1993; Nagino et al, 1995), decreasing to 11 cm2/day at 4 weeks (Nagino et al, 1995) and then 6 cm2/day at 32 days (De Baere et al, 1996). In cirrhotic patients, regeneration is reportedly slower, at a rate of 9 cm2/day at 2 weeks (De Baere et al, 1996; Lee et al, 1993). In noncirrhotic and cirrhotic livers, regeneration processes are thought to be blunted by approximately 50% compared with that after hepatectomy (Yamanaka et al, 1993). Results of hypertrophy of nonembolized liver segments after PVE are summarized in Table 93A.2. In most series, hypertrophy of nonembolized liver segments in normal liver was 10% to 15%, expressed in volumetric ratio of nonembolized liver segments to TLV. The figure was smaller (5% to 10%) in diseased liver.
Various factors have been reported to affect the regeneration rate after PVE. Regeneration rate depends on embolized hemiliver volume (Imamura et al, 1999a; Yamakado et al, 1997). In other words, the greater the FLRV before PVE, the smaller the volume increase after PVE. Materials used for embolization affect the results in magnitudes of hypertrophy. Hypertrophy seemed to be modest when biologic materials such as Gelfoam and fibrin glue were used, most probably as a result of the progressive recanalization they induced. Absolute ethanol was reported to achieve the highest degree of regeneration but at the expense of marked increases in AST and ALT levels secondary to liver necrosis (Shimamura et al, 1997). Among the disorders related to background patient characteristics, diabetes, obstructive jaundice, active hepatitis, and cirrhosis have been reported to hamper the regeneration process (Imamura et al, 1999a; Nagino et al, 1995; Tanaka et al, 2000).
Histologic Consequences of Portal Vein Embolization
Human liver tissue obtained 3 weeks after PVE showed almost normal microscopic structures in the embolized and the nonembolized lobes. In the embolized lobe, dilation of sinusoids with decreased hepatocyte density and hepatocyte apoptosis were observed, especially in the pericentral area (Harada et al, 1997). Nevertheless, no signs of necrosis or inflammation were apparent, except when the embolizing material used was absolute ethanol, with tissue showing clear evidence of necrosis (Shimamura et al, 1997), or cyanoacrylate, which causes peribiliary fibrosis (De Baere et al, 1996). In contrast, microscopic findings in the nonembolized hemiliver showed hepatocyte replication as evidenced by the increased mitotic figures and other parameters of cell proliferation, such as proliferative cell nuclear antigen and Ki-67 (Harada et al, 1997; Kusaka et al, 2006), these hepatocytes were histologically characterized by basophilic cytoplasm and abundant binuclear cells, and they were small. These observations are indirect evidence of hepatocyte proliferation (Harada et al, 1997).
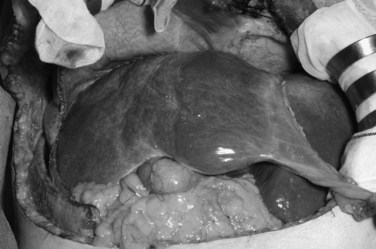
Concluding from the above described laboratory and volumetric data, embolized hemiliver seemed to atrophy (Fig. 93A.3) through apoptosis and subsequent cell deletion, as already suggested by Kerr and associates (1972), who coined the term shrinkage necrosis. Meanwhile, the volume increase in nonembolized hemiliver is explained by hyperplasia; that is, a net increase is seen in cell numbers, rather than cellular hypertrophy, such as in the case of foie gras de canard.
Functional Consequences of Portal Vein Embolization
Cellular hyperplasia and resulting hemiliver hypertrophy do not signify functional gain in the corresponding hemiliver, because proliferating isolated hepatocytes lose their differentiated hepatocyte-specific functions. Most previous reports that investigated liver function after PVE assessed whole liver function, including the embolized and the nonembolized lobe. Overall, functional hepatocyte number—estimated by the clearance of antipyrine, a prototype of low-extractable drug—showed similar values before and 2 weeks after PVE (Shimada et al, 2002). The adenosine triphosphate concentrations and hepatic energy reserves per gram of liver tissue assessed in the nonembolized lobe 3 weeks after PVE were similar to those of control tissue (Chijiiwa et al, 2000). Likewise, the nonembolized lobe uptake of technetium 99m-galactosyl human serum albumin (99mTc-GSA), a ligand bound to asialoglycoprotein receptors on the hepatocyte cell membrane, showed a rapid increase 1 to 2 weeks after PVE (Hirai et al, 2003; Nishiguchi et al, 2000). These findings showed the volume increase in the nonembolized lobe accompanied by a parallel increment in liver function in the corresponding lobe. Improvement in FLR function was also apparent from an increase in bilary excretion (Ijichi et al, 2001; Uesaka et al, 1996).
In a human PVE study, Uesaka and associates (1996) reported that patients with obstructive jaundice showed biliary indocyanine green (ICG) excretion from the nonembolized lobe increasing from the baseline value 10 to 16 days after PVE, and that this increment was more significant than the volume increase. Taking into account that the ICG extraction ratio in noncirrhotic liver is 0.7 to 0.8, ICG transport from hepatocyte to bile canaliculi is extremely fast, and accordingly, its biliary excretion is highly flow dependent; this result in human studies is thought to be an equivalent to that of the rat study reported by Rocheleau and colleagues (1999), and it suggests that the hepatic atrophy-hypertrophy complex process is still underway 2 weeks after PVE. Although this study is often considered to suggest that the gain in function is faster than the gain of volume after PVE, the results should appropriately be interpreted as relating to hemodynamic changes after PVE, considering the pharmacokinetic properties of ICG.
Indications
Cholangiocarcinoma
PVE is indicated most frequently for cholangiocarcinoma, because extended right hepatectomy together with caudate lobe resection is often necessary for curative resection (Kawasaki et al, 2003; Makuuchi et al, 1984, 1990; Nagino et al, 2001; Seyama et al, 2003; see Chapter 50B). Most patients have obstructive jaundice and cholestasis-induced impairment of liver function. Associated pancreatoduodenectomy is necessary in cases with widespread bile duct carcinoma of the main bile duct, as a scheduled procedure or as a result of intraoperative frozen section pathology, to obtain a negative surgical margin. These factors favor the application of PVE to achieve safe hepatic resection.
Unilateral biliary decompression of the FLR lobe is recommended before PVE to improve function in the portion of the liver to remain after hepatectomy. We favor a unilateral approach, even when the communication between the right and left bile ducts is interrupted by tumor progression, in view of the enhanced atrophy-hypertrophy process and the volume gain in the FLR lobe (Braasch et al, 1972; Kawasaki et al, 2003; Kyokane et al, 2003; Seyama et al, 2003). Our recent results also demonstrated that both hypertrophy and bilirubin clearance of the FLR were much improved by selective biliary drainage when compared with total biliary drainage (Ishizawa et al, 2007). The rate of catheter-related infection was also reported to have increased with the number of stents (Neuhaus et al, 1999), and it is important not to carry out unnecessary cholangiography after biliary drainage until hepatectomy. When PVE by a transhepatic contralateral approach is scheduled, biliary decompression before PVE decreases the risk of portobiliary fistula, although not all agree with this approach.
Liver Metastases
Liver resection offers the only chance for cure with possible long-term survival for patients with liver metastases of colorectal origin, including bilateral metastases (Weber et al, 2000; see Chapter 81A). In patients with massive liver tumors that occupy the right liver, extended right hepatectomy does not result in a marked decrease in normally functioning hepatic mass. When similar extensive surgical procedures are indicated for small multiple metastases in the right hemiliver, for a solitary tumor located adjacent to the hilum of the liver, or for bilateral tumors, a large amount of functional hepatic mass must be removed. PVE may be performed under these circumstances to expand the operative indications to patients whose tumors would otherwise be unresectable, owing to their small FLRV, or to increase operative safety (Azoulay et al, 2000b; Elias et al, 2002; Kawasaki et al, 1994a). PVE is also recommended when major hepatectomy is planned with a simultaneous major gastrointestinal procedure, such as when hepatic metastases are removed synchronously with the primary colorectal lesion, or when liver injury is suspected from the preceding systemic or locoregional chemotherapy (Farges et al, 2003).
One major concern is whether PVE enhances tumor growth, especially in the nonembolized lobe (Elias et al, 1999; Kokudo et al, 2001). Increasing evidence suggests that PVE itself stimulates tumor growth, both in embolized and nonembolized segments of the liver, by altering the blood supply and/or inducing a network of cytokines and growth factors, although the precise mechanism and network have not been fully clarified (Fig. 93A.4; see Chapter 10). In embolized segments of the liver, the increased hepatic arterial flow induced by the occluded portal venous flow, the hepatic arterial buffer response, may also promote tumor growth.
In addition, various cytokines and growth factors associated with liver regeneration and hypertrophy may also have stimulatory effects on tumors in the nonembolized segments. Hepatocyte growth factor, epidermal growth factor, transforming growth factor–α, tumor necrosis factor–α, and interleukin-6 are all positive regulators of regeneration and hypertrophy, and all are candidates for tumor growth–inducing factors after PVE (Christophi et al, 2008). On the other hand, a recent animal study suggests that cytokines and growth factors associated with atrophy-hypertrophy after PVE are different from those associated with liver regeneration after a partial hepatectomy (Heinrich et al, 2006).
Clinically, long-term results were reported to be similar regardless of whether PVE was conducted (Azoulay et al, 2000b; Elias et al, 2002). However, Kokudo and colleagues (2001) reported that the disease-free survival period was significantly poorer in the PVE group than in the control group, suggesting that PVE may enhance the aggressiveness of metastatic tumors.
With this possible shortcoming in mind, several authors have proposed two-stage procedures to avoid possible tumor growth in the nonembolized FLR lobe for patients with bilobar metastases: first, the primary tumor is resected, if necessary; next, left liver limited metastasectomies are performed; then right portal vein ligation or PVE are carried out. After an interval of several weeks, (extended) right hepatectomy is performed (Jaeck et al, 2004; Kianmanesh et al, 2003a).
Currently, an increasing number of patients with colorectal liver metastases receive neoadjuvant chemotherapy; however, the liver parenchyma after neoadjuvant chemotherapy using irinotecan is often steatotic, fibrotic, and sometimes cirrhotic. Similarly, sinusoidal obstruction syndrome associated with oxaliplatin has been reported. Such hepatotoxicity is assumed to have an inhibitory effect on the hypertrophy of the nonembolized FLR. Several groups have evaluated the effect of periprocedural chemotherapy, both on tumor growth and FLR hypertrophy, with conflicting results (Aussilhou et al, 2009; Beal et al, 2006; Covey et al, 2008; Goere et al, 2006; Zorzi et al, 2008). Further investigation is necessary to draw an exclusive conclusion.
Hepatocellular Carcinoma
Hepatectomy remains the sole treatment for large HCC, and major hepatic resection is often required (see Chapter 80). Likewise, segment-oriented anatomic resection is recommended even for small HCCs to prevent postoperative recurrence (Hasegawa et al, 2005; Imamura et al, 1999b; Makuuchi et al, 1985; Regimbeau et al, 2002; see Chapter 92); however, 90% of HCC patients have impaired hepatic functional reserve because of hepatitis B or C virus–associated liver fibrosis and cirrhosis, which is the main obstacle to performing hepatic resection. Shirabe and associates (1999) reported a rise in the rate of postoperative liver failure with a smaller FLRV in HCC patients, and PVE triggered liver regeneration in 80% to 90% of HCC patients with chronic liver disease; however, the process was hampered compared with that in patients with normal livers (Aoki et al, 2004; Azoulay et al, 2000a; Farges et al, 2003; Wakabayashi et al, 2002).
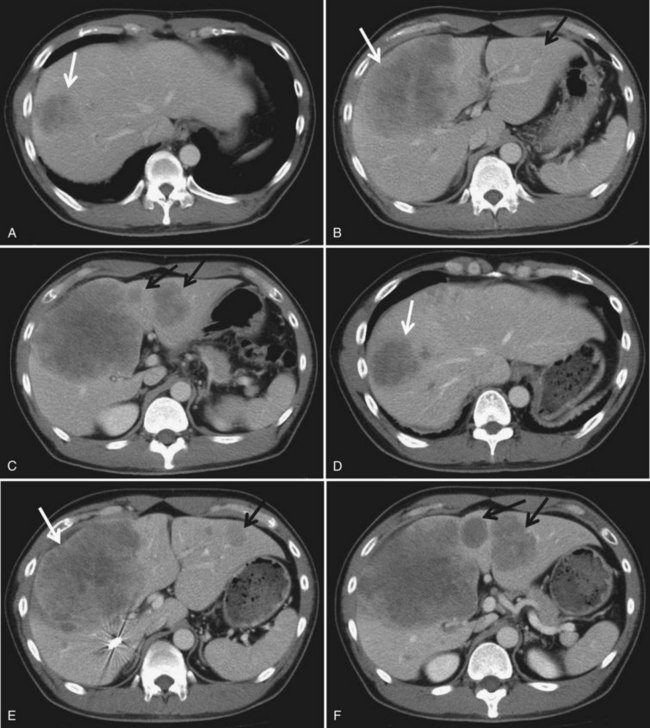
We combine selective TACE with PVE before performing major hepatic resections for patients with HCC (Aoki et al, 2004; Kubota et al, 1997). This double preparation aims at 1) using TACE to prevent tumor progression during the interval between PVE and the planned hepatectomy, in view of the fact that most HCCs are hypervascular tumors fed exclusively by arterial blood flow (Fig. 93A.5); and 2) enhancing the effect of PVE by first using TACE to embolize the possible arterioportal shunt, which is frequently found in cirrhotic livers and HCC tumors. Others also advocate this double preparation (Azoulay et al, 2000a; Ogata et al, 2006; Wakabayashi et al, 2002; Yamakado et al, 1997).
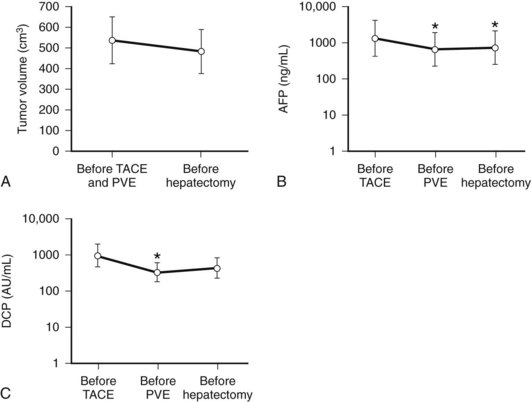
In most cases, we perform PVE when liver function test results stabilize, usually 7 to 10 days after TACE. Compared with cases with PVE alone, PVE performed after TACE resulted in marked elevations of AST and ALT values, reflecting necrotic and inflammatory reactions after embolization (see Fig. 93A.2). These values returned to their baseline by the time of the planned hepatectomy. Bilirubin level remained essentially stable after PVE (Aoki et al, 2004); however, 10% to 20% of patients did not show FLR hypertrophy after PVE, and hepatectomy was abandoned. Despite a technically successful PVE, lack of hypertrophy is most likely explained as failure to increase portal flow to the FLR because of the presence or development of collateral vessels to the systemic circulation.
Our group and others have reported similar phenomena after embolization in patients with portal hypertension (Hasegawa et al, 2004; Nagino et al, 2002). Based on these observations, Kianmanesh and associates (2003b) used it in Child-Turcotte-Pugh class A patients. PVE preoperatively tests the capacity of injured liver to regenerate, and the absence of hypertrophy after PVE is a contraindication for major hepatic resection for these patients. Wakabayashi and associates (2002) also recognized the close relationship between the result of hypertrophy and short-term outcome. Based on their results, Farges and associates (2003) claim that, contrary to the views of Azoulay and colleagues (2000a), in most patients showing adequate hypertrophy, the actual interval between PVE and resection can be less than 4 weeks. Our opinion is in line with Farges and colleagues (2003) because one of the aims of conducting PVE is to avoid the sudden increase of portal venous pressure after major hepatectomy, and because portal pressure is elevated immediately after PVE, it decreases gradually in 1 to 2 weeks.
In contrast to the observation that PVE may affect disease-free survival of patients with colorectal liver metastases with its stimulatory effect on the tumor (Kokudo et al, 2001), it was suggested that long-term results after right hepatectomy following PVE for HCC may be superior to right hepatectomy without PVE, although tumor-free survival was comparable between the two groups. Tanaka and associates (2000) speculated that preoperative PVE may preserve hepatic function and allow treatment of tumor recurrence, which in turn leads to better overall survival. In addition, Ogata and associates (2006) reported that, compared with PVE alone, the combination of TACE and PVE resulted in superior FLR hypertrophy and better long-term survival.
General Indications
Under what circumstances does PVE become necessary? In other words, to what extent can liver be safely resected without PVE? General indications for PVE are based on the size of the FLR, the underlying liver disease, and the extent or complexity of the hepatectomy. Intuitively, patients with liver pathology—such as fibrosis or cirrhosis, cholestasis, steatosis, and side effects of prior chemotherapy—require a larger FLRV than patients whose liver is normal. The same holds true for patients who require synchronous additional surgery, such as pancreatoduodenectomy or low anterior resection for rectal carcinoma; however, few data exist regarding the hepatic volume required to support life and prevent complications. In LDLT, the lower limit of residual liver volume or TLV that allows a patient to be a donor candidate is thought to be 30% (Fan et al, 2000; Kokudo et al, 2005). The FLRV/TLV ratio indicated for PVE is determined arbitrarily by each institution, and it ranges from 20% to 40% (Azoulay et al, 2000a, 2000b; Elias et al, 2002; Hemming et al, 2003; Imamura et al, 1999a; Kishi et al, 2009).
We advocate PVE in two situations: first, in patients with normal liver (ICG retention rate at 15 minutes [ICG R15] < 10%) if FLRV/TLV is less than 40% and, second, in patients with an injured liver (10% < ICG R15 < 20%), if FLRV/TLV is less than 50%. If ICG R15 exceeds 20%, major hepatectomy is contraindicated even after PVE (Kubota et al, 1997). Again, we think that actual TLV is more suitable for required volume estimation than the estimated TLV calculated from a formula correlating to body size, whereas Vauthey and colleagues advocate a standardized FLRV (percentage of FLRV to estimated TLV) of 20% or less (Abdalla et al, 2002).
Farges and associates (2003) reported that induction by PVE resulted in an increase of the FLRV/TLV ratio from 31% to 47% in patients with normal liver parenchyma (n = 13); however, these patients showed similar postoperative courses to those of patients who underwent hepatectomy without PVE (n = 14; FLRV/TLV = 30%) in terms of total bilirubin, prothrombin time, and hospital stay. Meanwhile, the authors obtained data to improve these parameters by conducting PVE in patients with chronic liver disease (n = 14 each; FLRV/TLV ratio increased by 9% in the PVE group) (Farges et al, 2003). Based on these findings, they recommended routine application of PVE for patients with diseased livers. On the other hand, this procedure was considered unnecessary for patients with normal liver, except in patients undergoing an extensive resection, a major synchronous surgical procedure, or for minor hepatectomies involving the FLR lobe (Belghiti, 2004; Farges et al, 2003).
Indications for PVE should be discussed, with special emphasis on its medical cost and associated complications. Complication rates depend heavily on technical expertise; however, if these factors are considered negligible, we would favor our criteria, discussed earlier. Although fatal complications such as liver insufficiency are rare, hepatic dysfunction as assessed by prothrombin time prolongation and bilirubin elevation, overall complication rate, and mean hospital stay correlated closely with FLRV/TLV ratio (Abdalla et al, 2002; Belghiti, 2004; Shoup et al, 2003). At the same time, in LDLT, although the clinically significant complication rate did not differ among the various types of grafts, residual liver volume fraction showed a close correlation with peak prothrombin international normalized ratio and total bilirubin levels (Kokudo et al, 2005; Salamé et al, 2002).
Abdalla EK, et al. Extended hepatectomy in patients with hepatobiliary malignancies with and without preoperative portal vein embolization. Arch Surg. 2002;137:675-681.
Abulkhir A, et al. Preoperative portal vein embolization for major hepatic resection: a meta-analysis. Ann Surg. 2008;247:49-57.
Aoki T, et al. Sequential preoperative arterial and portal venous embolizations in patients with hepatocellular carcinoma. Arch Surg. 2004;139:766-774.
Aussilhou B, et al. Preoperative liver hypertrophy induced by portal flow occlusion before major hepatic resection for colorectal metastases can be impaired by Bevacizumab. Ann Surg Oncol. 2009;16:1553-1559.
Azoulay D, et al. Percutaneous portal vein embolization increases the feasibility and safety of major liver resection for hepatocellular carcinoma in injured liver. Ann Surg. 2000;232:665-672.
Azoulay D, et al. Resection of nonresectable liver metastases from colorectal cancer after percutaneous portal vein embolization. Ann Surg. 2000;231:480-486.
Beal IK, et al. Portal vein embolisation prior to hepatic resection for colorectal liver metastases and the effect of periprocedure chemotherapy. Br J Radiol. 2006;79:473-478.
Belghiti J. Arguments for a selective approach of preoperative portal vein embolization before major hepatic resection. J Hepatobiliary Pancreat Surg. 2004;11:21-24.
Belghiti J, et al. Seven hundred forty-seven hepatectomies in the 1990s: an update to evaluate the actual risk of liver resection. J Am Coll Surg. 2000;191:38-46.
Boillot O, et al. Small-for-size partial liver graft in an adult recipient: a new transplant technique. Lancet. 2002;359:406-407.
Braasch JW, et al. Segmental obstruction of the bile duct. Surg Gynecol Obstet. 1972;134:915-920.
Chijiiwa K, et al. Effect of preoperative portal vein embolization on liver volume and hepatic energy status of the nonembolized liver lobe in humans. Eur Surg Res. 2000;32:94-99.
Christophi C, et al. Liver regeneration and tumor stimulation: a review of cytokines and angiogenic factors. J Gastrointest Surg. 2008;12:966-980.
Covey AM, et al. Combined portal vein embolization and neoadjuvant chemotherapy as a treatment strategy for resectable hepatic colorectal metastases. Ann Surg. 2008;247:451-455.
De Baere T, et al. Preoperative portal vein embolization for extension of hepatectomy indications. Hepatology. 1996;24:1386-1391.
Denys AL, et al. Intrahepatic hemodynamic changes following portal vein embolization: a prospective Doppler study. Eur Radiol. 2000;10:1703-1707.
Di Stefano DR, et al. Preoperative percutaneous portal vein embolization: evaluation of adverse events in 188 patients. Radiology. 2005;234:625-630.
Elias D, et al. During liver regeneration following right portal embolization the growth rate of liver metastases is more rapid than that of the liver parenchyma. Br J Surg. 1999;86:784-788.
Elias D, et al. Preoperative selective portal vein embolization before hepatectomy for liver metastases: long-term results and impact on survival. Surgery. 2002;131:294-299.
Fan ST, et al. Hepatectomy for hepatocellular carcinoma: toward zero hospital deaths. Ann Surg. 1999;229:322-330.
Fan ST, et al. Safety of donors in live donor liver transplantation using right lobe grafts. Arch Surg. 2000;135:336-340.
Farges O, et al. Portal vein embolization before right hepatectomy: prospective clinical trial. Ann Surg. 2003;237:208-217.
Goere D, et al. Chemotherapy does not impair hypertrophy of the left liver after right portal vein obstruction. J Gastrointest Surg. 2006;10:365-370.
Goto Y, et al. Doppler estimation of portal blood flow after percutaneous transhepatic portal vein embolization. Ann Surg. 1998;228:209-213.
Grazi GL, et al. Improved results of liver resection for hepatocellular carcinoma on cirrhosis give the procedure added value. Ann Surg. 2001;234:71-78.
Gülberg V, et al. Hepatic arterial buffer response: visualization by multiphase high-resolution 3D magnetic resonance angiography. J Hepatol. 2004;40:181.
Harada H, et al. Fate of the human liver after hemihepatic portal vein embolization: cell kinetic and morphometric study. Hepatology. 1997;26:1162-1170.
Hasegawa K, et al. Administration of iodized oil resulted in impaired liver function due to enhanced portosystemic shunting. Cardiovasc Interv Radiol. 2004;27:282-284.
Hasegawa K, et al. Prognostic impact of anatomic resection for hepatocellular carcinoma. Ann Surg. 2005;242:252-259.
Heinrich S, et al. Portal vein ligation and partial hepatectomy differently influence growth of intrahepatic metastasis and liver regeneration in mice. J Hepatol. 2006;45:35-42.
Hemming AW, et al. Preoperative portal vein embolization for extended hepatectomy. Ann Surg. 2003;237:686-691.
Hirai I, et al. Evaluation of preoperative portal vein embolization for safe hepatectomy, with special reference to assessment of nonembolized lobe function with 99mTc-GSA SPECT scintigraphy. Surgery. 2003;133:495-506.
Honjo I, et al. Ligation of a branch of the portal vein for carcinoma of the liver. Am J Surg. 1975;130:296-302.
Ijichi M, et al. Portal embolization relieves persistent jaundice after complete biliary drainage. Surgery. 2001;130:116-118.
Imamura H, et al. Preoperative portal vein embolization: an audit of 84 patients. Hepatology. 1999;29:1099-1105.
Imamura H, et al. Prognostic significance of anatomical resection and des-γ-carboxy prothrombin in patients with hepatocellular carcinoma. Br J Surg. 1999;86:1032-1038.
Imamura H, et al. One thousand fifty-six hepatectomies without mortality in 8 years. Arch Surg. 2003;138:1198-1206.
Ishizawa T, et al. Selective versus total biliary drainage for obstructive jaundice caused by a hepatobiliary malignancy. Am J Surg. 2007;193:149-154.
Jaeck D, et al. A two-stage hepatectomy procedure combined with portal vein embolization to achieve curative resection for initially unresectable multiple and bilobar colorectal liver metastases. Ann Surg. 2004;240:1037-1051.
Jarnagin WR, et al. Improvement in perioperative outcome after hepatic resection: analysis of 1,803 consecutive cases over the past decade. Ann Surg. 2002;236:397-406.
Kawasaki S, et al. Resection for multiple metastatic liver tumors after portal embolization. Surgery. 1994;115:674-677.
Kawasaki S, et al. Radical operation after portal embolization for tumor of hilar bile duct. J Am Coll Surg. 1994;178:480-486.
Kawasaki S, et al. Results of surgical resection for patients with hilar bile duct cancer: application of extended hepatectomy after biliary drainage and hemihepatic portal vein embolization. Ann Surg. 2003;238:84-92.
Kerr JF, et al. Apoptosis: a basic biological phenomenon with wide-ranging implications in tissue kinetics. Br J Cancer. 1972;26:239-257.
Kianmanesh R, et al. Right portal vein ligation: a new planned two-step all-surgical approach for complete resection of primary gastrointestinal tumors with multiple bilateral liver metastases. J Am Coll Surg. 2003;197:164-170.
Kianmanesh R, et al. Selective approach to major hepatic resection for hepatocellular carcinoma in chronic liver disease. Surg Oncol Clin N Am. 2003;12:51-63.
Kishi Y, et al. Three hundred and one consecutive extended right hepatectomies: evaluation of outcome based on systematic liver volumetry. Ann Surg. 2009;250:540-548.
Kito Y, et al. Doppler sonography of hepatic arterial blood flow velocity after percutaneous transhepatic portal vein embolization. AJR Am J Roentgenol. 2001;176:909-912.
Kokudo N, et al. Proliferative activity of intrahepatic colorectal metastases after preoperative hemihepatic portal vein embolization. Hepatology. 2001;34:267-272.
Kokudo N, et al. Tailoring the type of donor hepatectomy for adult living donor liver transplantation. Am J Transplant. 2005;5:1694-1703.
Konishi N, et al. Impact of a left-lobe graft without modulation of portal flow in adult-to-adult living donor liver transplantation. Am J Transplant. 2008;8:170-174.
Kubota K, et al. Measurement of liver volume and hepatic functional reserve as a guide to decision-making in resectional surgery for hepatic tumors. Hepatology. 1997;26:1176-1181.
Kusaka K, et al. Expression of transforming growth factor-alpha and -beta in hepatic lobes after hemihepatic portal vein embolization. Dig Dis Sci. 2006;51:1404-1412.
Kyokane T, et al. Simultaneous segmental obstruction of bile duct and portal vein markedly changes a population of biliary and hepatic cells in human liver. Langenbecks Arch Surg. 2003;388:270-275.
Lautt WW. Mechanism and role of intrinsic regulation of hepatic arterial blood flow: hepatic arterial buffer response. Am J Physiol. 1985;249:G549-G556.
Lee KC, et al. Extension of surgical indications for hepatocellular carcinoma by portal vein embolization. World J Surg. 1993;17:109-115.
Makuuchi M, et al. Preoperative transcatheter embolization of the portal venous branch for patients receiving extended lobectomy due to the bile duct carcinoma. J Jpn Surg Assoc. 1984;45:1558-1564.
Makuuchi M, et al. Ultrasonically guided subsegmentectomy. Surg Gynecol Obstet. 1985;161:346-350.
Makuuchi M, et al. Preoperative portal embolization to increase safety of major hepatectomy for hilar bile duct carcinoma: a preliminary report. Surgery. 1990;107:521-527.
Makuuchi M, Kosuge T, Lygidakis NJ. New possibilities for major liver surgery in patients with Klatskin tumors or primary hepatocellular carcinoma—an old problem revisited. Hepatogastroenterology. 1991;38:329-336.
Man K, et al. Graft injury in relation to graft size in right lobe live donor liver transplantation. Ann Surg. 2003;237:256-264.
McMaster PD, Rous P. The biliary obstruction required to produce jaundice. J Exp Med. 1921;33:731-750.
Nagino M, et al. Changes in hepatic lobe volume in biliary tract cancer patients after right portal vein embolization. Hepatology. 1995;21:434-439.
Nagino M, et al. Immediate increase in arterial blood flow in embolized hepatic segments after portal vein embolization: CT demonstration. AJR Am J Roentgenol. 1998;171:1037-1039.
Nagino M, et al. Liver regeneration after major hepatectomy for biliary cancer. Br J Surg. 2001;88:1084-1091.
Nagino M, et al. Acute hypersplenism with splenomegaly after portal vein embolization. Surgery. 2002;131:695.
Neuhaus P, et al. Extended resection for hilar cholangiocarcinoma. Ann Surg. 1999;230:808-819.
Nishiguchi S, et al. Course before and after percutaneous transhepatic portal vein embolization of a patient with cholangiocarcinoma monitored by scintigraphy with Tc-99m galactosyl human serum albumin. Ann Nucl Med. 2000;14:231-234.
Ogata S, et al. Sequential arterial and portal vein embolizations before right hepatectomy in patients with cirrhosis and hepatocellular carcinoma. Br J Surg. 2006;93:1091-1098.
Panis Y, et al. Progressive necrosis after hepatectomy and the pathophysiology of liver failure after massive resection. Surgery. 1997;121:142-149.
Regimbeau JM, et al. Extent of liver resection influences the outcome in patients with cirrhosis and small hepatocellular carcinoma. Surgery. 2002;131:311-317.
Rocheleau B, et al. Hepatic artery buffer response following left portal vein ligation: its role in liver tissue homeostasis. Am J Physiol. 1999;277:G1000-G1007.
Rous P, Larimore LD. Relation of the portal blood to liver maintenance: a demonstration of liver atrophy conditional on compensation. J Exp Med. 1920;31:609-632.
Salamé E, et al. Analysis of donor risk in living-donor hepatectomy: the impact of resection type on clinical outcome. Am J Transplant. 2002;2:780-788.
Schalm L, et al. Atrophy of the liver after occlusion of the bile ducts or portal vein and compensatory hypertrophy of the unoccluded portion and its clinical importance. Gastroenterology. 1956;31:131-155.
Seo DD, et al. Preoperative portal vein embolization and surgical resection in patients with hepatocellular carcinoma and small future liver remnant volume: comparison with transarterial chemoembolization. Ann Surg Oncol. 2007;14:3501-3509.
Seyama Y, et al. Long-term outcome of extended hemihepatectomy for bile duct cancer with no mortality and high survival rate. Ann Surg. 2003;238:73-83.
Shimada R, et al. Changes in blood flow and function of the liver after right portal vein embolization. Arch Surg. 2002;137:1384-1388.
Shimamura T, et al. Efficacy and safety of preoperative percutaneous transhepatic portal embolization with absolute ethanol: a clinical study. Surgery. 1997;121:135-141.
Shirabe K, et al. Postoperative liver failure after major hepatic resection for hepatocellular carcinoma in the modern era with special reference to remnant liver volume. J Am Coll Surg. 1999;188:304-309.
Shoup M, et al. Volumetric analysis predicts hepatic dysfunction in patients undergoing major liver resection. J Gastrointest Surg. 2003;7:325-330.
Steiner PE, Martinez Batiz J. Effects on the rat liver of bile duct, portal vein and hepatic artery ligations. Am J Pathol. 1962;39:257-289.
Stewart HL, et al. Changes in the liver of the cat following ligation of simple hepatic ducts. Arch Pathol. 1937;23:641-652.
Takada Y, et al. End-to-side portocaval shunting for a small-for-size graft in living donor liver transplantation. Liver Transpl. 2004;10:807-810.
Takayama T, et al. Preoperative portal vein embolization. Ann Ital Chir. 1997;68:745-750.
Takayasu K, et al. Hepatic lobar atrophy following obstruction of the ipsilateral portal vein from cholangiocarcinoma. Radiology. 1986;160:389-393.
Tanaka H, et al. Preoperative portal vein embolization improves prognosis after right hepatectomy for hepatocellular carcinoma in patients with impaired hepatic function. Br J Surg. 2000;87:879-882.
Troisi R, et al. Modulation of portal graft inflow: a necessity in adult living-donor liver transplantation? Ann Surg. 2003;237:429-436.
Troisi R, et al. Effects of hemi-portocaval shunts for inflow modulation on the outcome of small-for-size grafts in living donor liver transplantation. Am J Transplant. 2005;5:1397-1404.
Uesaka K, et al. Changes in hepatic lobar function after right portal vein embolization: an appraisal by biliary indocyanine green excretion. Ann Surg. 1996;223:77-83.
Urata K, et al. Calculation of child and adult standard liver volume for liver transplantation. Hepatology. 1995;21:1317-1321.
Vauthey JN, et al. Body surface area and body weight predict total liver volume in Western adults. Liver Transpl. 2002;8:233-240.
Wakabayashi H, et al. Changes in arterial and portal perfusion in embolized and nonembolized hepatic lobes after portal vein embolization evaluated by helical computed tomography. Surg Today. 2001;31:991-995.
Wakabayashi H, et al. Application of preoperative portal vein embolization before major hepatic resection in patients with normal or abnormal liver parenchyma. Surgery. 2002;131:26-33.
Weber SM, et al. Survival after resection of multiple hepatic colorectal metastases. Ann Surg Oncol. 2000;7:643-650.
Yamakado K, et al. Regeneration of the un-embolized liver parenchyma following portal vein embolization. J Hepatol. 1997;27:871-880.
Yamanaka N, et al. Dynamics of normal and injured human liver regeneration after hepatectomy as assessed on the basis of computed tomography and liver function. Hepatology. 1993;18:79-85.
Zorzi D, et al. Chemotherapy with bevacizumab does not affect liver regeneration after portal vein embolization in the treatment of colorectal liver metastases. Ann Surg Oncol. 2008;15:2765-2772.
[/level-membership-for-surgery-category][not-level-membership-for-surgery-category]
Chapter 93A Preoperative portal vein embolization
Rationale, indications, and results
Overview
Although recent advances in surgical techniques and perioperative care have significantly improved both short- and long-term outcomes after hepatic resection (Belghiti et al, 2000; Fan et al, 1999; Grazi et al, 2001; Imamura et al, 2003; Jarnagin et al, 2002), postoperative liver volume insufficiency is still a major concern after an extensive liver resection. Both the small size of the remnant liver parenchyma after an extensive liver resection and sinusoidal injury caused by an abrupt increase in portal venous flow/pressure may be implicated in an increased rate of postoperative morbidity associated with cholestasis, ascites, and impaired synthetic function (Panis et al, 1997). These conditions all may lead to a protracted recovery and extended hospital stay and may eventually result in fatal liver failure, although rarely. This concern is even more relevant in patients with obstructive jaundice or underlying liver disease; that is, in those who not only have liver fibrosis or cirrhosis but also liver injury induced by chemotherapy, originally in patients with normal liver (see Chapters 50B, 65, 87, and 90F).
In 1982, we first carried out a preoperative portal vein embolization (PVE) for a patient with hilar bile duct carcinoma with the intention of increasing the operative safety under these circumstances (Makuuchi et al, 1984, 1990). The approach was based on the concept of the hepatic atrophy-hypertrophy complex (see Chapter 5). We attempted to initiate hypertrophy of the future liver remnant (FLR) before resection to induce atrophy in the embolized part of the liver to be resected with compensatory hypertrophy of the nonembolized FLR. Satisfactory initial outcomes led us to extend the indications for PVE to patients with metastatic liver tumors of colorectal origin (Kawasaki et al, 1994a) and for patients undergoing hepatopancreatoduodenectomy (Kawasaki et al, 1994b). Because of its technical simplicity and the consistent attainment of liver hypertrophy after the procedure, PVE has become a standard preoperative intervention worldwide, and its indications have been expanded to patients with hepatocellular carcinoma (HCC) (Aoki et al, 2004; Azoulay et al, 2000a; Lee et al, 1993; Ogata et al, 2006; Tanaka et al, 2000; Yamakado et al, 1997).
Historic Background
The concept of the hepatic atrophy-hypertrophy complex dates back to 1920, when Rous and Larimore (1920) showed that ligation of a major branch of rabbit portal vein resulted in atrophy of the ipsilateral hepatic lobe and hypertrophy of the contralateral lobe. The same phenomenon was observed in experiments involving long-term bile duct obstruction (McMaster & Rous, 1921); however, in contrast to the predictable response to portal venous occlusion, the magnitude of response to bile duct obstruction differs substantially among species (Braasch et al, 1972; Schalm et al, 1956; Steiner & Martinez Batiz, 1962; Stewart et al, 1937).
In 1975, Honjo and colleagues ligated the ipsilateral portal venous branch in patients with HCC in an effort to suppress tumor growth. Although this approach did not succeed in preventing tumor growth, it did produce marked atrophy of the occluded hemiliver. Likewise, our patients experienced an uneventful postoperative clinical course after extensive hepatectomy for hilar bile duct carcinoma involving a branch of the portal vein, causing hemiliver atrophy with corresponding hypertrophy of the contralateral hemiliver (Takayasu et al, 1986). These clinical observations led one of us (M.M.) to attempt PVE application as an adjunct procedure for major hepatectomy.
Hemodynamic Consequences
Total portal venous flow volume was thought to remain unchanged before and after PVE, because liver does not have an intrinsic ability to modulate portal flow, which is a function of extrahepatic (i.e., splanchnic and systemic) factors. This principle was confirmed in a study using a rat model of hemihepatic portal vein ligation and radioactive microsphere technique (Rocheleau et al, 1999) and in a human PVE study using Doppler ultrasound (Denys et al, 2000), proving that the same volume of portal venous flow as that prior to PVE would enter nonembolized liver segments after PVE. Portal pressure in the nonembolized hemiliver is elevated immediately after PVE by 4.9 ± 2.7 cm H2O (Takayama et al, 1997). A similar increment was observed in patients with cirrhosis, who had higher baseline portal pressure (Aoki et al, 2004). Information on chronologic alterations in portal pressure after PVE is unavailable, but the elevation is believed to be transient, with pressure gradually returning to the baseline value in 2 to 3 weeks, as indicated by the portal flow velocity (cm/sec) changes measured by transcutaneous Doppler ultrasound (Goto et al, 1998).
Our concern that an abrupt increase in portal venous pressure after major hepatectomy may result in liver damage is one of the two reasons why we had attempted PVE. This concern seems to have been given little attention compared with a concern that a diminished liver may not meet metabolic demands after resection. We believe that incremental increases in portal venous flow/pressure observed after PVE may increase tolerance in patients to high portal venous flow/pressure after extensive hepatic resection, resulting in an attenuation of liver damage after the subsequent resection (Makuuchi et al, 1991). Other recent studies on living donor liver transplantation (LDLT) have focused on portal pressure and small-for-size syndrome, and high portal pressure immediately after LDLT was reported to be associated with daily volume of ascites (Konishi et al, 2008). Attempts were made to attenuate this problem by splenic arterial ligation or portacaval shunt by some groups (Boillot et al, 2002; Man et al, 2003; Takada et al, 2004; Troisi et al, 2003, 2005).
In contrast to portal venous flow, liver is known to have an intrinsic regulatory mechanism to compensate even partially for alteration in portal flow, which is referred to as hepatic arterial buffer response (Lautt, 1985). In the case of PVE with hemihepatic portal vein occlusion or thrombosis of a portal branch, hepatic arterial buffer response is thought to still operate in embolized liver based on studies using dynamic computed tomography (CT) (Fig. 93A.1; Nagino et al, 1998; Wakabayashi et al, 2001), Doppler ultrasound (Denys et al, 2000; Kito et al, 2001), and three-dimensional magnetic resonance angiography (Gülberg et al, 2004), and their findings are in line with the report of a study using a rat model (Rocheleau et al, 1999); however, controversy surrounds the maintenance of hepatic arterial buffer response in nonembolized hemiliver (Denys et al, 2000; Kito et al, 2001; Rocheleau et al, 1999; Wakabayashi et al, 2001). Total liver blood flow, as estimated by a pharmacologic method, remained unchanged throughout the post-PVE period in our previous study (Shimada et al, 2002).
Because hepatic arterial buffer response is a partial compensation, hyperperfusion in a nonembolized hemiliver occurs after PVE, in contrast to hypoperfusion in an embolized hemiliver as expressed per gram of liver tissue. Corresponding hepatocyte regeneration in the nonembolized hemiliver occurs immediately after PVE proportional to the magnitude of the stimulus; however, little is known about when and how the atrophy-hypertrophy complex is terminated. Rocheleau and colleagues (1999) reported that, in a rat model of hemihepatic portal vein ligation, the hepatic atrophy-hypertrophy complex process (i.e., liver weight changes in the ligated and nonligated lobes) continues until total lobar flow per gram of liver tissue is restored. In Western series, planned hepatectomy after PVE had been scheduled when hypertrophy of the nonembolized liver segments seemed to reach their plateau, and full hypertrophy of the nonembolized segments was obtained 7 to 9 weeks after PVE (Azoulay et al, 2000a).
Clinical Course after Portal Vein CHEMOEmbolization
In contrast to transcatheter arterial chemoembolization (TACE), signs and symptoms of postembolization syndrome—such as pain, nausea, and vomiting—are minimal. Most patients experience mild fever after PVE, which subsides within 2 to 3 days. Changes in liver function, as reflected by an increased total bilirubin value and prolonged prothrombin time, are mild and transient, returning to their baseline values 2 to 3 days after PVE. Serum aspartate aminotransferase (AST) and alanine aminotransferase (ALT) values are found to be stable in half of the patients, and in those remaining, values are mildly elevated (1.5 to 3 times the pre-PVE values) on day 1, returning to baseline values in 4 to 7 days after PVE, regardless of the embolization materials used. These findings suggest that inflammatory and necrotic reactions after PVE are minimal, if they are present at all (Imamura et al, 1999a). The exceptions are when absolute ethanol is used for embolization (Shimamura et al, 1997), and when PVE is carried out after TACE (Aoki et al, 2004; Ogata et al, 2006). In both situations, PVE is followed by marked AST and ALT elevations, although both returned to baseline values by the time of scheduled hepatectomy (Fig. 93A.2).
Some have reported on adverse events (complications) or on morbidity rates associated with PVE (Table 93A.1). A multicenter European study of 188 patients who underwent contralateral PVE reported 24 adverse events (12.8%) (Di Stefano et al, 2005). Most adverse events were associated with the PVE technique, including complete portal thrombosis (n = 1), migration of embolic material in the main left portal vein feeding the FLR (n = 2), hemoperitoneum (n = 1), hemobilia (n = 1), rupture of a metastasis into the gallbladder (n = 1), and transient liver failure (n = 6). A recent meta-analysis documented overall morbidity rate for PVE to be 2.2% (Abulkhir et al, 2008). A summary of 37 publications involving 1088 patients showed a total of 497 minor complications and 11 major complications (see Table 93A.1).
Table 93A.1 Complications Following Portal Vein Embolization
| Details | |
|---|---|
| Complication | Number |
| Minor | |
| Abdominal discomfort or pain | 209 |
| Fever | 250 |
| Nausea or vomiting | 26 |
| Ileus | 9 |
| Overflow of embolization materials | 2 |
| Coil displacement | 1 |
| Major | |
| Liver abscess | 3 |
| Cholangitis | 2 |
| Main or left portal vein thrombosis | 2 |
| Subcapsular hematoma | 2 |
| Portal hypertension | 1 |
| Septic necrosis from hepatic artery injury | 1 |
From Abulkhir A, et al, 2008: Preoperative portal vein embolization for major liver resection: a meta-analysis. Ann Surg 247:49-57.
Volumetric Consequences of Portal Vein Embolization
CT scan with contrast enhancement is the most commonly used method for calculating total liver volume (TLV) and FLR volume (FLRV). The nontumorous FLRV/(TLV – Tumor volume), or FLRV/TLV ratio, is a widely used parameter to determine whether PVE is necessary before hepatic resection and to assess the degree of FLR hypertrophy. Vauthey and associates (2002) proposed the use of standard liver volume (SLV), a concept first applied to clinical situations by us in 1995 (Urata et al, 1995). SLV is an alternative method for estimating TLV from a linear regression formula, correlating body surface area or body weight and TLV in healthy subjects (Urata et al, 1995; Vauthey et al, 2002). This formula is based on a concept that optimal liver/body mass ratio in healthy subjects is constant. We first referred to this optimal liver volume as SLV and proposed the application of SLV for recipients of LDLT and also for patients with end-stage liver disease, whose actual liver volumes are either extremely large or small in terms of ideal liver volume to be grafted, such as in cases of primary biliary cirrhosis or fulminant hepatic failure (Urata et al, 1995).
Vauthey and associates (2002) emphasized the importance of SLV as determining indications for PVE, because it may be applied to patients with pathologic liver or obstructive jaundice with dilated bile ducts and may even be calculated in patients with multiple liver metastases. Nevertheless, we adhere to the use of actual TLV for several reasons. First, SLV is a virtual volume estimated by using a formula, and different formulas are used among investigators; r2 in the equation of Vauthey and associates (2002) is 0.49, indicating that their formula explains only half of the interindividual variations for TLV even in healthy subjects. Second, patients with extremely large or small livers in terms of SLV because of underlying liver diseases may not be candidates for liver resection even after PVE. Finally, up-to-date devices such as multislice helical CT with contrast administration allow accurate volumetric measurement by subtracting small tumor volumes and vasculobiliary structures, even to Couinaud’s segment level.
PVE leads to an increment of segmental volume in nonembolized hemiliver and a decrement of segmental volume in embolized hemiliver, homogeneously maintaining a constant TLV (in most studies, TLV remained unchanged after PVE). In case of right hemiliver PVE, regeneration rate of the noncirrhotic liver was 12 cm2/day 2 weeks after PVE (Lee et al, 1993; Nagino et al, 1995), decreasing to 11 cm2/day at 4 weeks (Nagino et al, 1995) and then 6 cm2/day at 32 days (De Baere et al, 1996). In cirrhotic patients, regeneration is reportedly slower, at a rate of 9 cm2/day at 2 weeks (De Baere et al, 1996; Lee et al, 1993). In noncirrhotic and cirrhotic livers, regeneration processes are thought to be blunted by approximately 50% compared with that after hepatectomy (Yamanaka et al, 1993). Results of hypertrophy of nonembolized liver segments after PVE are summarized in Table 93A.2. In most series, hypertrophy of nonembolized liver segments in normal liver was 10% to 15%, expressed in volumetric ratio of nonembolized liver segments to TLV. The figure was smaller (5% to 10%) in diseased liver.
Various factors have been reported to affect the regeneration rate after PVE. Regeneration rate depends on embolized hemiliver volume (Imamura et al, 1999a; Yamakado et al, 1997). In other words, the greater the FLRV before PVE, the smaller the volume increase after PVE. Materials used for embolization affect the results in magnitudes of hypertrophy. Hypertrophy seemed to be modest when biologic materials such as Gelfoam and fibrin glue were used, most probably as a result of the progressive recanalization they induced. Absolute ethanol was reported to achieve the highest degree of regeneration but at the expense of marked increases in AST and ALT levels secondary to liver necrosis (Shimamura et al, 1997). Among the disorders related to background patient characteristics, diabetes, obstructive jaundice, active hepatitis, and cirrhosis have been reported to hamper the regeneration process (Imamura et al, 1999a; Nagino et al, 1995; Tanaka et al, 2000).
Histologic Consequences of Portal Vein Embolization
Human liver tissue obtained 3 weeks after PVE showed almost normal microscopic structures in the embolized and the nonembolized lobes. In the embolized lobe, dilation of sinusoids with decreased hepatocyte density and hepatocyte apoptosis were observed, especially in the pericentral area (Harada et al, 1997). Nevertheless, no signs of necrosis or inflammation were apparent, except when the embolizing material used was absolute ethanol, with tissue showing clear evidence of necrosis (Shimamura et al, 1997), or cyanoacrylate, which causes peribiliary fibrosis (De Baere et al, 1996
[/not-level-membership-for-surgery-category]
