[level-membership-for-pulmolory-and-respiratory-category]
Positive End-Expiratory Pressure
A Positive end-expiratory pressure (PEEP): The establishment and maintenance of a preset airway pressure greater than ambient at end-exhalation.
B Continuous positive airway pressure (CPAP): The application of PEEP to the spontaneously breathing patient. Inspiratory and expiratory airway pressures are supraatmospheric, but no inspiratory assistance is provided.
C Continuous positive pressure ventilation (CPPV): The application of PEEP to a patient receiving positive pressure ventilation.
II Physiologic Effects of PEEP
A Effects on intrapulmonary pressures
1. When only the end-expiratory pressure is maintained above atmospheric in a spontaneously breathing patient, the shape of the intrapulmonary pressure curve is not altered; only the baseline pressure from which the patient ventilates changes. Therefore, the dynamics of air movement are not directly affected.
2. As illustrated in Chapter 5, intrapulmonary pressure decreases approximately 3 cm H2O during inspiration and increases approximately 3 cm H2O during expiration from the set CPAP level.
3. During ventilatory support, regardless of mode, PEEP simply increases the baseline about which mechanical ventilation is initiated.
B Effects on intrapleural (intrathoracic) pressures
1. PEEP increases intrapleural pressures.
2. The extent of the increase is determined by
b. The stiffness of the individual’s lung
(1) The greater the pulmonary compliance, the greater the transmission of PEEP to the intrapleural space and the greater the increase in intrapleural pressure.
(2) In patients with normal lungs and chest wall approximately 50% of the PEEP applied is transmitted to the intrathoracic space, increasing the intrapleural pressure.
(3) In patients with acute respiratory distress syndrome (ARDS; stiff lungs) only approximately 25% of the applied PEEP is transmitted to the intrathoracic space, increasing intrapleural pressure.
(4) Patients with localized pulmonary disease (e.g., pneumonia, atelectasis) demonstrate an increase in overall intrapleural pressure similar to patients with normal pulmonary compliance; however, transmission of pressure may be reduced in the area of concern.
(5) The effects of PEEP on intrapleural pressure are most marked in patients with chronic obstructive pulmonary disease (COPD) because of their increased pulmonary compliance.
c. Changes in thoracic compliance
(1) If thoracic compliance is decreased more pressure than normal will be transmitted to the intrapleural space because overall expansion of the lung-thorax system is inhibited. It is in this setting that hemodynamic compromise is most likely.
(2) An increase in thoracic compliance will allow the system to expand and usually results in less of an increase in intrapleural pressure when compared with normal. Hemodynamic compromise is minimal in this setting.
C Effect on functional residual capacity (FRC) (Figure 40-1)
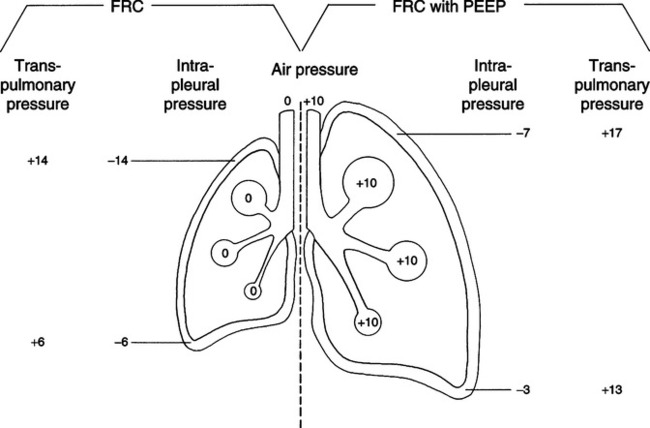
1. Regardless of the condition of the lung at the time of application, PEEP increases FRC.
2. FRC is increased by two primary mechanisms.
a. Because the lungs are elastic any increase in end-expiratory pressure increases overall lung volume. The diameter of conducting airways can increase 1 to 2 mm as PEEP is applied.
b. In patients with a decreased FRC as a result of alveolar collapse caused by surfactant instability, PEEP maintains alveoli inflated after they are recruited by the peak airway pressure.
(1) This is accomplished by PEEP maintaining a backpressure exceeding the force of surface tension and lung elastance, which tend to collapse alveoli.
(2) The actual reexpansion of alveoli is accomplished by the force of normal inspiration or the application of positive inspiratory airway pressure. PEEP simply maintains the alveoli open once they are reexpanded.
D Effect on pulmonary compliance
1. Because PEEP increases FRC, it alters pulmonary compliance.
2. The compliance curve of the normal total respiratory system is depicted in Figure 40-2. Note that the curve is only linear above the FRC level and again becomes alinear at some pressure and volume well beyond FRC.
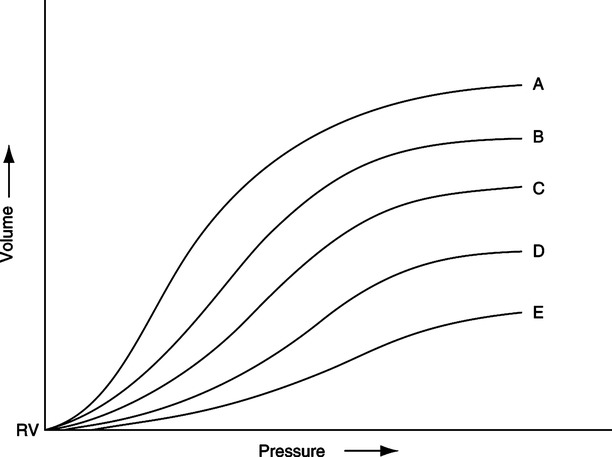
3. In the normal lung the increased FRC caused by excessive PEEP levels may move alveoli from the steep portion to the flat portion of the compliance curve, thus decreasing compliance.
4. In patients with acute lung injury (ALI) or ARDS, the application of PEEP increases compliance (see Figure 40-2).
a. As ARDS develops the compliance curve shifts to the right and downward.
b. As PEEP is applied the compliance curve shifts upward and to the left.
c. With appropriate application of PEEP compliance in ALI/ARDS normally improves.
5. The monitoring of effective static compliance (see Chapter 41) can be used to help to determine the “optimal” or most appropriate PEEP level.
a. The best compliance is thought to coincide with the most appropriate PEEP level; however, changes in tidal volume (Vt) will change the PEEP level considered appropriate. Vt should always be constant during PEEP titration.
b. The major problem associated with the use of compliance as a means to determine optimal PEEP is the difficulty in determining compliance in patients ventilated in anything but the control mode. With other modes a reliable measurement of effective static compliance is often difficult because of active movement of the chest wall, preventing correct determination of the static end-inspiratory plateau pressure.
1. Because PEEP increases FRC by distending alveoli, deadspace is usually increased in
2. Because of stabilization of recruited alveoli, appropriate PEEP levels usually decrease deadspace in patients with ALI/ARDS. Some have proposed monitoring deadspace or change in CO2 at a constant minute ventilation as an indication of appropriate PEEP level.
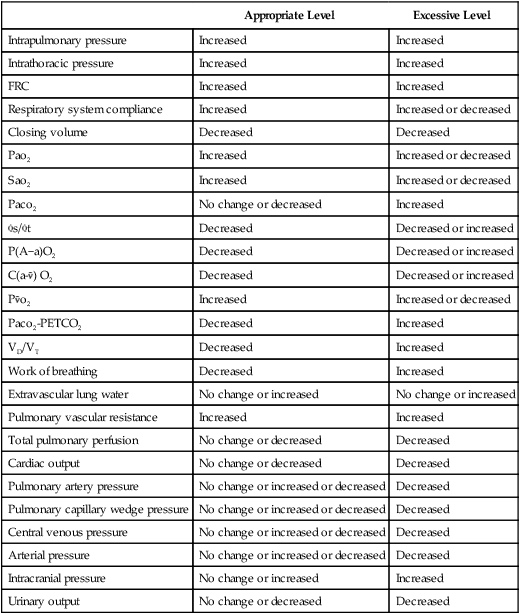
F Effect of PEEP on the cardiovascular system (Table 40-1)
TABLE 40-1
Potential Physiologic Effects of Appropriately and Excessively Applied PEEP
| Appropriate Level | Excessive Level | |
| Intrapulmonary pressure | Increased | Increased |
| Intrathoracic pressure | Increased | Increased |
| FRC | Increased | Increased |
| Respiratory system compliance | Increased | Increased or decreased |
| Closing volume | Decreased | Decreased |
| Pao2 | Increased | Increased or decreased |
| Sao2 | Increased | Increased or decreased |
| Paco2 | No change or decreased | Increased |
 s/ s/ t t |
Decreased | Decreased or increased |
| P(A−a)O2 | Decreased | Decreased or increased |
C(a- ) O2 ) O2 |
Decreased | Decreased or increased |
P o2 o2 |
Increased | Increased or decreased |
| Paco2-PETCO2 | Decreased | Increased |
| VD/VT | Decreased | Increased |
| Work of breathing | Decreased | Increased |
| Extravascular lung water | No change or increased | No change or increased |
| Pulmonary vascular resistance | Increased | Increased |
| Total pulmonary perfusion | No change or decreased | Decreased |
| Cardiac output | No change or decreased | Decreased |
| Pulmonary artery pressure | No change or increased or decreased | Decreased |
| Pulmonary capillary wedge pressure | No change or increased or decreased | Decreased |
| Central venous pressure | No change or increased or decreased | Decreased |
| Arterial pressure | No change or increased or decreased | Decreased |
| Intracranial pressure | No change or increased | Increased |
| Urinary output | No change or decreased | Decreased |
 S/
S/ T, shunt fraction; P(A − a)O2, alveolar-arterial O2 pressure difference; C(a-
 ) O2, arterial-mixed venous O2 content difference; P
 O2, mixed venous O2 pressure; PETCO2, end-tidal CO2 pressure; VD/VT, dead space/tidal volume ratio.
1. The primary effect of PEEP on the cardiovascular system is a reduction in cardiac output (CO) as a result of increased impedance to venous return by an increase in intrathoracic pressure.
2. This increase in pressure decreases cardiac transmural pressure, potentially decreasing the end-diastolic volume and stroke volume of both ventricles.
3. Low-level PEEP reduces right ventricular end-diastolic volume, but right ventricular ejection fraction normally remains constant, provided no previous right ventricular dysfunction exists.
4. Higher levels of PEEP markedly increase right ventricular afterload, increasing end-diastolic volume and decreasing ejection fraction.
5. Increased right ventricular end-diastolic volume with high levels of PEEP causes right ventricular distention and a leftward shift of the interventricular septa.
a. This reduces left ventricular distensibility.
b. This results in a decrease in left ventricular end-diastolic volume and stroke volume.
6. Actual changes in pulmonary hemodynamics after the application of PEEP depend on many factors.
7. Provided that pulmonary blood flow is not markedly reduced, PEEP generally results in
a. An increase in right ventricular preload (central venous pressure [CVP])
b. An increase in right ventricular afterload (pulmonary artery pressure [PAP])
c. An increase in left ventricular preload (pulmonary capillary wedge pressure [PWP])
d. Generally the higher the PEEP, the less likely the wedge pressure will reflect left atrial pressure.
e. Because CO is usually decreased with PEEP, left ventricular afterload may also decrease as PEEP is applied.
8. If pulmonary blood flow is markedly reduced by the application of PEEP, the preload and afterload of left and right ventricles decrease. As a result it is difficult to predict the precise effect that PEEP will have on hemodynamics.
9. Any of the hemodynamic pressures measured may increase, decrease, or stay the same, depending on the maintenance of pulmonary blood flow.
10. When the effect of PEEP on CO is evaluated, it is important to place the decreased CO into proper perspective. The following are two examples of the effect of PEEP on CO. In example A the patient is young and has excellent cardiovascular reserves, whereas in example B the patient is older and has limited cardiovascular reserves.
| Pao2 | 48 mm Hg | Pulse | 130 beats/min |
| pH | 7.53 | Blood pressure (BP) | 160/100 mm Hg |
| Paco2 | 27 mm Hg | CO | 10.5 L/min |
| HCO3− | 22 mEq/L | CI | 5.7 L/min/m2 |
| Spontaneous respiration rate (RR) | 35 breaths/min | FIO2 | 0.8 |
| VT | 350 ml | No mechanical ventilatory support | |
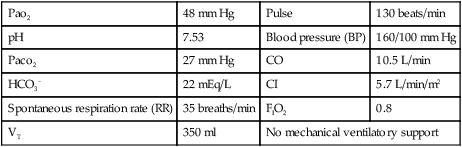
With the application of PEEP the following data are obtained.
| Pao2 | 75 mm Hg | Pulse | 85 beats/min |
| pH | 7.43 | BP | 130/80 mm Hg |
| Paco2 | 38 mm Hg | CO | 6.6 L/min |
| HCO3− | 24 mEq/L | CI | 3.7 L/min/m2 |
| Spontaneous RR | 20 breaths/min | FIO2 | 0.5 |
| VT | 350 ml | CPAP at 10 cm H2O by mask | |
| Pao2 | 48 mm Hg | Pulse | 130 beats/min |
| pH | 7.48 | BP | 140/90 mm Hg |
| Paco2 | 32 mm Hg | CO | 5.5 L/min |
| HCO3− | 23 mEq/L | CI | 3.6 L/min/m2 |
| Spontaneous RR | 35 breaths/min | FIO2 | 0.6 |
| VT | 300 ml | No mechanical ventilation support | |
With the application of PEEP the following data are obtained.
| Pao2 | 68 mm Hg | Pulse | 150 beats/min |
| pH | 7.47 | BP | 90/60 mm Hg |
| Paco2 | 33 mm Hg | CO | 3.5 L/min |
| HCO3− | 23 mEq/L | CI | 2.3 L/min/m2 |
| Spontaneous RR | 28 breaths/min | FIO2 | 0.6 |
| VT | 300 ml | CPAP at 10 cm H2O by mask | |
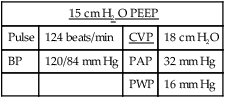
11. The following example is designed to illustrate the effect of PEEP on hemodynamic values.
| No PEEP | |||
| Pulse | 160 beats/min | CVP | 12 cm H2O |
| BP | 150/100 mm Hg | PAP | 26 mm Hg |
| PWP | 10 mm Hg | ||
| 5 cm H2O PEEP | |||
| Pulse | 158 beats/min | CVP | 13 cm H2O |
| BP | 148/92 mm Hg | PAP | 27 mm Hg |
| PWP | 11 mm Hg | ||
| 10 cm H2O PEEP | |||
| Pulse | 140 beats/min | CVP | 15 cm H2O |
| BP | 142/96 mm Hg | PAP | 29 mm Hg |
| PWP | 13 mm Hg | ||
| 12 cm H2O PEEP | |||
| Pulse | 126 beats/min | CVP | 16 cm H2O |
| BP | 130/84 mm Hg | PAP | 30 mm Hg |
| PWP | 14 mm Hg | ||
| 15 cm H2O PEEP | |||
| Pulse | 154 beats/min | CVP | 6 cm H2O |
| BP | 90/60 mm Hg | PAP | 22 mm Hg |
| PWP | 5 mm Hg | ||
| 15 cm H2 O PEEP | |||
| Pulse | 124 beats/min | CVP | 18 cm H2O |
| BP | 120/84 mm Hg | PAP | 32 mm Hg |
| PWP | 16 mm Hg | ||
G Effects of PEEP on lung water (Figure 40-3)
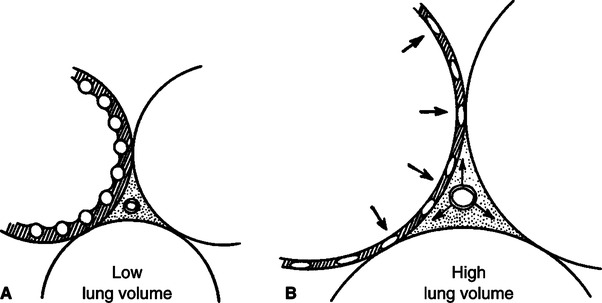
1. PEEP does not decrease overall pulmonary vascular volume.
2. Normally PEEP causes a redistribution of lung water and may increase overall lung water.
3. Fluid generally moves from the intraalveolar to the perivascular interstitial space; extraalveolar and corner vessels are expanded with PEEP.
4. This movement assists in improving oxygenation, increasing compliance, and decreasing shunting.
5. PEEP may result in greater transudation of fluid from the pulmonary vasculature into the peribronchial and hilar areas of the lung.
H Effect of PEEP therapy on Pao2
1. Because PEEP therapy causes a minor increase in the partial pressure of oxygen in the lung, a small increase in Pao2 may be noted even in the healthy lung.
2. In the patient with ALI/ARDS, Pao2 levels also demonstrate only a small increase as the PEEP level is increased and will not markedly increase until PEEP sufficient to avoid derecruitment of recruited alveoli has been set. When appropriate PEEP is set, Pao2 values may increase markedly. The following examples illustrate how Pao2 may change as PEEP is applied.
| PEEP (cm H2O) | Pao2 (mm Hg) |
| 0 | 45 |
| 5 | 48 |
| 10 | 53 |
| 12 | 56 |
| 15 | 110 |
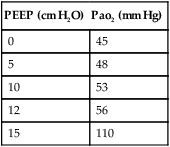
3. If higher levels of PEEP are applied, Pao2 values may continue to increase slightly, remain the same, or decrease, depending on the effect of PEEP on CO.
a. A continual increase in PEEP will eventually affect CO. However, the blood that is capable of perfusing the lung will still be oxygenated, and its oxygenation state may continue to improve slightly as CO decreases.
b. When appropriateness of PEEP is monitored, Pao2 must be evaluated; however, Pao2 provides no indication of the adequacy of cardiovascular function or of systemic oxygen delivery.
I Effects on intrapulmonary shunt
1. Increasing PEEP levels result in a decrease in intrapulmonary shunt.
2. As recruited alveoli are maintained open with PEEP, ventilation/perfusion matching improves, and shunting decreases.
3. As with Pao2 intrapulmonary shunt may continue to decrease even when CO is significantly decreased.
a. This occurs because any blood that is presented to the lung may be better oxygenated.
b. When the appropriateness of PEEP is monitored, intrapulmonary shunt should be evaluated; however, the intrapulmonary shunt provides no indication of adequacy of cardiovascular function or systemic oxygen delivery.
 o2)
o2)1. P o2 is a variable affected by
2. A decreased CO, a decrease in oxygen content, a decrease in tissue perfusion, or an increase in metabolic rate can cause a decrease in P o2.
o2.
3. In cardiopulmonary-stressed patients with ALI/ARDS, the P o2 is normally decreased.
a. The extent of this decrease depends most on the cardiovascular reserves of the patient.
b. For patients with good cardiovascular reserves, the P o2 will be decreased only slightly (35 to 40 mm Hg) because these patients can increase their COs significantly in response to stress.
c. However, in patients with limited cardiovascular reserves, the P o2 may be significantly decreased (≥30 to 35 mm Hg) because these patients cannot increase their COs in response to stress.
4. As PEEP is applied the P o2 should increase if the CO is not adversely affected. This occurs because oxygen delivery increases.
5. If excessive PEEP is applied the P o2 will decrease because of the effect of PEEP on CO, thus decreasing oxygen delivery.
| PEEP (cm H2O) | P o2 (mm Hg) o2 (mm Hg) |
CO (L/min) |
| 0 | 36 | 12.5 |
| 5 | 36 | 12.3 |
| 10 | 38 | 9.6 |
| 12 | 40 | 8.9 |
| 15 | 43 | 7.2 |
| 18 | 35 | 4.8 |
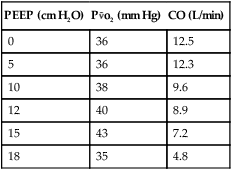
 o2 increased appropriately, but at 18 cm H2O PEEP inhibited CO significantly, resulting in a decrease in the P
 o2. Fluid therapy, pharmacologic support, or a decrease in PEEP level is indicated to support cardiovascular function and optimize P
 o2.
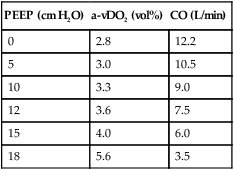
o2.K Arteriovenous oxygen content difference (a-vDo2)
2. In patients with ARDS, a-vDo2 varies from normal, depending on the cardiovascular reserves of the patient.
3. In patients with good cardiovascular reserves, decreased arterial oxygen content results in an increase in CO.
a. If the patient’s metabolic rate is constant and CO is increased, the volume of oxygen extracted per volume of blood decreases.
4. In patients with poor cardiovascular reserves, a decrease in arterial oxygen content may not affect CO.
a. If the patient’s metabolic rate and CO are constant but arterial oxygen content is decreased, then a-vDo2 will increase.
b. If the patient’s metabolic rate is constant and the CO and arterial oxygen content are decreased, then a-vDo2 will also increase.
5. With the appropriate application of PEEP the a-vDo2 should return toward normal levels.
a. If PEEP is applied and the a-vDo2 levels increase beyond acceptable limits, cardiovascular reserves are questionable. Fluid therapy or pharmacologic support may be indicated.
b. If, with the application of PEEP, a-vDo2 values increase appropriately but then exceed upper limits, PEEP is beginning to adversely affect CO. Fluid therapy, pharmacologic support, or a decrease in PEEP level may be indicated.
| PEEP (cm H2O) | a-vDO2 (vol%) | CO (L/min) |
| 0 | 2.8 | 12.2 |
| 5 | 3.0 | 10.5 |
| 10 | 3.3 | 9.0 |
| 12 | 3.6 | 7.5 |
| 15 | 4.0 | 6.0 |
| 18 | 5.6 | 3.5 |
L Effect of PEEP on oxygen transport
1. Oxygen transport is defined as CO times arterial oxygen content (Cao2).
< ?xml:namespace prefix = "mml" />
2. With the development of ARDS, oxygen transport normally decreases because of the decrease in Cao2.
3. As PEEP is applied and Cao2 is increased oxygen transport improves.
4. With excessive application of PEEP, oxygen transport may decrease because of the effect of PEEP on CO. If this occurs, fluid therapy, pharmacologic support, or decreasing PEEP is indicated.
1. The appropriate application of PEEP, should decrease the work of breathing by
a. Maintaining alveoli expanded
e. Minimizing the effects of auto-PEEP (see Section VI, Auto-PEEP or Intrinsic PEEP)
2. However, if PEEP causes overdistention work of breathing will increase.
3. The potential for PEEP to increase the work of breathing is greatest when PEEP is applied to the lung without recruitable volume and at levels ≥10 cm H2O.
4. The addition of pressure support to the applied PEEP may reduce the work of breathing to pre-PEEP levels.
N Effects of PEEP on closing volume
1. Closing volume is that point in a forced vital capacity (FVC) maneuver at which gravity-dependent airways close.
2. The point at which gravity-dependent airways close may become a larger percentage of the FVC and exceed FRC in anesthetized individuals, postoperative patients, and obese patients.
3. PEEP may have the effect of decreasing closing volume and improving oxygenation in the above-defined patients; however, no conclusive data supporting this are available.
O Effect on intracranial pressure
1. Because PEEP impedes venous return, it may increase intracranial pressure by causing blood to pool in the cranium.
2. However, because a Starling resistor located between the sagittal sinus and the cerebral veins controls cerebral blood flow, cerebral blood flow is not markedly affected unless PEEP levels are high.
3. The effect of PEEP is greatest if cerebral autoregulation is impaired by closed head injury or other factors compromising central nervous system function.
4. If the head of the bed is elevated 30 degrees, PEEP levels equal to or greater than 10 cm H2O may be applied without an effect on intracranial pressure.
1. Any time positive pressure is applied to the lung, the likelihood of barotrauma is increased.
2. However, barotrauma normally occurs with high peak alveolar pressure and marked lung disease or when patients fight the ventilator or engage in any activity that markedly increases intrapulmonary pressure, producing a high peak alveolar pressure.
3. When high levels of PEEP are applied careful monitoring for barotrauma must be maintained. This is necessary because the lung requiring high levels of PEEP is significantly diseased, and any increase in peak alveolar pressures may result in barotrauma.
III Indications for PEEP Therapy (Box 40-1)
A The primary indication for PEEP therapy is ALI/ARDS.
1. ALI/ARDS (see Chapter 23) is characterized by
a. Atelectasis and consolidation
b. Decreased pulmonary compliance
2. For PEEP to be most effective it should be applied early after diagnosis as part of a lung protective ventilation strategy.
3. A number of approaches have been used to apply optimal PEEP.
b. The use of a PEEP/FIO2 algorithm that is either written or empirical
c. The use of the inflation limb of the pressure-volume (P-V) curve of the total respiratory system
d. The use of the deflation limb of the P-V curve of the total respiratory system
a. This approach starts at a PEEP level less than needed and increases PEEP in a stepwise manner (2 to 3 cm H2O/step) to a PEEP level higher than required.
b. Various physiologic variables (see Table 40-1) are monitored at each PEEP step. Most commonly the following variables are measured.
(5) Respiratory system compliance
(7) When available pulmonary hemodynamics and cardiac output should be monitored.
c. The optimal PEEP level using this approach is the level that results in the best overall response from all of these variables.
d. Ideally an increased Pao2 (Spo2), unchanged or decreased Paco2, and increased compliance without hemodynamic compromise (Table 40-2) identifies the optimal setting.
TABLE 40-2
| PEEP cm H2O | Pao2 mm Hg | Paco2 mm Hg | Compliance ml/cm H2O | Cardiac Output L/min | Mean Arterial Pressure mm Hg | Mean Pulmonary Artery Pressure mm Hg |
| 8 | 50 | 48 | 26 | 7.2 | 98 | 32 |
| 10 | 56 | 48 | 26 | 6.6 | 96 | 33 |
| 12 | 62 | 46 | 28 | 6.0 | 92 | 30 |
| 14 | 73 | 48 | 28 | 6.2 | 92 | 29 |
| 16 | 130 | 42 | 32 | 4.8 | 88 | 28 |
| 18 | 132 | 42 | 30 | 4.0 | 80 | 26 |
| 20 | 128 | 52 | 28 | 3.6 | 70 | 24 |
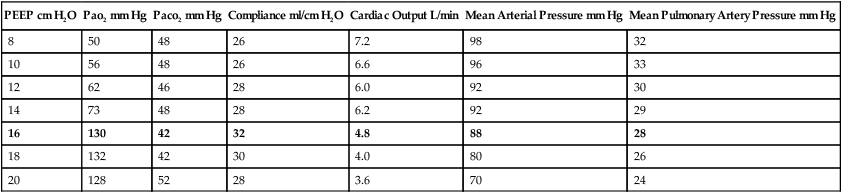
e. Normally in patients with severe ARDS an increasing PEEP trial results in a PEEP level of approximately 12 to 16 cm H2O; however, in some patients PEEP levels of ≤20 cm H2O may be indicated, and in others 8 to 12 cm H2O PEEP may be indicated.
f. In patients with ALI, PEEP levels of 8 to 12 cm H2O are the most commonly required.
g. An increasing PEEP trial is not the most useful approach to set PEEP after lung recruitment maneuver because it starts at a PEEP level less than required, which may result in derecruitment of unstable lung units.
h. Once the PEEP level is set the FIO2 is reduced to the lowest level maintaining the target Pao2.
a. The most widely used table for setting PEEP is that established by the ARDSnet (Table 40-3).
TABLE 40-3
| FIO2 | 0.3 | 0.4 | 0.4 | 0.5 | 0.5 | 0.6 | 0.7 | 0.7 | 0.7 | 0.8 | 0.9 | 0.9 | 1.0 |
| PEEP | 5 | 5 | 8 | 8 | 10 | 10 | 10 | 12 | 14 | 14 | 14 | 16 | 18-24 |
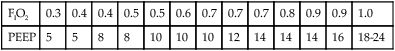
From ARDSnet: Ventilation with lower tidal volumes as compared with traditional tidal volumes for acute lung injury and the acute respiratory distress syndrome. N Engl J Med 342:1301-1308, 2000.
b. This table sequentially increases PEEP and then FIO2 until the desired Pao2 is established.
c. The FIO2 and PEEP are sequentially decreased in a similar manner if the Pao2 is above target level.
d. This table is difficult to use after lung recruitment because it tends to start at a PEEP level lower than required, allowing for derecruitment of lung units.
e. This approach does not consider the lung mechanics of the individual patient.
6. P-V curve of the inflation limb of the respiratory system
a. Figure 40-4 illustrates the inflation and deflation limbs of the P-V curve of the respiratory system.
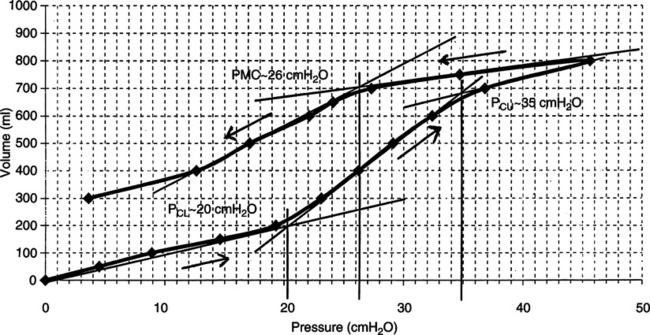
b. Note on the inflation limb the Pflex or lower inflation point. This is an area of the curve where lung compliance increases and is considered the pressure where lung recruitment begins.
c. The actual Pflex is determined by drawing tangents to the slopes of the curve above and below this point of curvature.
d. The meeting of these tangents is the lower inflection point (Pflex).
e. Setting PEEP using the inflation P-V curve calls for PEEP to be set at Pflex + 2 cm H2O.
f. This level of PEEP is believed to avoid significant derecruitment at end exhalation and maintain lung open after lung recruitment maneuver.
g. This is the only approach to setting PEEP that has shown outcome improvement in animal and clinical trials.
h. In at least two randomized controlled clinical trials of severe ARDS patients, PEEP at Pflex + 2 cm H2O was associated with improved survival or reduced systemic inflammatory mediator response.
i. However, performing a P-V curve is difficult at the bedside of critically ill patients.
j. Widespread use of this approach will not occur until the P-V curve and Pflex can be automatically determined by mechanical ventilators.
k. This approach identifies a PEEP level of approximately 14 to 16 cm H2O in most severe ARDS patients but may result in a PEEP of 10 to 20 cm H2O.
l. In some ARDS patients it is impossible to identify a Pflex from the inflation P-V curve.
a. In Figure 40-4 the deflation limb of the P-V curve of the respiratory system is illustrated.
b. The use of the deflation limb of the P-V curve requires that the lung be first recruited before PEEP is set (see Chapter 41).
c. After lung recruitment PEEP is set at approximately 18 to 20 cm H2O, higher than the level normally required.
d. Once PEEP is set at this level the FIO2 is decreased until Pao2 is in target range.
e. Then PEEP is decreased in small steps (1 to 2 cm H2O), and Pao2 is reassessed at each step.
f. As PEEP is decreased the Pao2 will begin to increase because in most patients a PEEP of 20 cm H2O is excessive, causing cardiovascular compromise.
g. Pao2 will then begin to decrease. When the Pao2 decreases to approximately 90% of the maximum Pao2 the trial is stopped.
h. The PEEP level preceding the PEEP level causing the decrease in Pao2 is the optimal PEEP.
i. After completing the decremental PEEP trial the lung is again recruited, and PEEP and FIO2 are set at the identified levels.
j. Spo2 may be substituted for Pao2, but one must ensure that the FIO2 is initially decreased to ensure the Spo2 is 90% to 95% so that a change in PEEP will identify a change in Spo2.
k. This appears to be the best method to determine the minimum PEEP that maintains the oxygenation benefit of a lung recruitment maneuver.
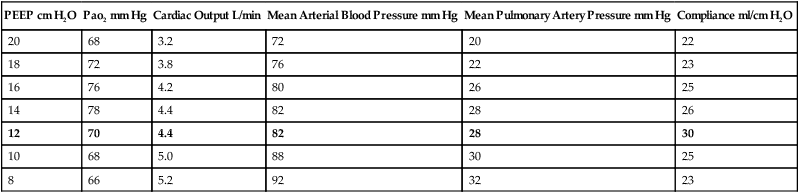
l. An example of a decremental PEEP trial is illustrated in Table 40-4.
TABLE 40-4
| PEEP cm H2O | Pao2 mm Hg | Cardiac Output L/min | Mean Arterial Blood Pressure mm Hg | Mean Pulmonary Artery Pressure mm Hg | Compliance ml/cm H2O |
| 20 | 68 | 3.2 | 72 | 20 | 22 |
| 18 | 72 | 3.8 | 76 | 22 | 23 |
| 16 | 76 | 4.2 | 80 | 26 | 25 |
| 14 | 78 | 4.4 | 82 | 28 | 26 |
| 12 | 70 | 4.4 | 82 | 28 | 30 |
| 10 | 68 | 5.0 | 88 | 30 | 25 |
| 8 | 66 | 5.2 | 92 | 32 | 23 |
8. PEEP trials and hemodynamics
a. Systemic and pulmonary hemodynamics ideally should be carefully monitored during any PEEP trial.
b. Before a PEEP trial is started hemodynamic stability should be ensured.
c. During the trial if the patient becomes hemodynamically unstable, the trial should be stopped.
d. The optimal PEEP level should always be determined with the patient’s hemodynamic status as part of the decision.
9. Withdrawal or decreasing PEEP levels
a. As indicated already PEEP is intended to maintain unstable lung units open.
b. As a general rule FIO2 should be decreased before PEEP.
c. Once FIO2 is <50% PEEP should be slowly decreased.
d. Ideally PEEP is decreased in 2-cm H2O steps, one step if tolerated, every 2 to 4 hours.
e. The decrease is slow because some lung units may derecruit slowly over hours as PEEP is decreased.
f. If after decreasing PEEP the Pao2 decreases, the PEEP should be reestablished.
g. When this occurs it indicates that the lung is still unstable and requires the PEEP level previously set be reestablished.
1. The use of PEEP (CPAP) in acute cardiogenic pulmonary edema has a direct impact on the preload of the left ventricle.
2. The increased intrathoracic pressure resulting from the application of PEEP (CPAP) reduces venous return, decreasing preload, and as a result decreases fluid movement into the intrapulmonary space.
3. PEEP (CPAP) also improves oxygenation and decreases the work of breathing.
4. Essentially PEEP (CPAP) buys time for pharmacologic treatment to improve the patient’s cardiovascular status.
5. Patients with acute cardiogenic pulmonary edema can usually be treated with 8 to 12 cm H2O mask CPAP provided they can still maintain a normal Paco2.
6. In patients with hypoxemic and hypercarbic respiratory failure, noninvasive ventilation by mask (BiPAP) is indicated. Five to 8 cm H2O CPAP with ventilating pressure of 8 to 12 cm H2O should be applied.
7. Patients with myocardial infarction normally require intubation and ventilation.
8. In many patients 2 to 4 hours of mask CPAP is sufficient to reverse the hypoxemic respiratory failure and allow the pharmacologic action of drug therapy to take effect.
9. One hundred percent O2 should initially be administered regardless of the approach to support ventilation.
1. Chest trauma frequently leads to ALI/ARDS and as a result the use of PEEP.
2. On initial presentation the use of mask CPAP may help to reduce the work of breathing, improve oxygenation, and stabilize the chest wall.
3. However, care should be noted because many trauma victims are hemodynamically unstable and may not tolerate the 8 to 12 cm H2O CPAP required.
1. PEEP (CPAP) splints the pharynx open in neonates, preventing obstruction and some apnea.
2. The increased pressure in the pharynx also stimulates respiration.
3. Usually applied by nasal prongs, CPAP of approximately 2 to 4 cm H2O reduces the frequency of apnea.
E Obstructive sleep apnea (OSA)
1. Nasal CPAP of approximately 8 to 12 cm H2O is used extensively to manage OSA in adults.
2. As with neonates PEEP (CPAP) splints open the upper airway, preventing obstruction by the soft palate and base of the tongue.
3. CPAP is also effective for some patients with central sleep apnea.
4. A nocturnal sleep study is necessary to determine whether CPAP will be effective and at which level.
5. CPAP also has been increasingly used for patients with chronic congestive heart failure.
6. Many of these patients also have OSA.
7. In some patients the OSA results in the development of heart failure because of the chronic periods of nocturnal hypoxemia.
1. Some data indicate that the use of mask CPAP treatments (20 to 60 minutes) reduces postoperative atelectasis.
2. In this setting normally 10 cm H2O CPAP is used.
3. However, simple mobilization of the patient accomplishes the same goals. Most agree that CPAP is unnecessary in this setting.
1. In COPD patients PEEP and CPAP are generally used to offset the effects of auto-PEEP (see Section VI, Auto-PEEP or Intrinsic PEEP).
2. During assisted ventilation PEEP levels from 5 to 15 cm H2O are commonly used to balance auto-PEEP levels.
3. This improves trigger synchrony and overall patient-ventilator synchrony.
1. Similar to COPD, asthma is associated with significant levels of auto-PEEP.
2. As a result some have used mask CPAP to offset auto-PEEP and decrease the work of breathing.
3. However, in many patients auto-PEEP is not a result of dynamic airway obstruction and applied PEEP only adds to the total PEEP level in asthma (see Section VI, Auto-PEEP or Intrinsic PEEP).
4. As a result the use of mask CPAP for patients with acute asthma is controversial.
1. This is the application of 3 to 5 cm H2O PEEP to replace the glottic mechanism.
2. The placement of an artificial airway results in a reflexive decrease in FRC.
3. This occurs in all individuals but has been demonstrated to be clinically significant in only two populations.
a. Neonatal and small pediatric patients: This group should not have a short-term artificial airway in place without 3 to 5 cm H2O PEEP. If extubation is indicated, they are extubated from 3 to 5 cm H2O PEEP rather than from atmospheric pressure.
b. Patients with severe COPD: Establishment of an artificial airway under acute conditions again results in a significant decrease in the FRC, causing hypoxemia. It is advisable to maintain 5 cm H2O PEEP in these patients until extubation.
c. PEEP of 3 to 5 cm H2O is often used in all patients requiring a short-term artificial airway. The efficacy of such treatment has not been established, nor have any adverse reactions been documented.
A With the application of PEEP or the alteration of PEEP levels, extensive monitoring of the patient’s cardiopulmonary status must be performed.
B Monitoring should be done after each PEEP adjustment and periodically thereafter.
C Gas exchange should be monitored.
 o2
o2V Periodic Discontinuation of PEEP
A The periodic discontinuation of PEEP should be avoided. This is particularly true when higher levels of PEEP are used.
B Discontinuation of PEEP on a periodic basis results in
1. Decreased FRC (derecruitment)
2. Significant decreases in Pao2
3. Increase in intrapulmonary shunt
4. Possible increased venous return
5. Decreased pulmonary compliance
6. A complete reversal of the changes accomplished with the application of PEEP
C PEEP should not be discontinued when hemodynamic monitoring is performed.
D Inline suction catheters should be used when PEEP is applied to avoid discontinuation of PEEP during suctioning.
VI Auto-PEEP or Intrinsic PEEP
A Auto-PEEP also referred to as intrinsic PEEP, unidentified PEEP, endogenous PEEP, or occult PEEP is a result of incomplete emptying of the lung at end-exhalation or air trapping.
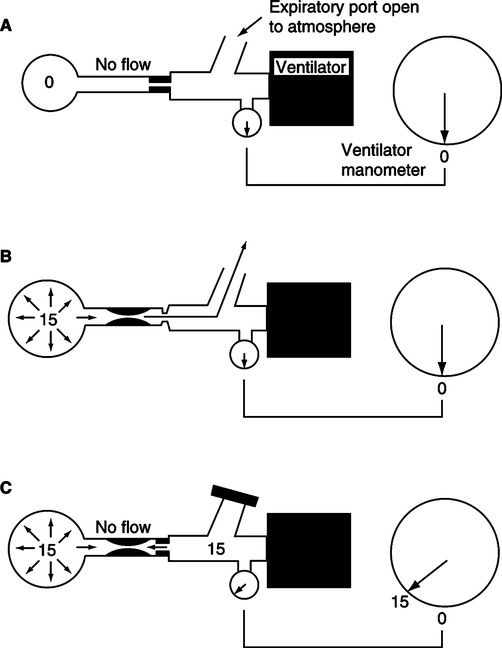
B It is termed unidentified PEEP because auto-PEEP is not identified on the pressure manometer of the ventilator unless an end-expiratory hold is applied (Figure 40-5).
C Auto-PEEP develops because of a number of factors.
1. Inadequate expiratory time: As noted in Figure 40-6 it takes approximately four expiratory time constants for passive exhalation to be complete.
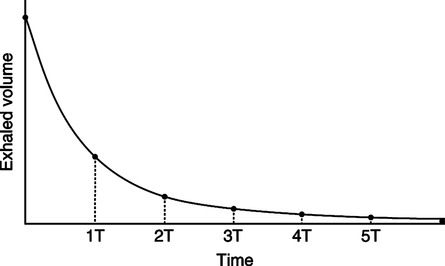
a. In normal adults the expiratory time constant is approximately 0.3 to 0.4 second. As a result approximately 1.5 to 2.0 seconds is sufficient expiratory time for complete passive exhalation.
b. In those with obstructive lung disease expiratory time constants can be as long as 1 to 2 seconds, making air trapping and auto-PEEP impossible to prevent.
c. Auto-PEEP developed as a result of inadequate expiratory time can occur in any individual simply by sufficiently increasing minute ventilation or decreasing expiratory time.
2. Increased airway obstruction increases the expiratory time constants.
a. This occurs in patients with asthma or COPD.
b. However, the mechanism and as a result the response to applied PEEP are different.
c. In patients with COPD airway obstruction, producing auto-PEEP is primarily a result of unstable bronchial or bronchiolar walls.
d. The lumen of the airway in those with COPD is grossly affected by intrathoracic pressure.
(1) During inspiration the walls of the airway in patients with COPD are dilated by inspiratory efforts.
(2) As a result airway obstruction decreases during inspiration.
(3) The exact opposite occurs during exhalation: the increased intrathoracic pressure decreases the lumen of the airway causing obstruction.
(4) In patients with COPD the obstruction is dynamic. This type of airway obstruction benefits from the application of PEEP during assisted ventilation.
e. In patients with asthma, airway obstruction is caused by
f. As a result the obstruction is generally fixed and does not vary greatly from inspiration to expiration.
g. Inspiration is as difficult as expiration because resistance is increased in both.
h. Applied PEEP in this setting does not usually minimize patient trigger effort; it simply increases overall total PEEP level.
3. It is impossible to clearly define the exact mechanism responsible for auto-PEEP in a given patient; as a result many believe a trial of applied PEEP to reduce the work of breathing associated with auto-PEEP is indicated in all patients with airway obstruction requiring assisted ventilation.
D Physiologic effects of auto-PEEP
1. Auto-PEEP essentially causes the same physiologic effects as applied PEEP.
2. However, it occurs in a lung with normal or increased compliance.
3. As a result the effect of auto-PEEP on hemodynamics in COPD patients is greater than applied PEEP in patients with ALI/ARDS.
4. Auto-PEEP markedly increases the work of breathing.
a. This occurs because the auto-PEEP level must be decompressed on each breath to establish a pressure gradient for gas to flow into the airway (Table 40-5).
TABLE 40-5
Pressure Change Necessary to Inspire with Auto-PEEP
| Asthma/COPD No PEEP | COPD PEEP 8 cm H2O | Asthma PEEP 8 cm H2O | |
| Auto-PEEP level, cm H2O | 10 | 10 | 10 |
| Airway pressure, cm H2O | 0 | 8 | 8 |
| Pressure gradient, cm H2O required to trigger ventilator | >10 | >2 | >18 |
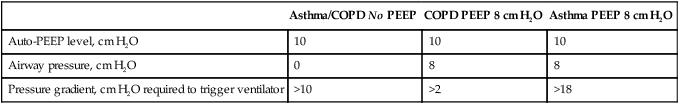
b. As a result if auto-PEEP is 10 cm H2O, the patient must decrease alveolar pressure ≥10 cm H2O for air to flow into the alveoli.
c. In those with COPD, applying PEEP generally offsets the auto-PEEP level, decreasing work of breathing.
d. In patients with asthma, applied PEEP is usually additive to auto-PEEP, increasing the work of breathing.
1. As illustrated in Figure 40-5 clinically the best method to assess the level of auto-PEEP in the passively ventilated patient is to perform an end-expiratory hold.
a. Most modern intensive care unit ventilators incorporate an end-expiratory hold or auto-PEEP measurement control. When activated the increased end-expiratory pressure is the auto-PEEP level (Figure 40-7).
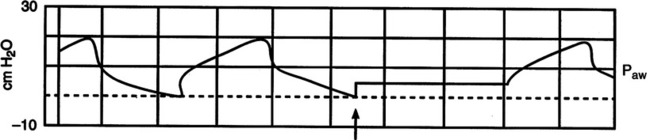
b. If patients have spontaneous inspiratory efforts it is difficult to make this measurement because an end-expiratory plateau is not achievable.
2. In spontaneously breathing patients or patients on assisted ventilation the best method to measure auto-PEEP is by evaluating esophageal pressure change at the same time airway pressure or flow is assessed.
a. As noted in Figure 40-8, if auto-PEEP is present esophageal pressure (a reflection of pleural pressure) decreases before airway pressure or flow is affected.
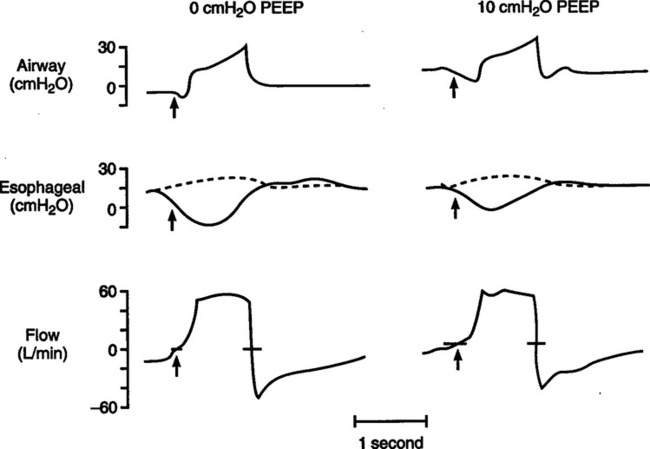
b. The magnitude of the change in airway pressure from baseline to the level causing a change in airway pressure or flow is equal to the auto-PEEP level.
3. Evaluation of expiratory flow provides an indication of the presence of auto-PEEP but not the precise level of auto-PEEP.
a. Figure 40-9 is an illustration of airway pressure, flow, and volume waveforms in a patient with normal lungs receiving mechanical ventilation.
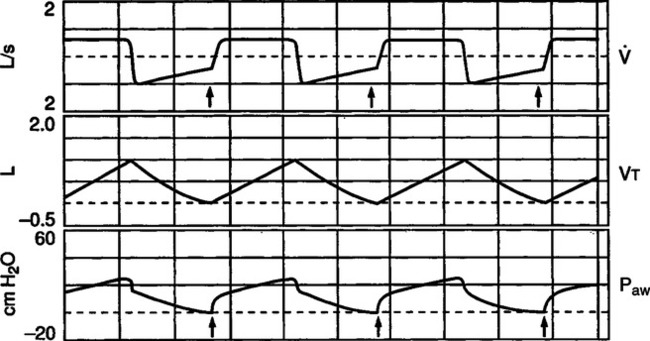
b. Note that expiratory flow does not return to zero before the beginning of the next breath. When this occurs there is still a pressure gradient from the alveoli to the airway causing expiratory flow.
c. Note also that expiratory flow decreases in a linear manner from peak expiratory flow, indicating the absence of dynamic airway obstruction.
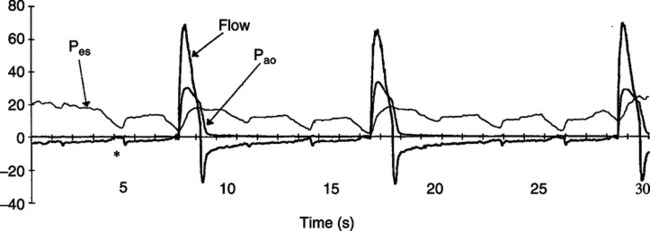
d. Figure 40-10 is from a patient with COPD who has auto-PEEP. As with Figure 40-9, flow does not return to zero before the end of the breath.

e. The expiratory flow pattern in Figure 40-10 is different from that in Figure 40-9 because in COPD there is marked dynamic airflow obstruction.
f. With COPD the peak expiratory flow decreases in an exponential manner with a low flow throughout much of the breath.
g. The level of end-expiratory flow does not indicate the level of auto-PEEP. In Figure 40-9 the auto-PEEP level could be 3 cm H2O, and in Figure 40-10 it could be 10 cm H2O.
4. Patient RR and ventilator response rate
a. If no auto-PEEP is present every patient inspiratory effort should trigger a mechanical breath.
b. As noted in Figure 40-11, in patients with auto-PEEP the ventilator does not sense many inspiratory efforts.
c. As a result the ventilator responds at a rate much slower than the patient’s actual RR.
d. Thus any time the patient’s RR is counted and it is higher than the ventilator response rate, auto-PEEP is present, provided the ventilator is functioning properly.
F Application of auto-PEEP in COPD
1. PEEP should be slowly increased in one to two cm H2O increments until the patient rate and ventilator response rate are equal.
2. The application of PEEP to approximately 80% of the measured auto-PEEP level does not affect lung mechanics in COPD patients.
3. If applied to the appropriate level the patient’s work of breathing decreases, the patient’s ventilatory pattern improves, and patient-ventilatory synchrony improves.
G Effect of auto-PEEP on ventilator pressures and flows
1. In volume ventilation any adjustment that results in an increase in auto-PEEP causes peak airway pressure and plateau pressure to increase.
a. If when applying PEEP plateau pressure increases, either the PEEP application is excessive or the obstruction is not dynamic.
2. In pressure ventilation the development of auto-PEEP causes the Vt to decrease because ventilating pressure is the variable that is set.
[/level-membership-for-pulmolory-and-respiratory-category][not-level-membership-for-pulmolory-and-respiratory-category]
Positive End-Expiratory Pressure
A Positive end-expiratory pressure (PEEP): The establishment and maintenance of a preset airway pressure greater than ambient at end-exhalation.
B Continuous positive airway pressure (CPAP): The application of PEEP to the spontaneously breathing patient. Inspiratory and expiratory airway pressures are supraatmospheric, but no inspiratory assistance is provided.
C Continuous positive pressure ventilation (CPPV): The application of PEEP to a patient receiving positive pressure ventilation.
II Physiologic Effects of PEEP
A Effects on intrapulmonary pressures
1. When only the end-expiratory pressure is maintained above atmospheric in a spontaneously breathing patient, the shape of the intrapulmonary pressure curve is not altered; only the baseline pressure from which the patient ventilates changes. Therefore, the dynamics of air movement are not directly affected.
2. As illustrated in Chapter 5, intrapulmonary pressure decreases approximately 3 cm H2O during inspiration and increases approximately 3 cm H2O during expiration from the set CPAP level.
3. During ventilatory support, regardless of mode, PEEP simply increases the baseline about which mechanical ventilation is initiated.
B Effects on intrapleural (intrathoracic) pressures
1. PEEP increases intrapleural pressures.
2. The extent of the increase is determined by
b. The stiffness of the individual’s lung
(1) The greater the pulmonary compliance, the greater the transmission of PEEP to the intrapleural space and the greater the increase in intrapleural pressure.
(2) In patients with normal lungs and chest wall approximately 50% of the PEEP applied is transmitted to the intrathoracic space, increasing the intrapleural pressure.
(3) In patients with acute respiratory distress syndrome (ARDS; stiff lungs) only approximately 25% of the applied PEEP is transmitted to the intrathoracic space, increasing intrapleural pressure.
(4) Patients with localized pulmonary disease (e.g., pneumonia, atelectasis) demonstrate an increase in overall intrapleural pressure similar to patients with normal pulmonary compliance; however, transmission of pressure may be reduced in the area of concern.
(5) The effects of PEEP on intrapleural pressure are most marked in patients with chronic obstructive pulmonary disease (COPD) because of their increased pulmonary compliance.
c. Changes in thoracic compliance
(1) If thoracic compliance is decreased more pressure than normal will be transmitted to the intrapleural space because overall expansion of the lung-thorax system is inhibited. It is in this setting that hemodynamic compromise is most likely.
(2) An increase in thoracic compliance will allow the system to expand and usually results in less of an increase in intrapleural pressure when compared with normal. Hemodynamic compromise is minimal in this setting.
C Effect on functional residual capacity (FRC) (Figure 40-1)
1. Regardless of the condition of the lung at the time of application, PEEP increases FRC.
2. FRC is increased by two primary mechanisms.
a. Because the lungs are elastic any increase in end-expiratory pressure increases overall lung volume. The diameter of conducting airways can increase 1 to 2 mm as PEEP is applied.
b. In patients with a decreased FRC as a result of alveolar collapse caused by surfactant instability, PEEP maintains alveoli inflated after they are recruited by the peak airway pressure.
(1) This is accomplished by PEEP maintaining a backpressure exceeding the force of surface tension and lung elastance, which tend to collapse alveoli.
(2) The actual reexpansion of alveoli is accomplished by the force of normal inspiration or the application of positive inspiratory airway pressure. PEEP simply maintains the alveoli open once they are reexpanded.
D Effect on pulmonary compliance
1. Because PEEP increases FRC, it alters pulmonary compliance.
2. The compliance curve of the normal total respiratory system is depicted in Figure 40-2. Note that the curve is only linear above the FRC level and again becomes alinear at some pressure and volume well beyond FRC.
3. In the normal lung the increased FRC caused by excessive PEEP levels may move alveoli from the steep portion to the flat portion of the compliance curve, thus decreasing compliance.
4. In patients with acute lung injury (ALI) or ARDS, the application of PEEP increases compliance (see Figure 40-2).
a. As ARDS develops the compliance curve shifts to the right and downward.
b. As PEEP is applied the compliance curve shifts upward and to the left.
c. With appropriate application of PEEP compliance in ALI/ARDS normally improves.
5. The monitoring of effective static compliance (see Chapter 41) can be used to help to determine the “optimal” or most appropriate PEEP level.
a. The best compliance is thought to coincide with the most appropriate PEEP level; however, changes in tidal volume (Vt) will change the PEEP level considered appropriate. Vt should always be constant during PEEP titration.
b. The major problem associated with the use of compliance as a means to determine optimal PEEP is the difficulty in determining compliance in patients ventilated in anything but the control mode. With other modes a reliable measurement of effective static compliance is often difficult because of active movement of the chest wall, preventing correct determination of the static end-inspiratory plateau pressure.
1. Because PEEP increases FRC by distending alveoli, deadspace is usually increased in
2. Because of stabilization of recruited alveoli, appropriate PEEP levels usually decrease deadspace in patients with ALI/ARDS. Some have proposed monitoring deadspace or change in CO2 at a constant minute ventilation as an indication of appropriate PEEP level.
F Effect of PEEP on the cardiovascular system (Table 40-1)
TABLE 40-1
Potential Physiologic Effects of Appropriately and Excessively Applied PEEP
| Appropriate Level | Excessive Level | |
| Intrapulmonary pressure | Increased | Increased |
| Intrathoracic pressure | Increased | Increased |
| FRC | Increased | Increased |
| Respiratory system compliance | Increased | Increased or decreased |
| Closing volume | Decreased | Decreased |
| Pao2 | Increased | Increased or decreased |
| Sao2 | Increased | Increased or decreased |
| Paco2 | No change or decreased | Increased |
| s/t |
Decreased | Decreased or increased |
| P(A−a)O2 | Decreased | Decreased or increased |
| C(a-) O2 |
Decreased | Decreased or increased |
| Po2 |
Increased | Increased or decreased |
| Paco2-PETCO2 | Decreased | Increased |
| VD/VT | Decreased | Increased |
| Work of breathing | Decreased | Increased |
| Extravascular lung water | No change or increased | No change or increased |
| Pulmonary vascular resistance | Increased | Increased |
| Total pulmonary perfusion | No change or decreased | Decreased |
| Cardiac output | No change or decreased | Decreased |
| Pulmonary artery pressure | No change or increased or decreased | Decreased |
| Pulmonary capillary wedge pressure | No change or increased or decreased | Decreased |
| Central venous pressure | No change or increased or decreased | Decreased |
| Arterial pressure | No change or increased or decreased | Decreased |
| Intracranial pressure | No change or increased | Increased |
| Urinary output | No change or decreased | Decreased |
1. The primary effect of PEEP on the cardiovascular system is a reduction in cardiac output (CO) as a result of increased impedance to venous return by an increase in intrathoracic pressure.
2. This increase in pressure decreases cardiac transmural pressure, potentially decreasing the end-diastolic volume and stroke volume of both ventricles.
3. Low-level PEEP reduces right ventricular end-diastolic volume, but right ventricular ejection fraction normally remains constant, provided no previous right ventricular dysfunction exists.
4. Higher levels of PEEP markedly increase right ventricular afterload, increasing end-diastolic volume and decreasing ejection fraction.
5. Increased right ventricular end-diastolic volume with high levels of PEEP causes right ventricular distention and a leftward shift of the interventricular septa.
a. This reduces left ventricular distensibility.
b. This results in a decrease in left ventricular end-diastolic volume and stroke volume.
6. Actual changes in pulmonary hemodynamics after the application of PEEP depend on many factors.
7. Provided that pulmonary blood flow is not markedly reduced, PEEP generally results in
a. An increase in right ventricular preload (central venous pressure [CVP])
b. An increase in right ventricular afterload (pulmonary artery pressure [PAP])
c. An increase in left ventricular preload (pulmonary capillary wedge pressure [PWP])
d. Generally the higher the PEEP, the less likely the wedge pressure will reflect left atrial pressure.
e. Because CO is usually decreased with PEEP, left ventricular afterload may also decrease as PEEP is applied.
8. If pulmonary blood flow is markedly reduced by the application of PEEP, the preload and afterload of left and right ventricles decrease. As a result it is difficult to predict the precise effect that PEEP will have on hemodynamics.
9. Any of the hemodynamic pressures measured may increase, decrease, or stay the same, depending on the maintenance of pulmonary blood flow.
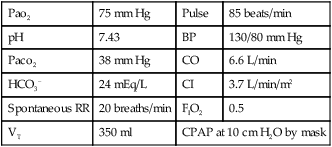
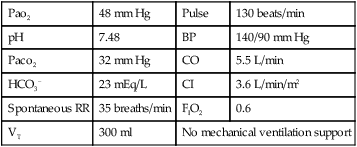
10. When the effect of PEEP on CO is evaluated, it is important to place the decreased CO into proper perspective. The following are two examples of the effect of PEEP on CO. In example A the patient is young and has excellent cardiovascular reserves, whereas in example B the patient is older and has limited cardiovascular reserves.
| Pao2 | 48 mm Hg | Pulse | 130 beats/min |
| pH | 7.53 | Blood pressure (BP) | 160/100 mm Hg |
| Paco2 | 27 mm Hg | CO | 10.5 L/min |
| HCO3− | 22 mEq/L | CI | 5.7 L/min/m2 |
| Spontaneous respiration rate (RR) | 35 breaths/min | FIO2 | 0.8 |
| VT | 350 ml | No mechanical ventilatory support | |
With the application of PEEP the following data are obtained.
| Pao2 | 75 mm Hg | Pulse | 85 beats/min |
| pH | 7.43 | BP | 130/80 mm Hg |
| Paco2 | 38 mm Hg | CO | 6.6 L/min |
| HCO3− | 24 mEq/L | CI | 3.7 L/min/m2 |
| Spontaneous RR | 20 breaths/min | FIO2 | 0.5 |
| VT | 350 ml | CPAP at 10 cm H2O by mask | |
| Pao2 | 48 mm Hg | Pulse | 130 beats/min |
| pH | 7.48 | BP | 140/90 mm Hg |
| Paco2 | 32 mm Hg | CO | 5.5 L/min |
| HCO3− | 23 mEq/L | CI | 3.6 L/min/m2 |
| Spontaneous RR | 35 breaths/min | FIO2 | 0.6 |
| VT | 300 ml | No mechanical ventilation support | |
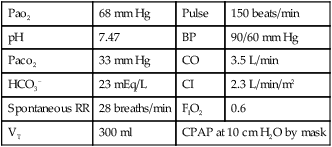
With the application of PEEP the following data are obtained.
| Pao2 | 68 mm Hg | Pulse | 150 beats/min |
| pH | 7.47 | BP | 90/60 mm Hg |
| Paco2 | 33 mm Hg | CO | 3.5 L/min |
| HCO3− | 23 mEq/L | CI | 2.3 L/min/m2 |
| Spontaneous RR | 28 breaths/min | FIO2 | 0.6 |
| VT | 300 ml | CPAP at 10 cm H2O by mask | |
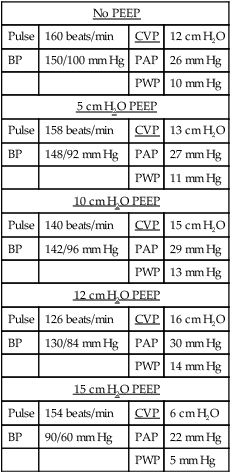
11. The following example is designed to illustrate the effect of PEEP on hemodynamic values.
| No PEEP | |||
| Pulse | 160 beats/min | CVP | 12 cm H2O |
| BP | 150/100 mm Hg | PAP | 26 mm Hg |
| PWP | 10 mm Hg | ||
| 5 cm H2O PEEP | |||
| Pulse | 158 beats/min | CVP | 13 cm H2O |
| BP | 148/92 mm Hg | PAP | 27 mm Hg |
| PWP | 11 mm Hg | ||
| 10 cm H2O PEEP | |||
| Pulse | 140 beats/min | CVP | 15 cm H2O |
| BP | 142/96 mm Hg | PAP | 29 mm Hg |
| PWP | 13 mm Hg | ||
| 12 cm H2O PEEP | |||
| Pulse | 126 beats/min | CVP | 16 cm H2O |
| BP | 130/84 mm Hg | PAP | 30 mm Hg |
| PWP | 14 mm Hg | ||
| 15 cm H2O PEEP | |||
| Pulse | 154 beats/min | CVP | 6 cm H2O |
| BP | 90/60 mm Hg | PAP | 22 mm Hg |
| PWP | 5 mm Hg | ||
| 15 cm H2 O PEEP | |||
| Pulse | 124 beats/min | CVP | 18 cm H2O |
| BP | 120/84 mm Hg | PAP | 32 mm Hg |
| PWP | 16 mm Hg | ||
G Effects of PEEP on lung water (Figure 40-3)
1. PEEP does not decrease overall pulmonary vascular volume.
2. Normally PEEP causes a redistribution of lung water and may increase overall lung water.
3. Fluid generally moves from the intraalveolar to the perivascular interstitial space; extraalveolar and corner vessels are expanded with PEEP.
4. This movement assists in improving oxygenation, increasing compliance, and decreasing shunting.
[/not-level-membership-for-pulmolory-and-respiratory-category]
