[level-membership-for-basic-science-category]
CHAPTER 9 Polygenic and Multifactorial Inheritance
Many disorders demonstrate familial clustering that does not conform to any recognized pattern of Mendelian inheritance. Examples include several of the most common congenital malformations and many common acquired diseases (Box 9.1). These conditions show a definite familial tendency, but the incidence in close relatives of affected individuals is much lower than would be seen if these conditions were caused by mutations in single genes.
Box 9.1
Disorders that Show Multifactorial Inheritance
Polygenic Inheritance and the Normal Distribution
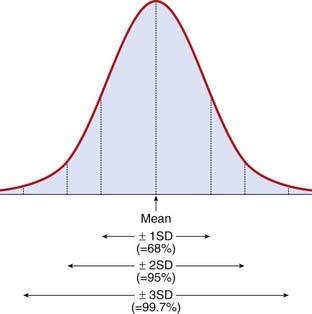
Several human characteristics (Box 9.2) show a continuous distribution in the general population, which closely resembles a normal distribution. This takes the form of a symmetrical bell-shaped curve distributed evenly about a mean (Figure 9.1). The spread of the distribution about the mean is determined by the standard deviation. Approximately 68%, 95%, and 99.7% of observations fall within the mean plus or minus one, two, or three standard deviations, respectively.
It is possible to show that a phenotype with a normal distribution in the general population can be generated by polygenic inheritance involving the action of many genes at different loci, each of which exerts an equal additive effect. This can be illustrated by considering a trait such as height. If height were to be determined by two equally frequent alleles, a (tall) and b (short), at a single locus, then this would result in a discontinuous phenotype with three groups in a ratio of 1 (tall-aa) to 2 (average-ab/ba) to 1 (short-bb). If the same trait were to be determined by two alleles at each of two loci interacting in a simple additive way, this would lead to a phenotypic distribution of five groups in a ratio of 1 (4 tall genes) to 4 (3 tall + 1 short) to 6 (2 tall + 2 short) to 4 (1 tall + 3 short) to 1 (4 short). For a system with three loci each with two alleles the phenotypic ratio would be 1-6-15-20-15-6-1 (Figure 9.2).
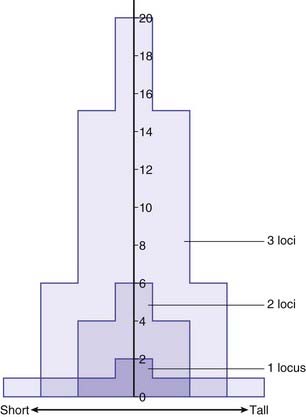
It can be seen that as the number of loci increases, the distribution increasingly comes to resemble a normal curve, thereby supporting the concept that characteristics such as height are determined by the additive effects of many genes at different loci. Further support for this concept comes from the study of familial correlations for characteristics such as height. Correlation is a statistical measure of the degree of resemblance or relationship between two parameters. First-degree relatives share, on average, 50% of their genes (Table 9.1). Therefore, if height is polygenic, the correlation between first-degree relatives should be 0.5. Several studies have shown that the sib–sib correlation for height is indeed close to 0.5.
| Relationship | Proportion of Genes Shared |
|---|---|
| First degree |  |
| Parents | |
| Siblings | |
| Children | |
| Second degree |  |
| Uncles and aunts | |
| Nephews and nieces | |
| Grandparents | |
| Grandchildren | |
| Half-siblings | |
| Third degree |  |
| First cousins | |
| Great-grandparents | |
| Great-grandchildren |
In reality, human characteristics such as height and intelligence are also influenced by environment, and possibly also by genes that are not additive in that they exert a dominant effect. These factors probably account for the observed tendency of offspring to show what is known as regression to the mean. This is demonstrated by tall or intelligent parents (the two are not mutually exclusive!) having children whose average height or intelligence is slightly lower than the average or mid-parental value. Similarly, parents who are very short or of low intelligence tend to have children whose average height or intelligence is lower than the general population average, but higher than the average value of the parents. If a trait were to show true polygenic inheritance with no external influences, then the measurements in offspring would be distributed evenly around the mean of their parents’ values.
Multifactorial Inheritance—The Liability/Threshold Model
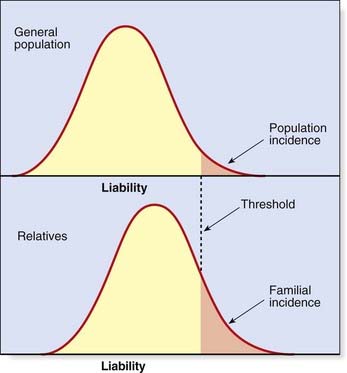
Efforts have been made to extend the polygenic theory for the inheritance of quantitative or continuous traits to try to account for discontinuous multifactorial disorders. According to the liability/threshold model, all of the factors which influence the development of a multifactorial disorder, whether genetic or environmental, can be considered as a single entity known as liability. The liabilities of all individuals in a population form a continuous variable, which has a normal distribution in both the general population and in relatives of affected individuals. However, the curves for these relatives will be shifted to the right, with the extent to which they are shifted being directly related to the closeness of their relationship to the affected index case (Figure 9.3).
Consequences of the Liability/Threshold Model
Heritability
Heritability is estimated from the degree of resemblance between relatives expressed in the form of a correlation coefficient, which is calculated using statistics of the normal distribution. Alternatively, heritability can be calculated using data on the concordance rates in monozygotic and dizygotic twins. In practice, it is desirable to try to derive heritability estimates using different types of relatives and to measure the disease incidence in relatives reared together and living apart so as to try to disentangle the possible effects of common environmental factors. Estimates of heritability for some common diseases are given in Table 9.2.
| Disorder | Frequency (%) | Heritability |
|---|---|---|
| Schizophrenia | 1 | 85 |
| Asthma | 4 | 80 |
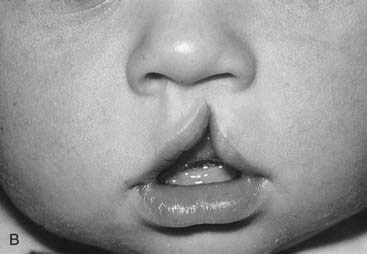
| Cleft lip ± cleft palate | 0.1 | 76 |
| Pyloric stenosis | 0.3 | 75 |
| Ankylosing spondylitis | 0.2 | 70 |
| Club foot | 0.1 | 68 |
| Coronary artery disease | 3 | 65 |
| Hypertension (essential) | 5 | 62 |
| Congenital dislocation of the hip | 0.1 | 60 |
| Anencephaly and spina bifida | 0.3 | 60 |
| Peptic ulcer | 4 | 37 |
| Congenital heart disease | 0.5 | 35 |
Identifying Genes that Cause Multifactorial Disorders
Multifactorial disorders are common and make a major contribution to human morbidity and mortality (p. 8). It is therefore not surprising that vigorous efforts are being made to try to identify genes that contribute to their etiology. Several strategies have been used to search for disease susceptibility genes.
Linkage Analysis
Linkage analysis has proved extremely valuable in mapping single gene disorders by studying the co-segregation of genetic markers with the disease (p. 137). However, this approach is much more difficult in multifactorial disorders. This is because it is extremely difficult mathematically to develop strategies for detecting linkage of additive polygenes, each of which makes only a small contribution to the phenotype. In addition, many multifactorial diseases show a variable age of onset so that the genetic status of unaffected family members cannot be known with certainty.
Despite the limitations, a small number of susceptibility loci have been identified using modifications of the approaches used for mapping single gene loci. Examples are given in Chapter 15.
Affected Sibling-Pair Analysis
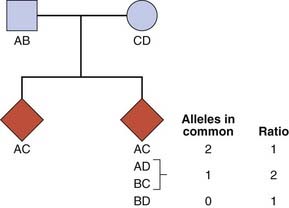
Consider a set of parents with alleles AB (father) and CD (mother) at a particular locus. The probability that any two of their children will have both alleles in common is 1 in 4 (Figure 9.5). The probability that they will have one allele in common is 1 in 2 and the probability that they will have no alleles in common equals 1 in 4. If siblings who are affected with a particular disease show deviation from this 1 : 2 : 1 ratio for a particular variant, this implies that there is a causal relationship between the locus and the disease.
Linkage Disequilibrium Mapping
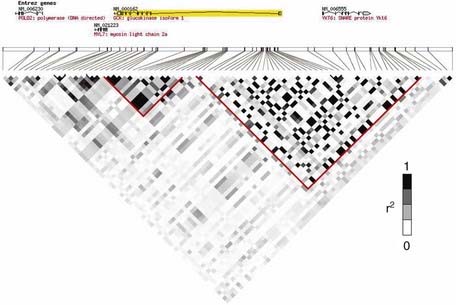
After a chromosome region that appears to confer susceptibility has been identified, the next step is to reduce the genetic interval by fine mapping. The most powerful method uses linkage disequilibrium (LD) (p. 138) mapping to construct haplotypes by genotyping SNPs within the region. Historical crossover points reduce the genetic interval by defining LD ‘blocks’ (Figure 9.6). Candidate genes within the region are then sequenced to find DNA variants that can be tested for association with the disease.
Many genome-wide linkage scans (p. 76) have been performed for various disorders and although a number of loci have been mapped, the number of disease susceptibility genes identified by this approach is disappointingly small. One probable reason is the complex nature of multifactorial disease, with numerous genetic variants of modest effect interacting with each other and the environment. Most linkage studies are simply underpowered to detect these effects, and it was shown by Risch and Merikangas that an alternative approach, the association study, would be a more powerful way of finding genetic variants underlying complex diseases.
Association Studies
The polymorphic HLA histocompatibility complex on chromosome 6 (p. 200) has been frequently studied. One of the strongest known HLA associations is that between ankylosing spondylitis and the B27 allele. This is present in approximately 90% of all patients and in only 5% of controls. The strength of an association is indicated by the ratio of the odds of developing the disease in those with the antigen to the odds of developing the disease in those without the antigen (Table 9.3). This is known as the odds ratio and it gives an indication of how much more frequently the disease occurs in individuals with a specific marker than in those without that marker. For the HLA-ankylosing spondylitis association, the odds ratio is 171. However, for most markers associated with multifactorial disease, the frequency difference between cases and controls is small, giving rise to modest odds ratios (usually between 1.1 and 1.5).
Table 9.3 Calculation of Odds Ratio for a Disease Association
| Allele 1 | Allele 2 | |
|---|---|---|
| Patients | A | b |
| Controls | C | d |
| Odds ratio | =  ÷ ÷  =  |
HapMap Project (www.hapmap.org)
Although it is estimated that there may be up to 10 million SNPs in the human genome, many SNPs are in linkage disequilibrium (p. 138) and therefore co-inherited. Regions of linked SNPs are known as haplotypes. The International HapMap project is identifying SNP frequencies and haplotypes in different populations (Table 9.4). By 2007, the project had genotyped more than 3 million SNPs in 270 samples from Europe, East Asia, and West Africa. It showed that most SNPs are strongly correlated to one or more others nearby. This means that by genotyping approximately 500,000 SNPs in most populations, we can capture information on the majority of common SNPs in the human genome (with minor allele frequency >5%). In African populations, the number needed is approximately 1 million SNPs because of lower overall linkage disequilibrium. Since 2007, genotype data have been added to the HapMap from seven other populations, whereas the original HapMap population samples have expanded. Together with high-throughput SNP genotyping, this valuable reference enabled a new generation of association studies, which could tackle the whole genome’s common SNP variation in just one experiment.
Table 9.4 Populations Studied in the International HapMap Project
| Ancestry | Place of Residence | Number of Individuals Analysed |
|---|---|---|
| Yoruba | Ibadan, Nigeria | 180* |
| Japanese | Tokyo, Japan | 91 |
| Han Chinese | Beijing, China | 90 |
| Northern and western European | Utah, USA | 180* |
| Luhya | Webuye, Kenya | 90 |
| Maasai | Kinyawa, Kenya | 180* |
| Tuscan | Italy | 90 |
| Gujarati Indian | Houston, Texas, USA | 90 |
| Metropolitan Chinese community | Denver, Colorado, USA | 90 |
| Mexican | Los Angeles, California, USA | 90* |
| African | Southwestern USA | 90* |
* Sample contains DNA from family trios (mother, father, and child), whereas the others include only unrelated individuals.
Genome-Wide Association Studies
In genome-wide association (GWA) studies, researchers compare variants across the entire genome in a case control study, rather than looking at just one variant at a time. Since 2006, this powerful new method has produced an explosion in the number of widely replicated associations between SNPs and common diseases, which are catalogued at http://www.genome.gov/gwastudies/. By 2009, GWA studies had identified hundreds of reproducible associations with over 80 common diseases or traits. Examples of these associations are given in Chapter 15. The results of a GWA study of autism are shown in Figure 9.7. In a typical GWA study, 500,000 to 1 million SNPs are genotyped in each subject using a single microarray (‘SNP chip’).
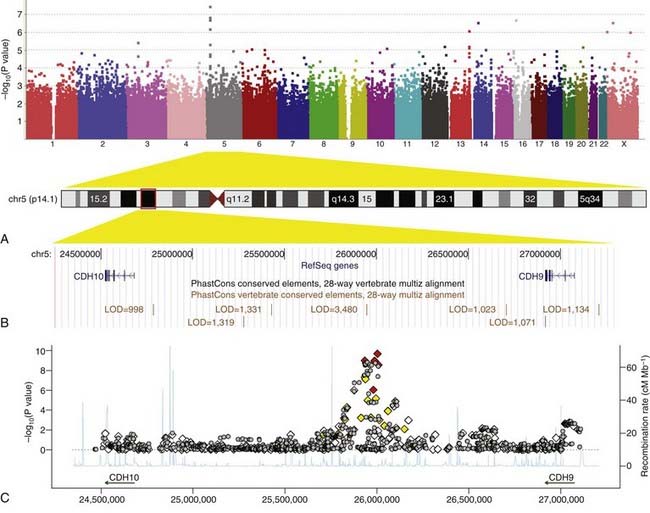
FIGURE 9.7 Results of a genome-wide association study of autism spectrum disorders. A, ‘Manhattan plot’ of −log10 (P value) against genomic position. Each data point represents the association between an individual single nucleotide polymorphism (SNP) and autism. SNPs are ordered according to their position in the genome and each chromosome is coloured differently. The higher the position on the y-axis, the stronger the evidence for association. SNPs on chromosome 5p14.1 show the strongest associations. B, The 5p14.1 genomic region as displayed in the UCSC genome browser (http://genome.ucsc.edu/). C, Zooming in on the 5p14.1 region: Both genotyped SNPs (diamonds) and imputed SNPs (inferred from linkage disequilibrium with genotyped SNPs; grey circles) are plotted with −log10 (P value) (y-axis) against genomic position (x-axis). Genotyped SNPs are colored on the basis of their correlation with the most strongly associated SNP (red = high, yellow = medium, white = low). Estimated recombination rates from HapMap data are plotted to reflect the local linkage disequilibrium structure.
(From Wang K, et al 2009 Nature 459:528–533, with permission.)
A clear advantage of GWA studies over the candidate gene approach is that they are ‘hypothesis-free’. No prior assumption is made about the genes likely to be involved in the disease, and as a result, associations have been uncovered which provide new insights into biological pathways, opening up new avenues for research. Examples are given in Chapter 15.
It has been important to develop new statistical criteria for GWA studies. If we were to perform a statistical test of association comparing the frequency of one SNP between cases and controls, we might interpret a P value of <.05 as being unlikely to have occurred by chance. However, when testing associations with increasing numbers of SNPs, the P value threshold needs to change: 1 in 20 tests will have a P value <.05 just by chance. Based on HapMap European data, there are approximately 1 million common SNPs in the genome that are independent (i.e., in very low linkage disequilibrium with all others). Therefore, a comprehensive GWA study of common variants is equivalent to testing approximately 1 million hypotheses. Consequently, in GWA studies, P = 5 × 10⁻⁸ is the accepted threshold below which an association is unlikely to be a false positive. Large sample sizes are needed to achieve such low P values, and meta-analysis of two or more studies is a common approach to enlarge the sample size. Dense SNP data can be used to identify population stratification in GWA studies. For example, if an individual shows allele frequency differences from the rest of the study sample at thousands of SNPs, this may indicate that they are of different ancestry may lead to their exclusion from the study.
Research in molecular biology is beginning to unravel some of the mysteries of multifactorial inheritance. Technological developments in SNP genotyping, together with an increased understanding of genetic variation, have enabled GWA studies to uncover many new susceptibility loci for polygenic diseases. Examples of progress to date are described in Chapter 15.
This emphasis on the underlying genetic contribution to multifactorial disorders should not in any way detract from the importance of trying to identify major environmental causal factors. This is amply demonstrated by the beneficial effect of folic acid supplementation in preventing neural tube defects (p. 258).
Botstein D, Risch N. Discovering genotypes underlying human phenotypes: past successes for Mendelian disease, future approaches for complex disease. Nature Genet Suppl. 2003;33:228-237.
Falconer DS. The inheritance of liability to certain diseases estimated from the incidence among relatives. Ann Hum Genet. 1965;29:51-76.
Fraser FC. Evolution of a palatable multifactorial threshold model. Am J Hum Genet. 1980;32:796-813.
An amusing and ‘reader-friendly’ account of models proposed to explain multifactorial inheritance.
McCarthy MI, Abecasis GR, Cardon LR, et al. Genome-wide association studies for complex traits: consensus, uncertainty and challenges. Nat Rev Genet. 2008;9:356-369.
Elements
[/level-membership-for-basic-science-category][not-level-membership-for-basic-science-category]
CHAPTER 9 Polygenic and Multifactorial Inheritance
Many disorders demonstrate familial clustering that does not conform to any recognized pattern of Mendelian inheritance. Examples include several of the most common congenital malformations and many common acquired diseases (Box 9.1). These conditions show a definite familial tendency, but the incidence in close relatives of affected individuals is much lower than would be seen if these conditions were caused by mutations in single genes.
Box 9.1
Disorders that Show Multifactorial Inheritance
Polygenic Inheritance and the Normal Distribution
Several human characteristics (Box 9.2) show a continuous distribution in the general population, which closely resembles a normal distribution. This takes the form of a symmetrical bell-shaped curve distributed evenly about a mean (Figure 9.1). The spread of the distribution about the mean is determined by the standard deviation. Approximately 68%, 95%, and 99.7% of observations fall within the mean plus or minus one, two, or three standard deviations, respectively.
It is possible to show that a phenotype with a normal distribution in the general population can be generated by polygenic inheritance involving the action of many genes at different loci, each of which exerts an equal additive effect. This can be illustrated by considering a trait such as height. If height were to be determined by two equally frequent alleles, a (tall) and b (short), at a single locus, then this would result in a discontinuous phenotype with three groups in a ratio of 1 (tall-aa) to 2 (average-ab/ba) to 1 (short-bb). If the same trait were to be determined by two alleles at each of two loci interacting in a simple additive way, this would lead to a phenotypic distribution of five groups in a ratio of 1 (4 tall genes) to 4 (3 tall + 1 short) to 6 (2 tall + 2 short) to 4 (1 tall + 3 short) to 1 (4 short). For a system with three loci each with two alleles the phenotypic ratio would be 1-6-15-20-15-6-1 (Figure 9.2).
It can be seen that as the number of loci increases, the distribution increasingly comes to resemble a normal curve, thereby supporting the concept that characteristics such as height are determined by the additive effects of many genes at different loci. Further support for this concept comes from the study of familial correlations for characteristics such as height. Correlation is a statistical measure of the degree of resemblance or relationship between two parameters. First-degree relatives share, on average, 50% of their genes (Table 9.1). Therefore, if height is polygenic, the correlation between first-degree relatives should be 0.5. Several studies have shown that the sib–sib correlation for height is indeed close to 0.5.
| Relationship | Proportion of Genes Shared |
|---|---|
| First degree | |
| Parents | |
| Siblings | |
| Children | |
| Second degree | |
| Uncles and aunts | |
| Nephews and nieces | |
| Grandparents | |
| Grandchildren | |
| Half-siblings | |
| Third degree | |
| First cousins | |
| Great-grandparents | |
| Great-grandchildren |
In reality, human characteristics such as height and intelligence are also influenced by environment, and possibly also by genes that are not additive in that they exert a dominant effect. These factors probably account for the observed tendency of offspring to show what is known as regression to the mean. This is demonstrated by tall or intelligent parents (the two are not mutually exclusive!) having children whose average height or intelligence is slightly lower than the average or mid-parental value. Similarly, parents who are very short or of low intelligence tend to have children whose average height or intelligence is lower than the general population average, but higher than the average value of the parents. If a trait were to show true polygenic inheritance with no external influences, then the measurements in offspring would be distributed evenly around the mean of their parents’ values.
Multifactorial Inheritance—The Liability/Threshold Model
Efforts have been made to extend the polygenic theory for the inheritance of quantitative or continuous traits to try to account for discontinuous multifactorial disorders. According to the liability/threshold model, all of the factors which influence the development of a multifactorial disorder, whether genetic or environmental, can be considered as a single entity known as liability. The liabilities of all individuals in a population form a continuous variable, which has a normal distribution in both the general population and in relatives of affected individuals. However, the curves for these relatives will be shifted to the right, with the extent to which they are shifted being directly related to the closeness of their relationship to the affected index case (Figure 9.3).
Consequences of the Liability/Threshold Model
[/not-level-membership-for-basic-science-category]
