CHAPTER 10 Physiology of the Cerebrospinal Fluid and Intracranial Pressure
Historical Considerations
Although problems with brain swelling and the effects of removing pieces of skull were understood even in the times of Galen, Hippocrates, and the early Egyptian physicians, modern thinking about volume regulation inside the skull began with the writings of George Kellie and his mentor, Alexander Monro, who worked in Edinburgh at the turn of the 19th century. Monro,1 in his seminal work on the brain and nervous system, wrote:
Some years later, at a meeting of the Medico-Chirurgical Society of Edinburgh, George Kellie2 presented a report in which he advanced this idea and stated:
These ideas later became recognized as the Monro-Kellie doctrine, which is formalized physiologically later. Subsequent advances in understanding ICP came with the ability to effectively monitor ICP under different circumstances. Quincke3 first described lumbar puncture for the relief of “brain pressure” in 1911. However, it was not until the work of Guillaume and Janny4 in 1951 that ICP was continuously monitored. Lundberg5 later published results from a large series of patients in which he described several of the fundamental concepts used today in clinical ICP monitoring, including the Lundberg A, B, and C waves.
Normal Intracranial Pressure
ICP can be measured by low-volume displacement transducers to interface with CSF pathways in the intraventricular, intraparenchymal, subdural, or epidural spaces. The ICP waveform is normally pulsatile and can be divided into three major components (Fig. 10-1). The baseline or average level is commonly referred to as the ICP; rhythmic components superimposed on this level are associated with cardiac and respiratory activity. To completely describe ICP, one should specify the magnitude of the baseline or “steady-state” level and the amplitude and periodicity of the pulsatile components. Changes in these pulsatile components can be one of the earliest signs that the ICP is beginning to rise, as a reflection of the increased conductance of pressure waves through a “tightening” brain.
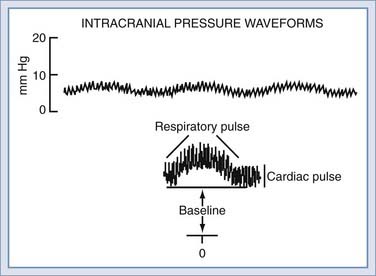
Cardiac and respiratory activity creates pulsatile components by cyclic changes in cerebral blood volume. Left ventricular contraction contributes the cardiac component, which has a frequency similar to the peripheral arterial pulse. The exact vessels that transmit the peripheral pulse remain to be established. Early studies suggested that the choroid plexus and pial arteries were responsible,6 although more recent analysis has implicated the high-compliance venous blood vessels.7
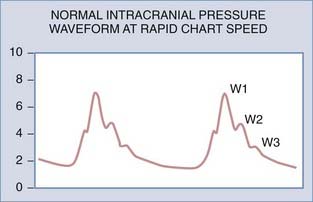
If the ICP waveform is examined in more detail and at a higher chart speed, the waveform of highest frequency can be seen to consist of as many as five smaller peaks. Three of these are relatively constant (Fig. 10-2): the percussion wave (W1), the tidal wave (W2), and the dicrotic wave (W3).7,8 The percussion wave is the most constant in amplitude and derives from pulsations in large intracranial arteries.9 The tidal wave has a more variable shape and is thought to arise from brain elastance. The tidal wave and the dicrotic wave are separated by the dicrotic notch, which corresponds to the dicrotic notch in the arterial pulse waveform.
Physical Principles
In actual fact, three different pressures contribute to ICP: atmospheric pressure, hydrostatic pressure, and filling pressure. Atmospheric pressure is the component resulting from transmitted atmospheric pressure to the brain, and therefore absolute ICP varies with altitude. This pressure is principally transmitted through the vasculature10; however, ICP is typically reported relative to atmospheric pressure, and this component is ignored.
As with any column of fluid, the skull and spinal canal experience hydrostatic pressure caused by the weight of their contents. The contribution of hydrostatic pressure depends on the weight of fluid and tissue above the point of measurement, divided by the cross-sectional area at that level. For example, lumbar CSF pressure is greater in the sitting position compared with the lateral decubitus position11,12 as a result of the hydrostatic difference; increasing degrees of head-down tilting further increase the contribution of hydrostatic pressure.
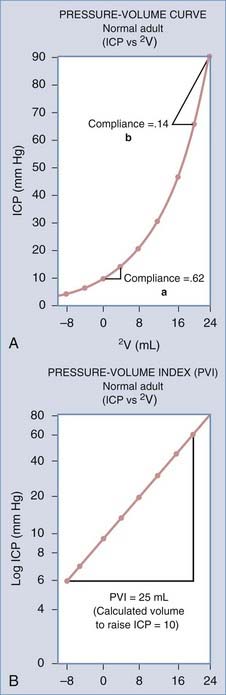
The filling pressure of the system is determined by the volume of the intracranial contents and the elastance of the enclosing structures. The intracranial contents consist of blood, brain, CSF, and any pathologic masses. Elastance is a system parameter that is defined by the pressure change per unit of volume change,13 namely, the corresponding pressure change for any given volume increase in craniospinal contents (Fig. 10-3A). The relationship is not necessarily linear across all volumes and not necessarily constant under all physiologic conditions. Compliance is the inverse of elastance, and both measures are useful for understanding the physiology of ICP. Elastance arises as a combined result of both distention and displacement. In other words, as volume is added to the system, there are two principal routes for compensation, either expansion or loss of volume. In a physiologic sense, this can occur either by distention of the spinal dura mater or by displacement of CSF and blood. These concepts are expounded on subsequently in the discussion of non–steady-state dynamics. Atmospheric pressure, hydrostatic pressure, and filling pressure all contribute to the concept of steady-state dynamics.
Steady-State Dynamics
General Physiology of the Cerebrospinal Fluid
In the adult, approximately 87% of the typically 1500-mL intracranial space is occupied by the brain, 9% by compartmental CSF (ventricles, cisterns, and subarachnoid space), and 4% by blood.14 The extracellular space is in direct contact with CSF and forms approximately 15% of the total brain volume.15 Total CSF is considered to include compartmental CSF and the extracellular space.
Cranial CSF volume as assessed in humans by Tanna and colleagues16 was found to have a mean of 164.5 mL, with a range of 62.2 to 267 mL. Ventricular volume also varies considerably, as assessed with magnetic resonance imaging, from 7.49 mL to 70.5 mL, with a mean of 31.9 mL. Reasons for such variation are not clear; however, the amount of CSF in any organism reflects a dynamic balance between production and clearance.
CSF is principally produced by the choroid plexuses, which are invaginations of the pia mater into the ventricular cavities, specifically in the roofs of the third and fourth ventricles and the walls of the lateral ventricles. At these points, fronds of densely branching blood vessels are invested by pia mater and covered by specialized ependymal cells, the choroidal epithelium. The surfaces of cells in this structure are densely covered with villous processes to increase the surface area. A second site of CSF production is the ventricular ependyma, the proportional contribution of which arguably ranges from 50% to 100%.17,18
For a considerable time, CSF was described as an ultrafiltrate of plasma, implying that hydrostatic pressure within blood vessels forced protein-free fluid through interendothelial spaces.19 However, close analysis of the composition of CSF (Table 10-1) shows multiple differences in composition at the ionic level, which is strongly against the idea of a simple filtration or dialysis process. CSF, in general, has a higher sodium, chloride, and magnesium concentration than one would expect in a plasma filtrate. The concentrations of potassium, calcium, urea, and glucose are lower. The overall osmolality is, however, similar. Current thinking therefore holds that a simple filtration process is modified by energy-dependent secretion and reabsorption processes.
TABLE 10-1 Concentrations of Solutes (mEq/kg H2O) in Plasma and Lumbar Cerebrospinal Fluid in Humans
| SUBSTANCE | PLASMA | CSF |
|---|---|---|
| Sodium (Na+) | 150 | 147 |
| Potassium (K+) | 4.63 | 2.86 |
| Magnesium (Mg2+) | 1.61 | 2.23 |
| Calcium (Ca2+) | 4.7 | 2.28 |
| Chloride (Cl−) | 99 | 113 |
| Bicarbonate (HCO3−) | 26.8 | 23.3 |
| Amino acids | 2.62 | 0.72 |
| Osmolality | 289.0 | 289.0 |
| pH | 7.397 | 7.30 |
Cl−, Na+, and K+ from Fremont-Smith F, Dailey ME, Merritt HH, et al. The equilibrium between cerebrospinal fluid and blood plasma: I. The composition of the human cerebrospinal fluid and blood plasma. Arch Neurol Psychiatry. 1931;25(6):1271-1289; Mg2+ and Ca2+ from Hunter G, Smith HV. Calcium and magnesium in human cerebrospinal fluid. Nature. 1960;186:161-162; HCO3− and pH from Bradley RD, Semple SJ. A comparison of certain acid-base characteristics of arterial blood, jugular venous blood and cerebrospinal fluid in man, and the effect on them of some acute and chronic acid-base disturbances. J Physiol. 1962;160:381-391; osmolality from Hendry EB. The osmotic pressure and chemical composition of human body fluids. Clin Chem. 1962;8:246-265.
Estimates of the rates of CSF production can be made experimentally by examining the clearance or turnover of injected substances,20 by marker dilution techniques,21 or by ventriculocisternal perfusion.22 Estimates with these techniques have yielded values in the range of 0.35 to 0.37 mL/min for humans.23,24 More recently, flow voids in magnetic resonance signal within the CSF system have been used to estimate CSF production rates. Feinberg and Mark25 estimated the flow of CSF through the aqueduct in humans, which should in principle equate to the flow of CSF secretion in the lateral and third ventricles, as 0.48 mL/min. There are variations in absolute rates of CSF production, however, that clearly relate to the absolute weight of choroid plexus tissue in each subject. Furthermore, rates of CSF production follow a diurnal variation, with peak production rates in the late evening and early morning.26
Because there is a constant production of CSF, there must be removal of CSF at the same rate. CSF circulates from choroid plexus, through the ventricles, to the cisterna magna, basal cisterns, and subarachnoid space. The principal site of physiologic CSF drainage is into the dural venous system, through the dural venous sinuses. Evaginations of the arachnoid membrane protrude into the lumen of the dural veins and form the arachnoid granulations or villi. This forms a valvular connection between the subarachnoid space and the dural sinus so that blood cannot reflux into CSF. A higher hydrostatic pressure in the subarachnoid space drives the bulk flow of fluid in the forward direction, therefore draining CSF volume. Studies of these structures have revealed that they can allow molecules up to several microns to pass, but only unidirectionally.27 CSF reabsorption has been shown to cease at CSF pressures of less than 5 mm Hg.23
Cerebrospinal Fluid Dynamics
The nonpulsatile volume of CSF at any point in time is dependent on a balance between the rate of formation, the rate of absorption, and the volume sink in the skull. The interactions between these parameters can be addressed by a mathematical model that analyzes the physiologic mechanisms of (1) CSF formation, (2) volume storage or compliance, and (3) fluid absorption (Fig. 10-4).28,29
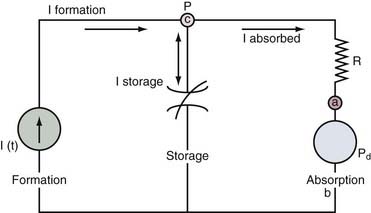

shows that the steady-state ICP is proportional to three parameters: (1) the rate of CSF formation, (2) the resistance to CSF absorption, and (3) the dural sinus pressure. When these parameters remain constant, ICP is unchanged, and the compliance element does not actively participate in ICP regulation.
An increase in CSF formation, outflow resistance, or venous pressure at the site of fluid absorption can alter this dynamic equilibrium and result in elevated ICP. Mathematical modeling has shown that the contribution of the product of CSF formation rate and outflow resistance (If × Ro) is approximately 10% of the total ICP.29 The remainder is attributed to the magnitude of the dural sinus pressure (Pd). With this distribution, the outflow resistance would have to increase markedly to cause a significant rise in the ICP. However, much smaller elevations of sagittal sinus pressure (Pd) caused by venous sinus obstruction would be transmitted directly to the CSF system, thus raising resting ICP. From the equation, it is clear that changes in these elements can occur independently of each other.
If Pd rises, CSF absorption can remain constant, and a shift to a new ICP equilibrium can occur. This concept is supported by the work of Johnston,30 who demonstrated normal CSF resistance in the presence of raised ICP induced by venous obstruction.4,30 In this case, there is no net change in the CSF volume and presumably no change in the compliance element.
Pulsation Models of Communicating Hydrocephalus: A New Concept
The pulsation of ICP has been the subject of study for many years. More recently, it has been considered to be an integral part of a new concept of hydrocephalus whereby the ICP pulse is more than a CSF reflection of the cardiac and respiratory pulsation. In the new concept, the flow of the arterial pulsations into the cranium is considered to be sequential, beginning from the large subarachnoid arteries at the skull base to the small arterioles in the parenchyma. Pulsations are dissipated into the subarachnoid CSF and into the choroidal arteries and ventricular CSF. These pathways are arranged in a series-parallel array of arteries and CSF spaces. The bulk flow of blood that remains after the pulsations have been filtered out continues through the capillary pathways and represents a windkessel mechanism.31 Most important, this model provides an alternative view to the “bulk flow theory” causing ventricular enlargement. Increased impedance to pulsations in the subarachnoid space increases pulsations in the blood flow to the choroidal arteries and the choroid plexus, thereby increasing the pulsations in the ventricular CSF. The ventricular pulsations exceed those in the subarachnoid space, and it is theorized that a transmantle pulse pressure gradient and subsequent ventricular expansion result. This theory is now being explored by mathematical models and experimental studies in the laboratory and in the clinical setting.32,33 Future work will focus on demonstrating that this model accounts for the pathologic changes seen in communicating hydrocephalus.
Non–Steady-State Dynamics
The most common clinical cause of raised ICP is traumatic brain injury, the pathology of which encompasses several possible VOTHERS. Brain edema contributes extra volume to the intracranial contents in the form of water. Trauma may induce intracerebral collections of blood in extradural, subdural, subarachnoid, or intraparenchymal locations, which each contribute extra volume. Furthermore, trauma may induce changes in VBLOOD as a result of disrupted autoregulation and hyperemia. The extent to which elevated CBV contributes to ICP after traumatic brain injury seems small, however, compared with edema.34
Subarachnoid hemorrhage after rupture of an intracranial aneurysm differs from other intracranial hemorrhage. Bleeding with arterial pressure can potentially cause ICP to rise instantaneously, and as ICP approaches the mean arterial blood pressure, bleeding slows, but cerebral perfusion pressure is critically low.35 The cause of this rise in ICP is a combination of intraparenchymal blood collection, increased CBV, and a strong vasomotor reaction to the ensuing injury.36
Other clinical conditions can result in an elevated ICP, including hydrocephalus, idiopathic intracranial hypertension, meningitis, and arteriovenous malformations. In several of these conditions, a direct addition of intracranial volume is not the primary cause. For example, in hydrocephalus, an impaired CSF drainage system causes CSF accumulation. The cause of elevated ICP in idiopathic intracranial hypertension is not known, although again, CSF production and drainage have been implicated as has elevated venous pressure.37 Meningitis can influence ICP in several patterns, either by blocking CSF drainage pathways or by stimulating marked cerebral edema. Arteriovenous malformation, in contrast, represents a significant increase in VBLOOD that can secondarily create VOTHER if it is involved in a hemorrhagic event.
Brain edema is a specific pathologic process arising in response to a wide range of cerebral pathologic changes. It is defined as an increase in the brain tissue water content and therefore can be thought of as contributing to VOTHER or VBRAIN. At the turn of the 20th century, Reichardt38 reported differences between a dry swollen brain and a wet edematous brain. Klatzo39 subsequently paved the way for all future discussions of edema by introducing the terms cytotoxic and vasogenic to indicate intracellular and extracellular water accumulation, respectively. The latter of these is traditionally associated with an open blood-brain barrier and fluid leakage. However, this division is a simplification for two reasons. First, for brain tissue water to rise, even under cytotoxic conditions, water has to enter the tissue from an external source, the most likely of which is blood vessels. Therefore, even cytotoxic edema has a “vasogenic” origin. It is the pathologic cause and the final site of edema accumulation that must distinguish these phenomena. Furthermore, studies in traumatic brain injury have suggested that the vasogenic component of injury may have been overemphasized40,41 and that the importance of a disrupted blood-brain barrier lies in the provision of a low-resistance pathway for movement of water to cells that are swelling cytotoxically.42 The predominance of traumatic cellular edema has been supported by studies in head-injured patients.43 Cytotoxic and vasogenic edema may not, therefore, be separable entities, and a recently proposed classification of edema based on the terms intact barrier and open barrier may have merit.44
Intracranial Pressure in Idiopathic “Normal-Pressure” Hydrocephalus
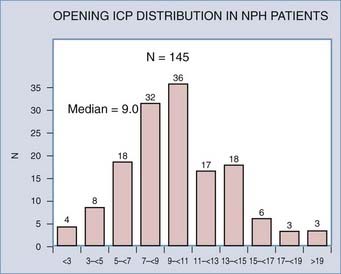
The term normal-pressure hydrocephalus was introduced in the thesis of Solomon Hakim in 1964 and the description later published in the landmark article by Adams and coworkers.45 Together, they are credited with describing a specific syndrome associated with patients in whom ventricular enlargement occurred in the absence of elevated ICP and who presented with gait disturbance, dementia, and incontinence. Current guidelines for diagnosis and management of idiopathic normal-pressure hydrocephalus are now available.46 According to these guidelines, the lumbar pressures for idiopathic normal-pressure hydrocephalus range from 60 to 240 mm H2O. This range was arrived by consensus in a meeting of experts on the basis of their experience and what was reported in the available literature. Later, in a study of 151 patients diagnosed with idiopathic normal-pressure hydrocephalus, it was confirmed that the lumbar pressure measured in these patients varied over a wide range47 (Fig. 10-5). Thus, the term normal-pressure hydrocephalus has been questioned as pressures varied considerably from the so-called normal pressure defined by Ekstedt.48 Interestingly, the median pressure found by Marmarou47 in patients with idiopathic normal-pressure hydrocephalus correlates well (9.0 mm Hg) with the value of the normal resting pressure by Ekstedt (10.0 mm Hg).
Pressure-Volume Relationships
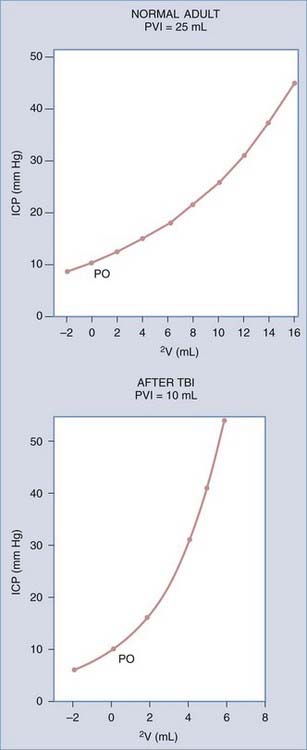
The relationship between intracranial volume and ICP is not linear. Volume-pressure relationships can be depicted by graphing the response of ICP to volume added into the neural axis (see Fig. 10-3). In the normal adult, Ryder and coworkers49 showed that this relationship describes a hyperbolic curve. Along the flat portion of the curve, increases in volume affect ICP minimally because compensatory mechanisms can effectively maintain ICP in a normal range. This part of the curve is called the period of spatial compensation. As volume is added, the pressure changes per unit volume become increasingly large, and compliance lessens; this portion is called the period of spatial decompensation. Above 50 mm Hg, and as ICP approaches mean arterial pressure, the curve tends to flatten again; thus, the complete curve is not hyperbolic but rather sigmoid.
The reciprocal of the slope of this curve (ΔV/ΔP) represents the compliance of the system, which is maximal in the period of spatial compensation. The slope of the pressure-volume curve rises rapidly during spatial decompensation, and therefore compliance falls. Another method of expressing information about compliance is to plot ICP logarithmically against volume, which gives a straight line.50 Its slope is the pressure-volume index (PVI), or the calculated volume in milliliters needed to raise ICP by a factor of 10 (Fig. 10-6A). In normal adults, PVI is 25 to 30 mL.51 When compliance is reduced by a pathologic process, PVI diminishes, and therefore small volume changes result in much greater pressure changes. Values less than 13 mL are considered clearly abnormal.52 PVI is age dependent, although normal infants have PVIs below 10 mL, and the adult PVI of 25 mL is reached at around 14 years of age.
PVI can be measured clinically by infusion or withdrawal of small boluses of fluid in the CSF space, with concomitant measures of the pressure response. CSF outflow resistance can also be calculated from the rate decay of the pressure peak after a bolus infusion. A complete description of resistance measurement techniques is found in the report of Eklund and colleagues.53 Methods of continuous PVI measurement have been devised with use of multiple time-averaged small-volume pulses.54 Although these methods generate less pressure perturbation, they tend to underestimate compliance as measured with the conventional technique.
These concepts become more complex, as do most models, when they are applied to clinical practice. Although short-term changes cause movement along a single pressure-volume curve, changing intracranial dynamics can create a new pressure-volume curve with time (Fig. 10-6B). Increases in CBV and cerebral edema are also likely to play a role in producing these dynamic pressure-volume interactions.55 Thus, knowledge of the absolute pressure coupled with some expression of the slope of the ICP volume curve at any given time point provides a more complete description of the stability or instability of ICP.
Effects of Elevated Intracranial Pressure
The autoregulatory reserve may be defined as the difference between the CPP at a given moment and the lower limit of autoregulation. Considering that the lower limit of autoregulation is within the range of 50 to 70 mm Hg, the autoregulatory reserve for a CPP of 90 would be 20 to 40 mm Hg. Thus, a CPP below the autoregulatory threshold exhausts the autoregulatory reserve.56–60 When CPP decreases, the wall tension of reactive brain vessels decreases, thereby increasing the transmission of the arterial pulse wave to the intracranial contents.61 Similarly, when a reduction of CPP is caused by increased ICP, brain compliance decreases,29,62 which also serves to increase pulsatile transmission. Taken in concert, a decrease in CPP results in an increase of both blood pressure and ICP pulsatility. This relationship is highly predictive for fatal outcome63 because as the ICP pulse amplitude levels off or starts to decrease, it implies that the cerebral vessels are no longer pressure reactive.
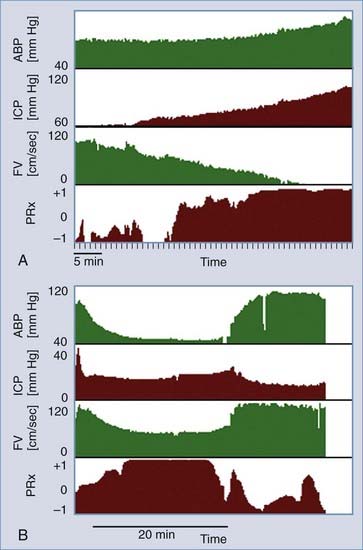
By use of these principles, it is clear that the correlation between spontaneous waves of blood pressure and ICP is dependent on the autoregulatory reserve. The correlation coefficient between changes in blood pressure and ICP is defined by Czosnyka61 as the pressure reactivity index. An example of the use of the pressure reactivity index is illustrated in Figure 10-7. Examples of time-related changes of the pressure reactivity index are shown, in which the index increases from relatively low values (no association) to values approaching 1.0 (strong positive association). These values were calculated from a period of 1-hour terminal increase in ICP from 60 to 90 mm Hg in a head-injured patient who died (Fig. 10-7A). Figure 10-7B illustrates a transient change in pressure reactivity index during the period of an ICP plateau wave with rapid recovery when ICP returned to baseline. In summary, the pressure reactivity index provides a practical means of assessing the degree of autoregulation and is useful in elucidating the contribution of the cerebrovasculature to mechanisms causing ICP rise.
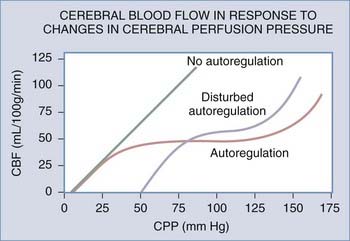
Furthermore, in many pathologic cases, autoregulation is disturbed so that the response curve is shifted to the right and is more linear (Fig. 10-8). This reduces the autoregulatory reserve for any given CPP. If the autoregulatory reserve is exhausted, CBF begins to fall, which ultimately causes tissue ischemia. Ischemia creates cytotoxic edema, which, in turn, contributes to the ICP elevation and low CPP. Clearly, a vicious circle of edema and ICP elevation can ensue if treatment attempts do not prevent this. A marked rise in ICP that will not respond to available treatments is called refractory ICP.
A second problem with increased ICP arises from the generation of pressure gradients.64,65 CSF will conduct the pressure generated by an increased volume in one region of the brain to others. There are specific anatomic sites where such pressure gradients may cause movement of brain tissue into an abnormal anatomic location—so-called herniation. Several types of herniation have been described, including downward transtentorial (central and uncal), subfalcine, upward transtentorial, and transforaminal.66 Each syndrome has a characteristic clinical correlate.
Symptoms and Signs of Elevated Intracranial Pressure
Vital signs may also change under conditions of elevated ICP. The Cushing response, defined as arterial hypertension and bradycardia, arises as a result of either generalized central nervous system ischemia or local ischemia due to pressure on the brainstem.67 Bradycardia is possibly mediated by the vagus nerve and can occur independently of hypertension. Abnormal respiration may also arise,68 depending in part on the anatomic location of any lesion. Cheyne-Stokes respiration arises from damage to the diencephalic region, and sustained hyperventilation occurs in patients with dysfunction of the midbrain and upper pons.69 Midpontine lesions cause slow respiration; pontomedullary lesions result in ataxic respirations; upper medullary lesions cause rapid, shallow breathing; and with greater medullary involvement, ataxic breathing predominates.
Herniation Syndromes
Tissue herniation is the most serious complication of raised ICP. Central herniation and uncal herniation cause the central syndrome and the uncal syndrome, respectively.70 The central syndrome displays progressive dysfunction of structures in a rostral to caudal direction. Diencephalic structures are involved early, which may cause a change in behavior or even loss of consciousness. Diencephalic involvement also alters respiration, causing interruptions of sighing, yawning, or pausing; Cheyne-Stokes respiration may appear. Pupils become small, with a poor reactivity to light. A unilateral lesion can cause contralateral hemiparesis, with ipsilateral paratonia and decorticate responses. With progressive midbrain involvement, respiration becomes tachypneic, and the pupils fall into a midline fixed position. Internuclear ophthalmoplegia may arise, and motor examination will show bilateral decerebrate posturing. As the pons becomes involved, respiration remains rapid and shallow. Motor examination reveals flaccid extremities with bilateral extensor plantar responses. With progressive medullary involvement, respiration slows and becomes irregular with prolonged sighs or gasps. As hypoxia ensues, the pupils dilate, and brain death follows shortly thereafter.
In sharp contrast, the uncal syndrome often begins with a unilaterally dilated and poorly reactive pupil, which can arise even in the presence of a normal conscious level. The pupil will then fully dilate with external oculomotor ophthalmoplegia. If midbrain compression ensues, consciousness may be impaired, followed by contralateral decerebrate posturing. On occasion, posturing or hemiparesis may occur ipsilateral to the lesion as a result of pressure on the contralateral cerebral peduncle on the edge of the tentorium cerebelli.71 If the uncal syndrome is allowed to progress, extensor plantar response appears bilaterally, along with dilation of the contralateral pupil. Finally, patients will develop hyperpnea, midposition pupils, impaired oculovestibular response, and bilateral decerebrate rigidity. From this point, progression is as for the central syndrome.
Intracranial Pressure Monitoring
Several published clinical trials show that monitoring of ICP, under situations in which ICP may be high, either facilitates outcome or promotes aggressive management.72–74 There is strong clinical evidence that careful control of ICP is important,75 and maintaining CPP under many different pathologic circumstances is of benefit for outcome.60 An understanding of the indications for initiation of monitoring and the methods by which this can be done is important.
Initial work on direct monitoring of ICP by ventricular puncture was performed by Guillaume and Janny4 and by Lundberg.5 In Lundberg’s classic report, he described three basic patterns of ICP waveform: A waves (plateau waves), B waves, and C waves (Fig. 10-9).
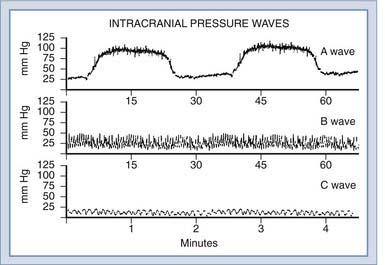
A waves, or plateau waves, are characterized by increases of ICP that are sustained for several minutes and then return spontaneously to a new baseline, which is usually slightly higher than the preceding one. Lundberg postulated that A waves are a result of an increase in cerebrovascular blood volume due to vasodilation. Rosner76,77 has postulated that these plateau waves are a normal compensatory response to decreases in CPP, and therefore effective management involves the use of vasopressors. Other more recent studies have suggested that vasopressors may enhance lesion size and edema formation.78,79 The plateau wave itself is proposed to consist of four phases, called the drift phase, the plateau phase, the ischemic response phase, and the resolution phase.76 The drift phase is characterized by a decline in CPP, which triggers vasodilation. This vasodilation increases ICP to the plateau level, for the plateau phase. This sudden reduction in CPP causes a degree of cerebral ischemia that triggers brainstem vasomotor centers to mount a Cushing response (ischemic response phase), which, in turn, restores CPP in the resolution phase.
Lundberg B waves are short elevations of a modest nature (10 to 20 mm Hg) that occur at a frequency of 0.5 to 2 Hz and are thought to relate to vasodilation secondary to respiratory fluctuations in PaCO2. However, they are seen in ventilated patients, who in theory should have a constant PaCO2; therefore, they are of only questionable clinical significance. Transcranial Doppler studies in humans have shown that B waves occur secondary to intracranial vasomotor waves, causing variations in CBF.80 The physiologic basis for this cyclic change in vasomotor tone is not clear. B waves are believed to reflect increased ICP in a qualitative manner, as is the case with C waves, which are more rapid sinusoidal fluctuations occurring approximately every 10 seconds, corresponding to Traube-Hering-Mayer fluctuations in arterial pressure.
Intracranial hypertension is found in 40% to 60% of severe head injuries and is a major factor in the deaths of 50% of all fatalities.81 Data from the Traumatic Coma Data Bank have shown that the proportion of hourly ICP recordings above 20 mm Hg is highly significant in predicting outcome.82 The role of ICP monitoring in adult brain trauma is clear; however, the role in nontraumatic settings depends on the nature and severity of the disease process. Management of intracranial hypertension may be beneficial in Reye’s syndrome83 and other causes of fulminant hepatic failure,84 although the complication rate is higher in these conditions.85 In the case of intracranial tumors, ventricular catheters can provide temporary therapeutic ventricular decompression before and after resection of the tumor along with a rational means of testing the reestablishment of normal CSF pathways in the early postoperative period. The role of monitoring in metabolic encephalopathies, cerebral infarction, or diffuse cerebritis is less clear.
After trauma in adults, guidelines for ICP monitoring include a Glasgow Coma Scale score of 3 to 8 and an abnormal computed tomographic scan. In the presence of a normal computed tomographic scan, two or more of the following should prompt monitoring anyway: age older than 40 years, unilateral or bilateral motor posturing, or systolic blood pressure below 90 mm Hg.86 Patients with a Glasgow Coma Scale score greater than 8 may benefit from ICP monitoring if computed tomographic scans demonstrate significant mass lesions or treatment is required for associated injuries.
Methods of Intracranial Pressure Measurement
Ventriculostomy coupled with a pressure transducer remains the “gold standard” for monitoring of ICP because of accuracy and ease of calibration. Access to CSF for dynamic testing and drainage to control ICP are additional benefits. Disadvantages are that catheter placement can be difficult when the ventricles are small or shifted from the midline, and the risk of infection rises in ventriculostomies after 5 days, although this risk can be lessened by tunneling the catheter under the skin. Current estimates have associated intraventricular monitoring with less than 2% hemorrhagic complications87 and less than 10% infective complications.88–91 Changing the catheter at regular intervals does not appear to reduce the infection rate.89 Parenchymal monitors, in contrast, have less than 1% infective complications.73
Alternative methods of monitoring ICP include the subarachnoid bolt,92 subdural catheter, epidural transducer,93 and fiberoptic microtransducer.94 The bolt and epidural transducer, although less invasive, are prone to inaccuracy because of their physical characteristics.95–97 Fiberoptic catheter-transducers cannot be recalibrated externally; however, their accuracy in practice has proved excellent,98 they are easy to place, and the complication rate is low because of their small size and lack of fluid coupling. All intraparenchymal monitors may be prone to regional inaccuracy, depending on their placement in relation to the site of any lesion,99 given that elevated ICP may be regional. The choice of which measurement method to use should be based on the presentation of the patient and the planned treatment. There is no defined reference level for the use of transducers in the intensive care unit; however, the device is typically zeroed at the level of the foramen of Monro, using the external acoustic meatus as an anatomic landmark.
There is no uniform agreement about the critical level of ICP beyond which treatment is mandatory. Saul and Ducker74 demonstrated benefits by treating ICP above 15 mm Hg compared with a group of patients treated for ICP above 25 mm Hg. Marmarou and colleagues82 examined data from 428 patients and calculated the ICP threshold most predictive of 6-month outcome by logistic regression. The threshold that correlated best was 20 mm Hg, and this is the current level at which most centers begin treatment. Current opinion now regards CPP as the critical parameter that should be monitored in concert with ICP.
Management of Intracranial Pressure

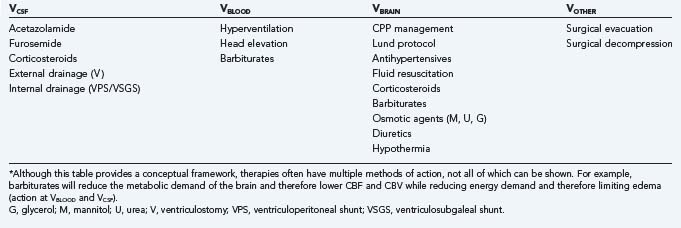
provides a conceptual framework by which to consider the components of intracranial volume responsible for non–steady-state ICP situations and allows treatment to be directed in a focused manner (Table 10-2).
TABLE 10-2 Therapeutic Modalities for the Reduction of Raised Intracranial Pressure by the Intracranial Compartment of Action*
VCSF
Permanent internal CSF diversion by ventriculoperitoneal shunt is attended by a full array of indications, technical considerations, and risks. Third ventriculostomy by both stereotactic and endoscopic techniques has been repopularized recently.100 This technique offers an alternative in certain situations without the potential risks inherent in standard ventriculoperitoneal shunting.
When mechanical methods of CSF diversion are not possible or desirable, adjunctive therapy with medications such as acetazolamide, furosemide, and corticosteroids can transiently decrease CSF production. Acetazolamide, which inhibits carbonic anhydrase–mediated CSF production, is used most frequently. Reductions of CSF production by 16% to 66% have been achieved.24 Synergy has been reported when acetazolamide is combined with furosemide.101 Acetazolamide also has a cerebral vasodilator effect, which may transiently worsen intracranial hypertension, and so its use is contraindicated in patients with closed head injury.102
VBLOOD
Extremes of CBF, both low and high, have been seen in patients with poor outcome after head injury.103–106 Bouma and coworkers107 showed that measurements of CBF performed within 6 hours of severe head trauma (Glasgow Coma Scale score ≤ 8) are reduced (22.5 ± 5.2 mL/l00 g per minute) and correlate well with Glasgow Coma Scale score and eventual outcome. These findings are more common in patients with bilateral diffuse injuries than in patients with mass lesions, who tend to have higher global CBF in the hemisphere of the mass lesion. Between 45% and 65% of head injury victims will exhibit hyperemia in the 12 to 24 hours after injury.108–110 The increase in CBF is presumably accompanied by increased CBV, which may contribute to intracranial hypertension. Increased CBF and CBV are seen in the acute encephalopathy of Reye’s syndrome as well. Clearly, ischemia and hyperemia are not constant phenomena but rather dynamically changing under the influence of several factors. In general, CBF tends to stabilize by 36 to 48 hours after injury.103,105,108,111
This complex interplay of factors affecting VBLOOD makes rational treatment difficult. The association among CBF, cerebral metabolic rate of oxygen, arteriovenous oxygen difference, and clinical parameters (ICP, Glasgow Coma Scale score, and outcome) is more easily documented by multivariate analysis than it is explained in terms of physiologic cause and effect. In general terms, as ICP increases, arteriovenous oxygen difference usually rises because of reductions in venous PO2 caused by greater oxygen extraction. CBV increases with vasodilation in response to lowered CPP or a rise in PaCO2. Hyperventilation therefore decreases total intracranial blood volume as hypocapnic vasoconstriction moves blood from the pial circulation to the veins and sinuses. Reductions of the cerebral metabolic rate of oxygen are seen after trauma, but these reductions may not reflect the energy demands of the injured brain. Some have attributed these reductions to mitochondrial incapacities or enzymatic deficits that render the neuron incapable of using oxygen.107,112
Understanding the role of CBF and CBV in situations of elevated ICP is hindered by difficulties in measuring CBF. Global CBF obtained by the Kety-Schmidt method includes the white matter but lacks anatomic information. Regional CBF determined by the xenon Xe 133 inhalation method largely ignores the contribution of the white matter, and focal areas of ischemia can be missed if they are surrounded by zones of relatively high flow.113 Magnetic resonance imaging–based measures of cerebral perfusion may yield accurate anatomic information but suffer from a degree of time averaging and lack of widespread availability. A further problem relates to differential sensitivities of structures to reduced flow. For example, the hippocampus may be acutely sensitive to even mild ischemia, whereas diminished CBF in the brainstem does not correlate with clinical estimates of brainstem function.58
Although every effort should be made to prevent cerebral ischemia in the face of intracranial hypertension, treatment of hyperemia or increased CBV may be dangerous until more is understood about these pathophysiologic processes. However, some success has been reported with therapy that reduces CBV.114,115 The most efficacious methods are hyperventilation and elevation of the head. Hyperventilation causes constriction of pial vessels when blood vessels retain CO2 responsivity. Pressure autoregulation is frequently lost after head injury; however, CO2 responsivity can be preserved in the absence of pressure autoregulation, and its prolonged loss is considered a grave sign.116 In adults, a 1-torr change in PaCO2 is associated with a 3% change in CBF. Thus, vasoconstriction reduces CBV and therefore lowers ICP.
In addition to its effects on cerebrovascular tone, hyperventilation induces tissue alkalosis, which can buffer the intracellular and CSF acidosis seen after severe head injury.117 However, the benefits of hyperventilation may be short-lived, and higher levels can cause vasoconstriction sufficient to produce cerebral ischemia mediated through a mechanism that involves the loss of the CSF bicarbonate buffer.118,119 In a randomized, prospective trial of head-injured patients, Muizelaar115 showed that hyperventilation to a PaCO2 of 25 ± 2 in patients with a Glasgow motor scale of 4 or 5 resulted in Glasgow outcome scores at 6 months that were significantly worse than those in controls. Consequently, only moderate hyperventilation is necessary (32 to 35 torr), which is thought to be sufficient to avoid ischemic effects.
Some have advanced the concept of “inverse steal” to explain the risk of hyperventilation-induced ischemia. In patients with intact or supersensitive CO2 responsivity, hypocapnia can lead to shunting of blood from high-resistance, maximally constricted vessels to low-resistance, dilated vessels that lack CO2 responsivity.120 These areas may be so severely damaged as to have low oxygen demand; thus, hyperventilation may tend to redistribute blood from viable tissue into nonviable tissue. When possible, these investigators recommend that arteriovenous oxygen difference and CBF be monitored along with ICP121 and that hyperventilation be performed cautiously in patients with evidence of cerebral ischemia. When hyperventilation is discontinued, it should be tapered during 24 to 48 hours. Abrupt discontinuation can cause vasodilation as the extracellular pH falls, resulting in ICP elevations.122,123
Elevation of the head to 30 degrees decreases ICP by facilitating adequate venous drainage and possibly CSF drainage also. This degree of elevation does not alter CPP.124 Feldman and associates125 demonstrated the beneficial effects of head elevation on ICP clinically. In this study, CPP and CBF seemed unaffected by head position until the head was elevated to 60 degrees. Rotation of the head or flexion of the neck can also impair jugular venous flow and raise ICP.126 Therefore, an effort should be made to maintain the head in a neutral position.
An intuitive mechanism by which CBV should be lowered is to lower mean arterial blood pressure and therefore CPP. This principle, coupled with a reduction of hydrostatic forces in damaged capillary beds, underlies the Lund protocol for raised ICP, which advocates reduced CPP, precapillary vasoconstriction with dihydroergotamine, and maintenance of plasma osmolarity with albumin infusion.127 Initial clinical trials of this approach yielded outcomes no worse than those of more conventional techniques.128
This protocol, however, is in stark contrast to the principles of CPP management, which promulgate that low CPP stimulates arteriolar vasodilation, causing increases in both CBV and ICP. By elevation of CPP with vasopressors, the blood vessel will be stimulated by the mechanisms of pressure autoregulation to vasoconstrict, consequently reducing the CBV and ICP.60 This argument appears to hold only when pressure autoregulation is intact. Rosner also proposes that in many cases in which loss of pressure autoregulation is seen, the mechanism is not lost; rather, the curve is shifted to the right (see Fig. 10-8). By giving pressors, the vessel is manipulated back into a state in which it can autoregulate. If this is true, the real challenge is presented in distinguishing those brains that will benefit from CPP management. The possible risks of pressor therapy in areas in which the blood-brain barrier may be incompetent are unresolved. Several studies have questioned the safety of their use129 and demonstrated ways in which pathologic changes can be worsened.78,79
VBRAIN
Control of systemic and cerebrovascular hypertension is especially important when intracranial hypertension exists or when cerebral autoregulation is impaired. The choice of antihypertensive drugs in patients with increased ICP is important. Hirose and coworkers and others showed that nifedipine, chlorpromazine, and reserpine decreased mean arterial pressure and increased ICP, thereby reducing CPP.130–132 These findings were more pronounced when ICP exceeded 40 mm Hg. In the same studies, thiopental decreased mean arterial pressure and ICP, leaving CPP unchanged, but caused respiratory depression, necessitating intubation and mechanical ventilation. Sodium nitroprusside is commonly used now for rapid control of blood pressure in adult critical care; however, despite its highly efficacious action, prolonged use is not considered safe because of a risk of cyanide ion toxicity.
In a laboratory study using inflated balloons to produce intracranial hypertension, sodium nitroprusside, nitroglycerin, and trimetaphan were used to reduce mean arterial pressure by 20%. All three drugs reduced regional CBF and CO2 responsivity, leading the authors to recommend caution in their use for blood pressure control in patients with increased ICP. Propranolol has been shown to be superior to hydralazine for control of hypertension in head-injured patients because propranolol decreases both cardiac demands and serum levels of epinephrine and norepinephrine.133
The choice of fluid resuscitation in the head-injured patient is critical. Approximately 10% to 15% of head-injured patients are hypotensive because of either the injury itself or associated injuries.134 Aggressive correction of shock improves survival and clinical outcome; however, the osmolality of the blood has important implications for ICP. Isotonic fluids (e.g., 5% dextrose, 0.45% normal saline, 0.9% normal saline, and lactated Ringer’s solution) are in regular use, but hypotonic solutions have the potential to worsen cerebral edema. Hypertonic solutions have been advocated as a possible therapy for elevated ICP. Certainly, bolus doses of hypertonic saline appear to be beneficial135; however, fluid replacement therapy with hypertonic saline has been shown to be both beneficial and detrimental for ICP in different studies.136,137
Controversy exists as to whether colloids (molecular weight >8000 D) are more beneficial than crystalloids for fluid resuscitation. Some authors have found no difference, whereas Tranmer138 showed a definite advantage with use of the colloid hetastarch. In a laboratory model of vasogenic edema, treatment with colloid for 2 hours after injury produced no change in ICP, whereas infusions of normal saline and 5% dextrose in water led to elevations in ICP of 91% and 141%, respectively.
A second goal of treating ICP is to improve neuronal and axonal function and survival. A variety of agents have been tried,139–148 some of which were able to influence cerebral edema formation (for review, see Smith and colleagues149). Despite reasonable experimental success, no compound has yet been found to be of clinical benefit in limiting edema formation.
Steroids and barbiturates have been widely used for treatment of both vasogenic and cytotoxic edema; however, neither is wholly effective, and both have attendant problems. Steroids are of unquestionable value in the treatment of edema with brain tumors, but no definite benefits have been shown when they are used in patients with head injury.150–155 A study has also indicated that the newer configurations of steroids, the 21-amino steroids or lazaroids, are also without beneficial effect in traumatic brain injury.156 The mode of action of steroids in cerebral tumors is not clear, but dramatic effects on both edema157 and function158,159 can be seen. Corticosteroids have been shown to have widespread effects on membrane lipid hydrolysis and peroxidation, processes that are thought to be important for development of injury.160–163
Use of steroids in subarachnoid hemorrhage has no proven benefit, but angiographically demonstrable vasospasm can be decreased by their use.164 In cases of cerebral ischemia, steroids worsen outcome either by means of a direct glucocorticoid toxicity or as a consequence of elevated serum glucose levels, which exacerbate ischemic lactic acidosis.165,166
Barbiturates are useful in a wide range of situations by decreasing the cerebral metabolic rate of oxygen, thus permitting tolerance of a degree of ischemia or anoxia not otherwise acceptable on the cellular level. This, in turn, lowers demand for CBF, which therefore tends to lower CBV and consequently ICP. Barbiturates seem to have maximal effect in situations in which CBF is greater than metabolism. In addition, Messeter and associates167 have shown that preservation of cerebral CO2 responsivity can predict the response of ICP to iatrogenic barbiturate coma. When CO2 responsivity was normal, barbiturates reduced CBF and normalized ICP in 75% of patients. When this response was reduced or absent, CBF was unchanged or increased, and ICP was reduced in only 20% of patients. Pentobarbital has proved more effective at control of ICP than phenobarbital or thiopental sodium.
Barbiturates are effective at reducing ICP, but in many studies they have not been shown to improve outcome.168 Even prophylactic use of barbiturates has not improved outcome or led to easier control of ICP.169 Considering the risks of high-dose barbiturates, their application is most appropriate for patients in whom conventional measures to control ICP have failed. Usually, a bolus of pentobarbital (5 to 10 mg/kg) is administered during 30 minutes, followed by a continuous hourly maintenance infusion of 1 to 5 mg/kg to achieve a serum concentration of 3.5 to 4.5 mg/100 mL170 or 10 to 20 seconds of burst suppression monitored by bedside electroencephalography. Despite maintenance of normal blood volume and cardiac output, hypotension occurs in 50% of cases and is probably due to decreased peripheral vascular resistance. Volume expansion in addition to dopamine may be necessary to restore systemic blood pressure while maintaining the desired level of suppression. Other potential complications related to high-dose barbiturates include hyponatremia, pneumonia, and cardiac depression.
Barbiturates are anticonvulsant; however, as mentioned before, they should not be used unless all other options have been exhausted. Other prophylactic anticonvulsants, however, should be given. The incidence of seizures is 4% to 25% after injury and 50% after penetrating injuries.171 Seizures may increase ICP by several factors, including an increased metabolic demand, Valsalva maneuver, and release of excitotoxins.
Finally, VBRAIN can be reduced by increasing the clearance of edema. Both osmotic and loop diuretics are widely used and can treat both vasogenic and cytotoxic edema.172–174 Osmotic agents increase serum osmolality and create an osmotic gradient between the serum and brain. This effect draws free water from the brain into the intravascular compartment along the osmotic gradient. This is thought both to prevent edema formation and to speed clearance. However, osmotic agents transiently increase CBF independent of their effect on ICP, so their use in the presence of hyperemia and increased CBV may be contraindicated.
The drugs used most commonly for increasing intravascular osmolality are mannitol, urea, and glycerol. Mannitol (20% solution) is usually the agent of choice. Mannitol has a rapid effect on ICP, and it is therefore thought that a second mechanism of action may involve the rheologic characteristics of blood. Mannitol increases plasma volume, decreases hematocrit, and decreases blood viscosity, which can cause a vasoconstriction and a drop in ICP.175–177
The dose of mannitol is 0.25 to 1 g/kg, and this can be given as a repeated bolus or, in smaller doses, as a continuous infusion. Complications with osmotic therapy are dehydration, electrolyte imbalance, and, with extreme hyperosmolarity, renal failure. Fluid replacement is aimed at preserving isovolemia while increasing serum osmolality. Osmolality should not exceed 320 mOsm/kg because the renal tubule can be easily injured, especially if other nephrotoxic drugs are used concomitantly. Maintenance of high serum mannitol levels can lead to penetration of mannitol into injured brain,178 especially in areas of blood-brain barrier deficiency. In this case, the osmolality of brain tissue will tend to draw water into the tissue and worsen edema.179
Mannitol is used more commonly than urea (30% solution) and glycerol (10% solution) because plasma and brain concentrations tend to equilibrate more rapidly with urea and glycerol than with mannitol. Glycerol can also cause hemolysis and renal failure when it is administered parenterally.180 Because glycerol is metabolized, hyperosmolality lasts for less time than with mannitol. In one study comparing mannitol and glycerol, glycerol was less effective in reducing ICP.181
Loop diuretics such as furosemide and ethacrynic acid can be used in conjunction with mannitol to control ICP associated with edema.182,183 Furosemide works synergistically with mannitol to remove free water and is most appropriate in patients with fluid overload. The addition of furosemide increases the likelihood of dehydration and loss of potassium.102 Although furosemide decreases CSF production, this effect probably does not contribute greatly to lowering of ICP in the acute setting.
Hypothermia was first reported for treatment of brain injury in the mid-20th century.184–187 Recent reports have suggested a beneficial effect on ICP. Shiozaki and coworkers187 found a statistically significant reduction in ICP in a group of severely injured patients with intracranial hypertension refractory to other treatment, including barbiturates. Marion and colleagues188 also demonstrated that hypothermia could lower ICP and improve patient outcome at 3 and 6 months after injury. The ability of hypothermia to lower ICP probably relates to a depression of cerebral metabolic requirements as with barbiturates, coupled with a slowing of injurious cellular events (e.g., lipid peroxidation).
Practical Issues
The key step in the treatment of intracranial hypertension is to recognize a treatment response and not to labor a therapeutic modality that is ineffectual. It is clear that patients respond differently to different therapies.189 Furthermore, their response may change over time because the pathologic status of the injured brain can alter rapidly. Consequently, the stepwise framework should be followed less than rigidly, and treatment should be primarily tailored around the response of the ICP.
Acknowledgments
This research was supported by NIH/NINDS R01 NS19235.
We also thank Caroline Dermer for her assistance in the preparation of this manuscript.
Avezaat CJ, van Eijndhoven JH, Wyper DJ. Cerebrospinal fluid pulse pressure and intracranial volume-pressure relationships. J Neurol Neurosurg Psychiatry. 1979;42:687-700.
Barzó P, Marmarou A, Fatouros P, et al. Contribution of vasogenic and cellular edema to traumatic brain swelling measured by diffusion-weighted imaging. J Neurosurg. 1997;87:900-907.
Beaumont A, Marmarou A, Hayasaki K. The permissive nature of blood brain barrier opening in edema formation following traumatic brain injury. Acta Neurochir Suppl. 2000;76:125-129.
Czosnyka M, Kirkpatrick PJ, Pickard JD. Multimodal monitoring and assessment of cerebral haemodynamic reserve after severe head injury. Cerebrovasc Brain Metab Rev. 1996;8:273-295.
Egnor M, Zheng L, Rosiello A, et al. A model of pulsations in communicating hydrocephalus. Pediatr Neurosurg. 2002;36:281-303.
Ekstedt J. CSF hydrodynamic studies in man. 2 . Normal hydrodynamic variables related to CSF pressure and flow. J Neurol Neurosurg Psychiatry. 1978;41:345-353.
Ito J, Marmarou A, Barzó P, et al. Characterization of edema by diffusion-weighted imaging in experimental traumatic brain injury. J Neurosurg. 1996;84:97-103.
Madsen JR, Egnor M, Zou R. Cerebrospinal fluid pulsatility and hydrocephalus: the fourth circulation. Clin Neurosurg. 2006;53:48-52.
Marion DW, Obrist WD, Carlier PM, et al. The use of moderate therapeutic hypothermia for patients with severe head injuries: a preliminary report. J Neurosurg. 1993;79:354-362.
Marmarou A. Theoretical and experimental evaluation of the cerebrospinal fluid system [PhD thesis]. Philadelphia: Drexel University; 1973.
Marmarou A, Bergsneider M, Relkin N, et al. Development of guidelines for idiopathic normal-pressure hydrocephalus: introduction. Neurosurgery. 2005;57:S1-S3.
Marmarou A, Shulman K, Rosende RM. A nonlinear analysis of the cerebrospinal fluid system and intracranial pressure dynamics. J Neurosurg. 1978;48:332-344.
Marmarou A, Signoretti S, Fatouros PP, et al. Predominance of cellular edema in traumatic brain swelling in patients with severe head injuries. J Neurosurg. 2006;104:720-730.
Maset AL, Marmarou A, Ward JD, et al. Pressure-volume index in head injury. J Neurosurg. 1987;67:832-840.
Rosner MJ, Rosner SD, Johnson AH. Cerebral perfusion pressure: management protocol and clinical results. J Neurosurg. 1995;83:949-962.
Wagshul ME, Chen JJ, Egnor MR, et al. Amplitude and phase of cerebrospinal fluid pulsations: experimental studies and review of the literature. J Neurosurg. 2006;104:810-819.
1 Monro A. Observations on the structure and functions of the nervous system. Edinburgh: William Creech & Johnson; 1783.
2 Kellie G. An account of the appearances observed in the dissection of two of three individuals presumed to have perished in the storm of the 3rd, and whose bodies were discovered in the vicinity of Leith on the morning of the 4th, November. 1821; with some reflections on the pathology of the brain. Trans Med Chir Soc Edinb. 1824;1:84-169.
3 Quincke H. Lumbar puncture. In: Church A, editor. Modern Clinical Medicine, Diseases of the Nervous System. New York: D. Appleton; 1911:223-257.
4 Guillaume J, Janny P. Manometric intracranienne continue interet de la method et premiers resultats. Rev Neurol (Paris). 1951;84:131-142.
5 Lundberg N. Continuous recording and control of ventricular fluid pressure in neurosurgical practice. Acta Psychiatr Neurol Scand. 1960;36(Suppl 49):1-193.
6 Dunbar HS, Guthrie TC, Karpell B. A study of the cerebrospinal fluid pulse wave. Arch Neurol. 1966;14:624-630.
7 Hamer J, Alberti E, Hoyer S, et al. Influence of systemic and cerebral vascular factors on the cerebrospinal fluid pulse waves. J Neurosurg. 1977;46:36-45.
8 Gega A, Utsumi S, Iida Y. Analysis of the wave pattern of CSF pulse wave. In: Shulman K, Marmarou A, Miller JD, editors. Intracranial Pressure IV. Berlin: Springer-Verlag; 1980:188-190.
9 Cardoso ER, Rowan JO, Galbraith S. Analysis of the cerebrospinal fluid pulse wave in intracranial pressure. J Neurosurg. 1983;59:817-821.
10 Pollock LJ, Boshes B. Cerebrospinal fluid pressure. Arch Neurol Psychiatry. 1999;36:931-974.
11 Magnaes B. Body position and cerebrospinal fluid pressure. Part 1: clinical studies on the effect of rapid postural changes. J Neurosurg. 1976;44:687-697.
12 Magnaes B. Body position and cerebrospinal fluid pressure. Part 2: clinical studies on orthostatic pressure and the hydrostatic indifferent point. J Neurosurg. 1976;44:698-705.
13 Miller JD. Volume and pressure in the craniospinal axis. Clin Neurosurg. 1975;22:76-105.
14 Rosomoff HL. Methods for simultaneous quantitative estimation of intracranial contents. J Appl Physiol. 1953;16:395-396.
15 Nicholson C, Phillips JM. Ion diffusion modified by tortuosity and volume fraction in the extracellular microenvironment of the rat cerebellum. J Physiol (Lond). 1981;321:225-257.
16 Tanna NK, Kohn MI, Horwich DN, et al. Analysis of brain and cerebrospinal fluid volumes with MR imaging: impact on PET data correction for atrophy. Part II. Aging and Alzheimer dementia [see comments]. Radiology. 1991;178:123-130.
17 Welch K. Secretion of cerebrospinal fluid by choroid plexus of the rabbit. Am J Physiol. 1963;205:617-624.
18 Oppelt WW, Patlak CS, Rall DP. Effect of certain drugs on cerebrospinal fluid production in the dog. Am J Physiol. 1964;206:247-250.
19 Mestrezat W. Le liquide cephalo-rachidien normal et pathologique. Valeur clinique de l’examen chimique. In: Syndromes humoraux dans les diverse affections. Paris: Maloine; 1912:261-263.
20 Davson H. A comparative study of the aqueous humour and cerebrospinal fluid in the rabbit. J Physiol. 1955;129:111-133.
21 Bradbury MWB, Davson H. The transport of urea, creatinine and certain monosaccharides between blood and fluid perfusing the cerebral ventricular system of rabbits. J Physiol. 1964;205:195-211.
22 Pappenheimer JR, Heisey SR, Jordan EF, et al. Perfusion of the vertebral ventricular system in unanesthetized goats. Am J Physiol. 1962;200:1-10.
23 Cutler RW, Page L, Galicich J, et al. Formation and absorption of cerebrospinal fluid in man. Brain. 1968;91:707-720.
24 Rubin RC, Henderson ES, Ommaya AK, et al. The production of cerebrospinal fluid in man and its modification by acetazolamide. J Neurosurg. 1966;25:430-436.
25 Feinberg DA, Mark AS. Human brain motion and cerebrospinal fluid circulation demonstrated with MR velocity imaging. Radiology. 1987;163:793-799.
26 Nilsson C, Ståhlberg F, Thomsen C, et al. Circadian variation in human cerebrospinal fluid production measured by magnetic resonance imaging. Am J Physiol. 1992;262:R20-R24.
27 Welch K, Pollay M. Perfusion of particles through arachnoid villi of the monkey. Am J Physiol. 1961;201:651-654.
28 Marmarou A. Theoretical and experimental evaluation of the cerebrospinal fluid system [PhD thesis]. Philadelphia: Drexel University; 1973.
29 Marmarou A, Shulman K, Rosende RM. A nonlinear analysis of the cerebrospinal fluid system and intracranial pressure dynamics. J Neurosurg. 1978;48:332-344.
30 Johnston I. Reduced C.S.F. absorption syndrome. Reappraisal of benign intracranial hypertension and related conditions. Lancet. 1973;2:418-421.
31 Egnor M, Zheng L, Rosiello A, et al. A model of pulsations in communicating hydrocephalus. Pediatr Neurosurg. 2002;36:281-303.
32 Madsen JR, Egnor M, Zou R. Cerebrospinal fluid pulsatility and hydrocephalus: the fourth circulation. Clin Neurosurg. 2006;53:48-52.
33 Wagshul ME, Chen JJ, Egnor MR, et al. Amplitude and phase of cerebrospinal fluid pulsations: experimental studies and review of the literature. J Neurosurg. 2006;104:810-819.
34 Marmarou A, Barzo P, Fatouros P, et al. Traumatic brain swelling in head injured patients: brain edema or vascular engorgement? Acta Neurochir Suppl (Wien). 1997;70:68-70.
35 Nornes H. The role of intracranial pressure in the arrest of hemorrhage in patients with ruptured intracranial aneurysm. J Neurosurg. 1973;39:226-234.
36 Nornes H, Magnaes B. Intracranial pressure in patients with ruptured saccular aneurysm. J Neurosurg. 1972;36:537-547.
37 Ropper AH, Marmarou A. Mechanism of pseudotumor in Guillain-Barre syndrome. Arch Neurol. 1984;41:259-261.
38 Reichardt M. Zur Entstehung des Hirndrucks. Dtsch Z Nervenheilkd. 1905;38:306.
39 Klatzo I. Presidental address. Neuropathological aspects of brain edema. J Neuropathol Exp Neurol. 1967;26:1-14.
40 Ito J, Marmarou A, Barzó P, et al. Characterization of edema by diffusion-weighted imaging in experimental traumatic brain injury. J Neurosurg. 1996;84:97-103.
41 Barzó P, Marmarou A, Fatouros P, et al. Contribution of vasogenic and cellular edema to traumatic brain swelling measured by diffusion-weighted imaging. J Neurosurg. 1997;87:900-907.
42 Beaumont A, Marmarou A, Hayasaki K. The permissive nature of blood brain barrier opening in edema formation following traumatic brain injury. Acta Neurochir Suppl. 2000;76:125-129.
43 Marmarou A, Signoretti S, Fatouros PP, et al. Predominance of cellular edema in traumatic brain swelling in patients with severe head injuries. J Neurosurg. 2006;104:720-730.
44 Betz AL, Iannotti F, Hoff JT. Brain edema: a classification based on blood-brain barrier integrity. Cerebrovasc Brain Metab Rev. 1989;1:133-154.
45 Adams RD, Fisher CM, Hakim S, et al. Symptomatic occult hydrocephalus with “normal” cerebrospinal-fluid pressure. A treatable syndrome. N Engl J Med. 1965;273:117-126.
46 Marmarou A, Bergsneider M, Relkin N, et al. Development of guidelines for idiopathic normal-pressure hydrocephalus: introduction. Neurosurgery. 2005;57:S1-S3.
47 Marmarou A, Young HF, Aygok GA, et al. Diagnosis and management of idiopathic normal-pressure hydrocephalus: A prospective study in 151 patients. J Neurosurg. 2005;102:987-997.
48 Ekstedt J. CSF hydrodynamic studies in man. 2. Normal hydrodynamic variables related to CSF pressure and flow. J Neurol Neurosurg Psychiatry. 1978;41:345-353.
49 Ryder HW, Espey FF, Kimbell FD. The mechanism of the change in cerebrospinal fluid pressure following an induced change in the volume of the fluid space. J Lab Clin Med. 1953;41:428-435.
50 Marmarou A, Shulman K. Pressure-volume relationships—basic aspects. In: McLaurin RL, editor. Head Injuries. New York: Grune & Stratton; 1976:233-236.
51 Shapiro K, Marmarou A, Shulman K. Characterization of clinical CSF dynamics and neural axis compliance using the pressure-volume index: I. The normal pressure-volume index. Ann Neurol. 1980;7:508-514.
52 Maset AL, Marmarou A, Ward JD, et al. Pressure-volume index in head injury. J Neurosurg. 1987;67:832-840.
53 Eklund A, Smielewski P, Chambers I, et al. Assessment of cerebrospinal fluid outflow resistance. Med Biol Eng Comput. 2007;45:719-735.
54 Piper IR, Miller JD, Whittle IR, et al. Automated time-averaged analysis of craniospinal compliance (short pulse response). Acta Neurochir Suppl (Wien). 1990;51:387-390.
55 Shapiro K, Marmarou A. Clinical applications of the pressure-volume index in treatment of pediatric head injuries. J Neurosurg. 1982;56:819-825.
56 Chan KH, Dearden NM, Miller JD, et al. Transcranial Doppler waveform differences in hyperemic and nonhyperemic patients after severe head injury. Surg Neurol. 1992;38:433-436.
57 Gopinath SP, Robertson CS, Contant CF, et al. Jugular venous desaturation and outcome after head injury. J Neurol Neurosurg Psychiatry. 1994;57:717-723.
58 Marion DW, Darby J, Yonas H. Acute regional cerebral blood flow changes caused by severe head injuries. J Neurosurg. 1991;74:407-414.
59 McGraw P. A cerebral perfusion pressure greater than 80 mm Hg is more beneficial. In: Hoff JT, Betz AL, editors. Intracranial Pressure VII. Berlin: Springer-Verlag; 1989:339-341.
60 Rosner MJ, Rosner SD, Johnson AH. Cerebral perfusion pressure: management protocol and clinical results. J Neurosurg. 1995;83:949-962.
61 Czosnyka M, Kirkpatrick PJ, Pickard JD. Multimodal monitoring and assessment of cerebral haemodynamic reserve after severe head injury. Cerebrovasc Brain Metab Rev. 1996;8:273-295.
62 Avezaat CJ, van Eijndhoven JH, Wyper DJ. Cerebrospinal fluid pulse pressure and intracranial volume-pressure relationships. J Neurol Neurosurg Psychiatry. 1979;42:687-700.
63 Czosnyka M, Smielewski P, Kirkpatrick P, et al. Continuous monitoring of cerebrovascular pressure-reactivity in head injury. Acta Neurochir Suppl (Wien). 1998;71:74-77.
64 Weinstein JD, Langfitt TW, Bruno L, et al. Experimental study of patterns of brain distortion and ischemia produced by an intracranial mass. J Neurosurg. 1968;28:513-521.
65 Langfitt TW, Weinstein JD, Kassel NF. Transmission of increased intracranial pressure: 1. Within the craniospinal axis. J Neurosurg. 1964;21:989-997.
66 Meyer A. Herniation of the brain. Arch Neurol Psychiatry. 1920;4:387-400.
67 Cushing H. Concerning a definite regulatory mechanism of the vasomotor center which controls blood pressure during cerebral compression. Johns Hopkins Hosp Bull. 1901;12:290-292.
68 Plum P. Neural mechanisms of abnormal respiration in humans. Arch Neurol. 1960;3:484-487.
69 Plum P, Swanson AG. Central neurogenic hyperventilation in man. Arch Neurol Psychiatry. 1959;81:535-549.
70 McNealy DE, Plum P. Brain stem dysfunction with supratentorial mass lesions. Arch Neurol Psychiatry. 1962;7:10-32.
71 Kernohan JW, Woltman HW. Incisura of the crus due to contralateral brain tumor. Arch Neurol Psychiatry. 1972;21:274-287.
72 Schwab S, Aschoff A, Spranger M, et al. The value of intracranial pressure monitoring in acute hemispheric stroke. Neurology. 1996;47:393-398.
73 Pople IK, Muhlbauer MS, Sanford RA, et al. Results and complications of intracranial pressure monitoring in 303 children. Pediatr Neurosurg. 1995;23:64-67.
74 Saul TG, Ducker TB. Effect of intracranial pressure monitoring and aggressive treatment on mortality in severe head injury. J Neurosurg. 1982;56:498-503.
75 Miller JD, Becker DP, Ward JD, et al. Significance of intracranial hypertension in severe head injury. J Neurosurg. 1977;47:503-516.
76 Rosner MJ, Becker DP. Origin and evolution of plateau waves. Experimental observations and a theoretical model. J Neurosurg. 1984;60:312-324.
77 Rosner MJ, Daughton S. Cerebral perfusion pressure management in head injury. J Trauma. 1990;30:933-941.
78 Kroppenstedt SN, Kern M, Thomale UW, et al. Effect of cerebral perfusion pressure on contusion volume following impact injury. J Neurosurg. 1999;90:520-526.
79 Beaumont A, Hayasaki K, Marmarou A, et al. The effects of dopamine on edema formation in two models of traumatic brain injury. Acta Neurochir Suppl. 2000;76:147-151.
80 Newell DW, Aaslid R, Stooss R, et al. The relationship of blood flow velocity fluctuations to intracranial pressure B waves. J Neurosurg. 1992;76:415-421.
81 Narayan RK, Kishore PR, Becker DP, et al. Intracranial pressure: to monitor or not to monitor? A review of our experience with severe head injury. J Neurosurg. 1982;56:650-659.
82 Marmarou A, Anderson RL, Ward JD. Impact of ICP instability and hypotension on outcome in patients with severe head trauma [abstract]. J Neurosurg. 1991;75:S59.
83 Jenkins JG, Glasgow JF, Black GW, et al. Reye’s syndrome: assessment of intracranial monitoring. Br Med J (Clin Res Ed). 1987;294:337-338.
84 Lidofsky SD, Bass NM, Prager MC, et al. Intracranial pressure monitoring and liver transplantation for fulminant hepatic failure. Hepatology. 1992;16:1-7.
85 Blei AT, Olafsson S, Webster S, et al. Complications of intracranial pressure monitoring in fulminant hepatic failure [see comments]. Lancet. 1993;341:157-158.
86 Brain Trauma Foundation. Indications for intracranial pressure monitoring. J Neurotrauma. 1996;13:667-679.
87 Ghajar J. Intracranial pressure monitoring techniques. New Horiz. 1995;3:395-399.
88 Clark WC, Muhlbauer MS, Lowrey R, et al. Complications of intracranial pressure monitoring in trauma patients. Neurosurgery. 1989;25:20-24.
89 Holloway KL, Barnes T, Choi S, et al. Ventriculostomy infections: the effect of monitoring duration and catheter exchange in 584 patients [see comments]. J Neurosurg. 1996;85:419-424.
90 Luerssen TG, Chesnut RM, van Berkum-Clark M. Post-traumatic cerebrospinal fluid infections in the Traumatic Coma Data Bank: the influence of the type and management of monitoring. In: Avezaat CJJ, van Eijndhoven JHM, Maas AIR, editors. Intracranial Pressure VIII. Berlin: Springer-Verlag; 1991:42.
91 Mayhall CG, Archer NH, Lamb VA, et al. Ventriculostomy-related infections. A prospective epidemiologic study. N Engl J Med. 1984;310:553-559.
92 Langfitt TW, Weinstein JD, Kassel NF. Cerebral vasomotor paralysis produced by intracranial hypertension. Neurology. 1964;15:622-642.
93 Löfgren J, Essen CV, Zwetnow NN. The pressure-volume curve of the cerebrospinal fluid space in dogs. Acta Neurol Scand. 1973;49:557-574.
94 Yoshihara M, Marmarou A, Dunbar J. A fiberoptic device suitable for subdural pressure measurement. In: Avezaat CJJ, van Eijndhoven JHM, Maas AIR, et al, editors. Intracranial Pressure VIII. Berlin: Springer-Verlag; 1993:20-24.
95 Mendelow AD, Rowan JO, Murray L, et al. A clinical comparison of subdural screw pressure measurements with ventricular pressure. J Neurosurg. 1983;58:45-50.
96 Miller JD, Bobo H, Kapp JP. Inaccurate pressure readings for subarachnoid bolts. Neurosurgery. 1986;19:253-255.
97 North B, Reilly P. Comparison among three methods of intracranial pressure recording. Neurosurgery. 1986;18:730-732.
98 Crutchfield JS, Narayan RK, Robertson CS, et al. Evaluation of a fiberoptic intracranial pressure monitor. J Neurosurg. 1990;72:482-487.
99 Wolfla CE, Luerssen TG, Bowman RM. Regional brain tissue pressure gradients created by expanding extradural temporal mass lesion. J Neurosurg. 1997;86:505-510.
100 Kelly PJ, Goerss S, Kall BA, et al. Computed tomography–based stereotactic third ventriculostomy: technical note. Neurosurgery. 1986;18:791-794.
101 Shinnar S, Gammon K, Bergman EWJ, et al. Management of hydrocephalus in infancy: use of acetazolamide and furosemide to avoid cerebrospinal fluid shunts. J Pediatr. 1985;107:31-37.
102 Chesnut RM, Marshall LF. Management of head injury. Treatment of abnormal intracranial pressure. Neurosurg Clin North Am. 1991;2:267-284.
103 Fieschi C, Battistini N, Beduschi A, et al. Regional cerebral blood flow and intraventricular pressure in acute head injuries. J Neurol Neurosurg Psychiatry. 1974;37:1378-1388.
104 Jaggi JL, Obrist WD, Gennarelli TA, et al. Relationship of early cerebral blood flow and metabolism to outcome in acute head injury. J Neurosurg. 1990;72:176-182.
105 Overgaard J, Tweed WA. Cerebral circulation after head injury. 1. Cerebral blood flow and its regulation after closed head injury with emphasis on clinical correlations. J Neurosurg. 1974;41:531-541.
106 Uzzell BP, Obrist WD, Dolinskas CA, et al. Relationship of acute CBF and ICP findings to neuropsychological outcome in severe head injury. J Neurosurg. 1986;65:630-635.
107 Bouma GJ, Muizelaar JP, Choi SC, et al. Cerebral circulation and metabolism after severe traumatic brain injury: the elusive role of ischemia. J Neurosurg. 1991;75:685-693.
108 Langfitt TW, Obrist WD, Gennarelli TA, et al. Correlation of cerebral blood flow with outcome in head injured patients. Ann Surg. 1977;186:411-414.
109 Obrist WD, Langfitt TW, Jaggi JL, et al. Cerebral blood flow and metabolism in comatose patients with acute head injury. Relationship to intracranial hypertension. J Neurosurg. 1984;61:241-253.
110 Muizelaar JP, Marmarou A, DeSalles AA, et al. Cerebral blood flow and metabolism in severely head-injured children. Part 1. Relationship with GCS score, outcome, ICP, and PVI. J Neurosurg. 1989;71:63-71.
111 Gobiet W, Grote W, Bock WJ. The relation between intracranial pressure, mean arterial pressure and cerebral blood flow in patients with severe head injury. Acta Neurochir (Wien). 1975;32:13-24.
112 Sutton LN, McLaughlin AC, Dante S, et al. Cerebral venous oxygen content as a measure of brain energy metabolism with increased intracranial pressure and hyperventilation. J Neurosurg. 1990;73:927-932.
113 Hanson EJ, Anderson RE, Sund TMJ. Comparison of 85krypton and 133xenon cerebral blood flow measurements before, during, and following focal, incomplete ischemia in the squirrel monkey. Circ Res. 1975;36:18-26.
114 Grände PO. The effects of dihydroergotamine in patients with head injury and raised intracranial pressure. Intensive Care Med. 1989;15:523-527.
115 Muizelaar JP, Marmarou A, Ward JD, et al. Adverse effects of prolonged hyperventilation in patients with severe head injury: a randomized clinical trial. J Neurosurg. 1991;75:731-739.
116 Paolin A, Rodriguez G, Betetto M, et al. Cerebral hemodynamic response to CO2 after severe head injury: clinical and prognostic implications. J Trauma. 1998;44:495-500.
117 Becker DP. Brain acidosis in head injury: a clinical trial. In: Becker DP, Povlishock JT, editors. Central Nervous System Trauma Status Report. Byrd Press: Richmond; 1985:229.
118 Muizelaar JP, van der Poel HG, Li ZC, et al. Pial arteriolar vessel diameter and CO2 reactivity during prolonged hyperventilation in the rabbit. J Neurosurg. 1988;69:923-927.
119 van der Poel HG. Cerebral vasoconstriction is not maintained with prolonged hyperventilation. In: Hoff JT, Betz AL, editors. Intracranial Pressure VII. Berlin: Springer-Verlag, 1989.
120 Paulson OB. Regional cerebral blood flow in apoplexy due to occlusion of the middle cerebral artery. Neurology. 1970;20:63-77.
121 Sharples PM, Stuart AG, Aynsley-Green A, et al. A practical method of serial bedside measurement of cerebral blood flow and metabolism during neurointensive care. Arch Dis Child. 1991;66:1326-1332.
122 McHenry LC, Slocum HC, Hayes GJ. The effects of hyperventilation on the cerebral circulation and metabolism. Trans Am Neurol Assoc. 1964;89:223-225.
123 James HE, Langfitt TW, Kumar VS. Analysis of the response to therapeutic measures to reduce intracranial pressure in head injured patients. J Trauma. 1976;16:437-441.
124 Rosner MJ, Coley IB. Cerebral perfusion pressure, intracranial pressure, and head elevation. J Neurosurg. 1986;65:636-641.
125 Feldman Z, Kanter MJ, Robertson CS, et al. Effect of head elevation on intracranial pressure, cerebral perfusion pressure, and cerebral blood flow in head-injured patients. J Neurosurg. 1992;76:207-211.
126 Hulme K, Cooper R. The effects of head position and jugular venous compression (JVC) on intracranial pressure (ICP): a clinical study. In: Beks JWF, Bosch DA, Brock M, editors. Intracranial Pressure III. Berlin: Springer-Verlag; 1976:259.
127 Grände PO, Asgeirsson B, Nordström C. Aspects on the cerebral perfusion pressure during therapy of a traumatic head injury. Acta Anaesthesiol Scand Suppl. 1997;110:36-40.
128 Eker C, Asgeirsson B, Grände PO, et al. Improved outcome after severe head injury with a new therapy based on principles for brain volume regulation and preserved microcirculation [see comments]. Crit Care Med. 1998;26:1881-1886.
129 Simard JM, Bellefleur M. Systemic arterial hypertension in head trauma. Am J Cardiol. 1989;63:32C-35C.
130 Hirose S, Handa Y, Kobayashi H, et al. Effects of antihypertensive drugs on intracranial hypertension. Zentralbl Neurochir. 1991;52:69-75.
131 Hayashi M, Kobayashi H, Kawano H, et al. Treatment of systemic hypertension and intracranial hypertension in cases of brain hemorrhage. Stroke. 1988;19:314-321.
132 Tateishi A, Sano T, Takeshita H, et al. Effects of nifedipine on intracranial pressure in neurosurgical patients with arterial hypertension. J Neurosurg. 1988;69:213-215.
133 Robertson CS, Clifton GL, Taylor AA, et al. Treatment of hypertension associated with head injury. J Neurosurg. 1983;59:455-460.
134 Miller JD, Sweet RC, Narayan R, et al. Early insults to the injured brain. JAMA. 1978;240:439-442.
135 Suarez JI, Qureshi AI, Bhardwaj A, et al. Treatment of refractory intracranial hypertension with 23.4% saline [see comments]. Crit Care Med. 1998;26:1118-1122.
136 Shackford SR, Bourguignon PR, Wald SL, et al. Hypertonic saline resuscitation of patients with head injury: a prospective, randomized clinical trial. J Trauma. 1998;44:50-58.
137 Simma B, Burger R, Falk M, et al. A prospective, randomized, and controlled study of fluid management in children with severe head injury: lactated Ringer’s solution versus hypertonic saline. Crit Care Med. 1998;26:1265-1270.
138 Tranmer BI, Iacobacci RI, Kindt GW. Effects of crystalloid and colloid infusions on intracranial pressure and computerized electroencephalographic data in dogs with vasogenic brain edema. Neurosurgery. 1989;25:173-179.
139 Albers GW, Goldberg MP, Choi DW. N-Methyl-D-aspartate antagonists: ready for clinical trial in brain ischemia? Ann Neurol. 1989;25:398-403.
140 Astrup J, Sorensen PM, Sorensen HR. Inhibition of cerebral oxygen and glucose consumption in the dog by hypothermia, pentobarbital, and lidocaine. Anesthesiology. 1981;55:263-268.
141 Bedford RF, Persing JA, Pobereskin L, et al. Lidocaine or thiopental for rapid control of intracranial hypertension? Anesth Analg. 1980;59:435-437.
142 Benveniste H, Drejer J, Schousboe A, et al. Elevation of the extracellular concentrations of glutamate and aspartate in rat hippocampus during transient cerebral ischemia monitored by intracerebral microdialysis. J Neurochem. 1984;43:1369-1374.
143 Choi DW. Calcium-mediated neurotoxicity: relationship to specific channel types and role in ischemic damage. Trends Neurosci. 1988;11:465-469.
144 Choi DW. Cerebral hypoxia: some new approaches and unanswered questions. J Neurosci. 1990;10:2493-2501.
145 Donegan MF, Bedford RF. Intravenously administered lidocaine prevents intracranial hypertension during endotracheal suctioning. Anesthesiology. 1980;52:516-518.
146 Plangger CA. Effect of gammahydroxybutyrate on intracranial pressure, mean systemic arterial pressure and cerebral perfusion pressure in experimentally induced brain oedema of the rat. Acta Neurochir Suppl (Wien). 1990;51:404-406.
147 Rasool N, Faroqui M, Rubinstein EH. Lidocaine accelerates neuroelectrical recovery after incomplete global ischemia in rabbits. Stroke. 1990;21:929-935.
148 Beaumont A, Marmarou A. The effect of human corticotrophin releasing factor on the formation of post-traumatic cerebral edema. Acta Neurochir Suppl (Wien). 1998;71:149-152.
149 Smith DH, Casey K, McIntosh TK. Pharmacologic therapy for traumatic brain injury: experimental approaches. New Horiz. 1995;3:562-572.
150 Braakman R, Schouten HJ, Blaauw-van Dishoeck M, et al. Megadose steroids in severe head injury. Results of a prospective double-blind clinical trial. J Neurosurg. 1983;58:326-330.
151 Cooper PR, Moody S, Clark WK, et al. Dexamethasone and severe head injury. A prospective double-blind study. J Neurosurg. 1979;51:307-316.
152 Dearden NM, Gibson JS, McDowall DG, et al. Effect of high-dose dexamethasone on outcome from severe head injury. J Neurosurg. 1986;64:81-88.
153 Giannotta SL, Weiss MH, Apuzzo ML, et al. High dose glucocorticoids in the management of severe head injury. Neurosurgery. 1984;15:497-501.
154 Gudeman SK, Miller JD, Becker DP. Failure of high-dose steroid therapy to influence intracranial pressure in patients with severe head injury. J Neurosurg. 1979;51:301-306.
155 Saul TG, Ducker TB, Salcman M, et al. Steroids in severe head injury: a prospective randomized clinical trial. J Neurosurg. 1981;54:596-600.
156 Marshall LF, Maas AI, Marshall SB, et al. A multicenter trial on the efficacy of using tirilazad mesylate in cases of head injury. J Neurosurg. 1998;89:519-525.
157 Shoshan Y, Siegal T. Control of vasogenic edema in a brain tumor model: comparison between dexamethasone and superoxide dismutase. Neurosurgery. 1996;39:1206-1214.
158 Gastaut JL, Michel B, Hassan SS, et al. Electroencephalography in brain edema (127 cases of brain tumor investigated by cranial computerized tomography). Electroencephalogr Clin Neurophysiol. 1979;46:239-255.
159 Gutin PH. Corticosteroid therapy in patients with cerebral tumors: benefits, mechanisms, problems, practicalities. Semin Oncol. 1975;2:49-56.
160 Anderson DK, Saunders RD, Demediuk P, et al. Lipid hydrolysis and peroxidation in injured spinal cord: partial protection with methylprednisolone or vitamin E and selenium. Cent Nerv Syst Trauma. 1985;2:257-267.
161 Braughler JM, Hall ED. Correlation of methylprednisolone levels in cat spinal cord with its effects on (Na+,K+)-ATPase, lipid peroxidation, and alpha motor neuron function. J Neurosurg. 1982;56:838-844.
162 Caron MJ, Hovda DA, Becker DP. Changes in the treatment of head injury. Neurosurg Clin North Am. 1991;2:483-491.
163 Hall ED, Braughler JM. Effects of intravenous methylprednisolone on spinal cord lipid peroxidation and Na+,K+-ATPase activity. Dose-response analysis during 1st hour after contusion injury in the cat. J Neurosurg. 1982;57:247-253.
164 Chyatte D, Fode NC, Nichols DA, et al. Preliminary report: effects of high dose methylprednisolone on delayed cerebral ischemia in patients at high risk for vasospasm after aneurysmal subarachnoid hemorrhage. Neurosurgery. 1987;21:157-160.
165 Koide T, Wieloch TW, Siesjö BK. Chronic dexamethasone pretreatment aggravates ischemic neuronal necrosis. J Cereb Blood Flow Metab. 1986;6:395-404.
166 Sapolsky RM, Pulsinelli WA. Glucocorticoids potentiate ischemic injury to neurons: therapeutic implications. Science. 1985;229:1397-1400.
167 Messeter K, Nordström CH, Sundbärg G, et al. Cerebral hemodynamics in patients with acute severe head trauma. J Neurosurg. 1986;64:231-237.
168 Brain Resuscitation Clinical Trial Study Group. A randomized clinical trial of barbiturate loading in cardiac arrest survivors. In: Wirth FP, Ratcheson RA, editors. Neurosurgical Critical Care. Baltimore: Williams & Wilkins; 1987:204.
169 Ward JD, Becker DP, Miller JD, et al. Failure of prophylactic barbiturate coma in the treatment of severe head injury. J Neurosurg. 1985;62:383-388.
170 Eisenberg HM, Frankowski RF, Contant CF, et al. High-dose barbiturate control of elevated intracranial pressure in patients with severe head injury. J Neurosurg. 1988;69:15-23.
171 Temkin NR, Dikmen SS, Winn HR. Management of head injury. Posttraumatic seizures. Neurosurg Clin North Am. 1991;2:425-435.
172 Bell BA, Smith MA, Kean DM, et al. Brain water measured by magnetic resonance imaging. Correlation with direct estimation and changes after mannitol and dexamethasone. Lancet. 1987;1:66-69.
173 Millson C, James HE, Shapiro HM, et al. Intracranial hypertension and brain oedema in albino rabbits. Part 2. Effects of acute therapy with diuretics. Acta Neurochir (Wien). 1981;56:167-181.
174 Nath F, Galbraith S. The effect of mannitol on cerebral white matter water content. J Neurosurg. 1986;65:41-43.
175 Muizelaar JP, Wei EP, Kontos HA, et al. Mannitol causes compensatory cerebral vasoconstriction and vasodilation in response to blood viscosity changes. J Neurosurg. 1983;59:822-828.
176 Muizelaar JP, Lutz HA, Becker DP. Effect of mannitol on ICP and CBF and correlation with pressure autoregulation in severely head-injured patients. J Neurosurg. 1984;61:700-706.
177 Kirkpatrick PJ, Smielewski P, Piechnik S, et al. Early effects of mannitol in patients with head injuries assessed using bedside multimodality monitoring. Neurosurgery. 1996;39:714-721.
178 Wise B, Perkins R, Stevenson E. Penetration of 14C-labelled mannitol from serum into cerebral spinal fluid and brain. Exp Neurol. 1964;10:264-270.
179 Kaufmann AM, Cardoso ER. Aggravation of vasogenic cerebral edema by multiple-dose mannitol. J Neurosurg. 1992;77:584-589.
180 Kumana CR, Chan GT, Yu YL, et al. Investigation of intravascular haemolysis during treatment of acute stroke with intravenous glycerol. Br J Clin Pharmacol. 1990;29:347-353.
181 García-Sola R, Pulido P, Capilla P. The immediate and long-term effects of mannitol and glycerol. A comparative experimental study. Acta Neurochir (Wien). 1991;109:114-121.
182 Pollay M, Fullenwider C, Roberts PA, et al. Effect of mannitol and furosemide on blood-brain osmotic gradient and intracranial pressure. J Neurosurg. 1983;59:945-950.
183 Wilkinson HA, Rosenfeld SR. Furosemide and mannitol in the treatment of acute experimental intracranial hypertension. Neurosurgery. 1983;12:405-410.
184 Hendrick EB. The use of hypothermia in severe head injuries in childhood. Arch Surg. 1959;79:362-364.
185 Lazorthes G, Campan L. Hypothermia in the treatment of craniocerebral traumatism. J Neurosurg. 1958;15:162-167.
186 Sedzimir CB. Therapeutic hypothermia in cases of head injury. J Neurosurg. 1959;16:407-414.
187 Shiozaki T, Sugimoto H, Taneda M, et al. Effect of mild hypothermia on uncontrollable intracranial hypertension after severe head injury [see comments]. J Neurosurg. 1993;79:363-368.
188 Marion DW, Obrist WD, Carlier PM, et al. The use of moderate therapeutic hypothermia for patients with severe head injuries: a preliminary report. J Neurosurg. 1993;79:354-362.
189 Miller JD, Piper IR, Dearden NM. Management of intracranial hypertension in head injury: matching treatment with cause. Acta Neurochir Suppl (Wien). 1993;57:152-159.