CHAPTER 23 Physics and Instrumentation of Cardiac Positron Emission Tomography/Computed Tomography
SCANNER PHYSICS
Positron emission tomography (PET) takes advantage of the unique characteristics of positron decay. A proton-rich nucleus, such as 82Rb or 18F, can eliminate its excess charge by emitting a positron, which is the antiparticle of the electron. The positron will scatter around in the body (within a millimeter or so of where the decay took place) until it meets an electron, and then they are annihilated. The annihilation converts the mass of the positron and electron into energy, in this case two 511-keV photons that travel in nearly opposite directions (Fig. 23-1). If both of these photons can be detected, then it is known that there is activity somewhere along the line between the two responding detectors. After enough of these events have been recorded, the information can be combined to form an image.
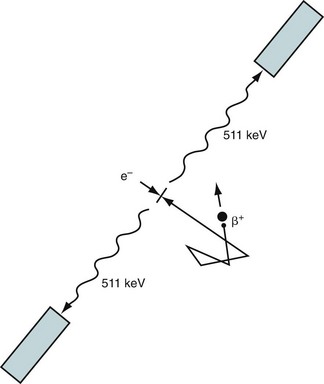
 FIGURE 23-1
At the heart of a PET camera are scintillation detectors. A scintillation detector is a crystal that gives off many low-energy photons when a high-energy photon interacts with its molecules. The low-energy photons are collected by photomultiplier tubes, which convert them into an electronic signal. The precise time of arrival of the event and the energy of the event are recorded. This is diagrammed in Figure 23-2. The timing is critical because it is used to decide if two photons came from the same annihilation. If two photons are detected within a very short time (called the time window, typically 3 to 12 ns, depending on the type of detector used in the scanner), it is assumed that they were created from a single positron-electron annihilation that occurred somewhere on the line that connects the two recording detectors. This is called a coincident event, and the line is termed a line of response. If the time between detecting two photons is greater than the time window, the two detected events must have originated from two separate annihilations because light travels at approximately 0.3 m/ns and the scanner is only about 1 m in diameter. The primary data set from the scanner is the number of coincident events that are recorded for each line of response.
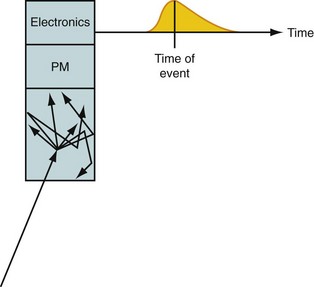
 FIGURE 23-2
A PET camera is made by arranging detectors in a cylindrical geometry as depicted in Figure 23-3. All detectors are continually monitoring for photons. The main advantage of PET imaging over SPECT is the vastly increased count rate capability. All detectors in the PET ring are continuously monitoring for events versus a gamma camera, which uses a lead collimator to detect only events along certain projections at any given time.
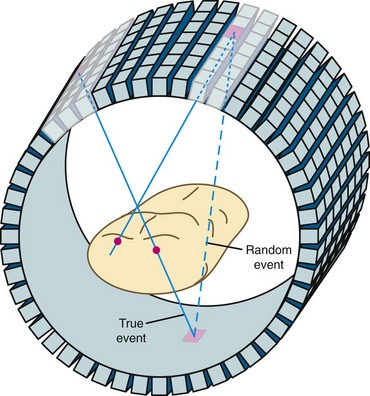
 FIGURE 23-3
There are several types of events that can be recorded in a PET scanner. The example shown in Figure 23-1 is called a true event. “True” comes from a positron-electron annihilation generating two photons that travel in opposite directions and are both recorded. This is the raw data that we desire to accurately reconstruct an image. Unfortunately, collecting data as described also results in recording of other types of events. It is possible for photons from two different positron annihilations that by random chance happen to decay within a few nanoseconds of each other to be detected in separate detectors within the time window. This situation is depicted in Figure 23-3. When this happens, there is the potential for incorrectly assuming that radioactivity is present between the two responding detectors. This type of event is called a random event because the two detectors that are involved and the time between detection of the two photons are both completely random. Random events add a uniform background to the primary data set.
The randomness in time between the two detections can be exploited to estimate the number of random events that are confounding the primary data set. The number of random events is estimated by one of two methods. The first method is the “delayed window” method. In this technique, a second data set is simultaneously acquired that includes only random events.1 The second method probabilistically calculates the number of expected random events based on the count rates in each of the detectors. In either case, the estimate is subtracted from the primary data set to produce a random corrected data set.
A multiple event is a combination of a true event and a random event as shown in Figure 23-4. By random chance, a third photon falls within the time window of a true event. When this occurs, it is unknown which pair of detectors represents the true event and which pair represents the random event. In all cases, one of the potential lines of response can be eliminated because it does not go through the imaged field of view. This leaves two lines of response, one true and one random. Both of the events are recorded. On average, the random events are corrected in the process described earlier. Recording both events and later correcting for the random yields additional information that can be used to reconstruct the image. This is as opposed to the archaic practice of ignoring multiple events because it cannot be known which two detectors recorded the true event.
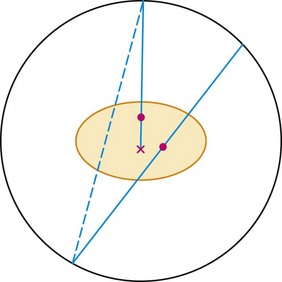
 FIGURE 23-4 Two other types of events that can occur during a PET acquisition. The straight line represents a true event as depicted in Figure 23-1. The line with the x indicates an attenuation event. One of the photons heading toward the detectors is attenuated by the body, so a coincidence event could not be recorded. This leads to an underestimate of the amount of activity in the body. This is fixed by the attenuation correction derived from the collected CT scan. If these two events happen to occur at the same time, the event is termed a multiple. In this case, it is not clear from the collected data if there is activity along the dotted or solid line. The data set is corrected for multiple events during the correction for random events.
Photon attenuation by the patient’s body leads to potential underestimation of the amount of activity in the patient. This is also depicted in Figure 23-4. Keep in mind that unless both photons are detected, no event can be recorded. It is the total amount of tissue that both photons must traverse that determines the probability of attenuation. Note that the probability of an event’s being attenuated is greater if the line of response traverses the center of the patient. On the other hand, some of the events originating at the edge of the body can reach the detectors after traversing only a small amount of tissue. Because of this, more events that originate at the center of the body are attenuated compared with the edge of the body. If this is not taken into account when images are reconstructed, the center parts of the image will be depressed (Fig. 23-5).
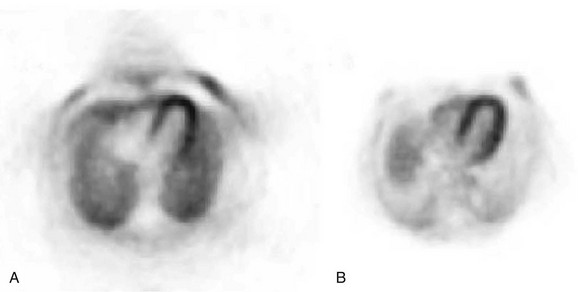
 FIGURE 23-5
A scatter event is when one of the photons scatters in the patient so that the line of response between the two responding detectors does not include the location of the event (Fig. 23-6). Essentially all scattering of importance to PET is photons scattering off free electrons, called Compton scattering. When a photon scatters, it transfers some of its energy to the electron. The greater the scattering angle, the greater the energy transfer. A 511-keV photon that scatters by 30 degrees is reduced in energy to 450 keV, approximately the lower level threshold used in setting up PET detectors. Hence, if one or both of the annihilation photons scatter by less than 30 degrees, they can be recorded by the PET system. With this much scattering, a recorded event with a line of response that passes near the center of the scanner could be off by up to 10 cm. Scattering by small angles is more probable than by larger angles, so scatter affects PET images by reducing resolution and contrast.
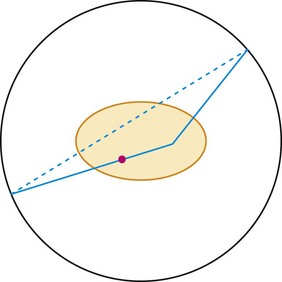
 FIGURE 23-6
The final type of event that needs to be considered for cardiac imaging is called a prompt gamma and is shown in Figure 23-7. This is a property of 82Rb decay that is not present with 18F. When a rubidium nucleus decays, it converts to a krypton nucleus by giving off its charge in the form of a positron. A significant fraction of the time, the krypton is in an excited state and almost immediately gives off another gamma ray. This is a situation that looks very much like the multiple event depicted in Figure 23-4, but there is a significant difference. The prompt gamma event is not random. The annihilation photons and the prompt gamma all are generated from a single decay process. In this case, the true and random events are correlated in time, that is, they happen at the same time. (Actually, the prompt gamma can be delayed by a few picoseconds, but this extremely small time is insignificant compared with the duration of the time window.) Compared with a multiple event, the random is equally likely to occur at any time.
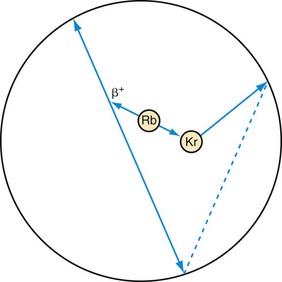
 FIGURE 23-7 Prompt gamma event. This type of event can occur in scanning with rubidium (Rb). Rubidium decays to an excited state of krypton (Kr), which gives off its excess energy in the form of a photon. If all three of these photons are detected, the event has the appearance of a multiple event (see Fig. 23-4). The difference is that one event precipitated all three photons as opposed to the two decays that just happened to occur at the same time in Figure 23-4. Hence, there is no randomness in the timing between these photons, so a conventional correction for random events will not remove them from the data set. A separate prompt gamma contamination estimate must be performed to account for these events before an image is reconstructed.
PET Detectors
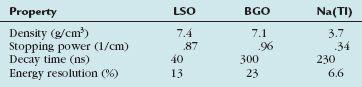
All of the different types of events need to be accounted for in image reconstruction. The first defense against the confounding types of events is the detector itself. There are several different types of detector materials (Table 23-1). The three main characteristics for the detector material in PET are the stopping power, energy resolution, and time resolution. The greater the stopping power, the less detector material is needed to stop one of the annihilation photons. This is important for economic and image quality reasons. The detector material is the dominating cost of a scanner, so it pays to have higher stopping power material. It can also lead to better images. If a photon is detected in a smaller detector, the line of response is better defined, which leads to better images. Finally, for detectors of equal size, the one with the higher stopping power is more likely to record the event, leading to a higher sensitivity scanner and, again, better images.
In many of the preceding diagrams, it appears as if the PET scanner is a ring of detectors within a single plane. Historically, this was the case. A volumetric PET scanner was built by stacking a set of independent detector rings to make a scanner. At some point, it was realized that if the detected events are limited to those occurring only within a plane, the number of detected events will be many times less than it could be. On the other hand, it takes much more computer memory and processing power to reconstruct images when nonplanar events are also included. The computing threshold was passed around 1999, and in modern scanners, the acceptance of events is opened up so that any pair of detectors can record an event. This is depicted in Figure 23-3.
Conversion of CT Images to PET Attenuation Maps
Direct scaling assumes a linear relationship between CT and PET attenuation. This is a good assumption in low-density tissues such as lung and soft tissue. Bone is an exception because its CT attenuation is dominated primarily by photoelectric contributions. Therefore, the linear relationship depends on the effective energy of the CT scan. So, an appropriate calibration curve needs to be a combination of two or more linear curves that cover the range of attenuation commonly found in the body. A bilinear relationship is a common conversion technique used in PET/CT scanners (Fig. 23-8).
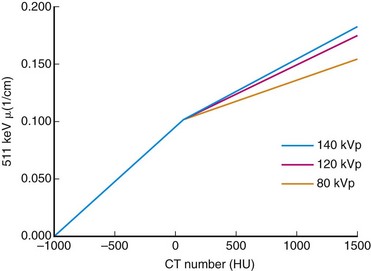
 FIGURE 23-8
CT data are collected at higher resolution (typically 1- × 1- × 1-mm voxels) than are PET data (typically 6- × 6- × 6-mm voxels), requiring the converted CT image to be down-sampled to the PET image matrix size and smoothed with an appropriate kernel to match the PET resolution (Fig. 23-9). The attenuation map data are then used to correct the emission data.
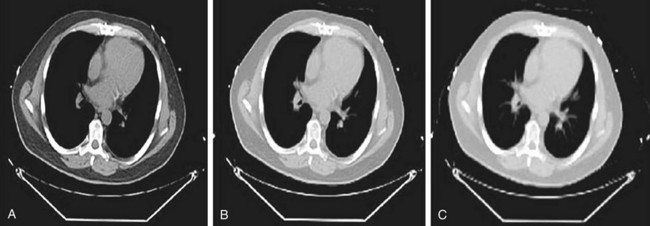
 FIGURE 23-9
Attenuation Mismatch
Motion of the Patient
Voluntary motion of the patient commonly occurs in response to discomfort experienced during long imaging scans. A motion event may occur between the CT and PET acquisition or, more commonly, during the PET study. Intra-scan motion is evident by mismatched boundaries and uptake in regions not normally associated with perfusion or increased metabolism (Fig. 23-10). Motion during a scan appears as blurred edges and loss of anatomic detail (Fig. 23-11).
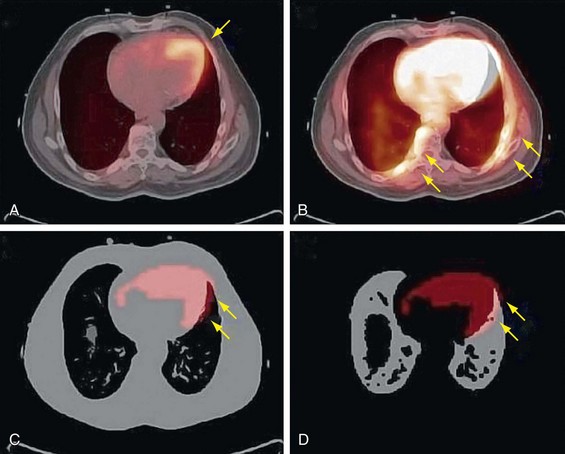
 FIGURE 23-10
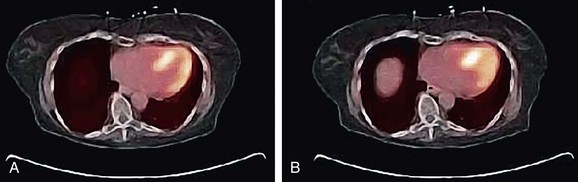
 FIGURE 23-11
Respiratory and Contractile Cardiac Motion
In dedicated PET systems, the long transmission time required for rotating radionuclide transmission sources around the body provides good respiratory and cardiac temporal averaging as is present in the emission scan. With the introduction of CT for attenuation correction, respiratory and contractile cardiac motion has considerably greater potential to unduly influence the attenuation correction because a fast helical CT scan fails to account for the time averaging observed in the emission acquisition (Fig. 23-12). As a result, the reported frequency of registration errors between the transmission and emission sequences has increased dramatically from dedicated PET systems2 to PET/CT hybrid systems.3
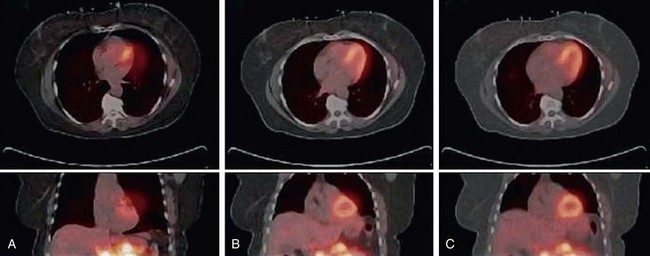
 FIGURE 23-12
Drift of Thoracic Contents
Drift of the thoracic contents, such as slow continuous movement of the heart, occurs in response to changes in the patient’s state, such as changes in lung volume as a result of the introduction of a pharmacologic stressing agent.2 Misregistration caused by this mechanism is commonly observed as cardiac uptake overlying the CT lung field (Fig. 23-13). Furthermore, even in the presence of good respiratory averaged transmission data, drift of thoracic contents is still prevalent and is a main factor along with motion of the patient leading to registration errors in approximately one quarter of clinical perfusion studies. Given the nature of its mechanism, motion of the patient often cannot be accounted for by altering the transmission protocol and therefore requires that a post-reconstruction image registration method be available.
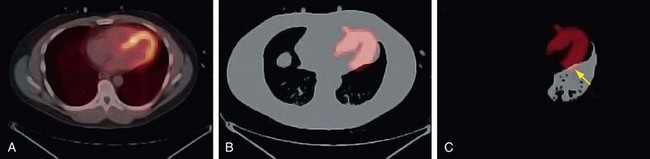
 FIGURE 23-13
Attenuation Correction Protocols
Correction schemes to address the motion problem in the thorax have concentrated on gating techniques in the PET/CT acquisition and blurring or averaging of the transmission data.4 The first method uses either prospective (sinogram mode) or retrospective (list mode) gating of the respiratory and cardiac cycles. The respiratory cycle is normally monitored by use of a bellows, chest band, or infrared tracking system, of which the sinusoidal phase is then divided into a predetermined number of bins, commonly 10. Monitoring of the cardiac cycle is performed with an electrocardiograph; the phase is similarly divided into a preset number of bins between successive R–R waves, commonly eight bins. The data can then be binned into a two-dimensional histogram and reconstructed into separate image volumes of any cardiac-respiratory phase combination that matches the CT phase collected. The disadvantage of this technique is that the collected prompt events are distributed into many separate images (~80), and reconstruction of a single image results in poor quality because of the low number of counts. Therefore, multiple gates are often added together to improve image quality at the sacrifice of motion-free image information. These multiple gating techniques are achievable on PET/CT systems, but there are limited software resources capable of efficiently processing these events.
A second approach to matching PET emission and CT transmission data is blurring or averaging of the CT data to match the averaged nature of the PET study. This approach is referred to as time-averaged CT and has been explored more extensively because the protocols employed are used routinely in stand-alone cardiac CT units. Time-averaged CT protocols have been proposed in place of a breath-hold because they permit the patient to be scanned under free-breathing conditions (see Fig. 23-12B&C). The motivation is that the free-breathing state provides a more accurate representation of attenuating structures present in the emission examination. One method for obtaining a time-averaged CT scan is use of a low-pitch helical protocol whereby data are collected at a pitch of 0.5 or lower. This approach increases the axial sampling, which suppresses motion artifacts and results in blurring when linear interpolation algorithms are used in the reconstruction. In this case, the cardiac and respiratory phases are spread along the axial direction (see Fig. 23-12B).5 A second method is collecting an average CT by successive cine mode acquisitions (also referred to as sequential), whereby multiple images are collected over one or more breath cycles at a single bed position. The table is then stepped to the next position, and acquisition resumes. This sequence is repeated until the entire chest cavity is covered. The multiple image data are then averaged at each bed position and interpolated to the PET slice thickness for attenuation correction (see Fig. 23-12C).6
PET and CT Coregistration
It is recommended that the emission study be reconstructed without corrections to reduce the likelihood of mistaking a low-count region for an anatomic edge. Variability in the coregistration can further be reduced by implementing a quality control procedure. A straightforward method is to count the number of myocardial uptake pixels that overlie the left lung of the CTAC image. Then, as the CT myocardium is altered to match the myocardium uptake in the emission images, the number of emission myocardial pixels in the CT left lung field can be monitored (see Fig. 23-13).7
A disadvantage of the rigid-body transformation method is the concomitant relocation of highly attenuating structures. In the case of drift of the thoracic contents, bony structures such as the spine are repositioned to an area that does not correspond to spine in the emission study. This leads to streaking artifacts discussed in the section on quality control. Therefore, an alternative to the rigid-body registration method is needed. One proposed technique is an emission-driven approach wherein pixels in the left CT lung field that overlap with myocardial uptake in the emission image are reassigned values corresponding to soft tissue.3
Scatter Correction
Photons can scatter off any electron in the body, but considering every possibility is unwieldy. The calculation becomes much easier if all of the scattering is considered to occur from a single scattering source. The most common simplification is to assume that the scatter always takes place at the midpoint of the particular line of response8; with this assumption, it is straightforward to calculate the number of scatter events that would be detected in neighboring lines of response, and an iterative process can be used to reduce the effect of scatter in the final images.
Image Reconstruction
Iterative reconstruction methods do not have the FBP difficulties resulting from violated assumptions necessary for the mathematics. However, they do have some drawbacks of their own that will be discussed after an introduction to the technique is presented. The start of an iterative routine is a guess of the image. Assuming that the image represents the activity distribution in the field of view, the scanning process is simulated to produce a simulated data set. The simulated data set is compared with the actual data set, and differences are noted. Where the simulated data are too large, the corresponding pixels in the guess image are reduced, and vice versa, to produce the next estimate of the true image (Fig. 23-14). The process is repeated many times until the simulated and measured data sets are the same or as close as possible. In the literature, there is considerable discussion about how many iterations should be performed. Because the statistics of radioactive decay are well known to be Poisson distributions, the simulated data set can be compared with the actual data set in a probabilistic sense. Hence, the probability that that particular data set could have arisen from the guess image distribution is calculated. Iterations can be continued as long as this probability continues to increase. After each of the first few iterations, the probability increases rapidly; but after many iterations, the incremental increase is much less. Hence, from a practical point of view, images are generally reconstructed with a fixed number of iterations.
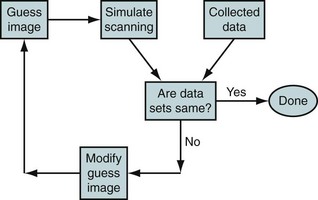
 FIGURE 23-14
The advantage of the iterative reconstruction procedure is that the physics of scanning is more realistically built into the algorithm. This includes the scattering process, any gaps in detector spacing within the scanner, variation in resolution across the field of view, and the noise inherent with radioactive decay. These processes are all part of the “simulate scanning” box in Figure 23-14. The disadvantage is the time required to reconstruct the image. As a matter of practical implementation, the physics built into the reconstruction algorithm is not the best available. As discussed before, the scatter correction estimation involves assuming that scattering takes place at the center of the scanner. Another problem area is the geometry of the lines of response. Photons in different lines of response interact differently with the detectors, depending on whether the line of response is normally incident or incident at an angle with respect to the detectors. To make the calculation faster, it is usually assumed that all lines of response have the same interaction with the detector. These are examples of problems with the practical implementation. In principle, the iterative reconstruction can be much more accurate. As computing power has increased over the years, the physics built into the reconstruction algorithm has become more sophisticated. For example, including the difference in detection response as a function of the geometry of the detectors and line of response is becoming more common.
TRACER KINETICS
Rubidium 82
Many investigators have taken this behavior into account when using rubidium to measure myocardial blood flow for the purpose of research studies.9–11 In general, in these types of studies, a group of patients with a particular disease or in a particular flow state are scanned and then averaged together. These patients are then compared with another group of patients to determine if there is a difference in flow. With this technique, researchers have found that there are flow-dependent effects caused by different drugs and different lifestyles. See, for example, references 12 to 15.
PROTOCOLS
Dietary Restrictions
Viability Imaging
Glucose Loading
The general principle of glucose loading is to mobilize glucose transporters on the cell membrane by shifting the myocardium from the fasting state to the preferential fed state. A subsequent decline in glucose, by insulin injection, then promotes the transport of FDG into the myocardial cells. Monitoring of the glucose blood levels is complicated in patients with a history of diabetes mellitus, who may not present sufficiently low blood glucose levels after the fasting and dietary requirements. In this situation, a blood glucose analyzer is critical in managing plasma glucose levels and may exclude the patient if levels cannot be stabilized during the uptake and scanning period. The reader is referred to the step-by-step guidelines for FDG viability imaging published by the American Society of Nuclear Cardiology.16
Pharmacologic Stress
The two most common pharmacologic stress agents are adenosine, a direct vasodilator, and dipyridamole, which inhibits facilitated reuptake of adenosine to indirectly increase the endogenous plasma level of adenosine.17 The primary adverse effects associated with adenosine are flushing, dizziness, chest pain, and bronchoconstriction, which can be relieved by termination of the infusion or intravenous aminophylline. Dipyridamole has similar adverse effects, but the side effects are prolonged, and reversal often requires drug intervention.18 The peak onset is induced within 3 to 7 minutes after infusion with a half-life of approximately 30 to 45 minutes. The choice between adenosine and dipyridamole is generally given to adenosine because of rapid onset of action and short half-life, lower cost per dose, and easier monitoring after study completion.19 Peak vasodilatory effects with adenosine occur after 2 minutes of infusion and return to baseline within 2 minutes after termination.20 The stress perfusion protocols discussed in this section involve the use of adenosine.
An alternative coronary vasodilator is regadenoson, a selective A2A adenosine agonist, recently approved by the Food and Drug Administration for myocardial perfusion imaging.21 Adverse effects are similar to those of adenosine but less severe in some cases because of the weak affinity for the A1, A2B, and A3 subtypes. The agent is packaged as a single dose and administered in a slow bolus (<10 seconds) at fixed concentration irrespective of the patient’s weight. Peak onset is rapid, resulting in an increase in coronary blood flow up to twice resting rate 10 to 20 seconds after injection and decreasing to resting rate within 10 minutes. The slightly longer duration at peak coronary output for this agent compared with adenosine allows a second CTAC after stress.
Rest-Stress Protocols
A number of rest-stress protocols are in use in perfusion imaging. These protocols incorporate several features primarily focused on reducing the total scan time; others are tailored to extract more specific information, such as cardiac function and blood flow. Uptake of perfusion tracers is relatively rapid; the myocardial–blood pool ratio reaches 2 : 1 as soon as 80 seconds after infusion and sometimes as late as 180 seconds (Fig. 23-15). The data acquisition is often delayed after injection to wait for the blood pool to clear and thereby to obtain high-contrast images. The American Society of Nuclear Cardiology guidelines recommend a minimum delay of 90 seconds.22 This technique streamlines the imaging protocol, allowing more consistent throughput. However, this practice can lead to loss of useful counts in patients with fast blood pool clearance or loss of image quality in patients with poor myocardial function or perfusion. In addition, the clearance time between rest and stress studies may vary. Thus, allowing a flexible delay permits more accurate comparison between the two image sets.
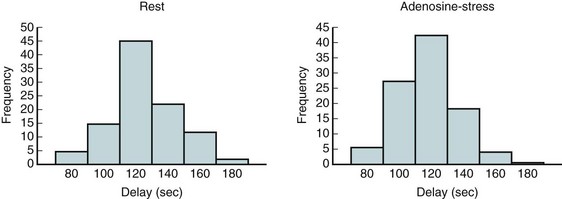
 FIGURE 23-15
Common perfusion protocols consist of the following components: (1) CT-based transmission scan at rest, (2) rest perfusion examination, (3) pharmacologic stress perfusion examination, and (4) CT-based transmission scan at stress. Two workflows are given for list mode (Fig. 23-16) and sinogram mode (Fig. 23-17) acquisition. The primary difference between the two sequences is that in sinogram mode acquisition, a second resting injection is required with electrocardiographic trigger if gated information is desired. The list mode acquisition stores the electrocardiographic triggers in the event list, which can then be binned retrospectively. This acquisition feature reduces scan time and saves radiation dose to the patient. The CTAC scan protocol is collected under free-breathing conditions to incorporate contractile and respiratory averaging (see the section on CT protocol). The extended duration of certain pharmacologic stress agents, such as regadenoson, permits the collection of an additional CTAC scan after the stress portion of the examination. Last, an optional diastolic gated CT can be incorporated to assess calcium burden by Agatston scoring. This is increasingly common for PET/CT systems sold with 64-slice or more CT scanners.
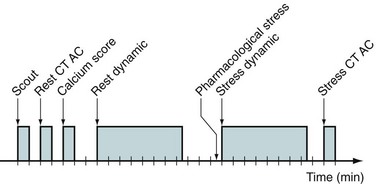
 FIGURE 23-16
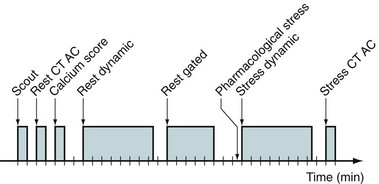
 FIGURE 23-17
After the CTAC and Ca scoring examination, the patient table is moved to the PET position and the infusion lines are prepared. The Rb injection should be administered as a slow bolus (10 to 30 seconds). Prolonged infusion times will not allow the blood to clear sufficiently and will degrade image quality. Two infusions are performed with electrocardiographic monitoring, a 7.5-minute rest acquisition started at the time of infusion followed by a 7.5-minute pharmacologic stress acquisition. For example, pharmacologic stress with use of regadenoson is delivered in a 10-second bolus before the stress radiotracer infusion. The data are histogrammed into a specified number of frames, and regions are drawn over the left myocardium and ventricular cavity. These regions are applied identically to all frames and plotted over time to construct a time-activity curve (Fig. 23-18). The time that the blood pool concentration drops to one-half the myocardial concentration is identified and set as the scan delay. The list mode data are then rehistogrammed by starting at the delay point to reconstruct static and gated images. This is the “optimal timing” advantage made possible by list mode data collection.
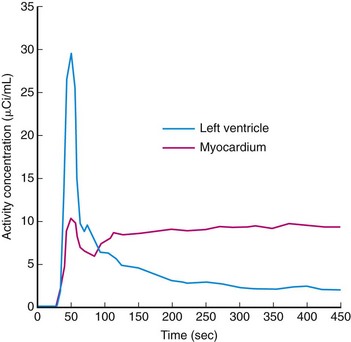
 FIGURE 23-18
Viability Protocols
Viability of recovering or dysfunctional myocardium requires both sufficient blood flow and metabolic activity. Therefore, this protocol consists of a resting perfusion study followed by a glucose metabolism study with electrocardiographic monitoring (Fig. 23-19). As previously mentioned, the mobilization of glucose transporters is promoted by shifting the myocardium from using fatty acids to glucose by administration of a glucose load. Plasma glucose levels must be continuously monitored to keep the myocardium in the preferential glucose state (<140 mg/dL). Patients with diabetes mellitus present a particular challenge because of their inability to reliably produce endogenous insulin and their reduced cell response to exogenous insulin stimulation. This may lead to troubles in stabilizing blood glucose levels during uptake after infusion and during imaging. The reader is referred to the American Society of Nuclear Cardiology and Society of Nuclear Medicine guidelines on FDG viability imaging.22
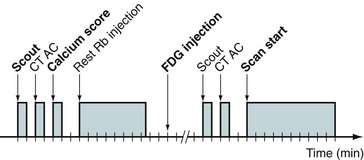
 FIGURE 23-19
DOSIMETRY
For a 370-MBq injection of FDG, the total whole-body effective dose is 7 mSv.23 For a rest-stress 82Rb injection (2 × 1850 MBq), the total effective radiation dose is 2.4 mSv.24 With the addition of a scout for localization, CTAC, and two perfusion injections, a typical total effective whole-body dose for a rest-stress 82Rb study is 0.5 mSv + 2 mSv + 2.4 mSv = 5 mSv.
QUALITY CONTROL
A well-designed quality control program involves monitoring of different aspects of the imaging instrumentation on daily, weekly, and monthly intervals. The procedures outlined are essential to maintaining high diagnostic accuracy and anticipating potential equipment failures before they compromise image quality. Scanners can vary considerably in construction geometry and materials. The quality control program should be adapted to the specific characteristics of the system and take into consideration individual manufacturer recommendations. However, the data collection, storage, and reconstruction are more standardized across manufacturers, and a thorough quality control program can be developed that is independent of the hardware configuration. Quality control procedures outlined by task groups (i.e., American Society of Nuclear Cardiology)26 and accreditation agencies (i.e., American College of Radiology, Intersocietal Commission for the Accreditation of Nuclear Medicine Laboratories)27,28 are general and applicable across several configurations. These procedures should be considered in developing a program for your institution.
PET/CT Quality Control
From a software standpoint, the operation of a PET/CT scanner is completely integrated, giving the sense of a common unified gantry. From a hardware point of view, the PET and CT systems are completely autonomous. Thus, it is crucial that a quality control program includes an independent evaluation of the individual PET and CT systems and an evaluation of their combined use. Because of the construction of the scanner, the CT and PET portions of a study cannot be acquired simultaneously. The following quality control procedures are standard for several manufacturers and found in several guidelines, such as those of the American Society of Nuclear Cardiology.26 Daily procedures are best performed in the morning before clinical scanning to anticipate potential problems with scanning of patients.
PET Quality Control
A baseline performance evaluation of the scanner following the National Electronic Manufacturers Association (NEMA) procedures is recommended.29,30 These measurements should be performed by the installation engineers and hospital staff physicist. The NEMA performance evaluation includes standards for measurements of count rate, resolution, and contrast that provide objective criteria for comparing the scanner with published manufacturer specifications. It will also establish the baseline performance of the camera, from which the user can document changes that occur over time. The NEMA performance measurements should be conducted after installation of a new scanner and after major hardware upgrades. Good practice should involve a yearly NEMA performance evaluation to be compared with the baseline performance evaluation.
Image Quality Control
Streaking and Lateral Wall Overcorrection
Registration of the PET and CT data can be difficult to judge because of the blurred boundaries of the heart in the emission and lack of other anatomic references due to poor uptake in the surrounding body tissues. As a result, it is possible to shift the CT image to a location where bony structures such as the ribs and spine do not correspond to their same location in the PET data. Shifting of these highly attenuating structures will cause erroneous attenuation correction that affects the entire image, but is most visible in areas along the left ventricular wall and spinal column. The concomitant relocation of the spine causes artificially increased uptake in the left ventricle wall and along the left lung boundary and distortion of the lateral wall contour (Fig. 23-20).
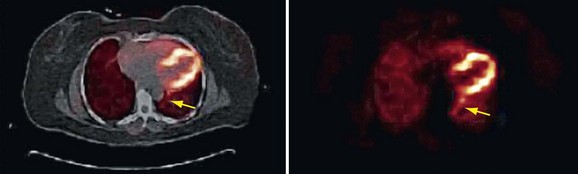
 FIGURE 23-20
Prompt Gamma
Isotopes with gamma transitions in addition to positron decay represent a significant problem in three-dimensional scanning because of the wide acceptance angle for prompt events. Failure to properly correct prompt gamma events causes overcorrection of the scatter fraction, leaving photopenic areas in the image as previously described. These artificially low-count regions are most apparent in the center of the image field of view where the scatter correction is the largest. In cardiac PET imaging, this region includes the septa and apical portion of the myocardium (Fig. 23-21). In addition, sharp edges are often observed at the left ventricle–left lung interface and near the chest wall.
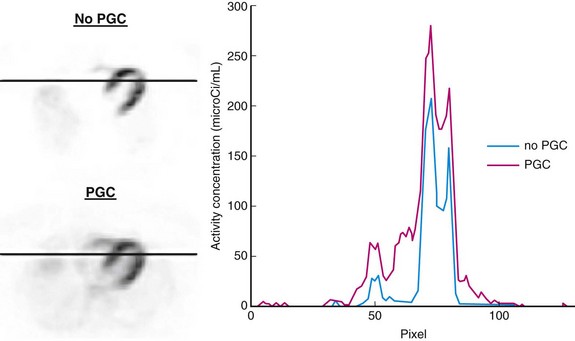
 FIGURE 23-21
Metal Implants
Implanted metallic components associated with implantable cardioverter-defibrillators and pacemaker leads pose a potential problem when they are located near the myocardium.31 Devices such as these have high mass attenuation coefficients due to their strong photoelectric absorption at x-ray photon energies, resulting in high CT values (>200 HU). However, the interaction of 511-keV gammas with metallic implants occurs primarily through Compton scattering; therefore, the attenuation varies little with that of water. Employing bilinear conversion schemes overestimates the attenuation coefficients of metallic implants at 511 keV, which then propagate to the PET image (Fig. 23-22). Several metal artifact algorithms have been introduced to compensate for the misclassification of metal implants in the creation of PET attenuation maps.32–34

 FIGURE 23-22
Truncation
The acquisition fields of view in PET and CT scanners are typically not matched. The CT gantry field of view is often 10 to 20 cm less in diameter than that of the PET gantry. Therefore, the reconstructed CT data may be missing portions of tissue at the outer boundaries of the patient (Fig. 23-23). This typically occurs when the arms are down or in patients with large torsos. The truncation of the attenuation data to the CT field of view leaves portions of the PET data with no corresponding attenuation correction factors. As a result, data at the outer rim of the PET image are underestimated. Truncation is less pronounced in perfusion imaging because of low uptake in the extremities.
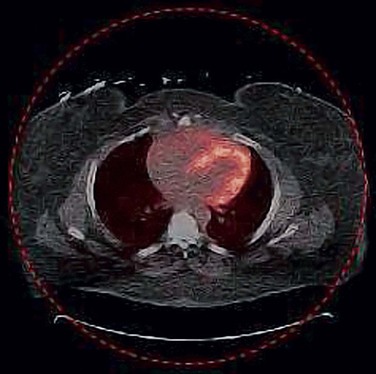
 FIGURE 23-23
Elevated Activity in Inferior Wall at Stress
At stress, the increase in lung volume causes dilation of the diaphragm and a downward shift of the heart. Therefore, when a rest CTAC is used to correct the stress study, a large portion of the diaphragm is present in the transaxial slices of the inferior portion of the myocardium. This results in an overcorrection of the attenuation in those planes and an artificially high activity concentration in the emission study. Most often, the data are scaled for display to the hottest regions, which can lead to the lateral or superior regions appearing decreased (Fig. 23-24).
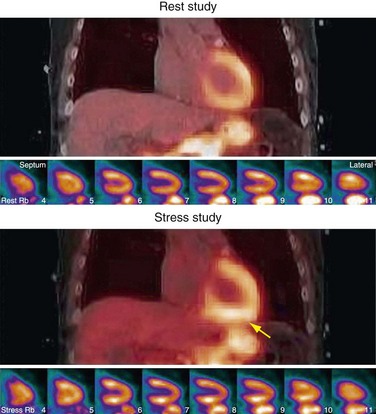
 FIGURE 23-24


Bendriem B, Townsend DW, editors. The Theory and Practice of 3D PET. Dordrecht: The Netherlands, Kluwer Academic, 1998.
Bushberg JT, Seibert JA, Leidholdt EMJr, Boone JM. The Essential Physics of Medical Imaging, 2nd ed. Philadelphia: Lippincott Williams & Wilkins; 2002.
Cherry S, Sorenson J, Phelps M. Physics in Nuclear Medicine. Philadelphia: WB Saunders; 2003.
Johns HE, Cunningham JR. Physics of Radiology, 4th ed. Springfield, Ill: Charles C Thomas; 1983.
Kalender WA. Computed Tomography: Fundamentals, System Technology, Image Quality, Applications. New York: Wiley; 2006.
Phelps ME. PET: Physics, Instrumentation, and Scanners. New York: Springer; 2006.
1 Knoll GF. Radiation Detection and Measurement. New York: John Wiley & Sons; 1979. p 694
2 Loghin C, Sdringola S, Gould KL. Common artifacts in PET myocardial perfusion images due to attenuation-emission misregistration: clinical significance, causes, and solutions. J Nucl Med. 2004;45:1029-1039.
3 Martinez-Möller A, Souvatzoglou M, Navab N, et al. Artifacts from misaligned CT in cardiac perfusion PET/CT studies: frequency, effects, and potential solutions. J Nucl Med. 2007;48:188-193.
4 Martinez-Möller A, Zikic D, Botnar RM, et al. Dual cardiac-respiratory gated PET: implementation and results from a feasibility study. Eur J Nucl Med Mol Imaging. 2007;34:1447-1454.
5 Nye JA, Esteves F, Votaw JR. Minimizing artifacts resulting from respiratory and cardiac motion by optimization of the transmission scan in cardiac PET/CT. Med Phys. 2007;34:1901-1906.
6 Pan T, Mawlawi O, Luo D, et al. Attenuation correction of PET cardiac data with low-dose average CT in PET/CT. Med Phys. 2006;33:3931-3938.
7 Schuster DM, Halkar RK, Esteves FP, et al. Investigation of emission-transmission misalignment artifacts on rubidium-82 cardiac PET with adenosine pharmacologic stress. Mol Imaging Biol. 2008;10:201-208.
8 Watson CC, Newport D, Casey ME. A single scatter simulation technique for scatter correction in 3D PET. In: Grangeat P, Amans JL, editors. 1995 International Meeting on Fully Three-dimensional Image Reconstruction in Radiology and Nuclear Medicine. Dordrecht: The Netherlands, Kluwer Academic, 1996.
9 Hutchins GD, Schwaiger M, Rosenspire KC, et al. Noninvasive quantification of regional blood flow in the human heart using N-13 ammonia and dynamic positron emission tomographic imaging. J Am Coll Cardiol. 1990;15:1032-1042.
10 Hutchins GD. What is the best approach to quantify myocardial blood flow with PET? J Nucl Med. 2001;42:1183-1184.
11 Krivokapich J, Smith GT, Huang SC, et al. 13N ammonia myocardial imaging at rest and with exercise in normal volunteers. Quantification of absolute myocardial perfusion with dynamic positron emission tomography. Circulation. 1989;80:1328-1337.
12 Campisi R, Nathan L, Pampaloni MH, et al. Noninvasive assessment of coronary microcirculatory function in postmenopausal women and effects of short-term and long-term estrogen administration. Circulation. 2002;105:425-430.
13 Czernin J, Barnard RJ, Sun KT, et al. Effect of short-term cardiovascular conditioning and low-fat diet on myocardial blood flow and flow reserve. Circulation. 1995;92:197-204.
14 Laine H, Nuutila P, Luotolahti M, et al. Insulin-induced increment of coronary flow reserve is not abolished by dexamethasone in healthy young men. J Clin Endocrinol Metab. 2000;85:1868-1873.
15 Mellwig KP, Baller D, Gleichmann U, et al. Improvement of coronary vasodilatation capacity through single LDL apheresis. Atherosclerosis. 1998;139:173-178.
16 Bacharach SL, Bax JJ, Case J, et al. PET myocardial glucose metabolism and perfusion imaging: Part 1—Guidelines for data acquisition and patient preparation. J Nucl Cardiol. 2003;10:543-556.
17 Iskandrian AS, Verani MS, Heo J. Pharmacologic stress testing: mechanism of action, hemodynamic responses, and results in detection of coronary artery disease. J Nucl Cardiol. 1994;1:94-111.
18 Leppo JA. Comparison of pharmacologic stress agents. J Nucl Cardiol. 1996;3(pt 2):S22-S26.
19 Holmberg MJ, Mohiuddin SM, Hilleman DE, et al. Outcomes and costs of positron emission tomography: comparison of intravenous adenosine and intravenous dipyridamole. Clin Ther. 1997;19:570-581.
20 Wilson RF, Wyche K, Christensen BV, et al. Effects of adenosine on human coronary arterial circulation. Circulation. 1990;82:1595-1606.
21 Thompson CA. FDA approves pharmacologic stress agent. Am J Health Syst Pharm. 2008;65:890.
22 Schelbert HR, Beanlands R, Bengel F, et al. PET myocardial perfusion and glucose metabolism imaging: Part 2—Guidelines for interpretation and reporting. J Nucl Cardiol. 2003;10:557-571.
23 Radiation dose to patients from radiopharmaceuticals. Ann ICRP. 1987;18:1-29.
24 deKemp R, Beanlands R. A revised effective dose estimate for the PET perfusion tracer Rb-82. J Nucl Med Meeting Abstracts. 2008;49(MeetingAbstracts_1):183P-b.
25 Radiation Dose to Patients from Radiopharmaceuticals, vol 18/1-4. ICRP, 1988. Publication 53.
26 Nichols KJ, Bacharach SL, Bergmann SR, et al. Instrumentation quality assurance and performance. J Nucl Cardiol. 2006;13:e25-e41.
27 PET Phantom Instructions for Evaluation of PET Image Quality/ACR Nuclear Medicine Accreditation Program. Reston, VA, American College of Radiology, 2009.
28 EC Standard 61675-1. Radionuclide Imaging Devices—Characteristics and Test Conditions. Part 1. Positron Emission Tomographs. Geneva: International Electrotechnical Commission, 1998.
29 Daube-Witherspoon ME, Karp JS, Casey ME, et al. PET performance measurements using the NEMA NU 2-2001 standard. J Nucl Med. 2002;43:1398-1409.
30 Watson CC, Casey ME, Eriksson L, et al. NEMA NU 2 performance tests for scanners with intrinsic radioactivity. J Nucl Med. 2004;45:822-826.
31 DiFilippo FP, Brunken RC. Do implanted pacemaker leads and ICD leads cause metal-related artifact in cardiac PET/CT? J Nucl Med. 2005;46:436-443.
32 Yu H, Zeng K, Bharkhada DK, et al. A segmentation-based method for metal artifact reduction. Acad Radiol. 2007;14:495-504.
33 Kennedy JA, Israel O, Frenkel A, et al. The reduction of artifacts due to metal hip implants in CT-attenuation corrected PET images from hybrid PET/CT scanners. Med Biol Eng Comput. 2007;45:553-562.
34 Hamill JJ, Brunken RC, Bybel B, et al. A knowledge-based method for reducing attenuation artefacts caused by cardiac appliances in myocardial PET/CT. Phys Med Biol. 2006;51:2901-2918.
