[level-membership-for-basic-science-category]
8 Pharmacoeconomics
While there have been marked gains in life expectancy in those countries which make up the Organization for Economic Co-operation and Development (OECD), health costs have also risen in all of them. The USA spent 16% of its national income (gross domestic product, GDP) on health in 2007, a value considerably greater than many other OECD countries (Fig. 8.1).
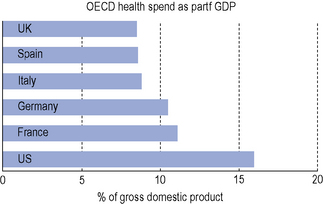
Fig. 8.1 Comparison of health spend as a percentage of gross domestic product in different countries in 2007 (OECD, 2009).
Most OECD countries have seen growth in spending on medicines outstrip growth in total health spending over this period. In the USA and Australia, pharmaceutical spending has increased at more than double the rate of growth in total health spending (OECD, 2009).
There are a number of reasons why prescribing costs are increasing:
Types of health economic evaluations
Cost-effectiveness analysis (CEA)
| Strategy | Treatment costs | Effectiveness |
|---|---|---|
| Treatment 1 | £A | 3.5 years |
| Treatment 2 | £B | 4.5 years |
Incremental cost-effectiveness ratio:

Cost–utility analysis (CUA)
There are a number of methods for the calculation of utilities.
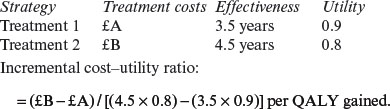
Incremental cost–utility ratio:

Costs and consequences
Decision analysis
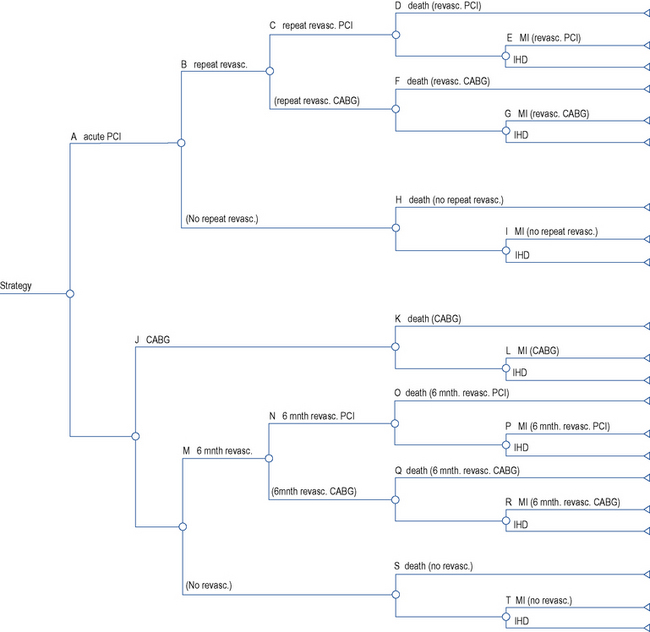
Decision analysis offers a method of pictorial representation of treatment decisions. If the results from clinical trials are available, probabilities can be placed within the arms of a decision tree and outcomes can be assessed in either monetary or quality units. An example of this can be found in the assessment of glycoprotein IIb/IIIa inhibitors in acute coronary syndrome (National Institute for Health and Clinical Excellence, 2002). The evidence of clinical and economic outcomes compares percutaneous coronary intervention and coronary artery bypass grafting. To populate a decision tree, it is necessary to obtain information from the literature on the probabilities for the clinical benefits and risks of each procedure (Table 8.1). The costs of the various procedures, consumables and bed stay are then calculated (Table 8.2). From these a decision tree can be constructed that determines the cost-effectiveness of one intervention over another (Fig. 8.2).
Table 8.1 Baseline probabilities used in the short-term model of percutaneous coronary intervention (PCI) versus coronary artery bypass graph (CABG; National Institute for Health and Clinical Excellence, 2002)
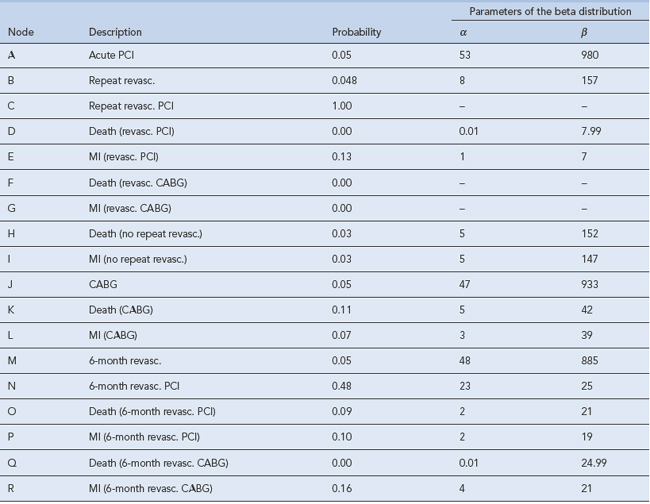
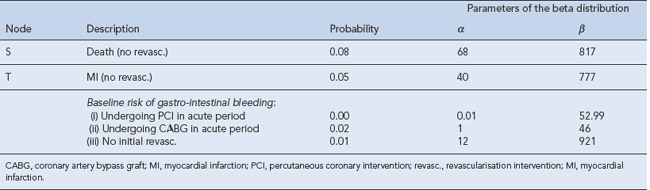
Table 8.2 Unit costs used in the analysis of percutaneous coronary intervention (PCI) versus coronary artery bypass graph (CABG; National Institute for Health and Clinical Excellence, 2002)
| Unit cost | Unit | Base-case value |
|---|---|---|
| PCI | Procedure | £1410.04 |
| CABG | Procedure | £4902.22 |
| Repeat PCI | Per diem | £2976 |
| Angiogram | Procedure | £748.25 |
| Cardiac ward | Day | £157.47 |
| Non-cardiac ward | Day | £244.00 |
| CCU | Day | £459.04 |
| Outpatient | Visit | £59.70 |
| Cardiac day case | Visit | £108.58 |
| Non-cardiac day case | Visit | £182.00 |
| Guidewire | Item | £61.75 |
| Stent | Item | £599.01 |
| Guiding catheter | Item | £37.05 |
| Blood | Unit | £85.00 |
| Full blood count | Item | £4.00 |
| Endoscopy | Item | £246.00 |
| Tirofiban | 12.5 mg vial | £146.11 (+VAT) |
| Eptifibatide | 20 mg vial | £15.54 (+VAT) |
| Eptifibatide | 75 mg vial | £48.84 (+VAT) |
| Unit cost | Unit | Base-case value |
| Abciximab | 10 mg vial | £280.00 (+VAT) |
| Omeprazole | 28 tab pack 10 mg | £18.91 |
| Clopidogrel | 28 tab pack 75 mg | £35.31 |
CABG, coronary artery bypass graft; CCU, coronary care unit; PCI, percutaneous coronary intervention.
Economic evaluation of medicines
A number of countries have introduced explicit guidelines for the conduct of economic evaluations of medicines. Others require economic evaluations before allowing a medicine onto an approved list or formulary. Guidelines have been published which aim to provide researchers and peer reviewers with background guidance on how to conduct an economic evaluation and how to check its quality (Drummond et al., 2005), whilst others (National Institute for Health and Clinical Excellence, 2009a,b) have set out how they incorporate health economics in the evaluation of medicines.
Medication non-adherence
In the UK, between a half and one-third of all medicines prescribed for long-term conditions are not taken as recommended (Horne et al., 2005) and the estimated drug cost of unused or unwanted medicines in the NHS in England is around £100 million a year (Department of Health, 2008) annually. National guidance on medicines adherence has been issued (National Institute for Health and Clinical Excellence, 2009a,b).
Incentives and disincentives
There are good examples of both incentives and disincentives being used in the NHS to save money. In England, the contract for hospitals penalises those organisations that fail to achieve their targets for reducing Clostridium difficile infections. Good antimicrobial stewardship is essential for addressing this as each case of Clostridium difficile infection can cost at least £4000. Reduction in prescribing of both fluoroquinolones and second and third generation cephalosporins is associated with a reduction in Clostridium difficile infection (Department of Health and Health Protection Agency, 2008). It follows from this that reducing the use of these agents can reduce acquisition costs of the medicines.
Examples of incentives to reduce expenditure can be seen within the NHS commissioning processes in England. A typical example involves a scheme where commissioners must make 1.5% of contract value (or equivalent non-contract activity value) available for each provider’s quality and innovation scheme and these include prescribing targets (Department of Health, 2010).
Conclusion
The effect of having budgets that are rigorously defended in every section of the health service, as occurs with the medicines budget, is to deny the application of economic decision making in the most efficient way for the population served. It is clear that pharmacoeconomics has an important part to play in the practice of therapeutics (Box 8.1) and needs to be an integral part of all planned therapeutic developments.
Box 8.1 Ten examples of the application of pharmacoeconomics in practice
Department of Health. Pharmacy in England, Building on Strengths – Delivering the Future. London: DH. 2008:1-141.
Department of Health. Using the Commissioning for Quality and Innovation (CQUIN) Payment Framework – An Addendum to the 2008 Policy Guidance for 2010/11. London: Department of Health; 2010.
Department of Health and Health Protection Agency. Clostridium difficile: How to Deal with the Problem. London: DH; 2008.
Drummond M.F, Sculpher M.J, Torrance G.W, et al, editors. Methods for the Economic Evaluation of Health Care Programmes, third ed., Oxford: Oxford University Press, 2005.
Horne R., Weinman J., Barber N., et al. Concordance, Adherence and Compliance in Medicine-Taking. Report for the National Co-ordinating Centre for NHS Service Delivery and Organisation R & D; 2005.
National Institute for Health and Clinical Excellence. Guidance on the Use of Glycoprotein IIb/IIIa Inhibitors in the Treatment of Acute Coronary Syndromes. London: NICE; 2002. Available at: http://guidance.nice.org.uk/TA47/Guidance/pdf/English
National Institute for Health and Clinical Excellence. The Guidelines Manual 2009. London: NICE. 2009:81-91. Available at: http://www.nice.org.uk/media/68D/29/The_guidelines_manual_2009_Chapter_7_Assessing_cost_effectiveness.pdf
National Institute for Health and Clinical Excellence. Medicines Adherence: Involving Patients in Decisions About Prescribed Medicines CG 76. London: NICE; 2009. Available at: http://guidance.nice.org.uk/CG76/Guidance/pdf/English
OECD. Health Data. Available at: http://www.ecosante.org/index2.php?base=OCDE&langh=ENG&langs=ENG&sessionid=, 2009.
Audit Commission. Managing the Financial Implications of NICE Guidance. Wetherby: Audit Commission Publications; 2005.
Bootman J.L., editor. Principles of Pharmacoeconomics. Cincinnati: Harvey Whitney Books Co, 2004.
Drummond M.F., editor. Methods for the Economic Evaluation of Health Care Programmes. Oxford: Oxford University Press, 2005.
Øvretveit J. Does Improving Quality Save Money? A Review of Evidence of Which Improvements to Quality Reduce Costs to Health Service Providers. London: The Health Foundation; 2009.
Rascati K.L., editor. Essentials of Pharmacoeconomics. Philadelphia: Lippincott Williams & Wilkins, 2009.
Walley T., Haycox A., Boland A., editors. Pharmacoeconomics. London: Elsevier, 2003.
[/level-membership-for-basic-science-category][not-level-membership-for-basic-science-category]
8 Pharmacoeconomics
While there have been marked gains in life expectancy in those countries which make up the Organization for Economic Co-operation and Development (OECD), health costs have also risen in all of them. The USA spent 16% of its national income (gross domestic product, GDP) on health in 2007, a value considerably greater than many other OECD countries (Fig. 8.1).
Fig. 8.1 Comparison of health spend as a percentage of gross domestic product in different countries in 2007 (OECD, 2009).
Most OECD countries have seen growth in spending on medicines outstrip growth in total health spending over this period. In the USA and Australia, pharmaceutical spending has increased at more than double the rate of growth in total health spending (OECD, 2009).
There are a number of reasons why prescribing costs are increasing:
