10 Paediatrics
For many purposes it has been common to subdivide childhood into the following periods:
For the purpose of drug dosing, children over 12 years of age are often classified as adults. This is inappropriate because many 12 year olds have not been through puberty and have not reached adult height and weight. The International Committee on Harmonization (2001) has suggested that childhood be divided into the following age ranges for the purposes of clinical trials and licensing of medicines:
Demography
Children make substantial use of hospital-based services. It has been estimated that of the 14 million attendances at hospital emergency departments reported each year in England, 2.9 million were for children. At the same time there were 4.5 million outpatient attendances and 700,000 in-patient admissions. The 10 most common admission diagnoses in a specialist children’s hospital over an 18-month period are shown in Table 10.1.
Table 10.1 Top 10 diagnoses on admission to a specialist children’s hospital
| Ranking | Diagnosis |
|---|---|
| 1 | Respiratory tract infections |
| 2 | Chronic diseases of tonsils and adenoids |
| 3 | Asthma |
| 4 | Abdominal and pelvic pain |
| 5 | Viral infection (unspecified site) |
| 6 | Non-suppurative otitis media |
| 7 | Inguinal hernia |
| 8 | Unspecified head injury |
| 9 | Gastroenteritis/colitis |
| 10 | Undescended testicle |
Congenital anomalies
Neural tube defects (spina bifida) are one example of devastating congenital malformations that have been influenced by public health intervention programmes. The results of a long-term study (MRC Vitamin Study Research Group, 1991) showed that folate supplementation prevented 72% of neural tube defects when given to women at high risk of having a child with a neural tube defect. Hence, folate supplementation is now part of the routine advice given in antenatal clinics.
The normal child
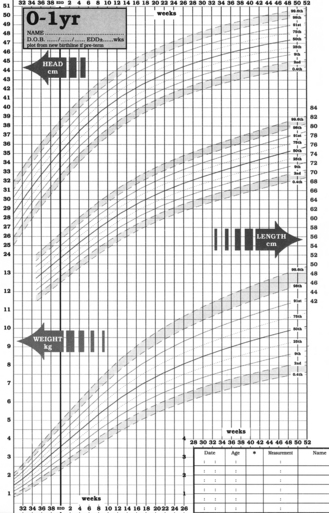
Weight is one of the most widely used and obvious indicators of growth, and progress is assessed by recording weights on a percentile chart (Fig. 10.1). A weight curve for a child which deviates from the usual pattern requires further investigation. Separate recording charts are used for boys and girls and since percentile charts are usually based on observations of the white British population, adjustments may be necessary for some ethnic groups. The World Health Organization (WHO) has challenged the widely used growth charts, based on growth rates of infants fed on formula milk. In 2006, it published new growth standards based on a study of more than 8000 breast-fed babies from six countries around the world. The optimum size is now that of a breast-fed baby. Recently, new growth charts have been introduced for children from birth to 4 years of age. These combine the UK and WHO data. Copies can be accessed at http://www.rcpch.ac.uk/Research/UK-WHO-Growth-Charts.
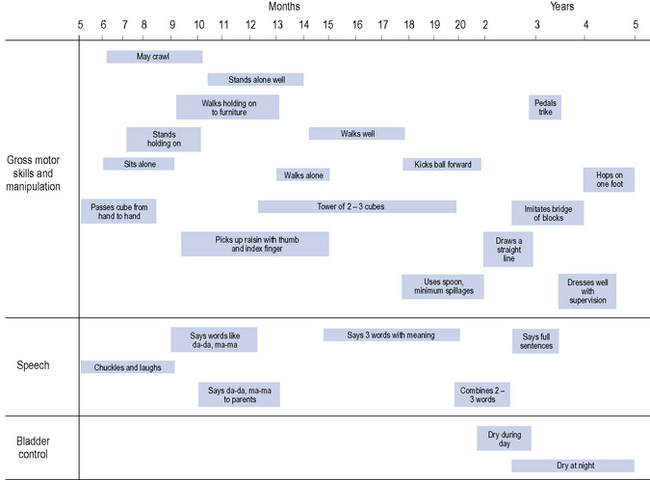
For infants up to 2 years of age, head circumference is also a useful parameter to monitor. In addition to the above, assessments of hearing, vision, motor development and speech are undertaken at the child health clinics. A summary of age-related development is shown in Fig. 10.2.
Advice on the current immunisation schedule can be found in the current edition of the British National Formulary for Children.
Drug disposition
Pharmacokinetic factors
An understanding of the variability in drug disposition is essential if children are to receive rational and appropriate drug therapy (Anderson and Holford, 2008, 2009). For convenience, the factors that affect drug disposition will be dealt with separately. However, when treating a patient all the factors have a dynamic relationship and none should be considered in isolation.
Absorption
Distribution
As a percentage of total body weight, the total body water and extracellular fluid volume decrease with age (Table 10.2). Thus, for water-soluble drugs such as aminoglycosides, larger doses on a milligram per kilogram of body weight basis are required in the neonate than in the older child to achieve similar plasma concentrations.
Table 10.2 Extracellular fluid volume and total body water as a percentage of body weight at different life stages
| Age | Total body water (%) | Extracellular fluid (%) |
|---|---|---|
| Preterm neonate | 85 | 50 |
| Term neonate | 75 | 45 |
| 3 months | 75 | 30 |
| 1 year | 60 | 25 |
| Adult | 60 | 20 |
Drug metabolism
At birth the majority of the enzyme systems responsible for drug metabolism are either absent or present in considerably reduced amounts compared with adult values, and evidence indicates that the various systems do not mature at the same time. This reduced capacity for metabolic degradation at birth is followed by a dramatic increase in the metabolic rate in the older infant and young child. In the 1–9 year age group in particular, metabolic clearance of drugs is shown to be greater than in adults, as exemplified by theophylline, phenytoin and carbamazepine. Thus, to achieve plasma concentrations similar to those observed in adults, children in this age group may require a higher dosage than adults on a milligram per kilogram basis (Table 10.3).
Table 10.3 Theophylline dosage in children older than 1 year
| Age | Dosage (mg/kg/day) |
|---|---|
| 1–9 years | 24 |
| 9–12 years | 20 |
| 12–16 years | 18 |
| Adult | 13 |
Renal excretion
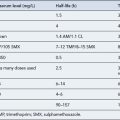
The anatomical and functional immaturity of the kidneys at birth limits renal excretory capacity. Below 3–6 months of age the glomerular filtration rate is lower than that of adults, but may be partially compensated for by a relatively greater reduction in tubular reabsorption. Tubular function matures later than the filtration process. Generally, the complete maturation of glomerular and tubular function is reached only towards 6–8 months of age. After 8 months the renal excretion of drugs is comparable with that observed in older children and adults. Changes in renal clearance of gentamicin provide a good example of the maturation of renal function (Table 10.4).
| Plasma half-life | |
|---|---|
| Small premature infants weighing less than 1.5 kg | 11.5 h |
| Small premature infants weighing 1.5–2 kg | 8 h |
| Term infants and large premature infants less than 1 week of age | 5.5 h |
| Infants 1 week to 6 months | 3–3.5 h |
| Infants more than 6 months to adulthood | 2–3 h |
Drug therapy in children
Dosage
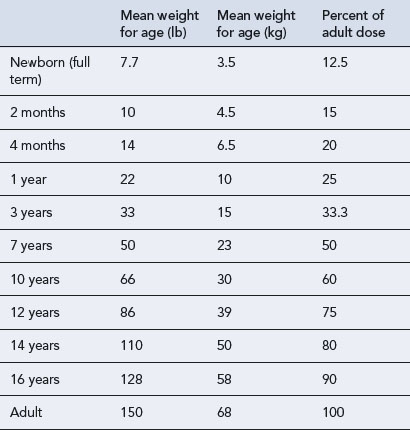
While age, weight and height are the easiest parameters to measure, the changing requirement for drug dosage during childhood corresponds most closely with changes in body surface area (BSA). Nomograms which allow the surface area to be easily derived are available. There are practical problems in using the surface area method for prescribing; accurate height and weight may be difficult to obtain in a sick child, and manufacturers rarely provide dosage information on a surface area basis. The surface area formula for children has been used to produce the percentage method, giving the percentage of adult dose required at various ages and weights, although use should be reserved for exceptional circumstances (Table 10.5).
Choice of preparation
The choice of preparation and its formulation will be influenced by the intended route of administration, the age of the child, availability of preparations, other concomitant therapy and, possibly, underlying disease states. The problems of administering medicines to children were reviewed by the European Medicines Evaluation Agency (EMEA, 2005).
Parenteral route
Fluid overload
Dilution of parenteral preparations for infusion may also cause inadvertent fluid overload in children. In fluid-restricted or very young infants, it is possible that the volume of diluted drug can exceed the daily fluid requirement. In order to appreciate this problem, the paediatric practitioner should become familiar with the fluid volumes that children can tolerate. As a guide these volumes can be calculated using the following formula: 100 mL/kg for the first 10 kg, plus 50 mL/kg for the next 10 kg, plus 20 mL/kg thereafter. Worked examples are given in Table 10.6. It is important to remember that these volumes do not account for losses such as those caused by dehydration, diarrhoea or artificial ventilation. While the use of more concentrated infusion solutions may overcome the problem of fluid overload, stability data on concentrated solutions are often lacking. It may, therefore, be necessary to manipulate other therapy to accommodate the treatment or even to consider alternative treatment options. Fluid overload may also result from excessive volumes of flushing solutions and is described later. Guidance on selecting appropriate intravenous fluids for administration to children to avoid fluid induced hyponatraemia are available (National Patient Safety Agency, 2007).
Table 10.6 Calculation of standard daily fluid requirements in paediatric patients
| 15 kg patient | 35 kg patient |
|---|---|
| 100 mL/kg × 10 kg = 1000 mL | 100 mL/kg × 10 kg = 1000 mL |
| Plus 50 mL/kg × 5 kg = 250 mL | Plus 50 mL/kg × 10 kg = 500 mL |
| Total = 1250 mL/day | Plus 20 mL/kg × 15 kg = 300 mL |
| Total = 1800 mL/day |
Pulmonary route
The use of aerosol inhalers for the prevention and treatment of asthma presents particular problems for children because of the coordination required. The availability of breath-activated devices and spacer devices and large-volume holding chambers has greatly improved the situation. Guidance has been published on the use of inhaler devices in children less than 5 years of age (National Institute for Health and Clinical Excellence, 2000) and older children (National Institute for Health and Clinical Excellence, 2002) and updated in 2008 (British Thoracic Society and Scottish Intercollegiate Guidelines Network, 2008). Recent experience has shown that different types of large-volume holding chambers alter drug delivery and absorption and should not be considered as interchangeable.
Dose regimen selection
A summary of the factors to be considered when selecting a drug dosage regimen or route of administration for a paediatric patient is shown in Table 10.7.
Table 10.7 Factors to be considered when selecting a drug dosage regimen or route of administration for a paediatric patient
| Factor | Comment |
|---|---|
| 1. Age/weight/surface area | Is the weight appropriate for the stated age? If it is not, confirm the difference. Can the discrepancy be explained by the patient’s underlying disease, for example, patients with neurological disorders such as cerebral palsy may be significantly underweight for their age? Is there a need to calculate dosage based on surface area, for example, cytotoxic therapy? Remember heights and weights may change significantly in children in a very short space of time. It is essential to recheck the surface area at each treatment cycle using recent heights and weights |
| 2. Assess the appropriate dose | The age/weight of the child may have a significant influence on the pharmacokinetic profile of the drug and the manner in which it is handled. In addition, the underlying disease state may influence the dosage or dosage interval |
| 3. Assess the most appropriate interval | In addition to the influence of disease states and organ maturity on dosage interval, the significance of the child’s waking day is often overlooked. A child’s waking day is generally much shorter than that of an adult and may be as little as 12 h. Instructions given to parents particularly should take account of this, for example, the instruction ‘three times a day’ will bear no resemblance to ‘every 8 hours’ in a child’s normal waking day. If a preparation must be administered at regular intervals, then the need to wake the child should be discussed with the parents or preferably an alternative formulation, such as a sustained-release preparation, should be considered |
| 4. Assess the route of administration in the light of the disease state and the preparations and formulations available | Some preparations may require manipulation to ensure their suitability for administration by a specific route. Even preparations which appear to be available in a particular form may contain undesirable excipients that require alternatives to be found, for example, patients with the inherited metabolic disorder phenylketonuria should avoid oral preparations containing the artificial sweetener aspartame because of its phenylalanine content |
| 5. Consider the expected response and monitoring parameters | Is the normal pharmacokinetic profile altered in children? Are there any age-specific or long-term adverse effects, such as on growth, that should be monitored? |
| 6. Interactions | Drug interactions remain as important in reviewing paediatric prescriptions as they are in adult practice. However, drug–food interactions may be more significant; particularly drug–milk interactions in babies having 5–6 milk feeds per day |
| 7. Legal considerations | Is the drug licensed? If an unlicensed drug is to be used, the pharmacist should have sufficient information to support its use |
Counselling, adherence and concordance
Information provided with medicines is often complex and may not always be relevant to children. The Royal College of Paediatrics and Child Health in conjunction with other bodies have launched a range of information leaflets on medicines for parents and carers. The leaflets cover off-label use of specific drugs and aim to provide appropriate and accurate and easily understandable information on dosage and side effects to those administering medicines to children. The leaflets can be downloaded from the website: www.medicinesforchildren.org.uk
Medicines in schools
Policies and guidance
Advice has been provided for schools and their employers on how to manage medicines in schools (Department for Education and Skills, 2005). The roles and responsibilities of employers, parents and carers, governing bodies, head teachers, teachers and other staff and of local health services are all explained. The advice considers staffing issues such as employment of staff, insurance and training. Other issues covered include drawing up a health care plan for a pupil, confidentiality, record keeping, the storage, access and disposal of medicines, home-to-school transport, and on-site and off-site activities. It also provides general information on four common conditions that may require management at school: asthma, diabetes, epilepsy and anaphylaxis.
Monitoring parameters
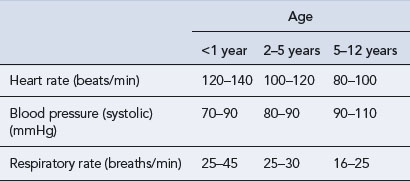
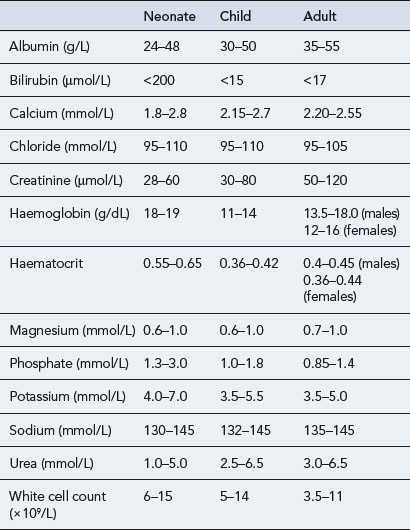
Paediatric vital signs (Table 10.8) and haematological and biochemical parameters (Table 10.9) change throughout childhood and differ from those in adults. The figures presented in the tables are given as examples and may vary from hospital to hospital.
Adverse drug reactions
Medication errors
Licensing medicines for children
Unlicensed and ‘off-label’ medicines
It has been reported that up to 35% of drugs used in a children’s hospital and 10% of drugs used in general practice may be used outside the terms of the approved, licensed indications (McIntyre et al., 2000, Turner et al., 1998). The term ‘off-label’ is often used to describe this. Because many of these medicines will have been produced in ‘adult’ dose forms, such as tablets, it is often necessary to prepare extemporaneously a suitable liquid preparation for the child. This may be made from the licensed dose form, for example, by crushing tablets and adding suitable excipients, or from chemical ingredients. An appropriate formula with a validated expiry period and ingredients to approved standards should be used. Care must be taken to ensure accurate preparation, particularly when using formulae or ingredients which are unfamiliar.
Recent legislation on medicines for children
The WHO has a ‘Make medicines child size’ programme to stimulate the development of age-appropriate formulations of medicines for children, particularly for those which appear in the List of Essential Medicines for Children. In June 2010, the first ever WHO model formulary for children was released to provide information on how to use over 240 essential medicines for treating illness and disease in children from 0 to 12 years of age. A number of individual countries have developed their own formularies over the years, but until now there was no single comprehensive guide for all countries (available at: http://www.who.int/childmedicines/en/).
Service frameworks
National service frameworks (NSFs) are long-term strategies for improving specific areas of care. Two paediatric service frameworks have been published; one for paediatric intensive care (Department of Health, 2002) and another for children, young people and maternity services (Department of Health, 2004) and continue to influence practice.
The recommendations that relate to the use of medicines for children and young people include:
Markers of good practice are defined as:
Case 10.1
| Name: PT | |
| Age: 7 years old | |
| Sex: Male | |
| Weight: 16 kg | |
| Presenting condition: | Presented in the emergency department with a 2-day history of worsening groin and hip pain. Could not bear weight. Patient was febrile with a temperature of 39.2°C, vomiting and dehydrated. There was no history of injury. |
| Previous medical history: | Nil of note |
| Allergies: | No known drug allergies |
| Drug history: | Nil of note |
| Differential diagnosis: | Septic arthritis, osteomyelitis |
| Tests: | Urea and electrolytes |
| Full blood count | |
| CRP, ESR | |
| Blood culture and sensitivities | |
| X-ray (hips and abdomen) | |
| Bone scan | |
| Results: | Bone scan revealed right pubic osteomyelitis |
| CRP = 56 mg/L (normal range 0–10 mg/L) | |
| ESR = 34 mm/h (normal range 1–10 mm/h) | |
| Blood culture revealed Staphylococcus aureus sensitive to flucloxacillin | |
| Prescribed: | Flucloxacillin i.v. 800 mg four times a day for 2 weeks. To be followed by oral flucloxacillin 800 mg four times a day for 4 weeks |
| Progress: | Temperature settled and ESR/CRP decreased following initiation of antibiotic therapy |
Answer
There are a number of points to consider in this patient.
Case 10.2
| Name: CS | |
| Age: 18 months old | |
| Sex: Female | |
| Weight: 10 kg | |
| Presenting condition: | Severe right-sided abdominal pain |
| Vomiting and loss of appetite | |
| Increased temperature 38.2°C | |
| Previous medical history: | Nil of note |
| Allergies: | No known allergies |
| Drug history: | Nil of note |
| Tests: | Ultrasound |
| Provisional diagnosis: | Appendicitis |
| CS went to theatre where an appendicectomy was performed. The appendix was noted to be perforated. | |
| Prescribed: | Morphine 50 mg in 50 mL to run at 1–4 mL/h (10–40 μcg/kg/h) |
| Paracetamol 200 mg four times a day as required orally or per rectum | |
| Diclofenac 12.5 mg twice a day as required per rectum. | |
| or | |
| Ibuprofen 100 mg four times a day as required orally when tolerating milk | |
| Five days of i.v. antibiotic therapy with: | |
| Gentamicin 70 mg daily | |
| Ampicillin 250 mg four times a day | |
| Metronidazole 75 mg three times a day | |
Answer
Anderson B.J., Holford N.H.G. Mechanism-based concepts of size and maturity in pharmacokinetics. Annu. Rev. Pharmacol. Toxicol.. 2008;48:303-332.
Anderson B.J., Holford N.H. Mechanistic basis of using body size and maturation to predict clearance in humans. Drug. Metab. Pharmacokinet.. 2009;24:25-36.
British National Formulary for Children. London: Pharmaceutical Press. 2010. Available at: www.bnfc.nhs.uk/bnfc/
British Thoracic Society and Scottish Intercollegiate Guidelines Network. British Guideline on the Management of Asthma. Edinburgh: SIGN; 2008. Available at http://www.sign.ac.uk/guidelines/fulltext/101/index.html
Department for Education and Skills. Managing Medicines in Schools and Early Years Settings. London: Department for Education and Skills; 2005. Available at http://publications.education.gov.uk/eOrderingDownload/1448–2005PDF-EN-02.pdf
Department of Health. National Service Framework for Paediatric Intensive Care. London: Stationery Office; 2002.
Department of Health. The National Service Framework for Children, Young People and Maternity Services. London: Stationery Office; 2004. Available at http://www.dh.gov.uk/en/Publicationsandstatistics/Publications/PublicationsPolicyAndGuidance/DH_4089100
European Medicines Evaluation Agency. Reflection Paper: Formulations of Choice for the Paediatric Population. London: EMEA; 2005. Available at http://www.ema.europa.eu/docs/en_GB/document_library/Scientific_guideline/2009/09/WC500003782.pdf
International Committee on Harmonization. Note for Guidance on Clinical Investigation of Medicinal Products in the Paediatric Population. London: European Medicines Agency; 2001. Available at: http://www.ema.europa.eu/docs/en_GB/document_library/ Scientific_guideline/2009/09/WC500002926.pdf
McIntyre J., Conroy S., Avery A., et al. Unlicensed and off label prescribing of drugs in general practice. Arch. Dis. Child.. 2000;83:498-501.
MRC Vitamin Study Research Group. Prevention of neural tube defects: results of the Medical Research Council vitamin study. Lancet. 1991;338:131-137.
National Institute for Health and Clinical Excellence. Guidance on the Use of Inhaler Systems (Devices) in Children Under the Age of 5 Years with Chronic Asthma, Technology Appraisal 10.. London: NICE. 2000. Available at http://www.nice.org.uk/nicemedia/pdf/NiceINHALERguidance.pdf
National Institute for Health and Clinical Excellence. Inhaler Devices for Routine Treatment of Chronic Asthma in Older Children (aged 5–15 years), Technology Appraisal No. 38.. London: NICE. 2002. Available at http://www.nice.org.uk/nicemedia/live/11450/32338/32338.pdf
National Patient Safety Agency. Reducing the Risk of Hyponatraemia When Administering Intravenous Solutions to Children. London: NPSA; 2007. Available at http://www.nrls.npsa.nhs.uk/resources/?EntryId45=59809
Turner S., Longworth A., Nunn A.J., et al. Unlicensed and off-label drug use in paediatric wards: prospective study. Br. Med. J.. 1998;316:343-345.
Advanced Life Support Group. Advanced Paediatric Life Support: The Practical Approach, fourth ed. London: Blackwell; 2005.
Advanced Life Support Group. Prehospital Paediatric Life Support: The Practical Approach. London: BMJ Books; 2005.
Behrman R.E., Kliegman R.M., Jenson H.B., et al, editors. Nelson Textbook of Pediatrics, eighteenth ed., Philadelphia: W. B. Saunders, 2007.
Lewisham and North Southwark Health Authority. Guy’s, St Thomas’s and Lewisham Hospitals Paediatric Formulary, seventh ed. London: Lewisham and North Southwark Health Authority; 2005.
NHS Education for Scotland (NES). An Introduction to Paediatric Pharmaceutical Care. Available online at www.nes.scot.nhs.uk/pharmacy, 2009.
Phelps S.J., Hak E.B. Teddy Bear Book: Pediatric Injectable Drugs, eighth ed. Bethesda: American Society of Health System Pharmacists; 2007.
Taketomo C., Hodding J.H., Kraus D.M. Pediatric Dosage Handbook, sixteenth ed. Hudson: Lexi-Comp; 2009.
Child Growth Standards. www.who.int/childgrowth/en/.
Contact a Family (for families with disabled children). www.cafamily.org.uk/.
Immunization against infectious diseases Immunization against infectious diseases. www.dh.gov.uk/PolicyAndGuidance/HealthAndSocialCareTopics/GreenBook/.
Neonatal and Paediatric Pharmacists Group (NPPG). www.nppg.org.uk/.
Royal College of Paediatrics and Child Health. www.rcpch.ac.uk/.
The National Congenital Anomalies System. www.statistics.gov.uk/CCI/SearchRes.asp?term=congenital+anomalies.

