Oxygenation Assessments
After reading this chapter, you will be able to:
• Write the equation for the following common oxygen transport calculations:
• Oxygen dissolved in the blood plasma
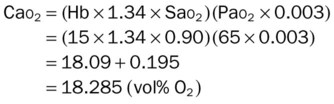
• Oxygen content of arterial blood (Cao2)
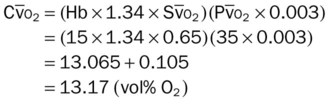
• Oxygen content of venous blood ( )
)
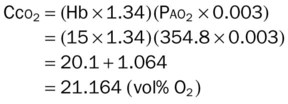
• Oxygen content of pulmonary capillary blood (Cco2)
• Calculate the following oxygen tension–based indices:
• Alveolar-arterial oxygen tension difference (P[a-a]o2)
• Ideal alveolar gas equation (Pao2)
• Calculate the following oxygen saturation– and content–based indices:
• Arterial-venous oxygen content difference (C[a- ]o2)
]o2)
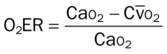
• Oxygen extraction ratio (O2ER)
• Mixed venous oxygenation saturation ( )
)
 )
)• Describe the clinical significance of pulmonary shunting.
• List factors that increase and decrease the previously listed oxygen transport calculations.
• Discuss how specific respiratory diseases alter the oxygen transport studies.
• Differentiate between hypoxemia and hypoxia.
• Distinguish the classification differences between mild, moderate, and severe hypoxemia.
• Describe the following types of hypoxia:
• List common causes for each of the listed types of hypoxia.
• Describe the following pathophysiologic conditions associated with chronic hypoxia:
• Hypoxic vasoconstriction of the lungs
• Define key terms and complete self-assessment questions at the end of the chapter and on Evolve.
 ]
] )
) )
) )
) )
)

Total Oxygen Content
Case Example
 ), and pulmonary capillary blood, also known as the oxygen content of capillary blood (Cc
 : Oxygen content of mixed venous blood
 ) + (
) + ( × 0.003)
 , and Cc
Oxygenation Indices
A number of oxygen transport measurements are available to assess the oxygenation status of the critically ill patient. Results from these studies can provide important information to adjust therapeutic interventions. The oxygen transport studies can be divided into (1) the oxygen tension–based indices, and (2) the oxygen saturation– and content–based indices.‡
Oxygen Tension–Based Indices
Arterial Oxygen Tension (PaO2)
Alveolar-Arterial Oxygen Tension Difference (P[A-a]O2)
The ideal alveolar gas equation is written as follows:

where PB is the barometric pressure, Pao2 is the partial pressure of oxygen within the alveoli, Ph2o is the partial pressure of water vapor in the alveoli (which is 47 mm Hg), Fio2 is the fractional concentration of inspired oxygen, Paco2 is the partial pressure of arterial carbon dioxide, and the number 1.25 is a factor that adjusts for alterations in oxygen tension resulting from variations in the respiratory exchange ratio, or respiratory quotient (RQ). The RQ is the ratio of carbon dioxide production ( ) divided by oxygen consumption (
 ). Under normal circumstances, approximately 250 mL of oxygen per minute are consumed by the tissue cells and approximately 200 mL of carbon dioxide are excreted into the lung. Thus, the RQ is normally about 0.8.
Oxygen Saturation– and Content–Based Indices
The oxygen saturation– and content–based indices can serve as excellent indicators of an individual’s cardiac and ventilatory status. These oxygenation studies are derived from the patient’s total oxygen content in the arterial blood (Cao2) mixed venous blood ( ), and pulmonary capillary blood (Cco2). As explained earlier in this chapter, the Cao2,
  , and Cco2 are calculated using the following formulas*:


 ).
).
 is total cardiac output (L/min), Ca
 ]
] (Ca
(Ca ). Therefore if a patient’s Ca
 is 8 vol%, the C(
 )
)
 )
) )
) ) often occur earlier than oxygen changes in arterial blood gas. Clinically, the patient’s C(
 )
) )
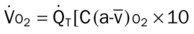
) ), also known as oxygen uptake, is the amount of oxygen consumed by the peripheral tissue cells during a 1-minute period. The
  is calculated as follows:
 is the total cardiac output (L/min), C(
 )
) )
) )
)
 is about 250 mL of oxygen per minute. Clinically, the
  increases in response to seizures, exercise, hyperthermia, and body size. The
  decreases in response to skeletal muscle relaxation (e.g., induced by drugs), peripheral shunting (e.g., sepsis), certain poisons (e.g., cyanide), and hypothermia. It is often as a function of body weight (i.e., mL/kg or mL/lb).
 )
) of 10 vol%, the O2ER would be 33%:
Mixed Venous Oxygen Saturation
 )is often used as an early indicator of changes in the patient’s C(
 )
) , and O2ER. The
  can signal changes in the patient’s C(
 )
) , and O2ER earlier than arterial blood gases because the Pa
 )
) , and O2ER changes.
 is approximately 75%. Clinically, the
  decreases in response to (1) a decreased cardiac output, (2) exercise, (3) seizures, and (4) hyperthermia. The
  increases in response to (1) an increased cardiac output, (2) skeletal muscle relaxation (e.g., induced by drugs), (3) peripheral shunting (e.g., sepsis), (4) certain poisons (e.g., cyanide), and (5) hypothermia.
Over the past several years, there has been a move away from the oxygen tension–based indices to the oxygen saturation– and content–based indices when the oxygenation status of the critically ill patient is monitored. Table 5-1 summarizes the way various clinical factors alter the patient’s Do2,  , C(
, C( )o2, O2ER, and
  .
.
Table 5-1
Clinical Factors That Affect Oxygen Transport Calculations
| Oxygen Transport Study | Equation | Factors That Increase Value | Factors That Decrease Value |
| Total oxygen delivery (Do2) |
Do2 =  × (Cao2 × 10) × (Cao2 × 10) |
(C(
 )o2)
)o2) )o2
)o2 )
)
(O2ER)
(
 )
)(
 )
)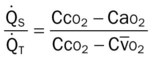
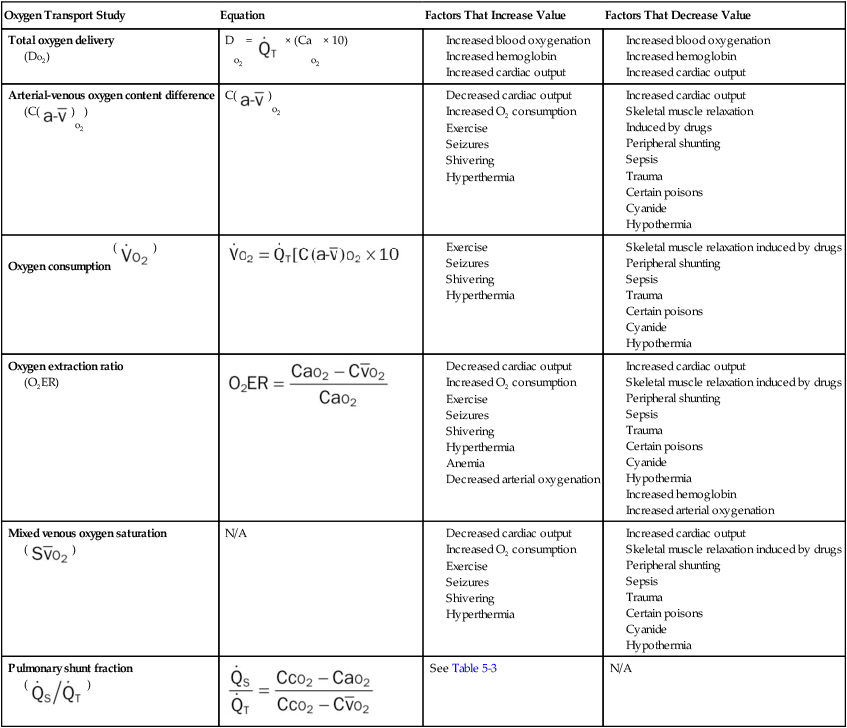
Pulmonary Shunt Fraction
where  is the cardiac output that is shunted,
  is the total cardiac output, Cco2 is the oxygen content of pulmonary capillary blood, Cao2 is the oxygen content of arterial blood, and
  is the oxygen content of mixed venous blood.

A clinical example of the shunt calculation follows.
Shunt Study Calculation in an Automobile Accident Victim
 : 35 mm Hg (
 × 65%)
 can now be calculated. (The clinician should remember that P
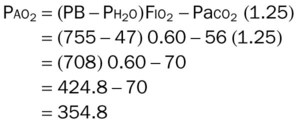
With this information the patient’s intrapulmonary shunt fraction can now be calculated:
Table 5-2 shows the clinical significance of pulmonary shunting. Table 5-3 summarizes how specific respiratory diseases alter the oxygen saturation– and content–based indices.*
Table 5-2
Clinical Significance of Pulmonary Shunting
| Degree of Pulmonary Shunting (%) | Clinical Significance |
| Below 10% | Normal lung status |
| 10% to 20% | Indicates a pulmonary abnormality but is not significant in terms of cardiopulmonary support |
| 20% to 30% | May be life threatening, possibly requiring cardiopulmonary support |
| Greater than 30% | Serious life-threatening condition, almost always requiring cardiopulmonary support |
Table 5-3
Oxygenation Index Changes Commonly Seen in Respiratory Diseases
| Pulmonary Disorder | Oxygenation Indices | |||||
 |
Do2* |  |
C( )o2 )o2 |
O2ER |  |
|
| Obstructive airway diseases | ↑ | ↓ | ∼† | ∼ | ↑ | ↓ |
| Chronic bronchitis | ||||||
| Emphysema | ||||||
| Bronchiectasis | ||||||
| Asthma | ||||||
| Cystic fibrosis | ||||||
| Croup syndrome | ||||||
| Infectious pulmonary diseases | ↑ | ↓ | ∼ | ∼ | ↑ | ↓ |
| Pneumonia | ||||||
| Lung abscess | ||||||
| Fungal disorders | ||||||
| Tuberculosis | ∼ | |||||
| Pulmonary edema | ↑ | ↓ | ∼ | ↑‡ | ↑ | ↓ |
| Pulmonary embolism | ↑ | ↓ | ∼ | ↑‡ | ↑ | ↓ |
| Lung collapse | ↑ | ↓ | ↑‡ | ↑ | ↓ | |
| Flail chest | ||||||
| Pneumothorax | ||||||
| Pleural disease (e.g., hemothorax) | ||||||
| Kyphoscoliosis | ↑ | ↓ | ∼ | ∼ | ↑ | ↓ |
| Pneumoconiosis | ↑ | ↓ | ∼ | ∼ | ↑ | ↓ |
| Cancer of the lung | ↑ | ↓ | ∼ | ∼ | ↑ | ↓ |
| Adult respiratory distress syndrome | ↑ | ↓ | ∼ | ∼ | ↑ | ↓ |
| Idiopathic (infant) respiratory distress syndrome | ↑ | ↓ | ∼ | ∼ | ↑ | ↓ |
| Chronic interstitial lung disease | ↑ | ↓ | ∼ | ∼ | ↑ | ↓ |
| Sleep apnea | ↑ | ↓ | ∼ | ↑‡ | ↑ | ↓ |
| Smoke inhalation | ||||||
| Without surface burns | ↑ | ↓ | ∼ | ∼ | ↑ | ↓ |
| With surface burns | ↑ | ↓ | ↑ | ↑ | ↑ | ↓ |
| Near drowning (wet) | ↑ | ↓ | ↑ | ↑ | ↑ | ↓ |
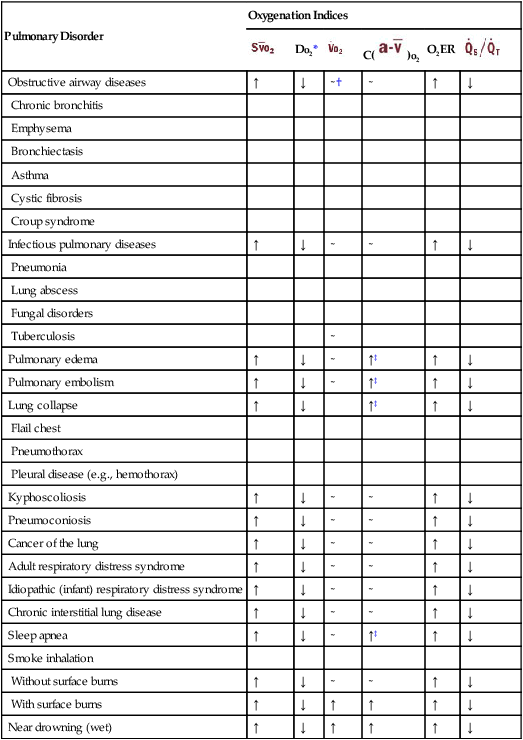
*The Do2 may be normal in patients with an increased cardiac output, an increased hemoglobin level (polycythemia), or a combination of both. For example, a normal Do2 is often seen in patients with chronic obstructive pulmonary disease and polycythemia. When the Do2 is normal, the patient’s O2ER is usually normal.
‡The increased C( )o2 is associated with a decreased cardiac output.
Hypoxemia versus Hypoxia
Hypoxemia refers to an abnormally low arterial oxygen tension (Pao2) and is frequently associated with hypoxia, which is an inadequate level of tissue oxygenation (see following discussion). Although the presence of hypoxemia strongly suggests tissue hypoxia, it does not necessarily mean the absolute existence of tissue hypoxia. For example, the reduced level of oxygen in the arterial blood may be offset by an increased cardiac output. Hypoxemia is commonly classified as mild hypoxemia, moderate hypoxemia, or severe hypoxemia (Table 5-4). Clinically, the presence of mild hypoxemia generally stimulates the oxygen peripheral chemoreceptors to increase the patient’s breathing rate and heart rate (see Figure 2-25).
Table 5-4
| Classification | Pao2 (mm Hg) (Rule of Thumb) |
| Normal | 80-100 |
| Mild hypoxemia | 60-80 |
| Moderate hypoxemia | 40-60 |
| Severe hypoxemia | <40 |
*The hypoxemia classifications provided in this table are generally accepted clinical values. Minor variations of these classifications are found in the literature. In addition, a number of clinical factors may mandate some degree of changes in the listed values (e.g., a Pao2 of 55 mm Hg may be called “severe” in the patient with a very low hemoglobin level or carbon monoxide poisoning). As a general rule of thumb, however, the hypoxemia classifications and Pao2 range(s) presented in this table are useful guidelines.
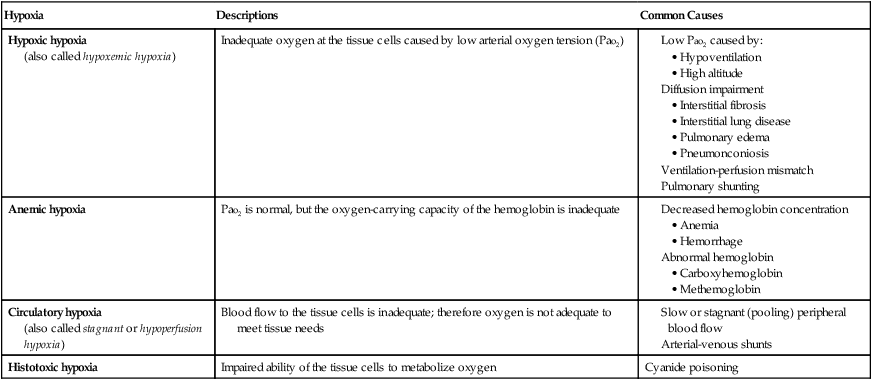
Hypoxia refers to low or inadequate oxygen for aerobic cellular metabolism. Hypoxia is characterized by tachycardia, hypertension, peripheral vasoconstriction, dizziness, and metal confusion. Table 5-5 provides an overview of the four main types of hypoxia. When hypoxia exists, alternate anaerobic mechanisms are activated in the tissues that produce dangerous metabolites—such as lactic acid—as waste products. Lactic acid is a nonvolatile acid and causes the pH to decrease.
Table 5-5
| Hypoxia | Descriptions | Common Causes |
| Hypoxic hypoxia (also called hypoxemic hypoxia) |
Inadequate oxygen at the tissue cells caused by low arterial oxygen tension (Pao2) |
(also called stagnant or hypoperfusion hypoxia)
Pathophysiologic Conditions Associated with Chronic Hypoxia
Cor Pulmonale
Hypoxic Vasoconstriction of the Lungs
The cor pulmonale associated with chronic respiratory disorders may develop from the combined effects of polycythemia and pulmonary arterial vasoconstriction. Both of these conditions occur as a result of chronic hypoxia. Clinically, cor pulmonale leads to the accumulation of venous blood in the large veins. This condition causes (1) the neck veins to become distended (see Figure 2-46), (2) the extremities to show signs of peripheral edema and pitting edema (see Figure 2-45), and (3) the liver to become enlarged and tender.
*It is assumed that the hemoglobin saturation with oxygen in the pulmonary capillary blood is 100%.
†See Ideal Alveolar Gas Equation, Appendix VIII.
‡See Appendix X for a representative example of a cardiopulmonary profile sheet used to monitor the oxygen transport status of the critically ill patient.
*See Ideal Alveolar Gas Equation, Appendix VIII.
*Note in Table 5-3 that virtually every respiratory disorder presented in this textbook causes the  to increase and the Do2 to decrease.
