Chapter 24 Oxygen therapy
In mammals energy is provided by both anaerobic and aerobic respiration, the former being inadequate to provide adequate energy alone, so oxygen is the key ingredient to survival. Aerobic respiration is the most efficient mechanism for adenosine triphosphate (ATP) production. Absence or lack of ATP results in failure of energy-hungry enzyme systems, loss of cell homeostasis, and initially cellular and later organism death. A substantial part of critical care is targeted at treating and/or preventing hypoxia. An understanding of the common pathways that lead to cellular hypoxia from whatever cause is vital to providing appropriate support and treatment to the acutely unwell patient. This chapter will review the pathophysiology of oxygen delivery from atmosphere to cell; methods of assessment; types of therapy that can be acutely administered; and the potential hazards of oxygen use.
PATHOPHYSIOLOGY OF OXYGEN DELIVERY

1 where K is the diffusion constant for a particular gas, A is the surface of a membrane, T is the membrane’s thickness and ΔP the difference in partial pressure across the membrane. About 600 million years ago single-celled organisms evolved into multicellular organisms. As oxygen is poorly soluble in water, diffusion alone became insufficient to deliver oxygen to the cells, and novel methods of delivery evolved, most notably the cardiovascular system.2 This provided the means to deliver oxygen around the body.
OXYGEN DELIVERY
This chain of events is oxygen delivery ( ).
).
STEP 1: CONVECTION – VENTILATION
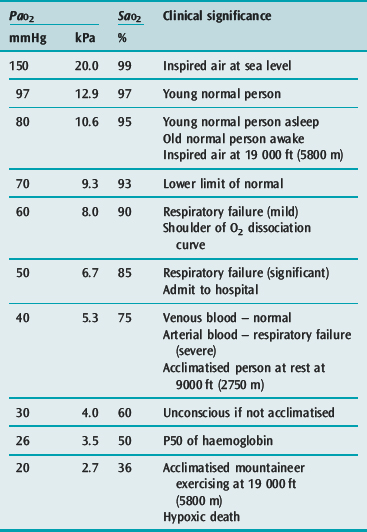
The first step occurs in the lung in the form of pulmonary ventilation. At sea level the partial pressure of oxygen in environmental air is approximately 160 mmHg. On inspiration the air is humidified and mixed with exhaled carbon dioxide (CO2) such that at the alveolus the PaO2 is 100 mmHg. This will vary in different environments and different conditions (Table 24.1). Much of oxygen therapy is based on increasing oxygen delivery into the lungs, whether it be by masks or other devices.
STEP 3: HAEMOGLOBIN BINDING
Oxygen is poorly soluble in water, having a solubility of 0.003 082 g/100 g H2O. Having diffused across the alveolar capillary membrane, the oxygen binds rapidly to the respiratory pigment haemoglobin. The relationship between saturation of haemoglobin with oxygen (SaO2) and PO2 is not linear and forms a sigmoidal shape (Figure 24.1). The P50 is the PaO2 at which 50% of the haemoglobin is saturated. Various factors are known to alter the affinity of haemoglobin for oxygen (Table 24.2). These have teleological advantages as, for example, a low pH or high CO2 at tissue level could imply tissue hypoxia, and the reduction in oxygen-binding affinity, may increase oxygen availability. Similarly, hyperthermia (fever), hypercarbia and an increase in the concentration of 2,3-diphosphoglycerate (2,3-DPG) all move the curve to the right and increase oxygen availability. 2,3-DPG is a byproduct of glycolysis and therefore binds haemoglobin in predominantly hypoxic tissues, facilitating a release of oxygen. Conversely hypocarbia, alkalosis and low concentrations of 2,3-DPG result in a leftward shift of the curve and a higher affinity for binding for any given PO2. Systemic interventions such as alteration in PCO2 or pH will influence the curve and therefore oxygen dissociation and availability.
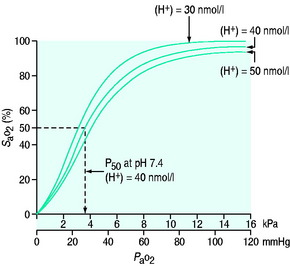
Figure 24.1 Haemoglobin oxygen dissociation curve. Normal curve at 40 nmol/l and shifts to left and right.
Table 24.2 Factors influencing the position of the oxygen dissociation curve
| Factors increasing P50 (curve shifts to the right) | Factors decreasing P50 (curve shifts to the left) |
|---|---|
| Hyperthermia | Hypothermia |
| Decreased pH (acidaemia) | Increased pH (alkalaemia) |
| Increased PCO2 (Bohr effect) | Decreased PCO2 |
| Increased 2,3-DPG | Decreased 2,3-DPG |
| Fetal haemoglobin | |
| Carbon monoxide | |
| Methaemoglobin |
2,3-DPG, 2,3-diphosphoglycerate.
STEP 4: CONVECTION – CARDIOVASCULAR

1 g of haemoglobin binds 1.34 ml of oxygen. Thus changes in the SaO2 and haemoglobin concentration are important in determining the oxygen concentration. Delivery of oxygen is therefore summarised by the formula:

The normal resting  is approximately 1000 ml/min. Oxygen consumption (
 ) at rest is approximately 250 ml/min.

where C is calculated as (1.34 × [Hb] × S
 ) + (0.003 × P
 )
)

 ), which is all the returning blood or central venous blood, can be used as an indicator of global
  and indirectly the adequacy of
  . If oxygen delivery by the microcirculation and cellular oxygen uptake are adequate, then a S
 value of 70% usually indicates that global
  is appropriate. Lower may indicate increased uptake but more often reduced or inadequate delivery. Mixed venous blood is useful for measurement of global
  , but it usually requires the presence of a pulmonary artery catheter. The use of central venous saturations has become an alternative surrogate which is usually adequate and considerably more practical.
 to match changes in
  is an adaptation that permits sudden changes in demand such as exercise in which
  can exceed 1500 ml/min in some cases.
STEP 5: DIFFUSION – BLOOD TO MITOCHONDRION
 and the rate of cellular uptake and utilisation
Once delivered to the cell, oxygen is utilised in the generation of ATP. This is achieved by the production of pyruvate from glucose via glycolysis. This produces only 2 ATP molecules per molecule of glucose. The pyruvate is converted to acetyl coenzyme A and in the mitochondrion enters the citric acid cycle (Krebs cycle), resulting in the production of reducing power to form NADH and FADH2. These molecules are transferred to the electron transport chain and oxidation to water releases the cellular energy currency ATP.3
STEP 6: THE REDOX STATE OF THE CELL
Conventionally oxygen delivery from atmosphere to cell is considered a cascade, implying that a high concentration at one end will cascade down and increase oxygen in the cell. It will increase oxygen available to the cell potentially but the driving force for oxygen to enter the cell and the mitochondrion is the gradient between the partial pressure of oxygen in the cell and outside. Increased oxygen utilisation will reduce that tension and increase the gradient. Conversely, adequate oxygen in the cell will reduce the gradient between the cell and outside and oxygen will not diffuse. The cell determines how much oxygen it uses by creating the gradient that sucks oxygen in – it is not a cascade. Similarly, it is the ATP/adenosine diphosphate (ADP) ratio and probably hydrogen ion concentration that drive ATP production and modify oxygen requirement, i.e. the cell is largely autonomous and uses what it needs.4 While ensuring adequate oxygen delivery is important, excess oxygen is at least theoretically of no benefit.
PATHOLOGY OF OXYGEN DELIVERY ( )
)
 to match
  (
( drives the
  requirement) results in reduction in aerobic metabolism and energy production and necessitates production of ATP by the less efficient glycolytic pathway.
The level of  at which
  begins to decline has been termed the ‘critical
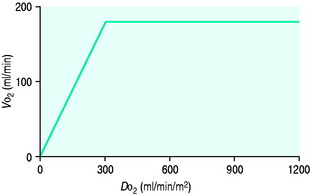
  ’ and is approximately 300 ml/min in an adult (Figure 24.2).5 ‘Shock’ is the usual term used in this situation, defined loosely as failure of delivery of oxygen to match the demand of tissue. Commonly this refers to failure of the circulation, but low
  can result from several pathological mechanisms which can occur as a single problem or in combination. Cellular hypoxia can result from each of the stages of oxygen delivery:
 and
and  . Above the value of ‘critical
  ,
,  is independent of oxygen delivery. Below this value,
  becomes supply-dependent and may be amenable to therapeutic interventions.
The above is summarised in Table 24.3 as the types of hypoxia.
| Type of hypoxia | Pathophysiology | Examples |
|---|---|---|
| Hypoxic hypoxia | Reduced supply of oxygen to the body leading to a low arterial oxygen tension |
The impact of a low  can be made worse by an increase in oxygen demand. Metabolic rate increases with exercise, inflammation, sepsis, pyrexia, thryotoxicosis, shivering. seizures, agitation, anxiety and pain.6 Therapeutic interventions such as adrenergic drugs, e.g. adrenaline (epinephrine)7 and certain feeding strategies can also lead to an increased
  .
.
In critical illness, where oxygen delivery is considered to be in jeopardy, there has been considerable interest in the relationship between  and
and  (see Figure 24.2). The presence of signs or markers of tissue hypoxia such as acidosis implies inadequate tissue oxygenation. This could either be from inadequate delivery failing to meet consumption requirements or due to a reduced ability of the tissues to extract oxygen. The former could be corrected by increasing delivery; the latter is more difficult. Historically this has led to the strategy for delivering ‘supranormal’
  to ensure adequate supply.8,9 There were some intrinsic problems in this approach. It is irrefutable that, if delivery is inadequate, it should be corrected to meet consumption, but much of the early work was based on the relationship between delivery and consumption trying to reach a point where delivery outstripped consumption. As both values are derived from the same root equation and same data, mathematical linkage was inevitable, so as one increased, so would the other.10,11 Also the inotropes used to increase delivery also increased consumption.
Clinical studies clearly show that adequate resuscitation to meet oxygen requirements is sensible. In the critically ill going beyond this is not helpful,12,13 although there may be a place for supraoptimal values in the high-risk surgical patient.8,9 In the acute situation the combined use of markers of tissue hypoxia, such as acidosis and lactate, in conjunction with surrogates of oxygen delivery, such as ScvO2, and standard haemodynamic measurements of an adequate circulation have proved beneficial.14,15 So-called early goal-directed therapy is now included in published guidelines for the treatment of severe sepsis (Table 24.4).16 The benefits of this new approach may well have as much to do with the prompt and aggressive improvements in haemodynamics and resuscitation as the values obtained. Timing is probably the significant difference when compared with other applications of the ‘supranormal’ technique. Targetedoxygen delivery is a major debate that is still evolving (Table 24.5). Oxygen delivery can be improved in a variety of ways, from the ambient inspired oxygen through the lungs and cardiovascular system to the cell itself, but once at the cell the ability to manipulate delivery ceases.
Table 24.4 Early goal-directed therapy. A summary of  parameters set to achieve in first 6 hours of the diagnosis of severe sepsis with associated hypotension and a plasma lactate concentration of ≥ 4 mmol/l
| Variable | Parameters |
|---|---|
| Arterial oxygen saturation (SaO2) | ≥ 93% |
| Central venous pressure (CVP) | 8–12 mmHg |
| Mean arterial pressure (MAP) | 65–90 mmHg |
| Urine output (UO) | ≥ 0.5 ml/kg per hour |
Mixed venous oxygen saturations (S ) or central venous oxygen saturations (ScvO2) ) or central venous oxygen saturations (ScvO2) |
≥ 70% |
| Haematocrit | ≥ 30% |
(After Rivers E et al. Early goal-directed therapy in the treatment of severe sepsis and septic shock. N Engl J Med 2001; 345: 1368–77.)
Table 24.5 Summary of targeted oxygen delivery
| Goal-directed therapy |
|---|
| Supraoptimal values in the critically ill – not recommended |
| Perioperative optimisation with supranormal values – possibly useful but controversial |
| Resuscitation against markers of peripheral oxygen use such as ScvO2 and lactate (early goal-directed therapy) – currently advocated |
CELLULAR HYPOXIA
In environments where the  is reduced, the human cell can tolerate hypoxia to a certain extent by adapting ‘hibernation’ strategies to reduce metabolic rate, increased oxygen extraction from surrounding tissues and enzyme adaptations that allow continuing metabolism at low PO2.17 Anaerobic metabolism is actively utilised by some tissues. At times of low oxygen concentrations, both myocardial and vascular endothelium upregulate glycolytic enzymes and glucose transport proteins.18 This is not sustainable.
REGIONAL HYPOXIA
Much of what has been discussed describes effects of oxygen delivery and uptake for the body as a whole. The reality is far more complex, as not only can each organ system have its  manipulated to meet demand, but also within each organ regional demands may vary and can be varied. Few of the clinical methods commonly used for assessing
  can identify changes in either organ or regional
  . Thus it is possible in critical illness for tissue hypoxia to exist with associated organ dysfunction, despite normal global
  and S
and S values.19
The effects of disordered or diverted regional blood flow can be important. For example, in shock splanchnic blood flow is often reduced with the potential for ischaemia. Clearly detection of gut ischaemia could be used to influence management of oxygen delivery and hopefully reduce the likelihood of multiorgan failure.20 The control of regional blood flow is itself complex. Methods of increasing global  in the hope that it will optimise all tissues often necessitate the use of vasoactive drugs (vasopressors, inotropes and vasodilators). Paradoxically, although such therapy can influence regional flow, it may not necessarily be in the direction sought in individual regions.
DIAGNOSIS AND MONITORING OF 
The last two decades have shown that the value of correcting markers of tissue hypoperfusion and hypoxia is far greater than that of targeting subjective predictive values for populations. It is important to recognise and treat these problems early so that organ  can be preserved.14 Clinical assessment of
  and
and  , e.g. heart rate, blood pressure or urine output, can be misleading. Particularly in the young patient, the ability of the OER to increase to as high as 70–80% can mean that such variables can change only late in the evolution of diminished
  . However, the assessment of an effective CO (ECO) – normal heart rate, blood pressure and peripheral perfusion with signs of organ function and normal oxygen saturation – must not be excluded in favour of more technical quantitative methods. Rather the technical values must be considered in the clinical context. All assessments of
  , clinical or technical, require continuous re-evaluation to ensure that the treatments being planned or administered are appropriate for the patient’s current condition.
SaO2 and PaO2
Both these measures are included in the CaO2 equation (see above), and their importance is clear. However it can be difficult to define what is a ‘safe’ SaO2 and/or PaO2. Measured systemically, they do not alone reflect tissue oxygenation and oxygen extraction mechanisms vary between organs. In general, however, supplementary oxygen is required when PaO2 falls below 60 mmHg or the SaO2 is below 90%. The clinical significance of common PaO2 and SaO2 values is listed in Table 24.1.
ACID–BASE BALANCE
Many intensive care units use acid–base balance as a simple bedside indicator of global  . The presence of acidosis and a base deficit of less than –2 may be used to detect evidence of inadequate
  . They can only reflect global perfusion. The use of the plasma lactate concentration is an unreliable indicator of tissue hypoxia. It represents the balance between production and consumption so if used in isolation or as a single value to assess
  it can easily mislead.21 The use of lactate as a marker of
  is best used as a trend using serial measurements.
S /ScvO2
In critical illness a falling  can be compensated for by an increase in oxygen extraction. This leads to a lower oxygen saturation of haemoglobin returning to the right side of the heart. Analysis of this saturation either in vivo (fibreoptic oximetry) or in vitro (oximetry) allows assessment of the OER. Classically, a low S
 (< 70%), in the face of a normal SaO2, implies tissue hypoperfusion secondary to a low CO, either hypovolaemia or pump failure. It could however indicate very high
  , which may occur with hyperthermia. Conversely a raised S
 (> 75%) will imply low demand, e.g. hypothermia, or a cellular utilisation problem, easily explained in cyanide poisoning when the oxidative phosphorylation mechanism is inhibited, but much more difficult to rationalise when it is seen (commonly) in sepsis. In a very-low-output state it could indicate total failure of peripheral perfusion and therefore no oxygen usage. ScvO2 is a reasonable surrogate for S
 and reduces the need for the more complex pulmonary artery catheter.15,22 Whichever method of venous oxygen saturation is used, it must be in conjunction with other markers of adequacy of oxygen delivery and clinical context, as outlined in Table 24.4.
MEASUREMENT OF REGIONAL 
As outlined above, most assessments of  are global and do not reflect regional differences between organs or even within differing tissues of the same organ. Current methods of non-invasively assessing individual organ or tissue oxygenation are limited. The measurements are difficult, require specialised techniques and are not widely available. Currently only gastric tonometry and near-infrared spectroscopy (NIRS) have clinical applications in the detection of organ hypoxia.20 In the future NMR spectroscopy or positron emission tomography may allow direct non-invasive measurement of
  and tissue oxygenation, but at present the environment for such testing is not easily accessed by the critically ill.
OXYGEN THERAPY APPARATUS AND DEVICES
PRINCIPLES
Most of the simpler oxygen delivery devices, e.g. plastic masks, nasal cannulae, deliver oxygen at relatively low oxygen flow rates relative to peak inspiratory flows (25–100 + l/min). The final FiO2 delivered is heavily influenced by the entrainment of environmental air which dilutes the set FiO2. From a physics perspective the actual concentration of oxygen delivered is determined by the interaction between the delivery system and the patient’s breathing pattern. The actual FiO2 that reaches the alveolus is therefore unpredictable. Factors that influence this can broadly be divided into patient factors and device factors, which are summarised in Table 24.6.23
Table 24.6 Factors that influence the FiO2 delivered to a patient by oxygen delivery devices
| Patient factors | Device factors |
|---|---|
| Inspiratory flow rate | Oxygen flow rate |
| Presence of a respiratory pause | Volume of mask |
| Tidal volume | Air vent size |
| Tightness of fit |
(After Leigh J. Variation in performance of oxygen therapy devices. Anaesthesia 1970; 25: 210–22.)
In the hypoxic patient it is common to find significant increases of inspiratory flow rates as well as an absence of the respiratory pause. This can result in the actual FiO2 at the alveolus being significantly less than that believed to be being delivered. This is due to a greater proportion of the inhaled gas being entrained air when the patient’s inspiratory flow rate increases. The normal peak inspiratory flow rate (PIFR) is between 25 and 35 l/min. In critical illness it can rise to eight times normal (Figure 24.3).24 The greater the inspiratory flow rate, the lower the alveolar FiO2. This is particularly true for the variable performance-type masks, but is also seen even in the more ‘reliable’ Venturi-type masks, particularly when the higher FiO2 inserts are used. The presence of a valve-controlled reservoir bag on a ‘non-rebreather’ semirigid plastic mask should compensate for high inspiratory flows, hence the belief that such masks can deliver 100% oxygen. This is not the case, and in models of human ventilation, such masks do not seem to confer significant extra oxygendelivery ability above that of the semirigid plastic masks without the reservoir bag (Figures 24.4 and 24.5).25
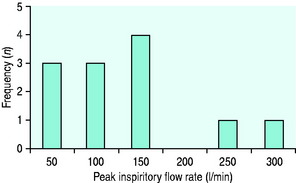
Figure 24.3 Spirometric peak inspiratory flow rates (PIFR) taken from a group of 12 critical care patients with respiratory distress and hypoxia. Most of the patients have a PIFR below 150 l/min. However 2 patients exceed 200 l/min. This will have a negative effect on the concentration of oxygen delivered from a variable-performance system, e.g. Hudson.24
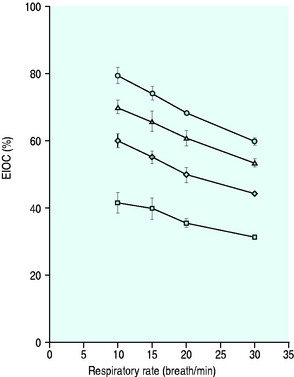
Figure 24.4 The performance of a Hudson mask on a model of human ventilation at a tidal volume of 500 ml and four oxygen flow rates (15 l/min ( ), 10 l/min (Δ), 6 l/min (
 ) and 2 l/min (⧫)). As the respiratory rate increases, so the effective inspired oxygen concentration (EIOC) deteriorates.25
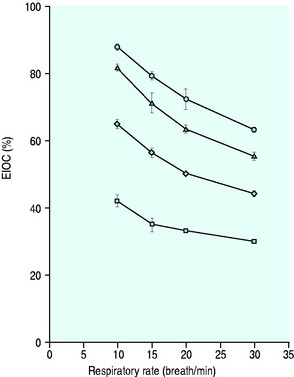
Figure 24.5 The performance of a Hudson non-rebreather mask on a model of human ventilation at a tidal volume of 500 mLs and four oxygen flow rates (15 l/min ( ), 10 l/min (Δ), 6 l/min (
 ) and 2 l/min (⧫)). As the respiratory rate increases, so the effective inspired oxygen concentration (EIOC) deteriorates. Note also how the curves of the graph are similar to the Hudson mask without the reservoir bag, implying no superiority with its addition.25
The failure of oxygen masks to deliver the desired FiO2 can be improved by either having a high enough oxygen flow rate and reservoir to compensate for the high inspiratory flow rate, e.g. high-flow nasal cannulae such as the Vapotherm, or sealing the upper airway (nose and mouth) from the environment, e.g. the continuous positive-airways pressure (CPAP) mask. Indeed, there are data to support the hypothesis that some of the improvement in oxygenation seen with CPAP ventilation may be due to the eradication of entrainment of environmental air, rather than the positive airway pressure exerted by the CPAP valve.24
OXYGEN DELIVERY DEVICES
With the exception of the intravascular devices, they all consist of similar component parts, as follows.
VARIABLE-PERFORMANCE SYSTEMS
T-PIECE SYSTEM
These simple systems, consisting of an inspiratory limb and expiratory limb forming the bar of the ‘T’, can be used with endotracheal tubes (oral, nasal or tracheostomy), or with a sealed CPAP-type mask. The oxygen flow rate needs to be high enough to match the patient’s PIFR so as to prevent rebreathing of expired gas and thus potential entrainment of air from the expiratory limb. The seal of the mask or tube cuff is also important to prevent entrainment of air.
FIXED-PERFORMANCE SYSTEMS
POSITIVE-PRESSURE DEVICES
For the purpose of this chapter, non-invasive positive-pressure ventilation (NIPPV) devices are described. NIPPV delivers oxygen with some element of positive pressure exerted during the respiratory cycle. It does not require instrumentation of the airway, and is delivered either by a tight-fitting mask to the face, nose or as a helmet. The simplest CPAP system is a T-piece with a positive-pressure valve attached to the expiratory limb, as with a Mapleson E system. Other methods are also available; some utilise a balloon reservoir rather than a high-flow oxygen generator (Mapleson A). CPAP helps improve functional residual capacity and compliance.26 There is no air entrainment and is probably why gas exchange initially improves rapidly. Theoretically the positive pressure inhibits alveolar closure which it may do but also to aid recruitment. A potential problem with the T-piece CPAP systems is that the oxygen flow rate has to be adjusted to the patient’s PIFR so as to prevent closure of the valve and increasing the inspiratory work of breathing. Other methods of NIPPV such as bilevel positive airway pressure (BPAP) deliver oxygen at flows that should match the patient’s demand.
HAZARDS OF OXYGEN THERAPY
OXYGEN TOXICITY
LUNG TOXICITY (LORRIANE SMITH EFFECT)
Exposure to a high FiO2 results in pulmonary injury. It is known that a progressive reduction in compliance occurs, and is associated with interstitial oedema, leading to fibrosis. The mechanism remains unclear, but is believed to involve direct cellular damage to the lung tissue by highly reactive oxygen free radicals. High concentrations of oxygen produce a higher concentration of free radicals that overwhelm the normal scavenging mechanism lining the respiratory tract. This, possibly associated with loss of surfactant, and increase in sympathetic activity and airway collapse due to the lack of other non respiratory gases, leads to lung damage. Evidence for this mechanism is supported by the worsening of lung damage seen in paraquat poisoning. Paraquat produces large amounts of free oxygen radicals, and the administration of supplemental oxygen worsens its effects. Detecting this problem as the sole aetiology for pulmonary pathology can be difficult, especially as the usual indications for oxygen therapy usually imply some form of pulmonary pathology.
It is reasonable that the risk of oxygen-induced pulmonary toxicity is dependent on concentration and duration of exposure. However, what concentration/duration is likely to cause toxicity is not clear. In some subjects long exposure times and high concentrations do not lead to problems; however, in general, patients should remain below an FiO2 of 0.5 where possible, and periods above this should be kept to the minimum required. ‘Safe’ periods of exposure above 0.5 vary from 16 to 30 hours. The clinical signs of oxygen toxicity are listed in Table 24.7. All are relatively non-descript and easily explained by other causes in a critically unwell patient.
| Central nervous system | Pulmonary |
|---|---|
| Nausea and vomiting | Dry cough |
| Anxiety | Substernal chest pain |
| Visual changes | Shortness of breath |
| Hallucinations | Pulmonary oedema |
| Tinnitus | Pulmonary fibrosis |
| Vertigo | |
| Hiccup | |
| Seizures |
RETINOPATHY OF PREMATURITY (ROP)
Previously referred to as retrolental fibroplasia, ROP was first described in 1942. It is a vasoproliferative disorder of the eye affecting premature neonates. Similar to the lungs, the completion of development of the retinal vasculature is late in gestation (32–34 weeks).27 In the 1950s an epidemic of ROP was described and a causal link to uncontrolled oxygen therapy was made.28 Improved monitoring of oxygen therapy reduced the incidence of ROP, but was associated with an increase in perinatal mortality secondary to respiratory failure.29 Subsequently, and despite good oxygen control, ROP continues to occur. This is now most likely due to the increased survival of increasingly premature low-birth-weight infants30 rather than high PaO2 alone. This suggests both oxygen and non-oxygen-related factors. ROP is a biphasic disease where the relatively hyperoxic environment following delivery initially leads to a slowing or even cessation of retinal vascular development of the premature infant. Additional oxygen may further contribute to this problem, by affecting the expression of vascular growth factors. The second phase of the disease is a hypoxic-induced neovascularisation, similar to that seen in diabetic retinopathy. This leads to fibrous scarring with risk of retinal detachment. How much oxygen is too much remains contentious and further research is required.31
HYPERBARIC OXYGEN THERAPY
Hyperbaric oxygen therapy can be delivered either in a monoplace chamber designed for one individual, or in multiplace chambers for 2–10 people. The chambers encompass the whole body, and gas is piped from source, heated and humidified. The common indications for use are listed in Table 24.8.32,33
Table 24.8 Recognised indications for hyperbaric oxygen therapy
| Primary therapy | Adjunctive therapy |
|---|---|
| Carbon monoxide poisoning | Radiation tissue damage |
| Air or gas embolism | Crush injuries |
| Decompression sickness (the ‘bends’) | Acute blood loss |
| Osteoradionecrosis | Compromised skin flaps or grafts |
| Clostridial myositis and myonecrosis | Refractory osteomyelitis |
| Intracranial abscess | |
| Enhancement of healing of problem wounds |
(After Tibbles PM, Edelsberg JS. Hyperbaric-oxygen therapy. N Engl J Med 1996; 334: 1642–8; and Bennett M. Randomised controlled trials. In: Fledmeier J (ed.) Hyperbaric Oxygen 2003 – Indications and Results. The UHMS Hyperbaric Oxygen Therapy Committee Report. Undersea and Hyperbaric Medicine Society: 2003; 1212–37.)
CARBON MONOXIDE POISONING
Carbon monoxide poisoning in particular attracts attention. A common consequence of house fires, it binds to haemoglobin with an affinity 210 times that of oxygen. Its half-life in air is 320 minutes, but this can be reduced to 90 minutes by giving the patient 100% oxygen, or 23 minutes with the addition of 3 atmospheres of hyperbaric therapy. Competitive dissociation of carbon monoxide from the haem-binding site and provision of dissolved oxygen to the tissues is believed to combine to reduce the sequelae of carbon monoxide poisoning, but the mechanisms are likely to be more complex.34 Some studies have suggested both acute and longer-term benefit,35,36 but others have been unable to conclude significant benefit.37,38 Recent investigations have attempted to distinguish those patients more likely to benefit from hyperbaric oxygen therapy. Factors such as increasing age (> 35 years), an exposure time of > 24 hours, an associated loss of consciousness and carboxyhaemoglobin levels greater than 25% appear to result in an increased incidence of neurological sequelae, and probably benefit from hyperbaric oxygen.39 Geographical distance to an appropriate centre often has a significant influence on hyperbaric usage in the acute setting, but mobile units and some evidence that late therapy may be of benefit should not necessarily preclude its usage.34,40
COMPLICATIONS
Hyperbaric therapy is associated with the following complications:
1 West JB. Respiratory Physiology, The Essentials, 6th edn., Philadelphia, PA: Lippincott, Williams & Wilkins; 2000:171.
2 Hameed S. Oxygen delivery. Crit Care Med. 2003;31:S658.
3 Arthur C, Guyton JH. Textbook of Medical Physiology, 10th edn. Philadelphia, PA: Saunders, 2000.
4 Kuper M, Soni N. The oxygen whirlpool. In: Vincent J-L, editor. Yearbook of Intensive Care and Emergency Medicine. New York: Springer; 2004:656-674.
5 Ronco JJ, et al. Identification of the critical oxygen delivery for anaerobic metabolism in critically ill septic and nonseptic humans. JAMA. 1993;270:1724-1730.
6 Walsh T. Recent advances in gas exchange measurements in intensive care patients. Br J Anaesth. 2003;91:120-131.
7 Fellows IW, Bennett T, MacDonald IA. The effects of adrenaline upon cardiovascular and metabolic functions in man. Clin Sci. 1985;69:215-222.
8 Shoemaker WC, et al. Prospective trial of supranormal values of survivors as therapeutic goals in high-risk surgical patients. Chest. 1988;94:1176-1186.
9 Boyd O. Optimisation of oxygenation and tissue perfusion in surgical patients. Intens Crit Care Nurs. 2003;19:171-181.
10 Walsh TS, Lee A. Mathematical coupling in medical research: lessons from studies of oxygen kinetics. Br J Anaesth. 1998;81:118-120.
11 Vermeij CG, Feenstra BW, Adrichem WJ, Bruining HA. Independent oxygen uptake and oxygen delivery in septic and postoperative patients. Chest. 1991;99:1438-1443.
12 Gattinoni L, Brazzi L, Pelosi P, et al. A trial of goal-oriented hemodynamic therapy in critically ill patients. S collaborative group. N Engl J Med. 1995;333:1025-1032.
13 Hayes MA, Timmins AC, Yau EH, et al. Elevation of systemic oxygen delivery in the treatment of critically ill patients. N Engl J Med. 1994;330:1717-1722.
14 Rivers E, Nguyen B, Havstad S, et al. Early goal-directed therapy in the treatment of severe sepsis and septic shock. N Engl J Med. 2001;345:1368-1377.
15 Rivers EP, Ander DS, Powell D. Central venous oxygen saturation monitoring in the critically ill patient. Curr Opin Crit Care. 2001;7:204-211.
16 Dellinger RP, et al. Surviving Sepsis campaign guidelines for management of severe sepsis and septic shock. Crit Care Med. 2004;32:858-873.
17 Hochachka PW, Buck LT, Doll CJ, Land SC. Unifying theory of hypoxia tolerance: molecular/metabolic defense and rescue mechanisms for surviving oxygen lack. Proc Natl Acad Sci USA. 1996;93:9493-9498.
18 Cartee GD, Douen AG, Ramlal T, Klip A, Holloszy JO. Stimulation of glucose transport in skeletal muscle by hypoxia. J Appl Physiol. 1991;70:1593-1600.
19 Curtis SE, Cain SM. Regional and systemic oxygen delivery/uptake relations and lactate flux in hyperdynamic, endotoxin-treated dogs. Am Rev Respir Dis. 1992;145:348-354.
20 Gutierrez G, Palizas F, Doglio G, et al. Gastric intramucosal pH as a therapeutic index of tissue oxygenation in critically ill patients. Lancet. 1992;339:195-199.
21 Leach RM, Treacher DF. The pulmonary physician in critical care 2: oxygen delivery and consumption in the critically ill. Thorax. 2002;57:170-177.
22 Wheeler AP, Bernard GR, Thompson BT, et al. Pulmonary-artery versus central venous catheter to guide treatment of acute lung injury. N Engl J Med. 2006;354:2213-2224.
23 Leigh J. Variation in performance of oxygen therapy devices. Anaesthesia. 1970;25:210-222.
24 Wagstaff TAJ, Soni N. Arterial oxygenation in respiratory failure: the importance of the CPAP valve. Br J Anaesth. 2006;97:435P.
25 Wagstaff TAJ, Soni N. Performance of six types of oxygen delivery devices at varying respiratory rates. Anaesthesia. 2007;62:492-503.
26 Lenique F, Habis M, Lofaso F, et al. Ventilatory and hemodynamic effects of continuous positive airway pressure in left heart failure. Am J Respir Crit Care Med. 1997;155:500-505.
27 Roth AM. Retinal vascular development in premature infants. Am J Ophthalmol. 1977;84:636-640.
28 Campbell K. Intensive oxygen therapy as a possible cause of retrolental fibroplasia; a clinical approach. Med J Aust. 1951;2:48-50.
29 Avery ME. Recent increase in mortality from hyaline membrane disease. J Pediatr. 1960;57:553-559.
30 Flynn JT. Acute proliferative retrolental fibroplasia: multivariate risk analysis. Trans Am Ophthalmol Soc. 1983;81:549-591.
31 Tin W, Gupta S. Optimum oxygen therapy in preterm babies. Arch Dis Child Fetal Neonatal Ed. 2007;92:F143-147.
32 Tibbles PM, Edelsberg JS. Hyperbaric-oxygen therapy. N Engl J Med. 1996;334:1642-1648.
33 Bennett M. Randomised controlled trials. In: Fledmeier J, editor. Hyperbaric Oxygen 2003 – Indications and Results. The UHMS Hyperbaric Oxygen Therapy Committee Report. Flagstaff, AZ: Best; 2003:1212-1237.
34 Stoller KP. Hyperbaric oxygen and carbon monoxide poisoning: a critical review. Neurol Res. 2007;29:146-155.
35 Weaver LK, Hopkins RO, Chan KJ, et al. Hyperbaric oxygen for acute carbon monoxide poisoning. N Engl J Med. 2002;347:1057-1067.
36 Hawkins M, Harrison J, Charters P. Severe carbon monoxide poisoning: outcome after hyperbaric oxygen therapy. Br J Anaesth. 2000;84:584-586.
37 Scheinkestel CD, et al. Hyperbaric or normobaric oxygen for acute carbon monoxide poisoning: a randomised controlled clinical trial. Med J Aust. 1999;170:203-210.
38 Juurlink DN, Buckley NA, Stanbrook MB, et al. Hyperbaric oxygen for carbon monoxide poisoning. Cochrane Database Syst Rev. 2005. CD002041
39 Weaver LK, Valentine KJ, Hopkins RO. Carbon monoxide poisoning: risk factors for cognitive sequelae and the role of hyperbaric oxygen. Am J Respir Crit Care Med. 2007;176:491-497.
40 Lueken RJ, Heffner AC, Parks PD. Treatment of severe carbon monoxide poisoning using a portable hyperbaric oxygen chamber. Ann Emerg Med. 2006;48:319-322.