Overview of Bacterial Identification Methods and Strategies
1. State the specific diagnostic purpose for each test methodology.
2. Briefly describe the test principle associated with each test methodology.
3. Outline limitations and explain ways to trouble-shoot or report results in the event the test result indicates a false positive or false negative or is equivocal.
4. State the appropriate quality control organisms and results used with each testing procedure.
Rationale for Approaching Organism Identification
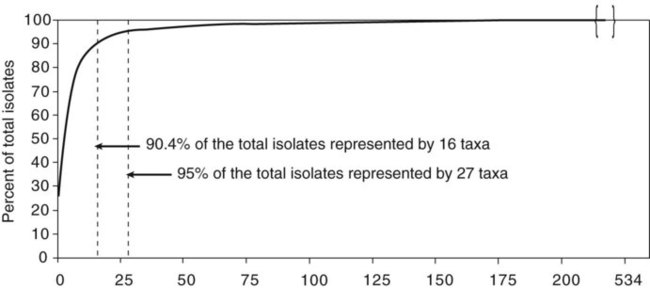
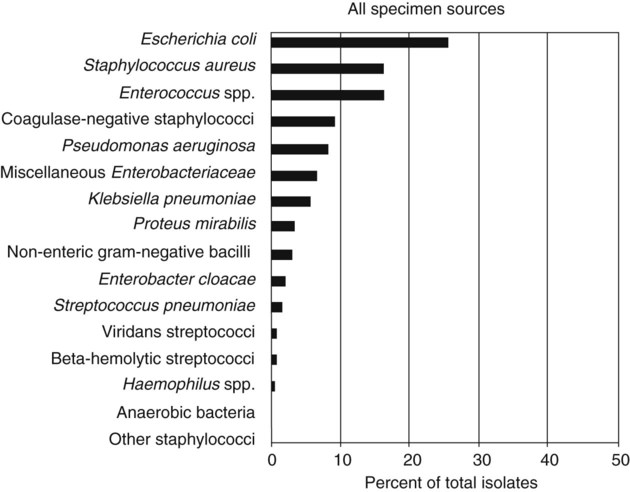
It is challenging to determine how most effectively to present and teach diagnostic microbiology in a way that is sufficiently comprehensive and yet not excessively cluttered with rare and seldom-needed facts about bacterial species uncommonly encountered. Approximately 530 different bacterial species or taxa are reported by clinical microbiology laboratories across the United States (Figure 13-1). Yet 95% of the bacterial identifications reported are distributed across only 27 of these taxa. This is an indication of how infrequently the other 500 or more taxa are identified and reported. Therefore, although the chapters in Part III, Bacteriology, are intended to be comprehensive in terms of the variety of bacterial species presented, it is helpful to keep in perspective which taxa are most likely to be encountered in the clinical environment. The relative frequencies with which the common bacterial species and organism groups are reported in clinical laboratories are presented in Figure 13-2.
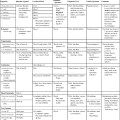
To meet the challenges of bacterial identification processes beyond what can be portrayed in flow charts, the chapters in Part III have been arranged to guide the student through the entire workup of a microorganism, beginning with initial culture of the specimen. In most instances, the first information a microbiologist uses in the identification process is the macroscopic description of the colony, or colony morphology. This includes the type of hemolysis (if any), pigment (if present), size, texture (opaque, translucent, or transparent), adherence to agar, pitting of agar, and many other characteristics (see Chapter 7). After careful observation of the colony, the Gram stain is used to separate the organism into a variety of broad categories based on Gram stain reaction and the cellular morphology of gram-positive or gram-negative bacteria (e.g., gram-positive cocci, gram-negative rods; see Chapter 6). For gram-positive organisms, the catalase test should follow the Gram stain, and testing on gram-negative organisms should begin with the oxidase test. These simple tests, plus growth on MacConkey agar, if the isolate is a gram-negative rod or coccobacillus, help the microbiologist assign the organism to one of the primary categories (organized here as subsections). Application of the various identification methods and systems outlined in this chapter generate the data and criteria discussed in each chapter for the definitive identification of clinically relevant bacteria. Most of the procedures described in the following chapters can be found at the end of this chapter. In this chapter, each procedure includes a photograph of positive and negative reactions. Chapter 6 includes photographs of some commonly used bacteriologic stains. In addition, Table 13-1 lists several commonly used commercial identification systems for a variety of the microorganisms discussed in the following pages.
TABLE 13-1
Examples of Commercial Identification Systems for Various Organisms
| Organism Group | System Type | Manufacturer | Incubation Time |
| Enterobacteriaceae | Manual: | ||
| API 20E | bioMérieux* | 24-48 hr | |
| API Rapid 20E | bioMérieux | 4 hr | |
| Crystal Enteric/Nonfermenter | Becton Dickinson Diagnostic Systems† | 18 hr | |
| RapID ONE | Remel‡ | 4 hr | |
| Automated: | |||
| GNI | bioMérieux | 4-13 hr | |
| GNI+ | bioMérieux | 2-12 hr | |
| NEG ID Type 2 | Dade MicroScan§ | 15-42 hr | |
| Rapid NEG ID Type 3 | Dade MicroScan | 2.5 hr | |
| Sensititre AP80 | Trek Diagnostic Systems¶ | 5-18 hr | |
| Enterococcus spp. and Streptococcus spp. | Manual: | ||
| API 20 Strep | bioMérieux | 4-24 hr | |
| RapID STR | Remel | 4 hr | |
| Crystal Gram-Positive ID | Becton Dickinson Diagnostic Systems | 18 hr | |
| Automated: | |||
| GPI | bioMérieux | 2-15 hr | |
| Pos ID2 | Dade MicroScan | 18-48 hr | |
| Sensititre AP90 | Trek Diagnostic Systems | 24 hr | |
| Haemophilus spp. | Manual: | ||
| API NH | bioMérieux | 2 hr | |
| RapID NH | Remel | 4 hr | |
| NHI | bioMérieux | 4 hr | |
| Crystal Neisseria/Haemophilus | Becton Dickinson Diagnostic Systems | 4 hr | |
| Automated: | |||
| HNID | Dade MicroScan | 4 hr | |
| Neisseria spp. and Moraxella catarrhalis | Manual: | ||
| API NH | bioMérieux | 2 hr | |
| RapID NH | Remel | 4 hr | |
| NHI | bioMérieux | 4 hr | |
| Crystal Neisseria/Haemophilus | Becton Dickinson Diagnostic Systems | 4 hr | |
| Automated: | |||
| HNID | Dade MicroScan | 4 hr | |
| Nonenteric gram-negative rods | Manual: | ||
| API 20NE | bioMérieux | 24-48 hr | |
| Crystal Enteric/Nonfermenter | Becton Dickinson Diagnostic Systems | 18-20 hr | |
| RapID NF Plus | Remel | 4 hr | |
| Automated: | |||
| GNI | bioMérieux | 2-18 hr | |
| NEG ID Type 2 | Dade MicroScan | 15-42 hr | |
| Sensititre AP80 | Trek Diagnostic Systems | 5-18 hr | |
| Staphylococcus spp. | Manual: | ||
| API STAPH | bioMérieux | 24 hr | |
| Crystal Gram-Positive | Becton Dickinson Diagnostic Systems | 18-24 hr | |
| Automated: | |||
| GPI | bioMérieux | 2-15 hr | |
| Pos ID2 | Date MicroScan | 24-48 hr | |
| Coryneform rods | Manual: | ||
| API Coryne | bioMérieux | 24 hr | |
| RapID CB Plus | Remel | 4 hr | |
| Crystal Gram-Positive | Becton Dickinson Diagnostic Systems | 18-24 hr | |
| Automated: | |||
| GPI | bioMérieux | 2-15 hr | |
*Durham, N.C.: www.bioMerieux-Vitek.com
†Sparks, Md.: www.bectondickinson.com
‡Lenexa, Kan.: www.remelinc.com
Future Trends of Organism Identification
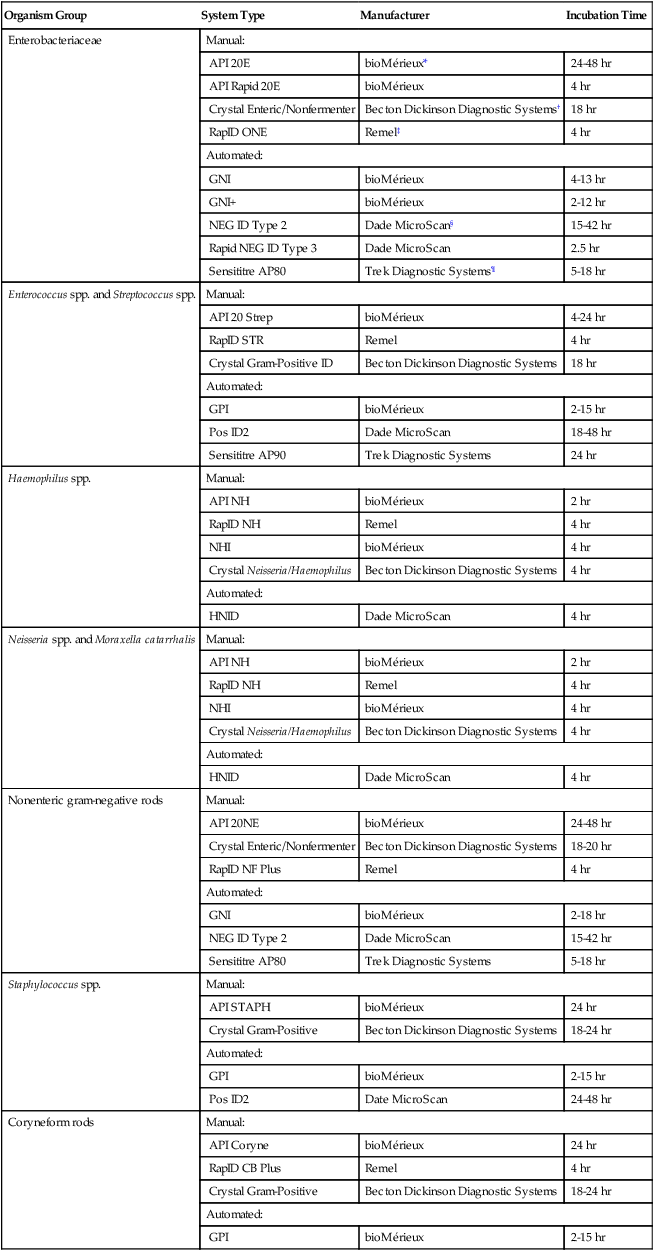
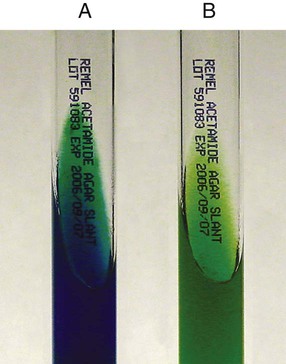
Procedure 13-1 Acetamide Utilization
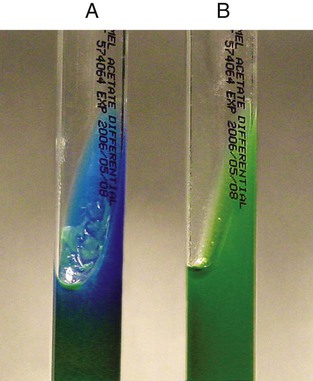
Procedure 13-3 Bacitracin Susceptibility
1. Using an inoculating loop, streak two or three suspect colonies of a pure culture onto a blood agar plate.
2. Using heated forceps, place a bacitracin disk in the first quadrant (area of heaviest growth). Gently tap the disk to ensure adequate contact with the agar surface.
3. Incubate the plate for 18 to 24 hours at 35°-37°C in ambient air for staphylococci and in 5% to 10% carbon dioxide (CO2) for streptococci differentiation.
Procedure 13-5 Bile Solubility Test
1. After 12 to 24 hours of incubation on 5% sheep blood agar, place 1 to 2 drops of 10% sodium desoxycholate on a well-isolated colony.
Note: A tube test is performed with 2% sodium desoxycholate.
2. Gently wash liquid over the colony without dislodging the colony from the agar.
3. Incubate the plate at 35°-37°C in ambient air for 30 minutes.
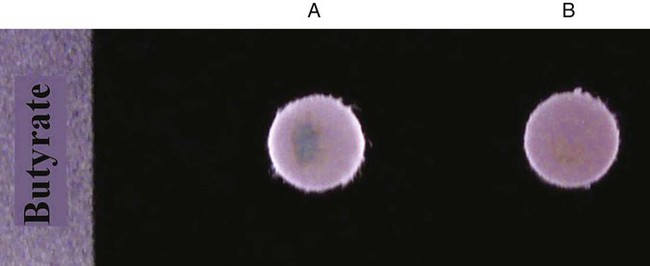
Procedure 13-6 Butyrate Disk
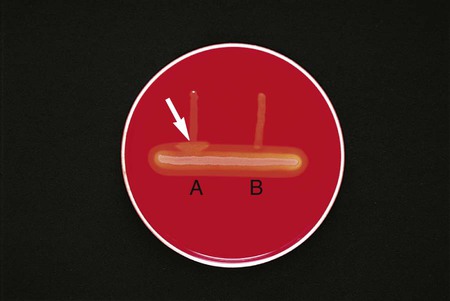
Procedure 13-7 CAMP Test
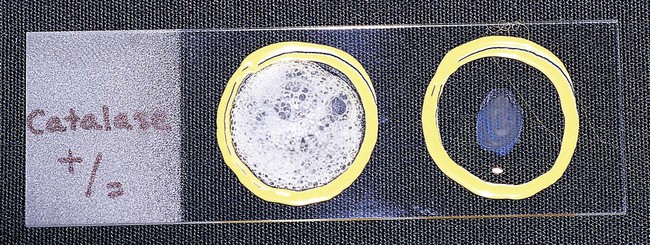
Procedure 13-8 Catalase Test
1. Use a loop or sterile wooden stick to transfer a small amount of colony growth to the surface of a clean, dry glass slide.
2. Place a drop of 30% hydrogen peroxide (H2O2) onto the medium.
3. Observe for the evolution of oxygen bubbles (Figure 13-10).
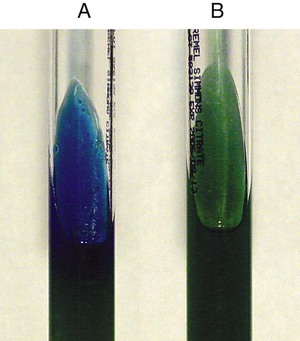
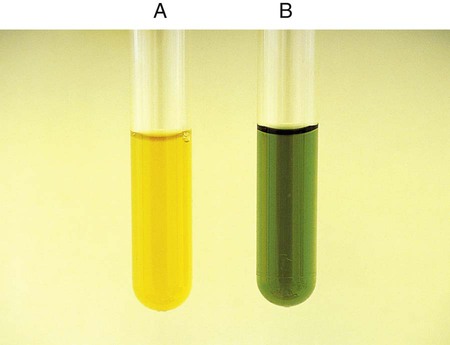
Procedure 13-10 Citrate Utilization
1. Inoculate Simmons citrate agar lightly on the slant by touching the tip of a needle to a colony that is 18 to 24 hours old. Do not inoculate from a broth culture, because the inoculum will be too heavy.
2. Incubate at 35°-37°C for up to 7 days.
3. Observe for growth and the development of blue color, denoting alkalinization.
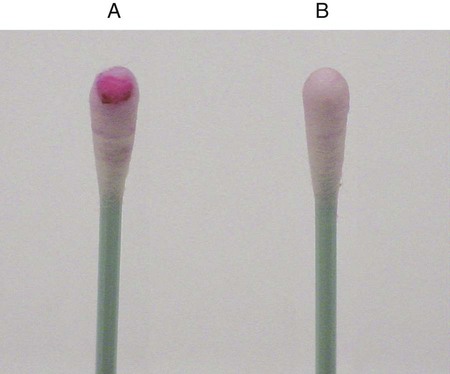
Procedure 13-11 Coagulase Test
1. Place a drop of coagulase plasma (preferably rabbit plasma with ethylenediaminetetraacetic acid [EDTA]) on a clean, dry, glass slide.
2. Place a drop of distilled water or saline next to the drop of plasma as a control.
3. With a loop, straight wire, or wooden stick, emulsify a portion of the isolated colony being tested in each drop, inoculating the water or saline first. Try to create a smooth suspension.
Positive: Clot of any size (Figure 13-13, A, left side).
Negative: No clot (Figure 13-13, B, right side).
Procedure 13-12 Decarboxylase Tests (Moeller’s Method)
A Glucose-Nonfermenting Organisms
1. Prepare a suspension (≥McFarland No. 5 turbidity standard) in brain-heart infusion broth from an overnight culture (18 to 24 hours old) growing on 5% sheep blood agar.
2. Inoculate each of the three decarboxylase broths (arginine, lysine, and ornithine) and the control broth (no amino acid) with 4 drops of broth.
3. Add a 4-mm layer of sterile mineral oil to each tube.
4. Incubate the cultures at 35°-37°C in ambient air. Examine the tubes at 24, 48, 72, and 96 hours.
The fermentation of dextrose in the medium causes the acid color change. However, it would not mask the alkaline color change brought about by a positive decarboxylation reaction (Figure 13-14, B). An uninoculated tube is shown in Figure 13-14, C.
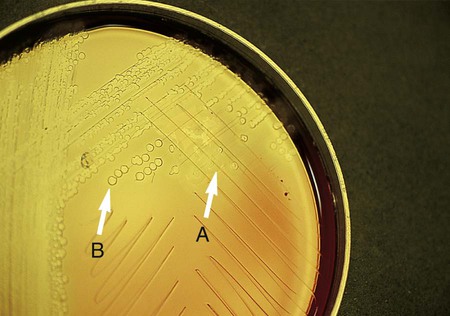
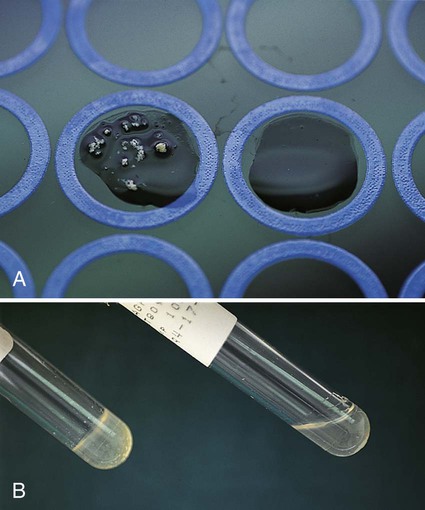
Procedure 13-13 DNA Hydrolysis (DNase Test Agar)
Positive: When DNA is hydrolyzed, methyl green is released and combines with highly polymerized DNA at a pH of 7.5, turning the medium colorless around the test organism (Figure 13-15, A and B).
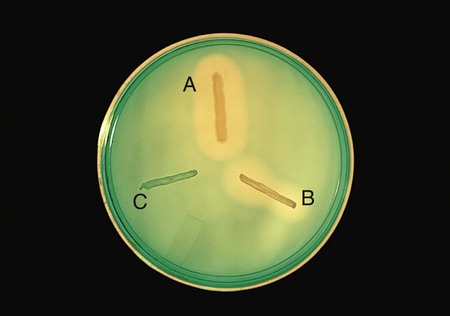
Negative: If no degradation of DNA occurs, the medium remains green (Figure 13-15, C).
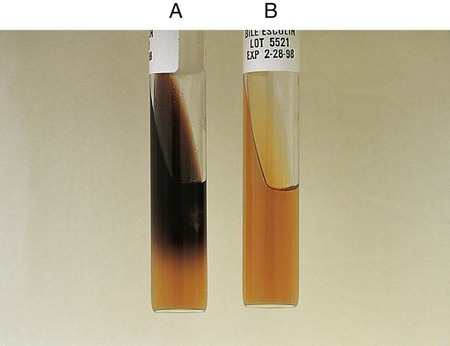
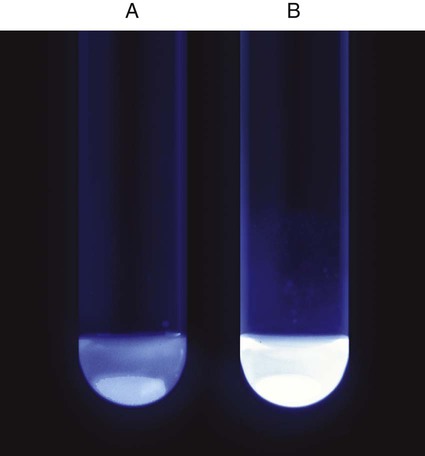
Procedure 13-14 Esculin Hydrolysis
Positive: Blackened medium (Figure 13-16, A), which would also show a loss of fluorescence under the Wood’s lamp.
Negative: No blackening and no loss of fluorescence under the Wood’s lamp, or slight blackening with no loss of fluorescence under the Wood’s lamp. An uninoculated tube is shown in Figure 13-16, B.
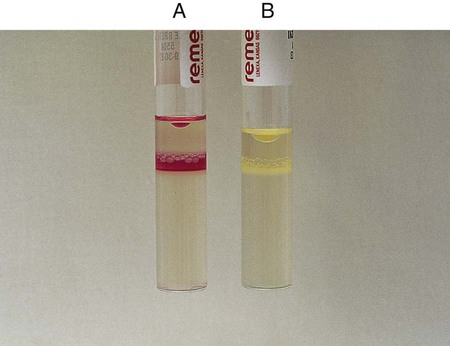
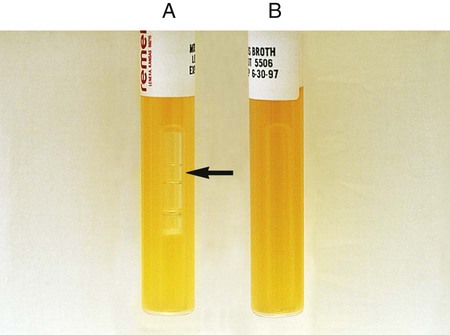
Procedure 13-15 Fermentation Media
A Peptone Medium with Andrade’s Indicator (for Enterics and Coryneforms)
1. Inoculate each tube with 1 drop of an 18- to 24-hour brain-heart infusion broth culture.
2. Incubate at 35°-37°C for up to 7 days in ambient air.
Note: Tubes are held only 4 days for organisms belonging to the Enterobacteriaceae family.
3. Examine the tubes for acid (indicated by a pink color) and gas production.
4. Tubes must show growth for the test to be valid. If no growth in the fermentation tubes or control is seen after 24 hours of incubation, add 1 to 2 drops of sterile rabbit serum per 5 mL of fermentation broth to each tube.
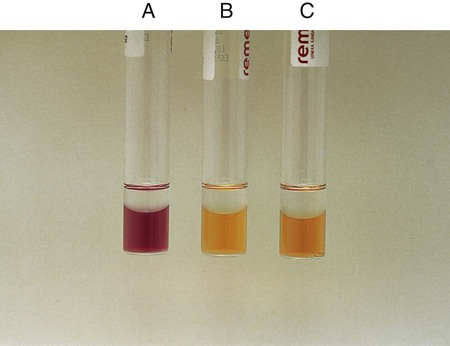
Positive: Indicator change to pink with or without gas formation in Durham tube (Figure 13-17, A, left and middle).
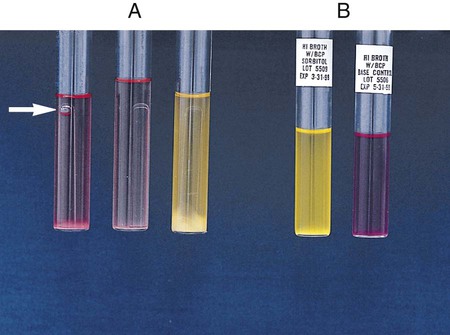
Negative: Growth, but no change in color. Medium remains clear to straw colored (Figure 13-17, A, right).
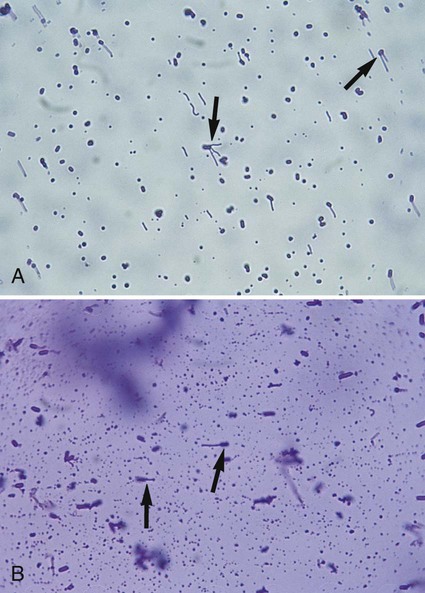
Procedure 13-16 Flagella Stain (Wet Mount Technique)
1. Grow the organism to be stained at room temperature on blood agar for 16 to 24 hours.
2. Add a small drop of water to a microscope slide.
3. Dip a sterile inoculating loop into sterile water.
4. Touch the loopful of water to the colony margin briefly (this allows motile cells to swim into the droplet of water).
5. Touch the loopful of motile cells to the drop of water on the slide. Note: Agitating the loop in the droplet of water on the slide causes the flagella to shear off the cell.
6. Cover the faintly turbid drop of water on the slide with a cover slip. A proper wet mount has barely enough liquid to fill the space under a cover slip. Small air spaces around the edge are preferable.
7. Examine the slide immediately under 40× to 50× for motile cells. If motile cells are not seen, do not proceed with the stain.
8. If motile cells are seen, leave the slide at room temperature for 5 to 10 minutes. This allows the bacterial cells time to adhere either to the glass slide or to the cover slip.
9. Gently apply 2 drops of RYU flagella stain (Remel, Lenexa, Kansas) to the edge of the cover slip. The stain will flow by capillary action and mix with the cell suspension. Small air pockets around the edge of the wet mount are useful in aiding the capillary action.
10. After 5 to 10 minutes at room temperature, examine the cells for flagella.
11. Cells with flagella may be observed at 100× (oil) in the zone of optimum stain concentration, about halfway from the edge of the cover slip to the center of the mount.
12. Focusing the microscope on the cells attached to the cover slip rather than on the cells attached to the slide facilitates visualization of the flagella. The precipitate from the stain is primarily on the slide rather than the cover slip.


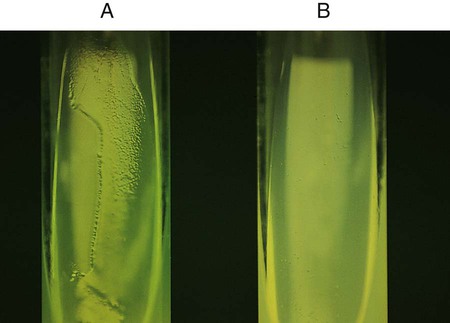
Procedure 13-17 Gelatin Hydrolysis
1. Inoculate the gelatin deep with 4 to 5 drops of a 24-hour broth culture.
2. Incubate at 35°-37°C in ambient air for up to 14 days. Note: Incubate the medium at 25°C if the organism grows better at 25°C than at 35°C.
3. Alternatively, inoculate the gelatin deep from a 24-hour-old colony by stabbing four or five times, 0.5 inch into the medium.
4. Remove the gelatin tube daily from the incubator and place at 4°C to check for liquefaction. Do not invert or tip the tube, because sometimes the only discernible liquefaction occurs at the top of the deep where inoculation occurred.
5. Refrigerate an uninoculated control along with the inoculated tube. Liquefaction is determined only after the control has hardened (gelled).
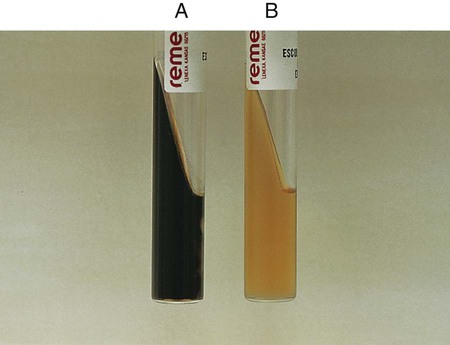
Positive: Partial or total liquefaction of the inoculated tube (the control tube must be completely solidified) at 4°C within 14 days (Figure 13-19, A).
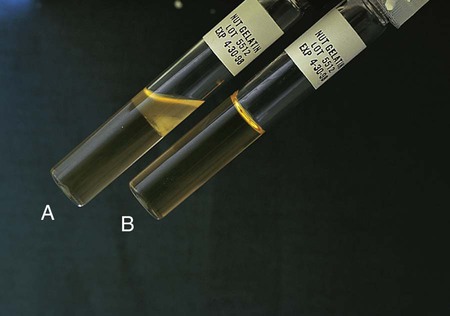
Negative: Complete solidification of the tube at 4°C (Figure 13-19, B).
Procedure 13-18 Growth at 42°C
1. Inoculate two tubes of trypticase soy agar (TSA) with a light inoculum by lightly touching a needle to the top of a single 13- to 24-hour-old colony and streaking the slant.
2. Immediately incubate one tube at 35°C and one at 42°C.
3. Record the presence of growth on each slant after 18 to 24 hours.
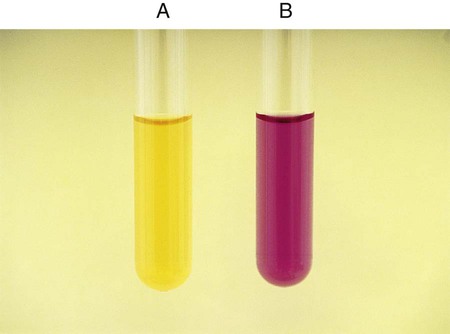
Procedure 13-19 Hippurate Hydrolysis
1. Add 0.1 mL of sterile water to a 12 ×75 mm plastic test tube.
2. Make a heavy suspension of the organism to be tested.
3. Using heated forceps, place a rapid hippurate disk in the mixture.
4. Cap and incubate the tube for 2 hours at 35°C; use of a water bath is preferred.
5. Add 0.2 mL ninhydrin reagent and reincubate for an additional 15 to 30 minutes. Observe the solution for the development of a deep purple color.
Procedure 13-20 Indole Production
The test is used to determine an organism’s ability to hydrolyze tryptophan to form the compound indole. Tryptophan is present in casein and animal protein. Bacteria with tryptophanase are capable of hydrolyzing tryptophan to pyruvate, ammonia, and indole. Kovac’s reagent (dimethylamine-benzaldehyde and hydrochloride), when added to the broth culture, reacts with the indole, producing a red color. An alternative method uses Ehrlich’s reagent. Ehrlich’s reagent has the same chemicals as the Kovac preparation, but it also contains absolute ethyl alcohol, making it flammable. Ehrlich’s reagent is more sensitive for detecting small amounts of indole. (The spot indole test is described in Procedure 13-39.)
Media: Casein peptone (10 g), NaCl (5 g), tryptophan (10 g), per 1000 mL.
1. Inoculate tryptophane broth with 1 drop of a 24-hour broth culture.
2. Incubate at 35°-37°C in ambient air for 48 hours.
3. Add 1 mL of xylene to the culture.
4. Shake the mixture vigorously to extract the indole and allow it to stand until the xylene forms a layer on top of the aqueous phase.
5. Add 0.5 mL of Ehrlich’s reagent down the side of the tube.
Procedure 13-21 Leucine Aminopeptidase (LAP) Test
1. Before incubation, slightly dampen the LAP disk with reagent-grade water. Do not supersaturate the disk.
2. Using a wooden applicator stick, rub a small amount of several colonies of an 18- to 24-hour pure culture onto a small area of the LAP disk.
3. Incubate at room temperature for 5 minutes.
4. After this incubation period, add 1 drop of cinnamaldehyde reagent.
Procedure 13-22 Litmus Milk Medium
1. Inoculate with 4 drops of a 24-hour broth culture.
2. Incubate at 35°-37°C in ambient air.
3. Observe daily for 7 days for alkaline reaction (litmus turns blue), acid reaction (litmus turns pink), indicator reduction, acid clot, rennet clot, and peptonization. Multiple changes can occur over the observation period.
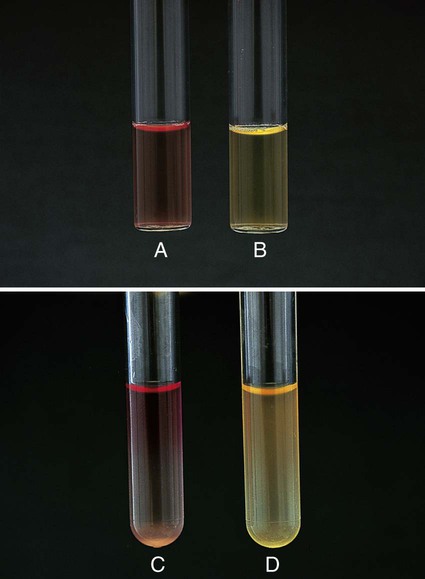
Appearance of Indicator (Litmus Dye)
| Color | pH Change to … | Record |
| Pink, mauve (Figure 13-24, A) | Acid | Acid (A) |
| Blue (Figure 13-24, B) | Alkaline | Alkaline (K) |
| Purple (identical to uninoculated control) (Figure 13-24, C) | No change | No change |
| White (Figure 13-24, D) | Independent of pH change; result of reduction of indicator | Decolorized |
| Consistency of Milk | Occurs When pH Is … | Record |
| Coagulation or clot (Figure 13-24, E) | Acid or alkaline | Clot |
| Dissolution of clot with clear, grayish, watery fluid and a shrunken, insoluble pink clot (Figure 13-24, F) | Acid | Digestion |
| Dissolution of clot with grayish, watery fluid and a clear, shrunken, insoluble blue clot | Alkaline | Peptonization |
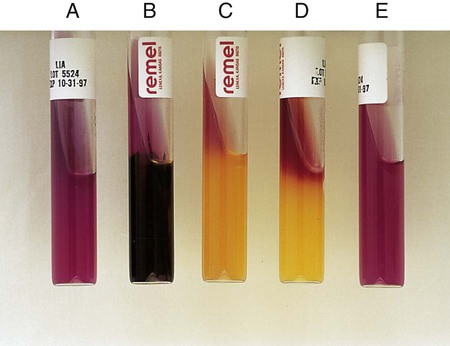
Procedure 13-23 Lysine Iron Agar (LIA)
1. With a straight inoculating needle, inoculate LIA (Figure 13-25, E) by twice stabbing through the center of the medium to the bottom of the tube and then streaking the slant.
2. Cap the tube tightly and incubate at 35°-37°C in ambient air for 18 to 24 hours.
Alkaline slant/alkaline butt (K/K)—lysine decarboxylation and no fermentation of glucose (Figure 13-25, A)
Alkaline slant/acid butt (K/A)—glucose fermentation (Figure 13-25, C)
Note: Patterns shown in Figure 13-25, A and C, can be accompanied by a black precipitate of ferrous sulfide (FeS), which indicates production of H2S (Figure 13-25, B).
Red slant/acid butt (R/A)—lysine deamination and glucose fermentation (Figure 13-25, D)
Procedure 13-24 Methyl Red/Voges-Proskauer (Mrvp) Tests
1. Inoculate MRVP broth with 1 drop from a 24-hour brain-heart infusion broth culture.
2. Incubate at 35°-37°C for a minimum of 48 hours in ambient air. Tests should not be made with cultures incubated less than 48 hours, because the end products build up to detectable levels over time. If results are equivocal at 48 hours, repeat the tests with cultures incubated at 35°-37°C for 4 to 5 days in ambient air; in such instances, duplicate tests should be incubated at 25°C.
C VP (Voges-Proskauer) Test (Coblentz Method) for Streptococci
1. Use 24-hour growth from blood agar plate to heavily inoculate 2 mL of MRVP broth.
2. After 6 hours of incubation at 35°C in ambient air, add 1.2 mL (12 drops) of solution A (alpha-naphthol) and 0.4 mL (4 drops) solution B (40% KOH with creatine).
3. Shake the tube and incubate at room temperature for 30 minutes.
The MR test should not be read before 48 hours, because some organisms will not have produced enough products from the fermentation of glucose.
MR-negative organisms may also not have had sufficient time to convert those products and will appear MR positive.
MR-VP testing should be used in conjunction with other confirmatory tests to differentiate organisms among the Enterobacteriaceae.
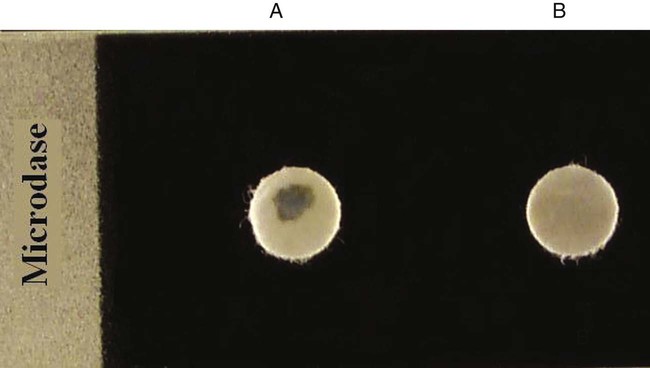
Procedure 13-25 Microdase Test (Modified Oxidase)
 to
to  inch in the middle of the tube.
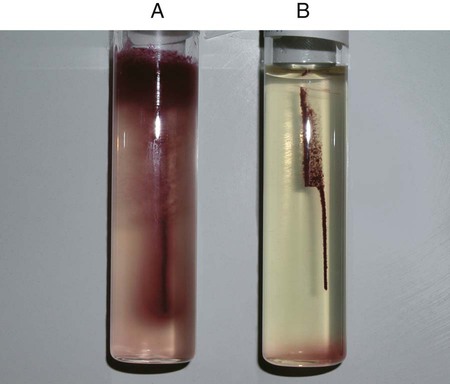
Procedure 13-27 MRS Broth
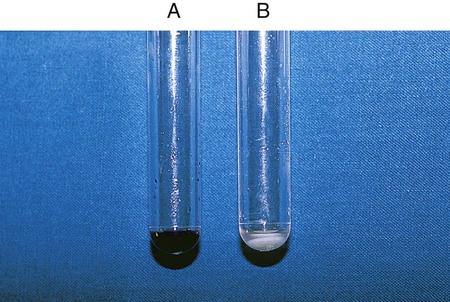
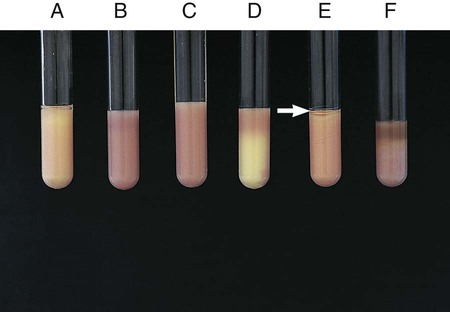
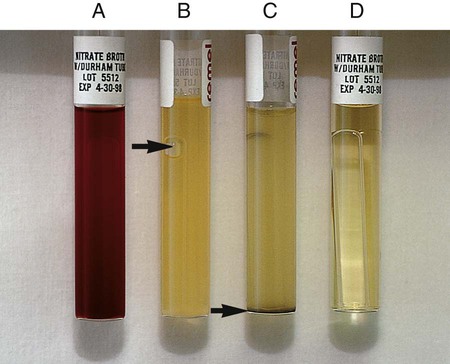
Procedure 13-29 Nitrate Reduction
1. Inoculate nitrate broth (Figure 13-31, D) with 1 to 2 drops from a young broth culture of the test organism.
2. Incubate for 48 hours at 35°-37°C in ambient air (some organisms may require longer incubation for adequate growth). Test these cultures 24 hours after obvious growth is detected or after a maximum of 7 days.
3. After a suitable incubation period, test the nitrate broth culture for the presence of gas, reduction of nitrate, and reduction of nitrite according to the following steps:
a. Observe the inverted Durham tube for the presence of gas, indicated by bubbles inside the tube.
b. Add 5 drops each of nitrate reagent solution A (sulfanilic acid) and B (alpha-naphthylamine). Observe for at least 3 minutes for a red color to develop.
c. If no color develops, test further with zinc powder. Dip a wooden applicator stick into zinc powder and transfer only the amount that adheres to the stick to the nitrate broth culture to which solutions A and B have been added. Observe for at least 3 minutes for a red color to develop. Breaking the stick into the tube after the addition of the zinc provides a useful marker for the stage of testing.
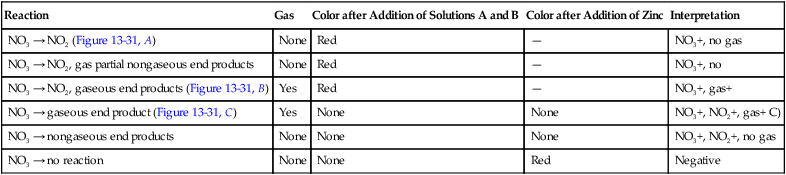
| Reaction | Gas | Color after Addition of Solutions A and B | Color after Addition of Zinc | Interpretation |
| NO3 → NO2 (Figure 13-31, A) | None | Red | — | NO3+, no gas |
| NO3 → NO2, gas partial nongaseous end products | None | Red | — | NO3+, no |
| NO3 → NO2, gaseous end products (Figure 13-31, B) | Yes | Red | — | NO3+, gas+ |
| NO3 → gaseous end product (Figure 13-31, C) | Yes | None | None | NO3+, NO2+, gas+ C) |
| NO3 → nongaseous end products | None | None | None | NO3+, NO2+, no gas |
| NO3 → no reaction | None | None | Red | Negative |
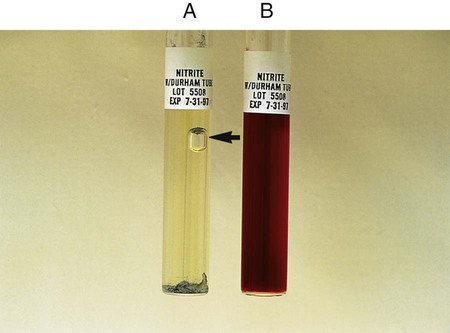
Procedure 13-30 Nitrite Reduction
Microorganisms capable of reducing nitrite to nitrogen do not turn color and do produce gas in the nitrate reduction test (see Procedure 13-29). The test does not require the addition of zinc dust.
1. Inoculate nitrite broth with 1 drop from a 24-hour broth culture.
2. Incubate for 48 hours at 35°-37°C.
3. Examine 48-hour nitrite broth cultures for nitrogen gas in the inverted Durham tube and add 5 drops each of the nitrate reagents A and B to determine whether nitrite is still present in the medium (reagents A and B are described under the nitrate reduction test in Procedure 13-29).
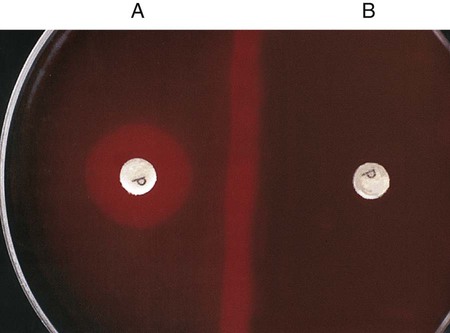
Procedure 13-32 Optochin (P disk) Susceptibility Test
1. Using an inoculating loop, streak two or three suspect colonies of a pure culture onto half of a 5% sheep blood agar plate.
2. Using heated forceps, place an Optochin disk in the upper third of the streaked area. Gently tap the disk to ensure adequate contact with the agar surface.
3. Incubate the plate for 18 to 24 hours at 35°C in 5% CO2. Note: Cultures do not grow as well in ambient air, and larger zones of inhibition occur.
4. Measure the zone of inhibition in millimeters, including the diameter of the disk.
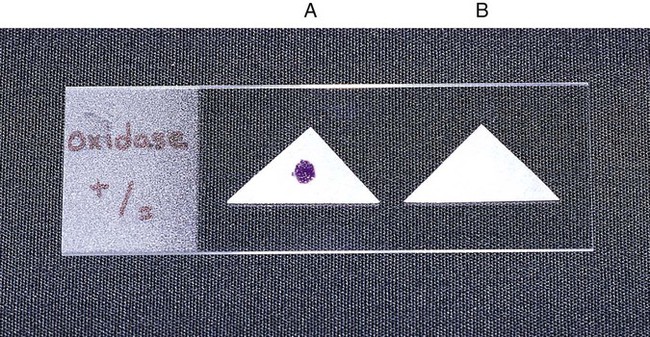
Procedure 13-33 Oxidase Test (Kovac’s Method)
1. Moisten filter paper with the substrate (1% tetramethyl-p-phenylenediamine dihydrochloride) or select a commercially available paper disk that has been impregnated with the substrate.
2. Use a platinum wire or wooden stick to remove a small portion of a bacterial colony (preferably not more than 24 hours old) from the agar surface and rub the sample on the filter paper or commercial disk.
3. Observe the inoculated area of paper or disk for a color change to deep blue or purple (Figure 13-35) within 10 seconds (timing is critical).
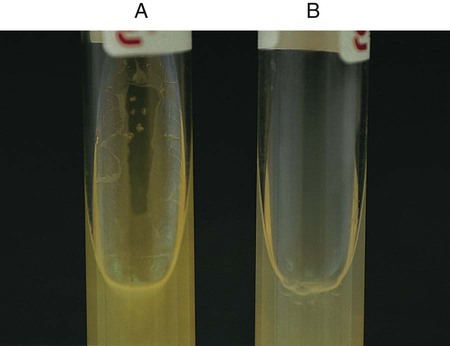
Procedure 13-34 Oxidation/Fermentation (of) Medium (CDC Method)
This test is used to determine whether an organism uses carbohydrate substrates to produce acid byproducts. Nonfermentative bacteria are routinely tested for their ability to produce acid from six carbohydrates (glucose, xylose, mannitol, lactose, sucrose, and maltose). In addition to the six tubes containing carbohydrates, a control tube containing the OF base without carbohydrate is also inoculated. Triple sugar iron agar (TSI) (see Procedure 13-40) is also used to determine whether an organism can ferment glucose. OF glucose is used to determine whether an organism ferments (Figure 13-36, A) or oxidizes (Figure 13-36, B) glucose. If no reaction occurs in either the TSI or OF glucose, the organism is considered a non-glucose utilizer (Figure 13-36, C). Hugh and Leifson’s formula uses a low peptone-to-carbohydrate ratio and a limiting amount of carbohydrate. The reduced peptone limits the formation of alkaline amines that may mask acid production resulting from oxidative metabolism. Two tubes are required for interpretation of the OF test. Both are inoculated, and one tube is overlaid with mineral oil, producing an anaerobic environment. Production of acid in the overlaid tube results in a color change and is an indication of fermentation. Acid production in the open tube and color change is the result of oxidation. Media: Pancreatic digest of casein (2 g), glycerol (10.0 mL), phenol red (King method) (0.03 g), agar (3 g), per 1000 mL, pH 7.3.
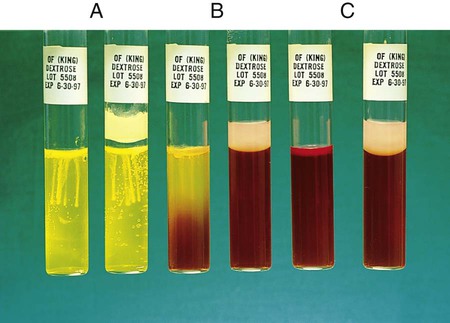
1. To determine whether acid is produced from carbohydrates, inoculate agar deeps, each containing a single carbohydrate, with bacterial growth from an 18- to 24-hour culture by stabbing a needle 4 to 5 times into the medium to a depth of 1 cm. Note: Two tubes of OF dextrose are usually inoculated; one is overlaid with either sterile melted petrolatum or sterile paraffin oil to detect fermentation.
2. Incubate the tubes at 35°-37°C in ambient air for up to 7 days. Note: If screwcap tubes are used, loosen the caps during incubation to allow for air exchange. Otherwise, the control tube and tubes containing carbohydrates that are not oxidized might not become alkaline.
Positive: Acid production (A) is indicated by the color indicator changing to yellow in the carbohydrate-containing deep.
Weak-positive (Aw): Weak acid formation can be detected by comparing the tube containing the medium with carbohydrate with the inoculated tube containing medium with no carbohydrate. Most bacteria that can grow in the OF base produce an alkaline reaction in the control tube. If the color of the medium in a tube containing carbohydrate remains about the same as it was before the medium was inoculated and if the inoculated medium in the control tube becomes a deeper red (i.e., becomes alkaline), the culture being tested is considered weakly positive, assuming the amount of growth is about the same in both tubes.
Negative: Red or alkaline (K) color in the deep with carbohydrate equal to the color of the inoculated control tube.
No change (NC) or neutral (N): There is growth in the media, but neither the carbohydrate-containing medium nor the control base turns alkaline (red).
Note: If the organism does not grow at all in the OF medium, mark the reaction as no growth (NG).
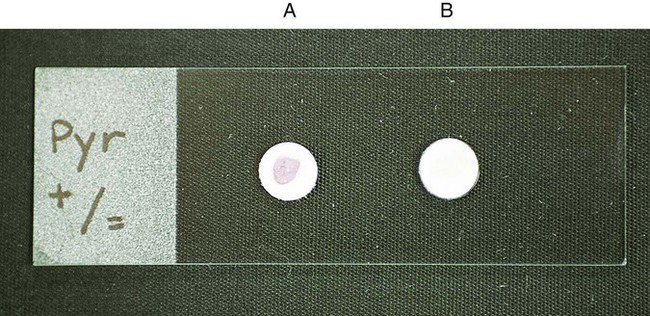
Procedure 13-36 L-Pyrrolidonyl Arylamidase (PYR) Test
1. Before inoculation, moisten the disk slightly with reagent-grade water. Do not flood the disk.
2. Using a wooden applicator stick, rub a small amount of several colonies of an 18- to 24-hour pure culture onto a small area of the PYR disk.
3. Incubate at room temperature for 2 minutes.
4. Add a drop of detector reagent, N,N-dimethylaminocinnamaldehyde, and observe for a red color within 1 minute.
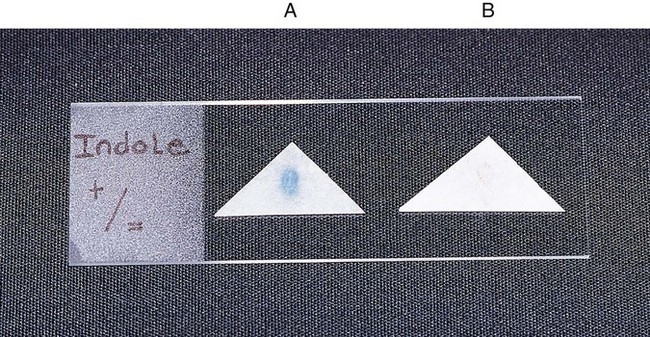
Procedure 13-39 Spot Indole Test
This test is used to determine the presence of the enzyme tryptophanase. It is a rapid method that can be used in lieu of the tube test described in Procedure 13-20.
1. Saturate a piece of filter paper with the 1% paradimethylaminocinnamaldehyde reagent.
2. Use a wooden stick or bacteriologic loop to remove a small portion of a bacterial colony from the agar surface and rub the sample on the filter paper. Rapid development of a blue color indicates a positive test result. Most indole-positive organisms turn blue within 30 seconds.
Procedure 13-40 Triple Sugar Iron Agar (TSI)
1. With a straight inoculation needle, touch the top of a well-isolated colony.
2. Inoculate TSI (Figure 13-42, D) by first stabbing through the center of the medium to the bottom of the tube and then streaking the surface of the agar slant.
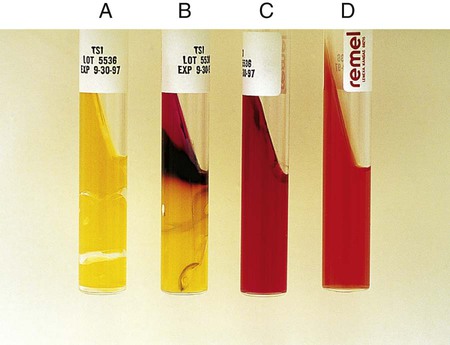
3. Leave the cap on loosely and incubate the tube at 35°-37°C in ambient air for 18 to 24 hours.
Alkaline slant/no change in the butt (K/NC): glucose, lactose, and sucrose nonutilizer; this may also be recorded as K/K (alkaline slant/ alkaline butt) (Figure 13-42, C).
Alkaline slant/acid butt (K/A): glucose fermentation only.
Acid slant/acid butt (A/A): glucose, sucrose, and/or lactose fermenter (Figure 13-42, A)
Note: A black precipitate in the butt indicates production of ferrous sulfide and H2S gas (H2S+) (Figure 13-42, B). Bubbles or cracks in the tube indicate the production of CO2 or H2. Drawing a circle around the A for the acid butt; that is,  , usually indicates this means the organism ferments glucose and sucrose, glucose and lactose, or glucose, sucrose, and lactose, with the production of gas.
 , gas production: Escherichia coli (ATCC25922)
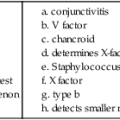
Procedure 13-42 X and V Factor Test
1. Make a very light suspension (MacFarland 0.5) of the organism in sterile saline. Note: It is important not to carry over any X factor in the medium from which the organism is taken. Therefore, a loop, not a swab, should be used to make the suspension.
2. Dip a sterile swab into the organism suspension. Roll the swab over the entire surface of a trypticase soy agar plate.
3. Place the X, V, and XV factor disks on the agar surface. If using separate disks, place them at least 4 to 5 cm apart.
Positive: Growth around the XV disk only shows a requirement for both factors (Figure 13-44, A). Growth around the V disk, no growth around the X disk, and light growth around the XV disk shows a V factor requirement (Figure 13-44, B).
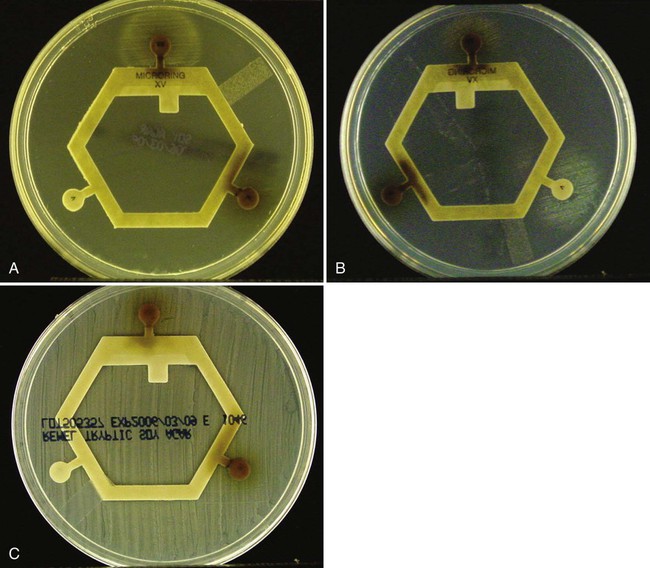
Negative: Growth over the entire surface of the agar indicates no requirement for either X or V factor (Figure 13-44, C).