CHAPTER 4 Nutritional Assessment and Management of the Malnourished Patient
BASIC NUTRITIONAL CONCEPTS
ENERGY STORES
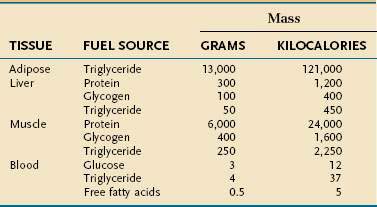
Endogenous energy stores are oxidized continuously for fuel. Triglyceride present in adipose tissue is the body’s major fuel reserve and is critical for survival during periods of starvation (Table 4-1). The high energy density and hydrophobic nature of triglycerides make it a fivefold better fuel per unit mass than glycogen. Triglycerides liberate 9.3 kcal/g when oxidized and are stored compactly as oil inside the fat cell. In comparison, glycogen produces only 4.1 kcal/g on oxidation and is stored intracellularly as a gel, containing approximately 2 g of water for every gram of glycogen. Adipose tissue is unable to provide fuel for certain tissues, such as bone marrow, erythrocytes, leukocytes, renal medulla, eye tissues, and peripheral nerves, which cannot oxidize lipids and require glucose for their energy supply. During endurance exercise, glycogen and triglycerides in muscle tissue provide an important source of fuel for working muscles.
ENERGY METABOLISM
Resting Energy Expenditure
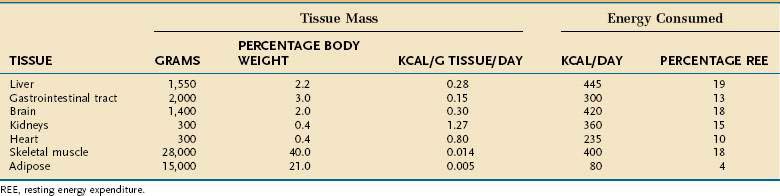
Resting energy expenditure (REE) represents energy expenditure while a person lies quietly awake in an interprandial state; under these conditions, approximately 1 kcal/kg body weight is consumed/hour in healthy adults. Energy requirements of specific tissues differ dramatically (Table 4-2). The liver, intestine, brain, kidneys, and heart constitute approximately 10% of total body weight but account for approximately 75% of REE. In contrast, skeletal muscle at rest consumes approximately 20% of REE but represents approximately 40% of body weight, and adipose tissue consumes less than 5% of REE but usually accounts for more than 20% of body weight.
Several empirical equations have been generated to estimate resting energy requirements (Table 4-3).1–4 These equations are useful in healthy subjects because they generate values that are usually within 10% of measured values. These equations are much less accurate, however, for persons who are at extremes in weight or who are ill, because alterations in body composition and metabolic stress influence energy expenditure. Protein-energy malnutrition and hypocaloric feeding without superimposed illness each decrease REE to values 10% to 15% below those expected for actual body size, whereas acute illness or trauma predictably increases energy expenditure (see later).
Table 4-3 Commonly Used Formulas for Calculating Resting Metabolic Rate
| Harris-Benedict Equation | |
|---|---|
| Men | 66 + (13.7 × W) + (5 × H) − (6.8 × A) |
| Women | 665 + (9.6 × W) + (1.8 × H) − (4.7 × A) |
| World Health Organization Formula | ||
|---|---|---|
| AGE (YR) | MALE | FEMALE |
| 0-3 | (60.9 × W) − 54 | (60.1 × W) − 51 |
| 3-10 | (22.7 × W) − 495 | (22.5 × W) + 499 |
| 10-18 | (17.5 × W) + 651 | (12.2 × W) + 746 |
| 18-30 | (15.3 × W) + 679 | (14.7 × W) + 996 |
| 30-60 | (11.2 × W) + 879 | (8.7 × W) + 829 |
| >60 | (13.5 × W) + 987 | (10.5 × W) + 596 |
A, age in years; H, height in centimeters; W, weight in kilograms.
Energy Expenditure of Physical Activity
The effect of physical activity on energy expenditure depends on the intensity and duration of daily activities. Highly trained athletes can increase their TEE 10- to 20-fold during athletic events. The activity factors shown in Table 4-4, each expressed as a multiple of REE, can be used to estimate TEE in active patients. The energy expended during physical activity is equal to REE × activity factor × duration of activity in hours/24 hours. TEE represents the summation of energy expended during all daily activities, including rest periods.
Table 4-4 Relative Thermic Effect of Various Levels of Physical Activity
| ACTIVITY LEVEL | EXAMPLES | ACTIVITY FACTOR |
|---|---|---|
| Resting | 1.0 | |
| Very light | Standing, driving, typing | 1.1-2.0 |
| Light | Walking 2-3 miles/hr shopping, light housekeeping | 2.1-4.0 |
| Moderate | Walking 3-4 miles/hr, biking, gardening, scrubbing floors | 4.1-6.0 |
| Heavy | Running, swimming, climbing, basketball | 6.1-10.0 |
Adapted from Alpers DA, Stenson WF, Bier DM. Manual of nutritional therapeutics. Boston: Little, Brown; 1995.
Recommended Energy Intake in Hospitalized Patients
Methods Incorporating Metabolic Stress Factors
Metabolic stress—that is, any injury or illness that incites some degree of systemic inflammation—will increase the metabolic rate through a variety of mechanisms (see later). The increase in energy expenditure is roughly proportional to the magnitude of the stress.5 Thus, the equations in Table 4-3 may be used to estimate the total energy requirement of an acutely ill patient by multiplying the predicted REE by a stress factor:

In acutely ill hospitalized patients, it is usually not necessary to include an activity factor. Although determination of the degree of stress is subjective, its use generates a caloric goal that closely approximates actual values. Table 4-5 delineates metabolic stress factors that accompany some common conditions and clinical scenarios in inpatients.
Table 4-5 Metabolic Stress Factors for Estimating Total Energy Expenditure in Hospitalized Patients
| INJURY OR ILLNESS | RELATIVE STRESS FACTOR* |
|---|---|
| Second- or third-degree burns, >40% BSA | 1.6-1.8 |
| Multiple trauma | 1.5-1.7 |
| Second- or third-degree burns, 20%-40% BSA | 1.4-1.5 |
| Severe infections | 1.3-1.4 |
| Acute pancreatitis | 1.2-1.4 |
| Second- or third-degree burns, 10%-20% BSA | 1.2-1.4 |
| Long bone fracture | 1.2 |
| Peritonitis | 1.2 |
| Uncomplicated postoperative state | 1.1 |
BSA, body surface area.
* A stress factor of 1.0 is assumed for healthy controls.
In using this formula, adjustments are necessary when the ABW is a misleading reflection of lean body mass. An adjusted ideal body weight should be substituted for ABW in obese individuals who are more than 30% heavier than their ideal body weight (desirable body weight, more commonly referred to as ideal body weight [IBW], appears in Table 4-6). The use of an adjusted IBW helps prevent an overestimation of energy requirements and is calculated as follows:

Method Without a Stress Factor
Table 4-7 outlines a simple method for estimating total daily energy requirements in hospitalized patients based on body mass index (BMI).6 With this method, energy expressed per kilogram is inversely related to BMI. Common sense needs to be applied when using any means to estimate energy expenditure in hospitalized individuals because illness commonly interjects artifacts into these calculations (e.g., ascites).
Table 4-7 Estimated Energy Requirements for Hospitalized Patients Based on Body Mass Index (BMI)*
| BODY MASS INDEX (BMI; KG/M2) | ENERGY REQUIREMENTS (KCAL/KG/DAY)† |
|---|---|
| <15 | 35-40 |
| 15-19 | 30-35 |
| 20-29 | 20-25 |
| ≥30 | 15-20 |
* The lower range within each BMI category should be considered in calculating energy requirements for insulin-resistant or critically ill patients to decrease the risk of hyperglycemia and infection associated with overfeeding.
† These values are recommended for critically ill patients and all obese patients; add 20% of the total calories when estimating energy requirements in non–critically ill patients.
Over the past two decades, the trend generally has been toward a more conservative approach to caloric delivery in acutely ill patients. One reason for this conservatism is that acute illness and its management often exacerbate preexisting diabetes or produces de novo glucose intolerance. As a result, hyperglycemia is a frequent consequence of enteral, and especially parenteral, nutrition. The issue seems to be particularly germane for intensive care unit (ICU) patients, in whom even modest hyperglycemia results in worse clinical outcomes, usually of an infectious nature. Clinical trials of high quality in surgical ICU (SICU)7 and medical ICU (MICU)8 patients have found that morbidity is substantially and significantly reduced in those randomized to intensive insulin therapy who maintained serum glucose levels below 111 mg/dL compared with those whose glucose values were maintained below 215 mg/dL. Mortality also was significantly lower in those in the SICU randomized to receive tight glucose control, although in the MICU study such reductions in mortality caused by tight glucose control only were realized in those residing in the MICU longer than three days. These clinical observations substantiate years of animal studies showing that even modest hyperglycemia impairs immune function in a variety of tissues.9 The clinical benefits of tight glucose control in the ICU, however, have not always been reproducible,10 and come at the cost of more frequent hypoglycemic episodes,7,8,10 so the issue of how tight glucose control should be remains controversial. Results of a recent meta-analysis of 29 trials in critically ill patients recapitulate the previously observed discrepancies between SICU and MICU patients.11 Overall, the relative risk of septicemia was reduced approximately 25% in those randomized to tight glucose control, but this salutary effect largely was attributable to the SICU patients, in whom the reduction in septicemia was almost 50%. In contrast, no benefit was observed in MICU patients. Also in this meta-analysis, no demonstrable benefit in overall mortality was evident in any of the categories of critically ill patients.
PROTEIN
Twenty different amino acids are found commonly in human proteins. Some amino acids (histidine, isoleucine, leucine, lysine, methionine, phenylalanine, threonine, tryptophan, valine, and possibly arginine) are considered essential because their carbon skeletons cannot be synthesized by the body. Other amino acids (glycine, alanine, serine, cysteine, cystine, tyrosine, glutamine, glutamic acid, asparagine, and aspartic acid) are nonessential in most circumstances because they can be made from endogenous precursors or essential amino acids. In disease states, nonessential amino acids may become essential—so-called conditionally essential amino acids. Thus, infectious morbidity and wound healing appear to be improved in critically ill patients by the inclusion of supplemental glutamine in total parenteral nutrition (TPN) because of cellular depletion of this amino acid. Studies to date suggest that the clinical benefits of providing supplemental quantities of parenteral glutamine only are realized in patients with particularly high severity of illness scores (e.g., high APACHE II or SOFA scores), although the true nature of its efficacy likely will remain controversial until the results of several ongoing clinical trials become known.12 Similarly, it has been shown that cysteine and tyrosine are essential in some patients with cirrhosis13 because of impaired hepatic synthesis.
The body of an average 75-kg man contains approximately 12 kg of protein. In contrast to fat and carbohydrate, there is no storage depot for protein, so excess intake is catabolized and the nitrogen component is excreted. Inadequate protein intake causes net nitrogen losses and, because no depot form of protein exists, there is an obligatory net loss of functioning protein. The U.S. Recommended Daily Allowance (RDA) of protein has been established at 0.8 g/kg/day, which reflects a mean calculated requirement of 0.6 g/kg/day plus an added factor to take into account the biological variance in requirement observed in a healthy population. Intravenously administered amino acids are as effective in maintaining nitrogen balance as oral protein of the same amino acid composition.14
Individual protein requirements are affected by several factors, such as the amount of nonprotein calories provided, overall energy requirements, protein quality, and the patient’s nutritional status (Table 4-8). Protein requirements increase when calorie intake does not meet energy needs. The magnitude of this increase is directly proportional to the deficit in energy supply. Therefore, nitrogen balance reflects protein intake and energy balance. Thus, correcting a negative nitrogen balance sometimes may be achieved merely by increasing the caloric delivery if the total amount of calories has been inadequate.
| CLINICAL CONDITION | DAILY PROTEIN REQUIREMENT (G/KG IBW) |
|---|---|
| Normal | 0.75 |
| Metabolic stress | 1.0-1.6 |
| Hemodialysis | 1.2-1.4 |
| Peritoneal dialysis | 1.3-1.5 |
IBW, ideal body weight.
* Additional protein requirements are needed to compensate for excess protein loss in specific patient populations (e.g., patients with burn injuries, open wounds, protein-losing enteropathy, or nephropathy). Lower protein intake may be necessary for patients with renal insufficiency not treated by dialysis and certain patients with liver disease and hepatic encephalopathy.
As metabolic stress (and with it, metabolic rate) increases, nitrogen excretion increases proportionately; quantitatively, the relationship is approximately 2 mg nitrogen (N)/kcal of REE. In part, this increase is explained by the fact that in metabolic stress, a larger proportion of the total substrate that is oxidized for energy is from protein. This has two important implications for managing the nutritional needs of ill patients. The first is that illness, by increasing catabolism and metabolic rate, increases the absolute requirement for protein (see Table 4-8), and does so in a manner that is roughly proportional to the degree of stress. Second, because a greater proportion of energy substrate in acute illness comes from protein, nitrogen balance is more readily achieved if a larger proportion of the total calories are from protein. In healthy adults, as little as 10% of total calories need to come from protein to maintain health, whereas in the ill patient, nitrogen balance is achieved more easily if 15% to 25% of total calories are delivered as protein.
Additional proteins are needed to compensate for excess loss in specific patient populations (e.g., patients with burn injuries, open wounds, and protein-losing enteropathy or nephropathy). Delivering less protein than is needed often is a necessary compromise in patients with acute renal insufficiency who are not adequately dialyzed, because in this situation the rise in azotemia is directly proportional to protein delivery. Once adequate dialysis is available, protein delivery should be increased to the actual projected need, including additional protein to compensate for losses resulting from dialysis (see Table 4-8). Most patients with hepatic encephalopathy respond to simple pharmacologic measures and therefore do not require a protein restriction; however, those who do not respond may benefit from a modest protein restriction (~0.6 g/kg/day).

CARBOHYDRATE
There is no absolute dietary requirement for carbohydrate because glucose can be synthesized from endogenous amino acids as well as glycerol. Nevertheless, carbohydrate is an important fuel because of the interactions between carbohydrate and protein metabolism. Carbohydrate intake stimulates insulin secretion, which inhibits muscle protein breakdown,15 stimulates muscle protein synthesis,16 and decreases endogenous glucose production from amino acids.17 In addition, glucose is the required or preferred fuel for red and white blood cells, the renal medulla, eye tissues, peripheral nerves, and the brain. Once glucose requirements for these tissues are met (∼150 g/day), however, the protein-sparing effects of carbohydrate and fat are similar.18
LIPIDS
Lipids consist of triglycerides (TGs), sterols, and phospholipids. These compounds serve as sources of energy, precursors for steroid hormone, prostaglandin, thromboxane, and leukotriene synthesis, structural components of cell membranes, and carriers of essential nutrients. Dietary lipids are composed mainly of TGs, which contain saturated and unsaturated long-chain fatty acids (FAs) of 16 to 18 carbons. The use of fat as a fuel requires the hydrolysis of endogenous or exogenous TGs and cellular uptake of released FAs. Long-chain FAs are delivered across the outer and inner mitochondrial membranes by a carnitine-dependent transport system.19 Once inside the mitochondria, FAs are degraded by beta oxidation to acetyl coenzyme A (CoA), which then enters the TCA cycle. Therefore, the ability to use fat as a fuel depends on normally functioning mitochondria. A decrease in the number of mitochondria or oxidative enzymes associated with aging20 or deconditioning favors the use of carbohydrate as fuel.21
Essential Fatty Acids
Humans lack the desaturase enzyme needed to produce the n-3 (double bond between carbons 3 and 4) and n-6 (double bond between carbons 6 and 7) FA series. Linoleic acid (C18 : 2, n-6) and linolenic acid (C18 : 3, n-3), therefore, should constitute at least 2% and 0.5%, respectively, of the daily caloric intake to prevent essential FA deficiency (EFAD). Before the advent of parenteral nutrition, EFAD was recognized only in infants and manifested as a scaly rash with a specific alteration in the plasma FA profile (see later). Adults previously were thought not to be susceptible to EFAD because of sufficient essential FA stores in adipose tissue. However, an abnormal FA profile in conjunction with a clinical syndrome of EFAD is now known to occur sometimes in adults with severe short bowel syndrome who are on long-term total parenteral nutrition (TPN) that lacks parenteral lipids.22 Adults who have moderate to severe fat malabsorption (fractional fat excretion >20%) from other causes and who are not TPN-dependent also frequently display a biochemical profile of EFAD,23 although whether such a biochemical state carries adverse clinical consequences with it is unclear. Moreover, TPN lacking any source of fat may lead to EFAD in adults if no exogenous source of EFAs is available; the plasma pattern of EFAD may be observed as early as 10 days after glucose-based TPN is started and before the onset of any clinical features.24 In this situation, EFAD is probably attributable to the increase in plasma insulin concentrations caused by TPN, because insulin inhibits lipolysis and therefore the release of endogenous essential FAs. The biochemical diagnosis of EFAD is defined as an absolute and relative deficiency in the two EFAs in the plasma FA profile. The full clinical EFAD syndrome includes alopecia, scaly dermatitis, capillary fragility, poor wound healing, increased susceptibility to infection, fatty liver, and growth retardation in infants and children.
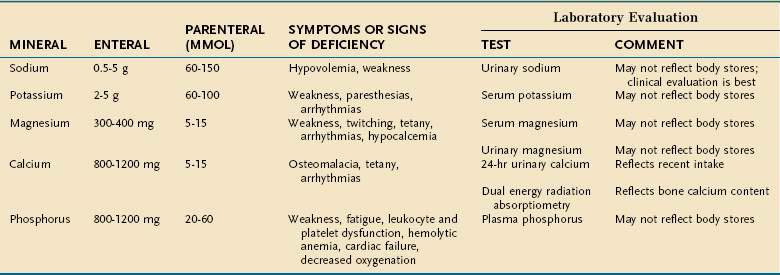
MAJOR MINERALS
Major minerals are inorganic nutrients that are required in large (>100 mg/day) quantities, and are important for ionic equilibrium, water balance, and normal cell function. Malnutrition and nutritional repletion can have dramatic effects on major mineral balance. The evaluation of macromineral deficiency and recommended daily allowance (RDA) of minerals for healthy adults are shown in Table 4-9.
MICRONUTRIENTS
An individual’s dietary requirement for any given micronutrient is determined by many factors, including its bioavailability, the amount needed to sustain its normal physiologic functions, a person’s gender and age, any diseases or drugs that affect the nutrient’s metabolism, and certain lifestyle habits, such as smoking and alcohol use. The U.S. National Academy of Sciences Food and Nutrition Board regularly updates dietary guidelines that define the quantity of each micronutrient that is “adequate to meet the known nutrient needs of practically all healthy persons.” These RDAs underwent revision between 1998 and 2001, and the values for adults appear in Tables 4-10 and 4-11. The formulation of an RDA takes into account the biological variability in the population, and, therefore, RDAs are set 2 SDs above the mean requirement; this allows the requirements of 97% of the population to be met and ingestion of quantities that are somewhat less than the RDA usually are sufficient to meet the needs of a particular individual. A “tolerable upper limit (TUL),” which is “the maximal daily level of oral intake that is likely to pose no adverse health risks,” also has been established for most of the micronutrients (see Tables 4-10 and 4-11). Present recommendations for how much of each micronutrient is needed in individuals on TPN are based on far less data than what were available for the development of the RDAs. Nevertheless, it is important to have guidelines, and Table 4-12 provides such recommendations.
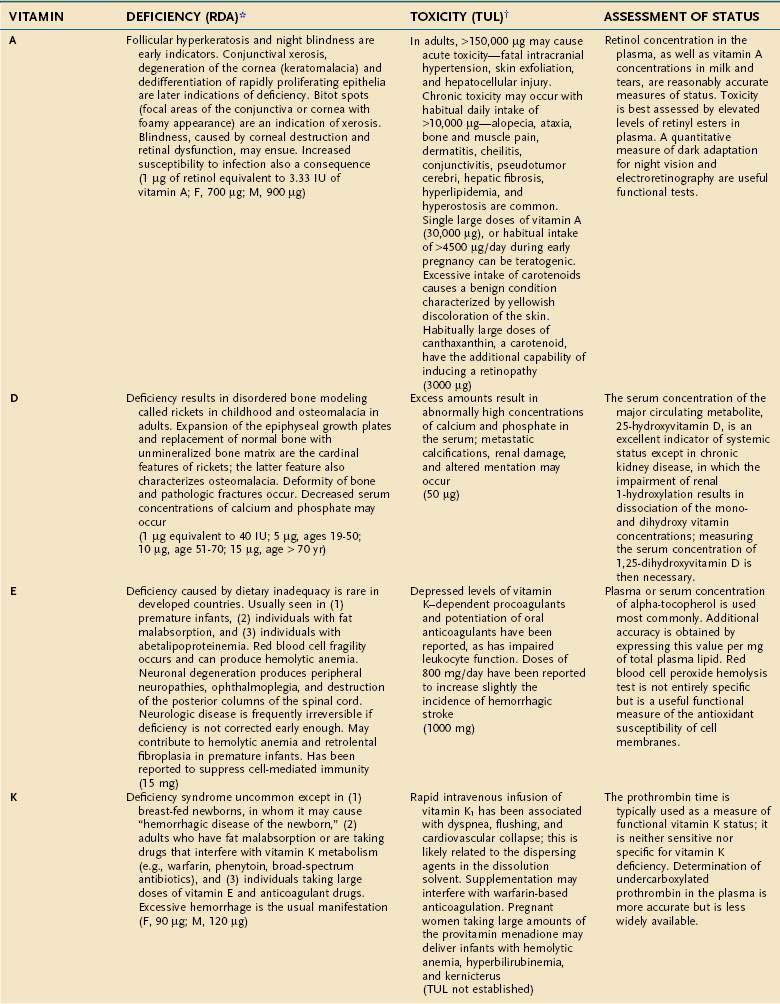
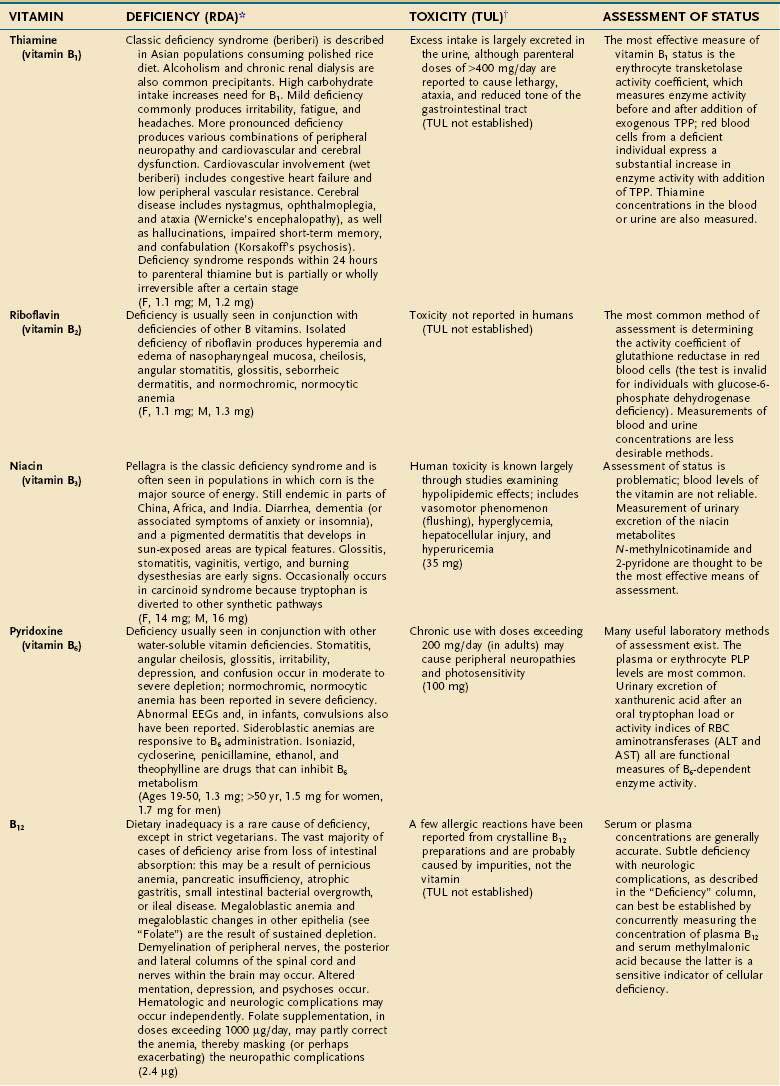
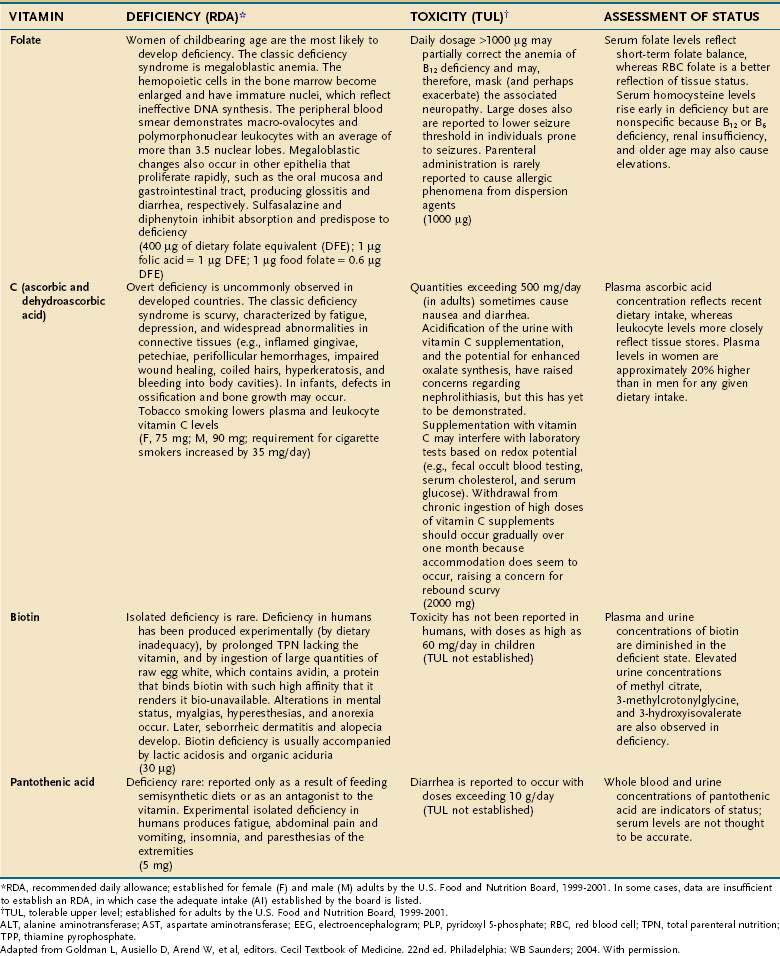
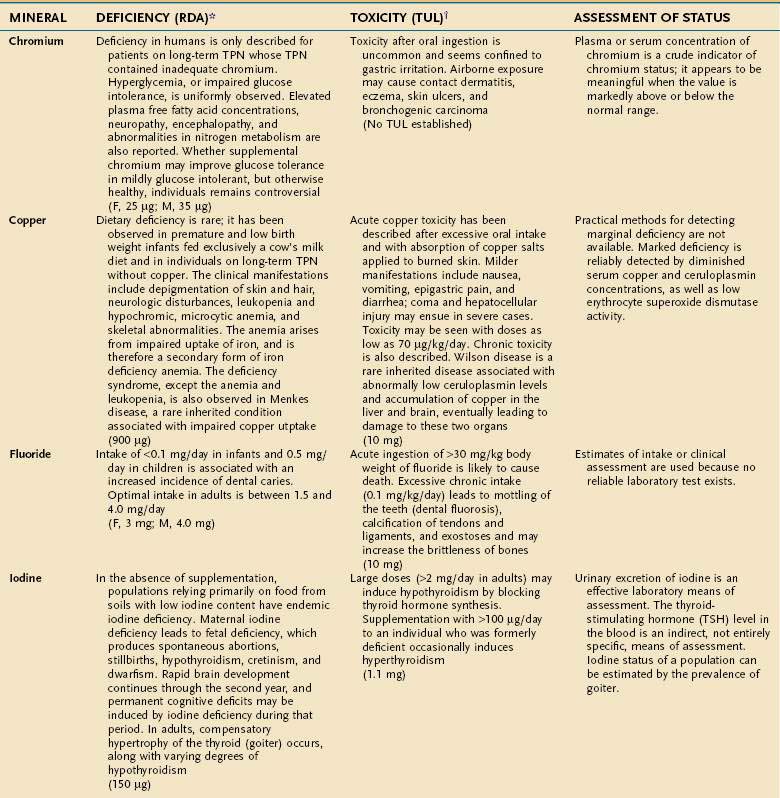
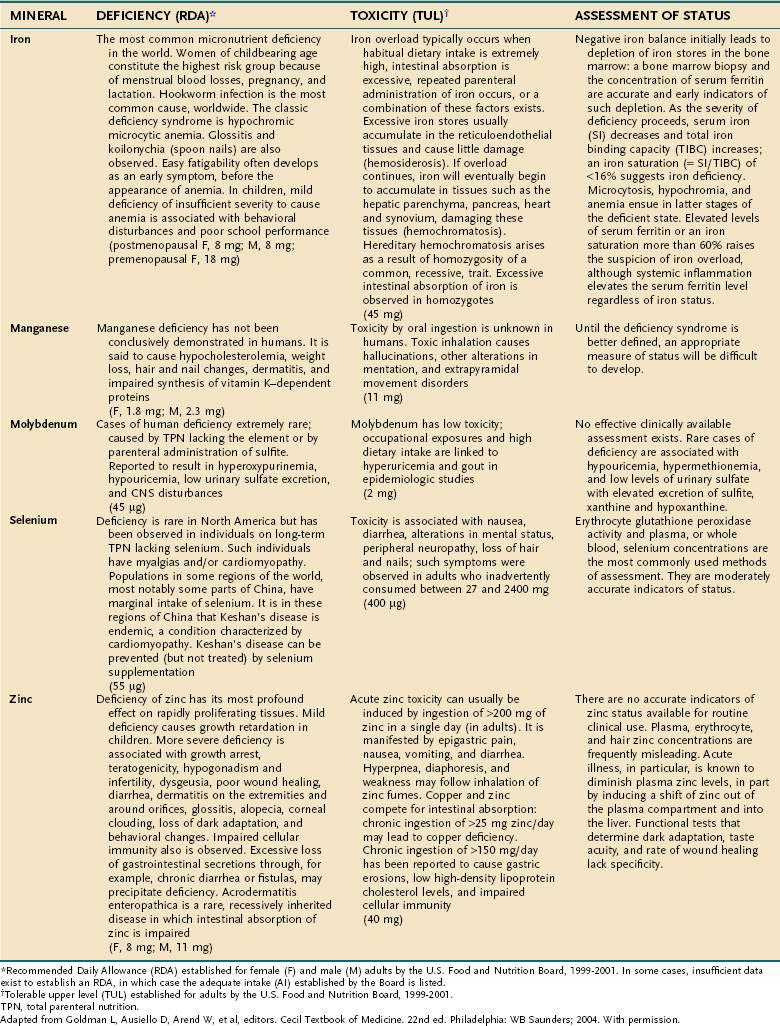
Table 4-12 Guidelines for Daily Delivery of Parenteral Micronutrients in Adults and Children
| MICRONUTRIENT | ADULTS | CHILDREN |
|---|---|---|
| Vitamin | ||
| A | 1000 µg (= 3300 IU) | 700 µg |
| D | 5 µg (= 200 IU) | 10 µg |
| E | 10 mg (= 10 IU) | 7 mg |
| K | 1 mg | 200 µg |
| C | 100 mg | 80 mg |
| Folate | 400 µg | 140 µg |
| Niacin | 40 mg | 17 mg |
| Riboflavin | 3.6 mg | 1.4 mg |
| Thiamine | 3 mg | 1.2 mg |
| B6 | 4 mg | 1.0 mg |
| B12 | 5 µg | 1.0 µg |
| Pantothenic acid | 15 mg | 5 mg |
| Biotin | 60 µg | 20 µg |
| Trace Elements | ||
| Copper | 0.5-1.5 mg | 20 µg/kg/day |
| Chromium | 10-15 µg | 0.2 µg/kg/day |
| Manganese | 0.1 mg | 1.0 µg/kg/day |
| Zinc | 2.5-4.0 mg | 50 µg/kg/day |
| Molybdenum | 15 µg | 0.25 µg/kg/day |
| Iodine* | — | — |
| Selenium | 100 µg | 2.0 µg/kg/day |
| Iron | 1-2 mg | 1 mg/day |
* Naturally occurring contamination of parenteral nutrition appears to provide sufficient quantities of iodine.
Adult vitamin guidelines adapted from American Society of Parenteral and Enteral Nutrition (ASPEN). Board of Directors and the Clinical Guidelines Task Force. Guidelines for the use of parenteral and enteral nutrition in adult and pediatric patients. JPEN J Parenter Enteral Nutr 2002;26:144. Children’s values adapted from Greene HL, Hambidge KM, Schanler R, Tsang RC. Guidelines for the use of vitamins, trace elements, calcium, magnesium, and phosphorus in infants and children receiving total parenteral nutrition: Report of the Subcommittee on Pediatric Parenteral Nutrient Requirements from the Committee on Clinical Practice Issues of the American Society for Clinical Nutrition. Am J Clin Nutr 1988; 48:1324; Am J Clin Nutr 1989; 49:1332; and Am J Clin Nutr 1989; 50:560.
VITAMINS
Vitamins are categorized as fat-soluble (A, D, E, K) or water-soluble (all others) (see Table 4-10). This categorization remains physiologically meaningful; none of the fat-soluble vitamins appear to serve as coenzymes, whereas almost all of the water-soluble vitamins appear to function in that role. Also, the absorption of fat-soluble vitamins is primarily through a micellar route, whereas the water-soluble vitamins are not absorbed in a lipophilic phase in the intestine (see Chapter 100).
TRACE MINERALS
Compelling evidence exists for the essential nature of 10 trace elements in humans—iron, zinc, copper, chromium, selenium, iodine, fluorine, manganese, molybdenum, and cobalt (see Table 4-11). The biochemical functions of trace elements have not been as well characterized as those of the vitamins, but most of their functions appear to be as components of prosthetic groups or as cofactors for a number of enzymes.
Aside from iron, the trace mineral depletion that clinicians are most likely to encounter is zinc deficiency. Zinc depletion is a particularly germane issue to the gastroenterologist because the gastrointestinal tract is a major site for zinc excretion. Chronically excessive losses of gastrointestinal secretions, such as chronic diarrhea in inflammatory bowel disease, is a known precipitant for zinc deficiency, and in this setting zinc requirements often increase several-fold.25 Nevertheless, a biochemical diagnosis of zinc deficiency is problematic, as is true for many of the other essential trace minerals. Accurate laboratory assessment of zinc status is complicated by the very low concentrations of zinc in bodily fluids and tissues, a lack of correlation between serum and red blood cell levels of zinc with levels in the target tissues, and the reality that functional tests have yet to be devised. Furthermore, it is well recognized that in acute illness a shift in zinc occurs from the serum compartment into the liver, further obscuring the diagnostic value of serum zinc levels.26,27 Thus, it is often best simply to proceed with empirical zinc supplementation in patients whose clinical scenario puts them at high risk of zinc deficiency.
Some reports have indicated that TPN solutions that deliver several-fold more manganese than what is recommended in Table 4-12 may lead to deposition of the mineral in the basal ganglia, with extrapyramidal symptoms, seizures, or both.28 Because the content of manganese varies widely in the different trace element mixtures available for TPN compounding, the health professional needs to be mindful of this issue as protocols for TPN admixtures are developed.
PHYSIOLOGIC AND PATHOPHYSIOLOGIC FACTORS AFFECTING MICRONUTRIENT REQUIREMENTS
Age
An evolution of physiology continues throughout the life cycle, with an impact on the requirements of certain micronutrients with aging; specific RDAs for older adults now have been developed. The mean vitamin B12 status of most populations, for example, declines significantly with older age, in large part because of the high prevalence of atrophic gastritis and its resultant impairment of protein-bound vitamin B12 absorption.29 Approximately 10% to 15% of the older ambulatory population is thought to have significant vitamin B12 depletion because of this phenomenon, and neuropathic degeneration may occur in older individuals whose plasma vitamin B12 levels are in the low-normal range (150 to 300 pg/mL), even in the absence of hematologic manifestations. For this reason, the use of sensitive indicators of cellular depletion of vitamin B12, such as serum methylmalonic acid levels in conjunction with serum levels of vitamin B12, now are recommended for diagnosis.30 Some experts also suggest that older adults should consume a portion of their vitamin B12 requirement in the crystalline form (i.e., as a supplement) rather than relying only on the naturally occurring protein-bound forms found in food.31 Older adults also require greater quantities of vitamins B6 and D and calcium to maintain health compared with younger adults, and these requirements are reflected in the new RDAs (see Tables 4-10 and 4-11).
Malabsorption and Maldigestion
Conditions that produce fat malabsorption frequently are associated with selective deficiencies of the fat-soluble vitamins. The early stages of many vitamin deficiencies are not apparent clinically and therefore may go undetected until progression of the deficiency has resulted in significant morbidity. This can be disastrous in conditions such as spinocerebellar degeneration from vitamin E deficiency, which often is irreversible.32 Fat-soluble vitamin deficiencies are well-recognized complications of cystic fibrosis and congenital biliary atresia in which fat malabsorption often is overt, but monitoring also is necessary in conditions associated with more subtle fat malabsorption, such as the latter stages of chronic cholestatic liver disease.33,34
Restitution of vitamin deficiencies sometimes can be difficult when severe fat malabsorption is present and initial correction may require parenteral administration. In severe fat malabsorption, chemically modified forms of vitamins D and E that largely bypass the need for the lipophilic phase of intestinal absorption are commercially available for oral use and can be helpful. The polyethylene glycol succinate form of vitamin E (Nutr-E-Sol) is very effective in patients with severe fat malabsorption who cannot absorb conventional alpha-tocopherol.35 Similarly, hydroxylated forms of vitamin D (1-hydroxyvitamin D [Hectorol] and 1,25-dihydroxyvitamin D [Rocaltrol]) can be used in patients resistant to the more conventional forms of vitamin D. Intermittent monitoring of serum calcium levels is indicated in the first few weeks of therapy when hydroxylated forms of vitamin D are administered because they are considerably more potent than vitamin D2 or D3 and risk of vitamin D toxicity exists. In contrast, water-miscible preparations of fat-soluble vitamins, in which a conventional form of vitamin A or E is dissolved in polysorbate 80 (e.g., Aquasol-E, Aquasol-A), have not been proven to improve overall absorption. At the time of this writing, Aquasol-A is no longer available as an oral supplement.
Maldigestion usually results from chronic pancreatic insufficiency, which if untreated frequently causes fat malabsorption and deficiencies of fat-soluble vitamins. Vitamin B12 malabsorption also can be demonstrated in this setting, but clinical vitamin B12 deficiency is rare unless other conditions known to diminish its absorption also are present, such as atrophic gastritis29 or chronic administration of proton pump inhibitors (PPIs).36 Whether the long-term administration of PPIs alone warrants occasional checks of vitamin B12 status is a matter of debate. Regardless, malabsorption of vitamin B12 from atrophic gastritis or with PPIs is confined to dietary sources of vitamin B12. Small supplemental doses of crystalline vitamin B12 are absorbed readily in both cases. Histamine H2 receptor antagonists also inhibit protein-bound vitamin B12 absorption, although the effect generally is believed to be less potent than with the PPIs.37
Many medications may adversely affect micronutrient status. The manner in which drug-nutrient interaction occurs varies; some of the more common mechanisms are described in Table 4-13. A comprehensive discussion of drug-nutrient interactions is beyond the scope of this chapter and the reader is referred to other references for a detailed discourse on this topic.38
| DRUG(S) | NUTRIENT | MECHANISM(S) |
|---|---|---|
| Dextroamphetamine, fenfluramine, levodopa | Potentially all micronutrients | Induces anorexia |
| Cholestyramine | Vitamin D, folate | Adsorbs nutrient, decreases absorption |
| PPIs | Vitamin B12 | Modest bacterial overgrowth, decreases gastric acid, impairs absorption |
| Sulfasalazine | Folate | Impairs absorption and inhibits folate-dependent enzymes |
| Isoniazid | Pyridoxine | Impairs uptake of vitamin B6 |
| NSAIDs | Iron | Gastrointestinal blood loss |
| Penicillamine | Zinc | Increases renal excretion |
NSAIDs, nonsteroidal anti-inflammatory drugs; PPIs, proton pump inhibitors.
From Goldman L, Ausiello D, Arend W, et al, editors. Cecil Textbook of Medicine. 22nd ed. Philadelphia: WB Saunders; 2004. With permission.
STARVATION
During the first 24 hours of fasting, the most readily available energy substrates (i.e., circulating glucose, FAs, and TGs, and liver and muscle glycogen) are used as fuel sources. The sum of energy provided by these stores in a 70-kg man, however, is only about 5000 kJ (1200 kcal) and therefore is less than a full day’s requirements. Hepatic glucose production and oxidation decrease, whereas whole-body lipolysis increases, and the latter provides additional FAs and ketone bodies.39 Oxidation of the FAs released from adipose tissue TGs accounts for approximately 65% of energy consumed during the first 24 hours of fasting.
During the first several days of starvation, obligate glucose-requiring tissues such as the brain and blood cells, which collectively account for about 20% of total energy consumption, can use only glycolytic pathways to obtain energy. Because FAs cannot be converted to carbohydrate, these glycolytic tissues must use glucose or substrates that can be converted to glucose. Glucogenic amino acids derived from skeletal muscle (chiefly alanine and glutamine) are a major source of substrate for this purpose. Approximately 15% of the REE is provided by oxidation of protein.40 The relative contribution of gluconeogenesis to hepatic glucose production increases as the rate of hepatic glycogenolysis declines because the latter process becomes redundant; after 24 hours of fasting, only 15% of liver glycogen stores remain.
During short-term starvation (1 to 14 days), several adaptive responses appear that lessen the loss of lean mass. A decline in levels of plasma insulin, an increase in plasma epinephrine levels, and an increase in lipolytic sensitivity to catecholamines stimulate adipose tissue lipolysis.41,42 The increase in FA delivery to the liver, in conjunction with an increase in the ratio of plasma glucagon-to-insulin concentrations, enhances the production of ketone bodies by the liver. A maximal rate of ketogenesis is reached by three days of starvation, and plasma ketone body concentration is increased 75-fold by seven days. In contrast to FAs, ketone bodies can cross the blood-brain barrier and provide most of the brain’s energy needs by seven days of starvation.43 The use of ketone bodies by the brain greatly diminishes glucose requirements and thus spares the need for muscle protein degradation to provide glucose precursors. If early protein breakdown rates were to continue throughout starvation, a potentially lethal amount of muscle protein would be catabolized in less than three weeks. Similarly, the heart, kidney, and skeletal muscle change their primary fuel substrate to FAs and ketone bodies. Other tissues such as bone marrow, renal medulla, and peripheral nerves switch from full oxidation of glucose to anaerobic glycolysis, resulting in increased production of pyruvate and lactate. The latter two compounds can be converted back to glucose in the liver using energy derived from fat oxidation via the Cori cycle, and the resulting glucose is available for systemic consumption. This enables energy stored as fat to be used for glucose synthesis.
During long-term starvation (14 to 60 days), maximal adaptation is reflected by a plateau in lipid, carbohydrate, and protein metabolism. The body relies almost entirely on adipose tissue for its fuel, providing more than 90% of daily energy requirements.44 Muscle protein breakdown decreases to less than 30 g/day, causing a marked decrease in urea nitrogen production and excretion. The decrease in osmotic load diminishes urine volume to 200 mL/day, thereby reducing fluid requirements. Total glucose production decreases to approximately 75 g/day, providing fuel for glycolytic tissues (40 g/day) and the brain (35 g/day) while maintaining a constant plasma glucose concentration. Energy expenditure decreases by 20% to 25% at 30 days of fasting and remains relatively constant thereafter, despite continued starvation.
The metabolic response to short- and long-term starvation differs somewhat between lean and obese persons. Obesity is associated with a blunted increase in lipolysis and decrease in glucose production compared with that in lean persons.45,46 In addition, protein breakdown and nitrogen losses are less in obese persons, thereby helping conserve muscle protein.47
The events that mark the terminal phase of starvation have been studied chiefly in laboratory animals. Body fat mass, muscle protein, and the sizes of most organs are markedly decreased. The weight and protein content of the brain, however, remain relatively stable. During this final phase of starvation, body fat stores reach a critical level, energy derived from body fat decreases, and muscle protein catabolism is accelerated. Death commonly occurs when there is a 30% to 50% loss of skeletal muscle protein.48 In humans, it has been proposed that there are certain thresholds beyond which lethality is inevitable—depletion of total body protein between 30% and 50% and of fat stores between 70% and 95%, or reduction of BMI below 13 kg/m2 for men and 11 kg/m2 for women.49,50
MALNUTRITION
PROTEIN-ENERGY MALNUTRITION
Illness or injury may directly interfere with nutrient assimilation; for example, extensive ileal disease or resection may directly produce fat malabsorption and a caloric deficit. The most common causes of secondary PEM, however, are the remarkable increases in protein catabolism and energy expenditure that occur as a result of a systemic inflammatory response. REE may increase as much as 80% above basal levels in a manner roughly proportional to the magnitude of the inflammatory response, which in turn is roughly proportional to the severity and acuity of the illness. Thus, for example, REE in patients with extensive second- and third-degree burns (the prototype for maximal physiologic stress) may approach twice normal; with sepsis, REE is about 1.5 times normal; and with a localized infection or fracture of a long bone, REE is 25% above normal.5 Such stress factors can be used to construct a formula for predicting the caloric needs of ill individuals (see Table 4-5).
Protein catabolism during illness or injury also increases in proportion to the severity and acuity of the insult, and therefore parallels the increase in energy consumption. The magnitude of increase in protein catabolism, however, is proportionately greater than that observed with energy consumption, such that urinary urea N losses, which reflect the degree of protein catabolism in acute illness, are about 2.5 times the basal level with maximal stress.5 This increase in catabolism results in a net loss of protein because the rate of synthesis usually does not rise in concert with the rise in catabolism.51 No known storage form of protein exists in the body and, therefore, any net loss of protein represents a loss of functionally active tissue. A healthy adult typically loses about 12 g N in the urine/day, and excretion may increase to as much as 30 g/day during critical illness. Because 1 g of urinary N represents the catabolism of approximately 30 g of lean mass, it follows that severe illness may produce a daily loss of up to ~0.5 kg of lean mass as a result of excess protein catabolism. Most of this loss comes from the skeletal muscle, where the efflux of amino acids increases two- to sixfold in critically ill patients.52
Mobilization of amino acids from skeletal muscle appears to be an adaptive response. Once liberated, these amino acids, in part, are deaminated and used for gluconeogenesis; they also are taken up by the liver and other visceral organs. The proteolysis of muscle under stress thus enables the body to shift amino acids from the skeletal muscle (the somatic protein compartment) to the visceral organs (the visceral protein compartment), the functions of which are more critical for immediate survival during illness. Nevertheless, with sustained stress, the limitations of this adaptive response become evident, and even the visceral protein compartment sustains a contraction in mass.44
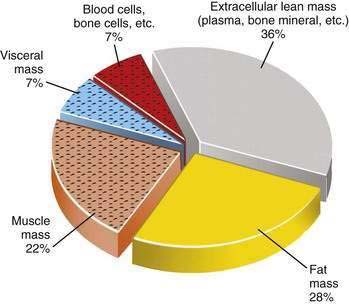
Primary versus Secondary Protein-Energy Malnutrition: A Body Compartment Perspective
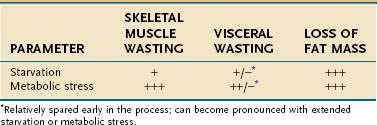
The type of tissue lost as malnutrition evolves is critical in determining the pathologic ramifications of weight loss. Over 95% of energy expenditure resides in the lean body mass, which therefore contains the bulk of metabolism that sustains homeostasis. It is the maintenance of this body compartment that is most critical for health. Lean body mass can be subdivided further into somatic and visceral protein compartments, blood and bone cells, and extracellular lean mass, such as plasma and bone matrix (Fig. 4-1). In total or semistarvation in otherwise healthy individuals, adipose tissue predominates as a primary energy source; thus, fat mass contracts to a much greater degree proportional to the loss of lean mass.44 Alterations in metabolism from injury or illness, however, produce a proportionately greater loss of muscle mass so that it matches or exceeds the loss in fat mass.53,54 Although the lean mass that is lost in illness preferentially is from the somatic protein compartment, with sustained stress there also will be a significant contraction of the visceral protein compartment (Table 4-14). The metabolic forces associated with acute illness and injury are potent, and restoration of muscle mass is unlikely with nutritional support unless the underlying inflammatory condition is corrected. There is increasing interest in attenuating or reversing net catabolism with the use of exogenous anabolic agents in conjunction with nutrition, although to date it remains unclear whether the clinical benefits of using exogenous growth hormone and other anabolic agents in acute illness outweigh their potential side effects.55,56 Another important ramification of the potency of the catabolic state associated with acute illness is that most of the weight that is gained with the provision of nutritional support is the result of increases in fat mass and body water; only minor increases in lean mass are observed until the inflammatory focus is resolved.57
Cytokines are the most important mediators of the alterations in energy and protein metabolism that accompany illness and injury. In a wide spectrum of systemic illnesses, increased secretion of interleukin-1 (IL-1), tumor necrosis factor-α (TNF-α), IL-6, and interferon-γ (IFN-γ) has been observed to be associated with increased energy expenditure and protein catabolism, as well as the shift of amino acids into the visceral compartments.58–60 Such observations concur with in vitro studies in human cells and animal models that have shown remarkably potent effects of these cytokines in this regard (Table 4-15). In the wasting syndrome associated with cancer, proteolysis-inducing factor and lipid-mobilizing factor are two humoral mediators that appear to be unique to cancer cachexia, contributing to protein catabolism and loss of adipose tissue, respectively.61
Table 4-15 Major Cytokines That Mediate Hypercatabolism and Hypermetabolism Associated with Metabolic Stress
| CYTOKINE | CELL SOURCE | METABOLIC EFFECTS |
|---|---|---|
| Tumor necrosis factor-α | Monocytes/macrophages, lymphocytes, Kupffer cells, glial cells, endothelial cells, natural killer cells, mast cells | Decreased FFA synthesis |
| Increased lipolysis | ||
| Increased peripheral amino acid loss | ||
| Increased hepatic amino acid uptake | ||
| Fever | ||
| IL-1 | Monocytes/macrophages, neutrophils, lymphocytes, keratinocytes, Kupffer cells | Increased ACTH levels |
| Increased hepatic acute-phase protein synthesis | ||
| Fever | ||
| IL-6 | Monocytes/macrophages, keratinocytes, endothelial cells, fibroblasts, T cells, epithelial cells | Increased acute-phase protein synthesis |
| Fever | ||
| IFN-γ | Lymphocytes, pulmonary macrophages | Increased monocyte respiratory burst |
ACTH, adrenocorticotropic hormone; FFA, free fatty acid; IL, interleukin; IFN, interferon.
Adapted from Smith M, Lowry S. The hypercatabolic state. In: Shils M, Olson J, Shike M, Ross AC, editors. Modern Nutrition in Health and Disease. Baltimore: Williams & Wilkins; 1999. p 1555.
Protein-Energy Malnutrition in Children
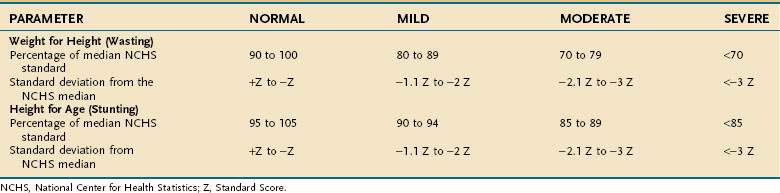
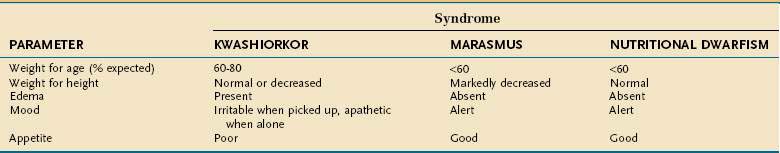
Undernutrition in children differs from that in adults because it affects growth and development. Much of our understanding of undernutrition in children comes from observations made in underdeveloped nations in which poverty, inadequate food supply, and unsanitary conditions lead to a high prevalence of PEM. The Waterlow classification of malnutrition takes into account a child’s weight for height (wasting) and height for age (stunting) (Table 4-16).62 The characteristics of the three major clinical PEM syndromes in children—kwashiorkor, marasmus, and nutritional dwarfism—are outlined in Table 4-17.63 Although these three syndromes are classified separately, overlap syndromes often coexist in the same patient.
PHYSIOLOGIC IMPAIRMENTS CAUSED BY PROTEIN-ENERGY MALNUTRITION
System Effects
Gastrointestinal Tract
Although PEM alone produces adverse effects on gastrointestinal structure and function, diminished stimulation of the gastrointestinal tract by a lack of ingested nutrients has an independent effect. Thus, sustained absence of nutrients passing through the intestine of healthy, nutritionally replete, parenterally fed individuals alone results in functional atrophy of the small intestinal mucosa, as evidenced by a loss of brush border enzymes and diminished integrity of the epithelial barrier. Villus atrophy also may be observed with lack of intestinal stimulation but, in the absence of PEM, the degree of structural atrophy is minor.64
NUTRITIONAL ASSESSMENT TECHNIQUES
Overview
The purpose of nutritional assessment is to identify PEM and other nutritional deficits, even when they are not readily discernible. PEM can be subtle, but most cases are detected when a systematic nutritional assessment is performed. An example of subtle but clinically significant PEM is found in Child-Turcotte-Pugh class A alcoholic cirrhotics. These individuals usually appear well nourished. Indeed, one criterion to determine class A status is a normal serum albumin level. Studies of whole-body nitrogen by in vivo neutron activation analysis, however, have demonstrated that more than half of these class A individuals have less than 80% of expected total body protein,65 the threshold level below which patients have increased morbidity associated with malnutrition.54
In otherwise healthy people and in those who are chronically ill, PEM usually is defined by comparing an anthropometric measurement, such as weight for height, to established normative standards (see Table 4-6). In contrast, there is no gold standard to define and measure PEM in the acutely ill patient because most parameters used to assess PEM in otherwise healthy persons are altered by illness; weight and the concentration of serum proteins are prime examples.
Despite the inaccuracies inherent in assessing PEM in acutely ill individuals, however, the usefulness of nutritional assessment in this setting has been demonstrated repeatedly. Acutely ill patients who are malnourished sustain higher rates of malnutrition-related morbidity. The presence of PEM, therefore, has a predictive value. Even more importantly, identification of malnourished patients and appropriate nutritional intervention is likely to improve clinical outcome.66–73 Meta-analyses have underscored the importance of performing objective nutritional assessments to categorize inpatients, because individuals who are well-nourished or mildly malnourished seem to realize little benefit from intensive nutritional support.71–73
Specific Tools for Assessing Protein-Energy Malnutrition
History
Weight Loss
Unintentional weight loss associated with illness is the single most practical predictor of a clinically significant degree of PEM. It is useful to quantify such loss by determining whether the patient has sustained a mild (<5%), moderate (5% to 10%), or severe (>10%) degree of loss over the preceding six months. Because acute illness incites a disproportionately large loss of lean mass, it is not surprising that a more than 10% unintentional loss in body weight usually translates into a 15% to 20% decrease in total body protein.54 This degree of unintentional loss is an important threshold because it is associated with impaired physiology, a poor clinical outcome, and extended hospitalization74–76; it also defines those individuals who will likely benefit from intensive nutritional support. The clinician should nevertheless be mindful that determination of the magnitude of weight loss by history has limited accuracy; one study has found that one third of patients with true weight loss go undetected by history and one quarter of those who had been weight-stable are miscategorized as having undergone weight loss.77 Furthermore, the nutritional significance of changes in body weight can be confounded by changes in hydration status and extracellular fluid accumulation. Because weight loss is an imperfect indicator of PEM, it is useful to obtain other historical clues that can contribute to the identification of these patients (see later).
Evidence of Specific Nutrient Deficiencies
Are there symptoms of specific nutrient deficiencies, including macrominerals, micronutrients, and water? (See Tables 4-9 to 4-11.)
Anthropometry
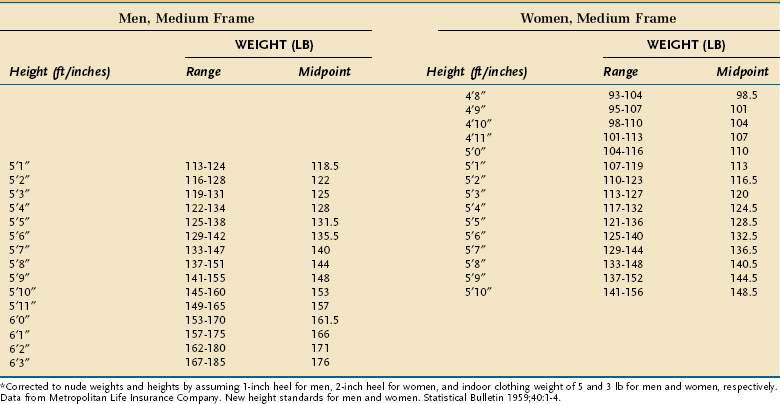
Anthropometric techniques are those in which a quantitative measure of the size, weight, or volume of a body part is used to assess protein and calorie status. Historically, one of the most commonly used anthropometric parameters has been weight for height. This is a useful parameter when neither the patient nor family can provide reliable historical information, but is less desirable than a history of unintentional weight loss because it requires the patient’s weight to be judged against a normative standard that has been established in a large control population, and interindividual variability in the population limits the accuracy with which this method correctly predicts PEM in a single person. Table 4-6 displays the 1959 Metropolitan Health desirable body weights that were established with prospective mortality data. The 1959 tables remain preferable to the 1983 tables because of certain assumptions made in the construction of the latter. In the context of the Metropolitan tables, desirable weight for height is defined as that figure associated with maximal longevity. Generally speaking, individuals whose weight is less than 85% of the standard can be considered to have a clinically significant degree of PEM. Of note is that desirable weights in this table are substantially less than average weights in North America.
Body mass index (Table 4-18), defined as weight (in kilograms) divided by height (in meters squared), has been supplanting the use of weight for height, in part because it precludes the need to use normative data tables. BMIs that are outside the desirable range (18.5 to 24.9 kg/m2) help identify patients at increased risk of adverse clinical outcomes. A BMI modestly above the desirable range has been shown to be predictive of adverse outcomes in the surgical management of many diseases78–80 and in the medical management of conditions such as alcoholic liver disease.81 Similarly, a low BMI has been shown to be a robust independent risk factor in surgical and medical patients.82 Adult patients who are extremely underweight (BMI < 14 kg/m2) are at high risk of death and should be strongly considered for admission to the hospital for the initiation of intensive nutritional support.
Table 4-18 Classification of Nutritional Status by Body Mass Index in Adults
| BODY MASS INDEX (KG/M2) | NUTRITIONAL STATUS |
|---|---|
| <16.0 | Severely malnourished |
| 16.0-16.9 | Moderately malnourished |
| 17.0-18.4 | Mildly malnourished |
| 18.5-24.9 | Normal |
| 25.0-29.9 | Overweight |
| 30.0-34.9 | Obese (class I) |
| 35.0-39.9 | Obese (class II) |
| ≥40 | Obese (class III) |
The BMI, however, like weight for height, is a surrogate and imperfect measure of body composition. A low BMI (<18.5 kg/m2) is interpreted as an indication of PEM and a high BMI (>24.9 kg/m2) is interpreted as excessive fat mass (overweight or obesity). Although BMI is accurate in this regard for the vast majority of adults, it can be just as misleading as any other measure that relies on body weight without a direct evaluation of body composition.83 For example, the individual with excessive fluid accumulation, where the actual fat and body cell mass are less than that implied by the BMI, and in the muscle-bound athlete, where a high BMI is indicative of an extraordinarily large lean mass, are two examples in which the underlying assumptions inherent in the BMI are false. Gender and race also are confounding variables, although the differences are clinically irrelevant; more important are the remarkable changes in body composition that accompany development, making the interpretation of BMI in childhood and adolescence very complex.84
It should be apparent from this discussion that the measurement of relevant body compartments, such as the fat mass or fat-free mass, can reveal important information about nutritional status that is often obscured by measurement of weight alone. Underwater (hydrostatic) weighing, dual energy x-ray absorptiometry (DEXA), air impedance plethysmography, total body potassium, isotopically labeled water dilution, in vivo neutron activation analysis, computed tomography (CT), and magnetic resonance imaging (MRI) are accurate noninvasive or minimally invasive techniques of measuring body compartments.85–91 All are highly effective but because of their expense, lack of accessibility, and impracticality, their use is relegated largely to the sphere of clinical research. A detailed understanding of these tools is beyond the scope of this chapter; however, the primary use of each, with reference to detailed reviews, is outlined in Table 4-19.
Table 4-19 Advanced Techniques for Measurement of Body Compartments
| TECHNIQUE | PRIMARY USE IN BODY COMPARTMENT ANALYSIS |
|---|---|
| Underwater (hydrostatic) weighing84 | Proportion of body composed of FMProportion of body composed of LM |
| Air displacement plethysmography85 | Proportion of body composed of FMProportion of body composed of LM |
| Dual energy x-ray absorptiometry86 | Absolute FM and LM; bone density |
| Total body potassium87 | Body cell mass |
| Isotopically labeled water and NaBr dilution88 | TBW, ICW, ECW |
| In vivo neutron activation analysis89 | Total body protein, absolute FM, absolute LM |
| Computed tomography84 | Regional FM/LM |
| Magnetic resonance imaging90 | Regional FM/LM |
ECW, extracellular water; FM, fat mass; ICW, intracellular water; LM, lean mass; NaBr, sodium bromide; TBW, total body water.
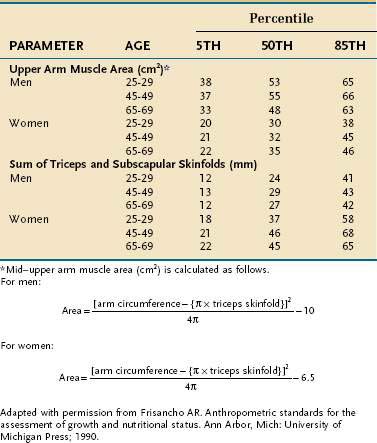
In the clinical setting, simple but less accurate techniques are used to assess body compartments. An approximate measure of whole-body fat mass can be derived from assessing the thickness of the subcutaneous fat, which, in a normally proportioned adult, contains approximately half of the body’s adipose stores. The triceps and subscapular sites are used most commonly for this purpose, and it is best to use the sum of the triceps and subscapular folds because sizable interindividual differences exist in fat distribution. Furthermore, as total body fat changes, the subcutaneous fat at each site responds in a different manner. Similarly, midarm muscle circumference (MAMC) provides a measure of skeletal muscle mass. Table 4-20 contains guidelines for interpretation of skinfold and midarm muscle area based on data from the first two National Health and Nutrition Examination Surveys (NHANES I and II).92
Table 4-20 Normative Standards for Upper Arm Muscle Area and Sum of Triceps and Subscapular Skinfolds
The clinical use of skinfolds and appendicular muscle area has distinct weaknesses. As was true for the weight for height tables, there is considerable interindividual variation in values, so these measurements are more useful in population studies than in an individual. Moreover, these measures are highly operator-dependent.93 Also, although the updated databases defining normative values no longer contain the biases of race and age of older versions, correction factors for hydration and physical activity still are not available.
In practice, I have found the most useful clinical role for the measurement of skinfolds and muscle area is in tracking patients with serial measurements over time as a means of monitoring their recovery from disease or response to a clinical intervention. In this manner, the patient is being compared with himself or herself rather than with some normative value. In gastroenterology, the use of skinfolds and muscle area has been of particular usefulness in the assessment and management of cirrhotic patients because cirrhosis corrupts almost all the other common measures of nutritional status. Abnormally low values for triceps skinfold (TSF) and MAMC are independent predictors of mortality in cirrhotics and their incorporation into a Cox regression model improves the prognostic value of the Child-Turcotte score.94 Also, when patients with severe alcoholic hepatitis are treated with anabolic steroids, improvements in MAMC and other measures of the fat-free mass (FFM) correlate with a positive response to treatment.95
Interest continues in bioimpedance analysis (BIA) as an inexpensive, relatively easy, noninvasive, and safe means of assessing FFM, body cell mass (BCM), and total body water (TBW). BCM is sometimes perceived as a more important measure of lean mass than FFM because it does not include nonliving lean mass, such as the blood plasma and bone mineral (see Fig. 4-1). Resistance to electrical flow through the body is measured, which is proportional to fat and bone mineral content because these body components have poor conductivity. Because all other components of the body are suffused with electrolyte-laden water that readily conducts an electrical current, calculations of TBW, FFM, and BCM can be made if one abides by some general assumptions that define the water content of each compartment. Those with expertise in its use have found it useful for monitoring the FFM in outpatient studies of renal dialysis and human immunodeficiency virus (HIV) patients.96,97 Acute illness, however, produces shifts in the total amount of body water and its distribution in the different compartments, rendering the technique largely worthless in the inpatient setting.98 Furthermore, the algorithms used to calculate body composition contain assumptions about body water that can change with age, obesity, and disease, so BIA must be revalidated within any population in which it is used.
Functional Measures of Protein-Calorie Status
Three different techniques have been developed that exploit the fact that skeletal muscle function is impaired in PEM: fist-grip dynamometry (FGD), adductor pollicis electrical stimulation, and respiratory muscle strength evaluation. FGD uses a hand-held dynamometer to measure the maximal fist-grip force that can be elicited. When examined as a surrogate measure of total body protein in patients awaiting gastrointestinal surgery, FGD correlated strongly with in vivo neutron activation analysis and with MAMC.99 Similarly, FGD is excellent for detecting depleted body cell mass in cirrhotic patients,100 a group in which it is notoriously difficult to perform nutritional assessment. As noted, valid indicators of moderate to severe PEM are strong predictors of clinical outcome in acutely ill patients and FGD is effective in this regard. Preoperative patients whose fist grip strength is less than 85% of age-and gender-corrected standards have a twofold increased risk of perioperative complications compared with those whose FGD is normal.101 In patients undergoing surgery for gastrointestinal cancers, FGD had superior sensitivity and specificity in predicting perioperative morbidity and mortality than a widely used discriminant analysis called the prognostic nutritional index.102 FGD holds considerable promise for the rapid and convenient assessment of protein-calorie status in inpatients and outpatients. The technique is nevertheless limited by its need for an alert and cooperative patient.
Respiratory muscle strength, typically measured with a bedside spirometer as maximal sustained inspiratory force and/or maximal sustained expiratory force, also has been used as a measure of protein-calorie status,103 but is generally considered not reliable because too many non-nutritional factors may alter its measurement.
Electrical stimulation of the ulnar nerve with measurement of various functions of the adductor pollicis muscle also has been explored as an indicator of protein-calorie status. The technique has been shown to distinguish between malnourished subjects and well-nourished controls,104 and to predict postoperative complications in patients awaiting surgery for gastrointestinal malignancies105; abnormal muscle function was observed to resolve with nutritional restitution. Use of this method in an ICU setting, however, was found to be very problematic106 because patients found it uncomfortable and neuromuscular blocking agents interfered with obtaining adequate data. Much more work is needed to establish this method’s validity and appropriate applications.
Although PEM adversely affects the physiology of almost all organ systems, the immune system is in the most sensitive; delayed hypersensitivity skin testing, which assesses the integrity of cell-mediated immunity, has been used most often in this regard. In critically ill patients, skin testing has value in predicting mortality,107 but its interpretation is fraught with confounding variables, such as older age, systemic infection, and major surgery, each of which will independently depress reactivity. Furthermore, reactivity improves in an unpredictable manner with nutritional restitution, so it is not useful for monitoring the progress of patients.108 The value of skin testing in assessing nutritional status is used best as part of an array of parameters that collectively assess nutritional status (see later, “Discriminant Analyses of Protein-Calorie Status”).
Biochemical Measures of Protein-Calorie Status
Serum Proteins
The serum concentrations of several proteins that are synthesized in the liver are used as indicators of protein-calorie status—albumin, prealbumin (transthyretin), transferrin, and retinol-binding protein (RBP; Table 4-21). A low concentration of any of these proteins strongly suggests the presence of PEM in an individual who does not have a concurrent illness or injury. Because the half-lives of prealbumin, transferrin, and RBP are considerably shorter than that of albumin, it follows that changes in nutritional status will be reflected more promptly in levels of these three than in albumin.
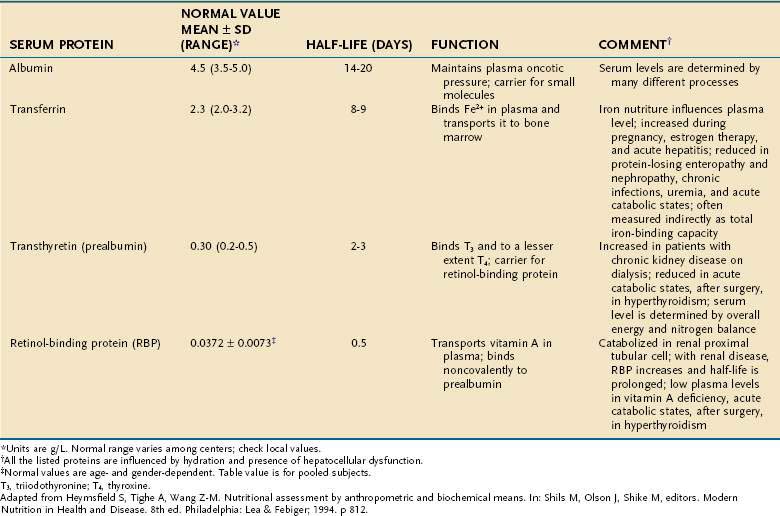
A variety of factors alter the serum concentration of each of these proteins. For example, prealbumin levels often are elevated in chronic kidney disease or by glucocorticoid or oral contraceptive administration. The degree to which serum levels of all of these proteins are decreased in cirrhosis increases incrementally with worsening grades of the Child classification, although even patients who are Child class A have a small decrease in albumin compared with healthy individuals.109
All these proteins behave as negative acute-phase reactants—that is, their serum concentrations drop in response to systemic inflammation, roughly proportional to the magnitude of the inflammatory response. This effect severely curtails their reliability as indicators of PEM in the acutely ill patient.110 Nonetheless, with proper respect for their limited accuracy, they still can be useful; for example, prealbumin has been shown to be an efficient rapid means of screening inpatients for PEM on hospital admission.111
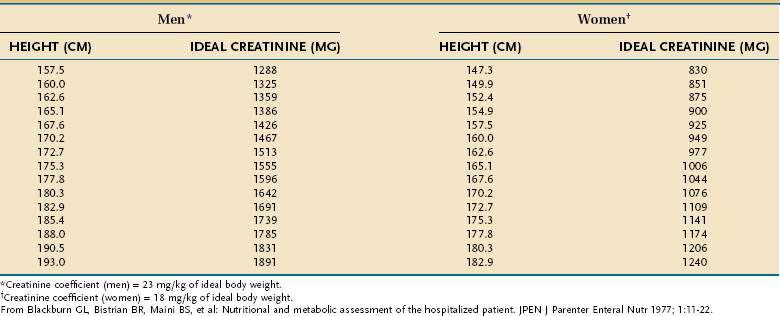
Creatinine-Height Index
The amount of creatinine excreted in the urine over a 24-hour period, corrected for the patient’s height, is an excellent means of assessing total skeletal muscle mass. The relationship holds because a relatively constant percentage (~2%) of muscle creatine is converted to creatinine each day. Values that are more than 20% below gender-and-height-adjusted normative values are indicative of moderate to severe PEM (Table 4-22). Updated normative creatine-height index (CHI) values for children aged 3 to 18 years are available.112 In sick persons, the CHI tends to correlate with simple measures such as unintentional weight loss, as well as with highly accurate measures of skeletal muscle, such as DEXA.113 However, incomplete urine collection, abnormal or unstable renal function, excessive meat or milk ingestion immediately preceding or during the collection, and glucocorticoid administration all can alter creatinine excretion independently of changes in muscle mass.
Discriminant Analyses of Protein-Calorie Status
As noted, many of the parameters used to measure PEM also can predict important clinical outcomes; each parameter, however, has its own limitations. Multifactorial indices that incorporate various combinations of these parameters have been developed through the use of discriminant analyses. By combining the strengths of several parameters, the goal is to arrive at a prognostic index that is more accurate for determining whether patients have a substantial degree of PEM and for optimizing the ability to predict which patients will have adverse clinical outcomes because of PEM, thereby identifying those who might benefit from intensive attention to their nutritional needs. Table 4-23 lists the prognostic indices that have been most widely studied, along with the outcomes that each has been shown to predict. Because many of the parameters incorporated into these indices are influenced by the severity of disease and by nutritional status, such indices are more properly thought of as assessing an integration of illness severity and the likelihood of malnutrition.
| INDEX | INCORPORATED PARAMETERS | CORRELATES WITH |
|---|---|---|
| Likelihood of malnutrition | Serum folate, serum vitamin C, serum albumin, lymphocyte count, hematocrit, triceps skinfold, arm muscle circumference, weight | Duration of hospitalization |
| Prognostic nutritional index | Serum albumin, serum transferrin, delayed hypersensitivity, triceps skinfold | Frequency of postoperative complications and mortality |
| Instant nutritional index | Serum albumin, lymphocyte count | Frequency of postoperative infection |
| Hospital prognostic index | Serum albumin, delayed hypersensitivity, presence of sepsis or cancer | Hospital mortality |
Adapted from Mason J, Rosenberg I. Protein-energy malnutrition. In: Isselbacher K, Braunwald E, Wilson J, et al, editors. Harrison’s principles of internal medicine. 13th ed. New York: McGraw-Hill; 1994. p 440.
Rapid Screening Tools for the Assessment of Targeted Populations
Subjective Global Assessment
This initially was intended for use in surgical inpatients as a means of assessing nutritional status and predicting postoperative infections; for the latter, it was found to be a better predictor than serum albumin concentration, delayed skin hypersensitivity, MAMC, CHI, and the prognostic nutritional index.114 A focused history and physical examination are used to categorize patients as well nourished (category A), having mild or moderate malnutrition (category B), or having severe malnutrition (category C; Table 4-24). In spite of the subjective nature of some of its components, there is excellent agreement in independent observers.115 The SGA has been shown to be reliable, even in the hands of first-year medical and surgical residents116 and validated as a predictor of clinical outcomes in chronically institutionalized older adults and in patients with a variety of medical conditions.117–119
Table 4-24 Subjective Global Assessment (SGA) of Nutritional Status
| History |
| Weight change |
| Loss in past 6 months: amount = __________ kg; % loss = __________ |
| Change in past 2 weeks: __________ Increase __________ No change __________ Decrease |
| Dietary intake change: |
| No change ________ Change ________ Duration = ________ weeks |
| Dietary status: |
| __________ Suboptimal solid diet |
| __________ Hypocaloric liquids |
| __________ Starvation |
| Gastrointestinal symptoms (that have persisted for >2 weeks): |
| __________ None __________ Nausea __________ Vomiting __________ Diarrhea __________ Anorexia |
| Functional capacity: |
| __________ No dysfunction __________ Dysfunction Duration = __________ Weeks |
| Type: |
| __________ Working suboptimally |
| __________ Ambulatory but not working |
| __________ Bedridden |
| Effect of disease on nutritional requirements: |
| Primary diagnosis: __________ |
| Metabolic demand: ________ Low stress ________ Moderate stress __________ High stress |
| Physical Examination (Normal, Moderate, or Severe) |
| __________ Loss of subcutaneous fat (triceps, chest) |
| __________ Muscle wasting (quadriceps, deltoids) |
| __________ Ankle or sacral edema |
| __________ Ascites |
| SGA Rating* |
| A = Well nourished |
| B = Mild or moderate malnutrition |
| C = Severe malnutrition |
* The ranks of A, B, and C in the SGA are assigned on the basis of subjective weighting. A patient with weight loss and muscle wasting who is currently eating well and gaining weight is classified as well nourished. A patient with moderate weight loss (between 5% and 10%), continued compromise in food intake, continued weight loss, progressive functional impairment, and moderate stress because of illness is classified as moderately malnourished. A patient with severe weight loss (>10%), poor nutrient intake, progressive functional impairment, and muscle wasting usually is classified as having severe malnutrition.
Mini-Nutritional Assessment
This was developed as a rapidly administered screen to detect PEM in geriatric populations. A combination of history, brief physical examination, and simple anthropometrics (BMI, arm and calf circumference) can be obtained in a few minutes. Subjects receive a score that classifies them as being nourished, malnourished, or at risk of malnutrition. The MNA is a valid means of detecting PEM in older adults who are generally healthy and ambulatory as well as those who are frail and institutionalized120,121; in the chronically institutionalized, it possesses considerable predictive value in projecting future morbidity.122 One disadvantage of the MNA is that it does not screen for overweight or obesity. Other screening tools designed for geriatric populations, such as the Nutrition Screening Initiative, have the ability to screen for under- and overnutrition but have not been as extensively validated as the MNA.123
AGGRESSIVE NUTRITIONAL SUPPORT IN THE HOSPITALIZED PATIENT
Catabolic forces that accompany acute illness make it difficult to correct nutritional deficits. In those with a high degree of sustained metabolic stress, nutritional support generally will not lead to an increase in the protein compartment of the body. Moreover, a gain in weight may not occur and, when it does, much of the initial gain is from water and an expanded fat mass.124 Despite these limitations, however, even in the absence of weight gain or increases in serum protein levels, a course of nutritional support for an appropriate patient can improve physiologic functions and clinical outcome.125
MALNOURISHED PATIENTS UNDERGOING MAJOR SURGERY
Nutritional support can be beneficial for moderately to severely malnourished patients who are scheduled to undergo major surgery. Aggressive nutritional support for seven or more days before surgery reduces perioperative complications, and sometimes mortality, in malnourished patients.66–73,126–128 In the VA Cooperative Trial,66 which encompassed almost 500 subjects about to undergo major abdominal or thoracic surgery, patients who were categorized as severely malnourished and randomized to receive preoperative TPN realized an almost 90% decrease in noninfectious perioperative complications. No benefits were observed in mildly malnourished or well-nourished individuals. In trials of moderately to severely malnourished patients, preoperative nutrition support generally conveys sizeable benefits: one trial that enrolled 90 patients with gastric or colorectal cancers undergoing surgery demonstrated a 35% decline in overall complications and a significant reduction in mortality.128 The observation that the benefits of preoperative nutritional support are confined to those with a substantial degree of malnutrition is the same conclusion reached by meta-analyses.71,72 Deferring aggressive nutritional support until after surgery does not appear to have the same ability to diminish perioperative complications. 129
Provision of nutrients via an enteral approach also is beneficial. There have been fewer trials done of preoperative enteral support than of preoperative TPN, but it appears that preoperative enteral support conveys the same nutritional130 and clinical131 benefits as TPN. As with TPN, postoperative enteral nutrition in the absence of aggressive preoperative support is less likely to convey benefit to the patient.132
PATIENTS HOSPITALIZED WITH DECOMPENSATED ALCOHOLIC LIVER DISEASE
The prevalence of moderate to severe PEM is so high in patients admitted for acute alcoholic hepatitis and other forms of decompensated alcoholic liver disease65 that it is best to assume that all such patients are malnourished. Furthermore, patients with acute alcoholic hepatitis usually fall far short of their nutritional needs when allowed to eat freely. Clinical trials have demonstrated that the rates of morbidity, mortality, and the speed of recovery are improved with prompt institution of enteral or parenteral nutrition in these patients.67–69133
PATIENTS UNDERGOING RADIATION THERAPY
The usefulness of aggressive nutrition support in patients undergoing radiation therapy has been studied most extensively in those who have head and neck and esophageal cancers. There is now reasonable evidence in these patients that placement of a percutaneous endoscopic gastrostomy (PEG) tube and administration of supplemental tube feedings during and after the course of radiation therapy prevents further deterioration of nutritional status.134,135 In patients with head and neck cancers, supplemental PEG feedings also have been shown to improve quality of life (QOL). Although improvements in survival or decreased morbidity have not yet been demonstrated, the improved QOL alone may warrant its use in this setting.
REFEEDING SYNDROME
Injudicious and overly aggressive nutritional therapy can have adverse clinical consequences, known as the refeeding syndrome, in those who have suffered sustained inadequacy in food intake.136,137 Early evidence of the refeeding syndrome was reported at the end of World War II, when it was found that refeeding chronically semistarved war victims and research volunteers caused cardiac insufficiency and neurologic complications. More recently, refeeding abnormalities and serious complications have been reported after aggressive refeeding of hospitalized cachectic patients.138 The likelihood that a refeeding syndrome will occur depends on the severity of underlying PEM and the rapidity with which nutritional restitution is undertaken. Thus, the syndrome usually can be avoided merely by approaching nutritional repletion in an incremental fashion over the first several days of nutritional therapy and careful monitoring for potential complications, with interventions as indicated.
MINERAL DEPLETION
Of the mineral abnormalities associated with refeeding, phosphate depletion has received the most attention. Refeeding with enteral carbohydrates or glucose-based parenteral formulas stimulates insulin release and intracellular uptake of phosphate.139 This phenomenon can cause the extracellular phosphorus concentration to fall below 1 mg/dL within hours of initiating nutritional therapy if adequate phosphate is not given. Severe hypophosphatemia, accompanied by muscle weakness, paresthesias, seizures, coma, cardiopulmonary decompensation, and death, has occurred in patients receiving enteral or parenteral nutritional repletion.138,140
Potassium and magnesium are the most abundant intracellular cations. Loss of body cell mass in the malnourished patient causes whole-body potassium and magnesium depletion. However, serum concentrations of these two electrolytes remain normal or near-normal during starvation because of their release from tissue and bone stores. The increases in protein synthesis rates, body cell mass, and glycogen stores during refeeding require increased intracellular potassium and magnesium. In addition, hyperinsulinemia during refeeding increases the cellular uptake of potassium and can cause a rapid decline in its intravascular concentration.141
CARDIOVASCULAR COMPLICATIONS
Chronic undernutrition is associated with decreased cardiac mass, stroke volume, and end-diastolic volume, bradycardia, and fragmentation of cardiac myofibrils.142–145 In addition, carbohydrate refeeding increases the concentration of circulating insulin, which enhances sodium and water reabsorption by the renal tubule.146 Moreover, if hypophosphatemia develops, it can impair oxygen unloading from red blood cells and increase susceptibility to ventricular tachyarrhythmias. A serum phosphate concentration less than 2.0 mg/dL further impedes myocardial performance. These factors put the severely malnourished patient at increased risk of fluid retention and congestive heart failure after nutritional therapy, and may precipitate cardiovascular collapse. The cardiovascular complications of thiamine deficiency (wet beriberi) also have been reported to contribute to cardiovascular compromise in the refeeding syndrome.147 Because thiamine is an essential cofactor for several enzymes in carbohydrate metabolism, it is believed that overzealous administration of carbohydrate to a severely malnourished patient with limited thiamine availability may precipitate an acute thiamine deficiency state. The high concentrations of glucose in TPN seem particularly likely to produce this effect. Ventricular tachyarrhythmias, which can be fatal, occur during the first week of refeeding,148 and may be preceded by prolongation of the QT interval.
GLUCOSE INTOLERANCE
The adaptive changes during starvation enhance the use of FAs and ketone bodies for fuel while glucose is conserved. In addition, the ability of insulin to stimulate glucose uptake and oxidation by peripheral tissues is impaired.141 Thus, refeeding with high-carbohydrate meals or large amounts of parenteral glucose may not be well tolerated initially and may produce marked elevations in the blood glucose level, glucosuria, dehydration, and hyperosmolar coma.149
GASTROINTESTINAL DYSFUNCTION
As noted, starvation and malnutrition cause structural and functional deterioration of the gastrointestinal tract, thereby limiting digestion and absorption.150,151 When malnutrition is severe, oral refeeding has been associated with an increased incidence of diarrhea and death; most of the adverse gastrointestinal consequences of starvation resolve after one to two weeks of refeeding.
MANAGEMENT OF SEVERE MALABSORPTION: A NUTRITIONAL PERSPECTIVE
The medical management of patients with severe malabsorption, such as that which often occurs in short bowel syndrome or pancreatic insufficiency, can be challenging and frustrating. In many cases, the patient and clinician must be prepared to accept incremental improvements as the management goal rather than complete resolution of symptoms. Great strides and an improved QOL, however, often can be accomplished with only modest improvements in absorptive physiology. Malabsorption syndromes and short bowel syndrome are discussed in greater detail in Chapters 101 and 103, respectively.
CLINICAL CONSIDERATIONS
A careful review of medical records, operative reports, and radiologic studies is needed to evaluate the absorptive capacity of the intestine by determining the length and status of the remaining intestine, the site of intestinal disease or resection, and the presence of other conditions that reduce intestinal absorption. An assessment of fluid losses through diarrhea, ostomy output, and fistula volume should be made to help determine fluid requirements. Knowledge of fluid losses also is used to calculate intestinal mineral losses by multiplying fluid loss by the estimated electrolyte concentration in intestinal fluid (Table 4-25). In patients who do not respond to treatment as predicted, dynamic studies of intestinal absorptive function may be helpful for adjusting the treatment program. Such studies may include measuring fat, carbohydrate, or nitrogen balance and evaluating ostomy, fecal, or fistula mineral and fluid losses.
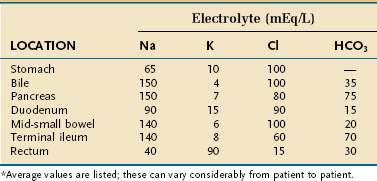
Bone mineral densitometry may be useful to establish a baseline and to screen for unrecognized bone mineral depletion. Metabolic bone disease is common in chronic malabsorptive disorders, particularly so in individuals on long-term TPN.152
TREATMENT
Control of Diarrhea
Normally, the stomach produces approximately 2.5 L of fluid/day, which is absorbed by the small intestine and colon. Gastric secretion therefore may contribute to diarrhea if there is inadequate absorptive capacity or if there is an excess amount of gastric secretion, such as with Zollinger-Ellison syndrome. Immediately following extensive resection of distal bowel, a gastric hypersecretory state occurs, probably from loss of inhibitory peptides such as glucagon-like peptide-2 (GLP-2) and peptide YY153,154; recovery from this hypersecretory state occurs over a period of months. Histamine (H2) receptor antagonists or proton pump inhibitors are used to reduce gastric secretions, and the presence of acidic jejunostomy or ileostomy contents after meals is a clear indication for acid reduction therapy.155 Large doses, twice the normal amount used for the treatment of peptic ulcer disease or gastroesophageal reflux, may be required for adequate control in some patients because of reduced drug absorption.
The somatostatin analog, octreotide acetate (Sandostatin), can decrease small intestine secretions. Therapy with octreotide has been shown to decrease ostomy or stool volume, decrease sodium and chloride output, and prolong small intestine transit time in patients with short bowel syndrome.156,157 Octreotide therapy, however, usually does not improve absorption of macronutrients and other minerals; in fact, it may exacerbate the degree of fat malabsorption,158–160 presumably by inhibiting pancreatic secretions. In addition, octreotide is expensive, must be given by subcutaneous injection, can decrease appetite and increase the risk of gallstones,161 and diminishes protein synthesis in the intestinal epithelium and exocrine pancreas.162 Nevertheless, in patients who have persistent large-volume intestinal output despite standard antidiarrheal therapy, a trial of 100 µg of octreotide injected subcutaneously three times daily with meals may be useful. A long-acting form of octreotide, which only requires monthly administration, has not been studied as thoroughly but has been effective in controlling diarrhea in some settings.163
Foods and medications that cause diarrhea should be avoided. Traditionally, the recommendation has been to decrease or eliminate lactose-containing foods because of the reduction in intestinal lactase with intestinal resection. Patients with jejunostomies and 15 to 150 cm of jejunum remaining, however, can tolerate 20-g lactose loads as milk or yogurt.164 Foods that have laxative effects, such as caffeine-containing drinks and diet products containing osmotically active sweeteners (e.g., sorbitol, xylitol, mannitol), should be avoided. Medications that contain magnesium or sorbitol also can contribute to diarrhea.165 In individuals with short bowel syndrome and uncontrolled diarrhea, soft drinks and fruit juices should be diluted 1 : 1 with water to reduce their high osmotic load.
Enteral Feeding
The goal of feeding is to provide the patient with all recommended nutritional requirements. The amount of ingested nutrients needed to reach this goal depends on the normal RDAs, modified by an estimate of absorptive function and intestinal losses; this usually requires ingestion of large amounts of fluid, calories, protein, vitamins, and minerals. Even in patients with severe short bowel syndrome, TPN may not be needed when vitamin and mineral supplements and large amounts of calories and protein are provided enterally.166 Increasing the time that food is in contact with the intestine may enhance absorption in patients with limited absorptive function. For this reason, total dietary intake should be divided into at least six small meals daily. If this is unsuccessful, defined liquid formulas ingested between meals or administered by continuous tube feedings at night may preclude the need for TPN. Patients with severe malabsorption often must ingest 40 to 60 kcal/kg/day and 1.2 to 1.5 g of protein/kg/day to avoid malnutrition, but this is highly variable. A more practical goal might be to consume however much is necessary to sustain a stable and reasonable weight while avoiding dehydration, electrolyte disorders, and any micronutrient deficiencies. The macro- and micronutrient needs of each patient often are arrived at only by experimentation with different regimens.
Fat Intake
Fat intake need not be restricted in patients whose colon is not in continuity with the food stream, despite the presence of steatorrhea. Although food preferences and tolerances differ from patient to patient, a high-fat, low-carbohydrate diet is comparable to a low-fat, high-carbohydrate diet with regard to total fluid, energy, nitrogen, sodium, potassium, and divalent ion absorption in patients with short bowel syndrome whose colon is not in continuity.167–169 By retaining fat in the diet, the patient’s ability to achieve caloric goals will be enhanced because of the high caloric density of fat. In contrast, in those who have steatorrhea and a colon in continuity with the food stream, unabsorbed fatty acids are potent stimuli to colonic ion and fluid secretion, and limiting fat intake usually diminishes gastrointestinal symptoms, colonic water secretion, hyperoxaluria, and divalent cation losses.170,171 Patients who have only a portion of the colon in continuity with the food stream behave in a variable manner in this regard.
Medium-chain triglycerides (MCTs) can be very useful as a feeding supplement in patients who have impaired fat absorption, because MCTs are hydrolyzed rapidly and do not require bile salts and micelle formation for absorption. The efficacy of MCTs, however, usually is confined to patients whose colon is in continuity with the food stream, apparently because the colon is a site for MCT absorption.172 In contrast, there is usually little improvement in overall energy absorption in patients with jejunostomies or ileostomies. Many patients do not find pure MCT oil to be palatable (used as a salad oil or as a spread on toast), and it also may cause nausea, vomiting, or abdominal discomfort. Unfortunately, liquid nutritional supplements designed for oral intake that contain most of their fat calories as MCT have been discontinued because of low demand. A homemade substitute nevertheless can be readily produced by mixing a package of Carnation Instant Breakfast, 8 ounces of cold skim milk, and 2 teaspoons of MCT in an electric blender for a few seconds.
Predigested Liquid Nutritional Supplements
Predigested formulas—monomeric (also called elemental; e.g., Vivonex T.E.N.) and oligomeric (also called semielemental; e.g., Peptamen, Reabilan)—claim benefit for patients with short bowel syndrome. Theoretically, these formulas, which contain nitrogen in the form of free amino acids or small peptides, are absorbed more efficiently than polymeric formulas or whole food. However, when subjected to clinical trials, they have shown no benefit169 or a marginal increase in nitrogen absorption.173 At present, there is insufficient clinical evidence to justify the routine use of expensive predigested formulas in patients with short bowel syndrome.
Oral Rehydration Therapy
In many patients with severe malabsorption, maintenance of fluid and electrolyte homeostasis constitutes a major problem. These patients may benefit from oral rehydration therapy (ORT), taking advantage of the sodium-glucose cotransporter in the intestinal brush border.174 Frequent ingestion of small-volume feedings of an isotonic glucose or starch-based electrolyte solution stimulates active sodium transport across the intestine, and water follows passively by solvent drag. Intestinal perfusion studies and clinical trials have indicated that sodium and water absorption are maximal from solutions containing 60 to 75 mmol/L of sodium with equimolar concentrations of glucose; this concentration is somewhat lower than what had been suggested in the past.175,176 Nevertheless, many commercially available oral rehydration formulas and sport drinks contain far lower sodium concentrations than what is necessary to optimize water and electrolyte absorption, and should be avoided by patients with short bowel syndrome. Instead, inexpensive and more effective solutions can be made by patients at home (Table 4-26). Daily oral administration of 1 to 2 L of rehydration solutions has been successful in correcting fluid and electrolyte abnormalities and allows intravenous supplementation to be discontinued in patients who have had extensive intestinal resection.177
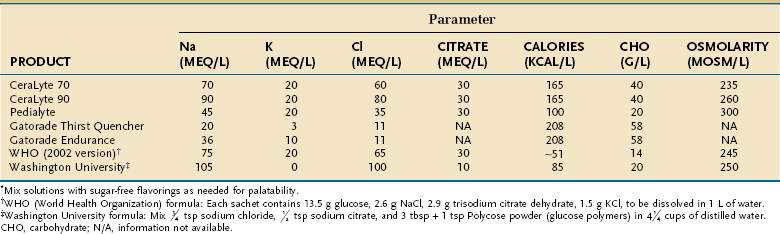
Major Minerals
Calcium and magnesium bind to unabsorbed FAs and may be lost in large quantities in patients with chronic steatorrhea, thus contributing to the frequent occurrence of metabolic bone disease in these individuals. The amount of calcium lost is proportional to the degree of steatorrhea. Magnesium is an integral component of bone mineral and is necessary for the release of parathyroid hormone (PTH) and for its actions on target organs.178,179 Hypocalcemia refractory to aggressive calcium replacement can be caused by chronic hypomagnesemia. Like calcium, total body magnesium status is not well reflected in serum levels of the cation. Consequently, the percentage of magnesium excreted in urine after intravenous infusion may be the best index of body magnesium stores in patients with short bowel syndrome; excretion of less than 80% of infused magnesium suggests whole-body magnesium depletion.180
Maintaining magnesium homeostasis often is difficult because magnesium is poorly absorbed and enteral supplementation with magnesium salts increases diarrhea. Enteric-coated magnesium supplements are not used in the setting of intestinal malabsorption because their delayed release reduces contact with the intestine for absorption.181 Soluble magnesium salts, such as magnesium gluconate, are tolerated and absorbed better than other magnesium complexes. In some patients, magnesium is best given in liquid form as magnesium gluconate (Fleming, St. Louis) and can be added to an oral rehydration solution in doses of 18 to 27 mmol (432 to 648 mg of elemental magnesium) daily. This solution should be sipped, not ingested as a bolus, to maximize absorption and avoid diarrhea.
Trace Minerals
With the exceptions of zinc and iron, absorption of trace minerals from ingested foods or liquid formulas often is adequate to prevent overt deficiency syndromes. In patients with malabsorption, zinc deficiency is common and often subclinical. Large dosages of oral zinc supplements may become necessary, because zinc losses are often high and zinc absorption is low. Zinc gluconate is tolerated well and is less likely than zinc sulfate to cause gastric distress. Zinc should not be given with meals because absorption is reduced by several foods, in particular those high in phytates.182 Daily zinc supplementation of 25 mg plus an additional 100 mg/L (or 100 mg/kg) of ostomy or diarrheal output is necessary to maintain zinc homeostasis.25 Thus, many patients require approximately 150 mg of elemental zinc daily. Although zinc ingestion reduces copper absorption and can cause clinically significant copper deficiency,183 additional copper intake usually is not needed.
Treating iron deficiency with oral preparations can be difficult. A liquid form of ferrous sulfate (300 mg/5 mL containing 60 mg of elemental iron) mixed in orange juice four times daily has been found to be efficacious. Diluting ferrous sulfate liquid prevents staining of teeth, and the ascorbic acid present in orange juice enhances iron absorption. Some patients, however, require intermittent administration of parenteral iron, which should be administered in the form of iron sucrose because it is far less likely to produce an anaphylactoid reaction compared with iron dextran.184
Vitamins
Patients with fat malabsorption usually can absorb adequate amounts of most water-soluble vitamins from their diet, but have difficulty absorbing fat-soluble vitamins. Vitamin K deficiency rarely is a clinical problem unless patients are receiving antibiotics because colonic bacteria synthesize usable forms of vitamin K (vitamin K2; multiprenyl menaquinones). Large doses of vitamins A, D, and E may be required, however, to maintain normal concentrations of these vitamins. If provision of more than 5 to 10 times the basal requirement of a fat-soluble vitamin still is not effective, it is worthwhile using the more expensive polar forms of fat-soluble vitamins (see discussion earlier, in “Micronutrients” section). Testing blood levels of these vitamins should be used to determine whether repletion has been achieved.
Parenteral Feeding
Some general guidelines are useful in deciding which patients require parenteral therapy. Although a postduodenal intestinal remnant of less than 100 cm, or the lack of an ileocecal valve or a colonic segment in continuity, are each associated with a much greater likelihood of permanent dependence on parenteral support,185 exceptions abound. Adults in whom urine output is less than 1 L/day are at increased risk for developing renal dysfunction and should receive intravenous fluids. Adequate levels of fat-soluble vitamins and certain minerals (e.g., magnesium, potassium, and zinc) are difficult to maintain with oral feedings in patients with severe steatorrhea or large intestinal fluid output, and they may require parenteral supplementation. Magnesium sulfate can be injected intramuscularly at a dose of 12 mmol (290 mg of elemental magnesium) one to three times/week if attempts at oral therapy are unsuccessful. Intravenous infusion of magnesium is preferred, however, because intramuscular injections are painful and can cause sterile abscesses. In some patients, TPN may be life-saving or may be needed to limit diarrhea and achieve an acceptable QOL.
Nutritional Rehabilitation of the Short Bowel
Whether administration of growth hormone (or, more recently, GLP-2) to patients with short bowel syndrome will enhance the absorption of macronutrients and electrolytes continues to be a matter of controversy,186,187 but pharmacologic management is not the focus of this chapter (see Chapter 103). More relevant to this discussion is that some of these studies have included oral glutamine (at a dosage of approximately 30 g/day) as part of the growth hormone regimen, the rationale being that glutamine is a preferred fuel substrate of the enterocyte. There is, however, no controlled evidence that oral glutamine contributes to recovery of absorptive function.186–189
Duggan C, Fontaine O, Pierce N, et al. Scientific rationale for a change in the composition of oral rehydration solution. JAMA. 2004;291:2628-31. (Ref 176.)
Hamilton C, Seidner DL. Metabolic bone disease and parenteral nutrition. Curr Gastroenterol Rep. 2004;6:335-41. (Ref 152.)
Heyland D, MacDonald S, Keefe L, et al. TPN in the critically ill patient: A meta-analysis. JAMA. 1998;16:2013-19. (Ref 72.)
Hill G. Body composition research: implications for the practice of clinical nutrition. JPEN J Parenter Enteral Nutr. 1992;16:197-218. (Ref 54.)
Hoffer LJ. Metabolic consequences of starvation. In: Shils M, Shike M, Ross AC, et al, editors. Modern nutrition in health and disease. 10th ed. Baltimore: Lippincott Williams & Wilkins; 2006:730. (Ref 44.)
Klein S. The myth of serum albumin as a measure of nutritional status. Gastroenterology. 1990;99:1845-6. (Ref 110.)
Mason JB, Roubenoff R. The unbearable lightness of being … a cirrhotic. Gastroenterology. 1993;105:1911-14. (Ref 133.)
Prijatmoko D, Strauss B, Lambert J, et al. Early detection of protein depletion in alcoholic cirrhosis: role of body composition analysis. Gastroenterology. 1993;105:1839-45. (Ref 65.)
Stanga Z, Brunner A, Leuenberger M, et al. Nutrition in clinical practice—the refeeding syndrome: Illustrative cases and guidelines for prevention and treatment. Eur J Clin Nutr. 2008;62:687-94. (Ref 136.)
van den Berghe G, Wilmer A, Hermans G, et al. Intensive insulin therapy in the medical ICU. N Engl J Med. 2006;354:449-61. (Ref 8.)
van den Berghe G, Wouters P, Weekers F, et al. Intensive insulin therapy in the critically ill patients. N Engl J Med. 2001;345:1359-67. (Ref 7.)
Wiener R, Wiener D, Larson R. Benefits and risks of tight glucose control in critically ill adults: A meta-analysis. JAMA. 2008;300:933-44. (Ref 11.)
Wischmeyer PE. Glutamine: Role in critical illness and ongoing clinical trials. Curr Opinion Gastroenterol. 2008;24:190-7. (Ref 12.)
Wolfe RR. Regulation of skeletal muscle protein metabolism in catabolic states. Curr Opin Clin Nutr Metab Care. 2005;8:61-5. (Ref 51.)
Wolman SL, Anderson GH, Marliss EB, Jeejeebhoy KN. Zinc in total parenteral nutrition: requirements and metabolic effects. Gastroenterology. 1979;76:458-67. (Ref 25.)
1. Harris JA, Benedict FG. Standard basal metabolism constants for physiologists and clinicians. In: A biometric study of basal metabolism in man. Publication No. 279. Carnegie Institute of Washington. Philadelphia: JB Lippincott; 1919:223.
2. WHO (World Health Organization). Energy and protein requirements. Report of a joint FAO/WHO/UNU expert consultation. Technical Report Series No. 724. Geneva: World Health Organization; 1985.
3. Owen OE, Kavle E, Owen RS, et al. A reappraisal of caloric requirements in healthy women. Am J Clin Nutr. 1986;44:1-5.
4. Ireton-Jones CS, Borman KR, Turner WW. Nutrition considerations in the management of ventilator-dependent patients. Nutr Clin Pract. 1993;8:60-4.
5. Long CL, Schaffel N, Geiger JW, et al. Metabolic response to injury and illness: estimation of energy and protein needs from indirect calorimetry and nitrogen balance. JPEN J Parenter Enteral Nutr. 1979;3:452-6.
6. Klein S. Nutritional therapy. In: Ahya S, Flood K, Paranjothi S, editors. The Washington manual of medical therapeutics. 30th ed. Philadelphia: Lippincott Williams & Wilkins; 2000:27.
7. van den Berghe G, Wouters P, Weekers F, et al. Intensive insulin therapy in the critically ill patients. N Engl J Med. 2001;345:1359-67.
8. van den Berghe G, Wilmer A, Hermans G, et al. Intensive insulin therapy in the medical ICU. N Engl J Med. 2006;354:449-61.
9. Kwoun M, Ling PR, Lydon E, et al. Immunologic effects of acute hyperglycemia in nondiabetic rats. JPEN J Parenter Enteral Nutr. 1997;21:91-5.
10. De La Rosa G, Donado J, Restrepo A, et al. Strict glycaemic control in patient hospitalized in a mixed medical and surgical intensive care unit: A randomized clinical trial. Crit Care. 2008;12:R120-9.
11. Wiener R, Wiener D, Larson R. Benefits and risks of tight glucose control in critically ill adults: A meta-analysis. JAMA. 2008;300:933-44.
12. Wischmeyer PE. Glutamine: Role in critical illness and ongoing clinical trials. Curr Opin Gastroenterol. 2008;24:190-7.
13. Rudman D, Kutner M, Ansley J, et al. Hypotyrosinemia, hypocystinemia, and failure to retain nitrogen during total parenteral nutrition of cirrhotic patients. Gastroenterology. 1981;81:1025-35.
14. Anderson GH, Patel DG, Jeejeebhoy KN. Design and evaluation by nitrogen balance and blood aminog of an amino acid mixture for total parenteral nutrition of adults with gastrointestinal disease. J Clin Invest. 1974;53:904-12.
15. Greenhaff P, Karagounis L, Peirce N, et al. Disassociation between the effects of amino acids and insulin on signaling, ubiquitin ligases, and protein turnover in human muscle. Am J Physiol Endocrinol Metab. 2008;295:E595-604.
16. Biolo G, Fleming RYD, Wolfe RR. Physiologic hyperinsulinemia stimulates protein synthesis and enhances transport of selected amino acids in human skeletal muscle. J Clin Invest. 1995;95:811-19.
17. DeFronzo RA, Ferrannini E. Regulation of hepatic glucose metabolism in humans. Diabetes Metab Rev. 1987;3:415-59.
18. Baker J, Detsky A, Stewart S, et al. Randomized trial of TPN in critically ill patients: Metabolic effects of varying glucose-lipid ratios as the energy source. Gastroenterology. 1984;87:53-9.
19. Bartlett K, Eaton S. Mitochondrial beta-oxidation. Eur J Biochem. 2004;271:462-9.
20. Ames BN. Delaying the mitochondrial decay of aging. Ann N Y Acad Sci. 2004;1019:406-11.
21. Reda E, D’Iddio S, Nicolai R, et al. The carnitine system and body composition. Acta Diabetol. 2003;40(Suppl 1):S106-13.
22. Jeppesen P, Hoy C-E, Mortensen P. Essential fatty acid deficiency in patients receiving home parenteral nutrition. Am J Clin Nutr. 1998;68:126-33.
23. Jeppesen P, Christensen M, Hoy C, et al. Essential fatty acid deficiency in patients with severe fat malabsorption. Am J Clin Nutr. 1997;65:837-43.
24. Wene JD, Connor WE, DenBesten L. The development of essential fatty acid deficiency in healthy men fed fat-free diets intravenously and orally. J Clin Invest. 1975;56:127-34.
25. Wolman SL, Anderson GH, Marliss EB, Jeejeebhoy KN. Zinc in total parenteral nutrition: Requirements and metabolic effects. Gastroenterology. 1979;76:458-7.
26. McMillan D, Sattar N, Talwar D, et al. Changes in micronutrient concentrations following anti-inflammatory treatment in patients with gastrointestinal cancer. Nutrition. 2000;16:425-8.
27. Schroeder J, Cousins R. IL-6 regulates metallothionein gene expression and zinc metabolism in hepatocyte monolayer cultures. Proc Natl Acad Sci U S A. 1990;87:3137-41.
28. Dickerson R. Manganese intoxication and parenteral nutrition. Nutrition. 2001;17:689-93.
29. Baik HW, Russell RM. Vitamin B12 deficiency in the elderly. Annu Rev Nutr. 1999;19:357-77.
30. Stabler SP. Vitamin B12 deficiency in older people: Improving diagnosis and preventing disability. J Am Geriatr Soc. 1998;46:1317-19.
31. Russell RM, Rasmussen H, Lichtenstein AH. Modified Food Guide Pyramid for people over seventy years of age. J Nutr. 1999;129:751-3.
32. Sokol RJ. Fat-soluble vitamins and their importance in patients with cholestatic liver diseases. Gastroenterol Clin North Am. 1994;23:673-705.
33. Kaplan M, Elta G, Furie B, et al. Fat-soluble vitamin nutriture in primary biliary cirrhosis. Gastroenterology. 1988;95:787-92.
34. Sokol R, Kim Y, Hoofnagle J, et al. Intestinal malabsorption of vitamin E in PBC. Gastroenterology. 1989;96:479-86.
35. Sokol RJ, Butler-Simon N, Conner C, et al. Multicenter trial of d-alpha-tocopheryl polyethylene glycol 1000 succinate for treatment of vitamin E deficiency in children with chronic cholestasis. Gastroenterology. 1993;104:1727-35.
36. Saltzman J, Kemp J, Golner B, et al. Effect of hypochlorhydria due to omeprazole treatment or atrophic gastritis on vitamin B12 absorption. J Am Coll Nutr. 1994;13:584-91.
37. Force A, Nahata M. Effect of histamine H2-receptor antagonists on vitamin B12 absorption. Ann Pharmacother. 1992;26:1283-6.
38. Chan L. Drug-nutrient interactions. In: Shils M, Shike M, Ross AC, et al, editors. Modern nutrition in health and disease. 10th ed. Baltimore: Lippincott, Williams & Wilkins; 2006:1539.
39. Romijn JA, Endert E, Sauerwein HP. Glucose and fat metabolism during short-term starvation in cirrhosis. Gastroenterology. 1991;100:731-7.
40. Aoki TT. Metabolic adaptations to starvation, semistarvation, and carbohydrate restriction. In: Selvey N, White PL, editors. Nutrition in the 1980s: Constraints on our knowledge. New York: Alan R. Liss; 1981:161.
41. Klein S, Peters EJ, Holland OB, Wolfe RR. Effect of short- and long-term beta-adrenergic blockade on lipolysis during fasting in humans. Am J Physiol. 1989;257:E65-73.
42. Klein S, Holland OB, Wolfe RR. Importances of blood glucose concentration in regulating lipolysis during fasting in humans. Am J Physiol. 1990;258:E32-9.
43. Owen OE, Morgan AP, Kemp HG, et al. Brain metabolism during fasting. J Clin Invest. 1967;46:1589-95.
44. Hoffer LJ. Metabolic consequences of starvation. In: Shils M, Shike M, Ross AC, et al, editors. Modern nutrition in health and disease. 10th ed. Baltimore: Lippincott: Williams & Wilkins; 2006:730.
45. Horowitz JF, Coppack SC, Paramore D, et al. Effect of short-term fasting on lipid kinetics in lean and obese women. Am J Physiol. 1999;276:E278-84.
46. Horowitz JF, Coppack SW, Klein S. Whole body and adipose tissue glucose metabolism in response to short-term fasting in lean and obese women. Am J Clin Nutr. 2001;73:517-21.
47. Elia M, Stubbs RJ, Henry CJK. Differences in fat, carbohydrate, and protein metabolism between lean and obese subjects undergoing total starvation. Obes Res. 1999;7:597-604.
48. Montemurro DG, Stevenson JAF. Survival and body composition of normal and hypothalamic obese rats in acute starvation. Am J Physiol. 1960;198:757-61.
49. Leiter LA, Marliss EB. Survival during fasting may depend on fat as well as protein stores. JAMA. 1982;248:2306-7.
50. Henry CJ. Body mass index and the limits of human survival. Eur J Clin Nutr. 1990;44:329-35.
51. Wolfe RR. Regulation of skeletal muscle protein metabolism in catabolic states. Curr Opin Clin Nutr Metab Care. 2005;8:61-5.
52. Wolfe RR. Herman Award Lecture, 1996: Relation of metabolic studies to clinical nutrition—the example of burn injury. Am J Clin Nutr. 1996;64:800-8.
53. Wilmore DW. Catabolic illness. Strategies for enhancing recovery. N Engl J Med. 1991;325:695-702.
54. Hill G. Body composition research: Implications for the practice of clinical nutrition. JPEN J Parenter Enteral Nutr. 1992;16:197-218.
55. Wolfe R. Effects of insulin on muscle tissue. Curr Opin Clin Nutr Metab Care. 2000;1:67-71.
56. Taylor BE, Buchman TG. Is there a role for growth hormone therapy in refractory critical illness? Curr Opin Crit Care. 2008;14:438-44.
57. Carbonnel F, Messing B, Rimbert A, et al. Energy and protein metabolism during recovery from malnutrition due to non-neoplastic gastrointestinal disease. Am J Clin Nutr. 1997;65:1517-23.
58. Roubenoff R, Grinspoon S, Skolnik P, et al. Role of cytokines and testosterone in regulating lean body mass and resting energy expenditure in HIV-infected men. Am J Physiol Endocrinol Metab. 2002;283:E138-45.
59. Nguyen L, Bedu M, Caillaud D, et al. Increased REE is related to plama TNF-alfa concentration in COPD patients. Clin Nutr. 1999;18:269-74.
60. Roubenoff R, Grinspoon S, Skolnik P, et al. Rheumatoid cachexia: Cytokine-driven hypermetabolism and loss of lean body mass in chronic inflammation. J Clin Invest. 1994;93:2379-86.
61. Tisdale M. Tumor-host interactions. J Cell Biochem. 2004;93:871-7.
62. Waterlow JC. Protein-energy malnutrition. London: Edward Arnold; 1992.
63. Golden MHN. Severe malnutrition. In: Weatherall DJ, Ledington WGJ, Warrell DA, editors. Oxford textbook of medicine. 3d ed. New York: Oxford University Press; 1996:1278.
64. Buchman A, Moukarzel A, Bhuta S, et al. Parenteral nutrition is associated with intestinal morphologic and functional atrophy in humans. JPEN J Parenter Enteral Nutr. 1995;19:453-60.
65. Prijatmoko D, Strauss B, Lambert J, et al. Early detection of protein depletion in alcoholic cirrhosis: Role of body composition analysis. Gastroenterology. 1993;105:1839-45.
66. Perioperative TPN in surgical patients. N Engl J Med. 1991;325:525-2.
67. Mendenhall C, Bongiovanni G, Goldberg S, et al. VA cooperative study on alcoholic hepatitis III. JPEN J Parenter Enteral Nutr. 1985;9:590-6.
68. Cabre E, Gonzaliz-Huix F, Abad-Lacruz A, et al. Effect of total enteral nutrition on the short-term outcome of severely malnourished cirrhotics. Gastroenterology. 1990;98:715-20.
69. Kearns P, Young H, Garcia G. Accelerated improvement of alcoholic liver disease with enteral nutrition. Gastroenterology. 1992;102:200-5.
70. Delmi M, Rapin C, Bengoa J, et al. Dietary supplementation in elderly patients with fractured neck of the femur. Lancet. 1990;335:1013-17.
71. Detsky A Baker J, O’Rourke K, et al. Perioperative parenteral nutrition: A meta-analysis. Ann Intern Med. 1987;107:195-203.
72. Heyland D, MacDonald S, Keefe L, et al. TPN in the critically ill patient: A meta-analysis. JAMA. 1998;16:2013-19.
73. Bastow M, Rawlings J, Allison S. Benefits of supplementary tube feeding after fractures neck of femur. BMJ. 1983;287:1589-92.
74. Windsor J, Hill G. Risk factors for postoperative pneumonia. Ann Surg. 1988;208:211-14.
75. Mendenhall C, Tosch T, Weesner R, et al. VA cooperative study on alcoholic hepatitis II. Am J Clin Nutr. 1986;43:213-17.
76. Ockenga J, Freudenreich M, Zakonsky R, et al. Nutritional assessment and management in hospitalized patients: Implication for DRG-based reimbursement and health care quality. Clin Nutr. 2005;24:913-19.
77. Morgan DB, Hill GL, Burkinshaw L. The assessment of weight loss from a single measurement of body weight: The problems and limitations. Am J Clin Nutr. 1980;33:2101-5.
78. National Institutes of Health. Clinical guidelines on the identification, evaluation and treatment of overweight and obesity in adults: The evidence report. Obes Res. 1998;6(Suppl 2):51S.
79. Madill J, Gutierrez C, Grossman J, et al. Nutritional assessment of the lung transplant patient: Body mass index as a predictor of 90-day mortality following transplantation. J Heart Lung Transplant. 2001;20:288-96.
80. Kienle P, Weitz J, Benner A, et al. Laparoscopically assisted colectomy and ileoanal pouch procedure with and without protective ileostomy. Surg Endosc. 2003;17:716-20.
81. Naveau S, Giraud V, Borotto E, et al. Excess weight risk factor for alcoholic liver disease. Hepatol. 1997;25:108-11.
82. Garrouste-Orgeas M, Troche G, Azoulay E, et al. Body mass index. An additional prognostic factor in ICU patients. Intensive Care Med. 2004;30:437-43.
83. Prentice AM, Jebb SA. Beyond body mass index. Obesity Rev. 2001;2:141-7.
84. Maynard LM, Wisemandle W, Roche AF, et al. Childhood body composition in relation to body mass index. Pediatrics. 2001;107:340-50.
85. Forbes GB. Perspectives on body composition. Curr Opin Clin Nutr Metab Care. 2002;5:1-3.
86. Fields D, Goran M, McCrory M. Body composition assessment via air-displacement plethysmography in adults and children: A review. Am J Clin Nutr. 2002;75:453-67.
87. Genton L, Hans D, Kyle U, et al. DEXA and body composition: Differences between devices and comparison with reference methods. Nutrition. 2002;18:66-70.
88. Kehayias J, Fiatarone M, Zhuang H, et al. Total body potassium and fat: Relevance to aging. Am J Clin Nutr. 1997;66:904-10.
89. Schoeller D Kushner R, Taylor P, et al. Measurement of total body water: Isotope dilution techniques. In: Roche A, editor. Body composition assessments in youth and adults. 6th ed. Columbus, OH: Ross Laboratories; 1985:24.
90. Kehayias J, Valtuena S. Neutron activation analysis determination of body composition. Curr Opin Clin Nutr Metabol Care. 1999;2:453-63.
91. Thomas E, Saeed N, Hajnal J, et al. Magnetic resonance imaging of total body fat. J Appl Physiol. 1998;85:1778-85.
92. Frisancho AR. New standards of weight and body composition by frame size and height for assessing the nutritional status of adults and the elderly. Am J Clin Nutr. 1984;40:808-19.
93. Hall JCH, O’Quigley J, Giles GR, et al. Upper limb anthropometry: The value of measurement variance studies. Am J Clin Nutr. 1980;33:1846-51.
94. Alberino F, Gatta A, Amodio P, et al. Nutrition and survival in patients with liver cirrhosis. Nutrition. 2001;17:445-50.
95. Mendenhall CL, Moritz T, Roselle G, et al. Protein energy malnutrition in severe alcoholic hepatitis: Diagnosis and response to treatment. JPEN J Parenter Enteral Nutr. 1995;19:258-65.
96. Wilson I, Roubenoff R, Knox T, et al. Relation of lean body mass to health-related quality of life in persons with HIV. J Acquir Immune Defic Syndr. 2000;24:137-46.
97. Chertow G, Jacobs D, Lazarus J, et al. Phase angle predicts survival in hemodialysis patients. J Renal Nutr. 1997;7:204-8.
98. Ellis K, Bell S, Chertow G, et al. Bioelectrical impedance methods in clinical research; a follow-up to the NIH technology assessment conference. Nutrition. 1999;15:874-80.
99. Windsor J, Hill G. Grip strength: A measure of the proportion of protein loss in surgical patients. Br J Surg. 1988;75:880-2.
100. Figueiredo F, Dickson E, Pasha T, et al. Utility of standard nutritional parameters in detecting body cell mass depletion with end-stage liver disease. Liver Transpl. 2000;6:575-81.
101. Webb A, Newman L, Taylor M, et al. Hand grip dynamometry as a predictor of postoperative complications: reappraisal using age-standardized grip strengths. JPEN J Parenter Enteral Nutr. 1989;13:30-3.
102. Kalfarentzos F, Spiliotis J, Velimezis G, et al. Comparison of forearm muscle dynamometry with prognostic nutritional index as a preop indicator in cancer patients. JPEN J Parenter Enteral Nutr. 1989;13:34-6.
103. Nascimento M, Qureshi A, Stenvinkel P, et al. Malnutrition and inflammation are associated with impaired pulmonary function in patients with chronic kidney disease. Nephrol Dial Transplant. 2004;19:1823-8.
104. Jeejeebhoy K. Bulk or bounce—the object of nutritional support. J Parenter Enteral Nutr. 1988;12:539-49.
105. Zeiderman M, McMahon M. The role of objective measurement of skeletal muscle function in the pre-operative patient. Clin Nutr. 1989;8:161-6.
106. Finn P, Plank L, Clark M, et al. Assessment of involuntary muscle function in patients after critical injury or severe sepsis. JPEN J Parenter Enteral Nutr. 1996;20:332-7.
107. Christou N, Meakins J, Gordon J, et al. The delayed hypersensitivity response and host resistance in surgical patients. Ann Surg. 1995;222:534-46.
108. Matarese L, Steiger E, Seidner D, et al. Body composition changes in cachectic patients receiving home parenteral nutrition. JPEN J Parenter Enteral Nutr. 2002;26:366-71.
109. Watanabe A, Matsuzaki S, Moriwaki H, et al. Problems in serum albumin measurement and clinical significance of albumin microheterogeneity in cirrhotics. Nutrition. 2004;20:351-7.
110. Klein S. The myth of serum albumin as a measure of nutritional status. Gastroenterology. 1990;99:1845-6.
111. Robinson M, Trujillo E, Mogensen K, et al. Improving nutritional screening of hospitalized patients: The role of prealbumin. JPEN J Parenter Enteral Nutr. 2003;27:389-95.
112. Remer T, Neubert A, Maser-Gluth C. Anthropometry-based reference values for 24-hr. urinary excretion during growth and their use in endocrine and nutritional research. Am J Clin Nutr. 2002;75:561-9.
113. Grinspoon S, Corcoran C Rosenthal D, et al. Quantitative assessment of cross sectional muscle area, functional status, and muscle strength in men with AIDS-wasting syndrome. J Clin Endocrinol Metab. 1999;84:201-6.
114. Detsky AS, Baker JP, Mendelson RA, et al. Evaluating the accuracy of nutritional assessment techniques applied to hospitalized patients: methodology and comparisons. JPEN J Parenter Enteral Nutr. 1984;8:153-9.
115. Baker JP, Detsky AS, Wesson DE, et al. Nutritional assessment: A comparison of clinical judgement and objective measurements. N Engl J Med. 1982;306:969-72.
116. Hirsch S, de Obaldia N, Petermann M, et al. Subjective global assessment of nutritional status: Further validation. Nutrition. 1991;7:35-7.
117. Sacks G, Dearman K, Replogle W, et al. Use of subjective global assessment to identify nutrition-associated complications and death in geriatric long-term care facility residents. J Am Coll Nutr. 2000;19:570-7.
118. Enia G, Sicuso C, Alati C, et al. Subjective global assessment of nutrition in dialysis patients. Nephrol Dial Transplant. 1993;8:1094-8.
119. Thoreson L, Fjelstad I, Krogstad K, et al. Nutritional status of patients with advanced cancer: The value of using the Subjective Global Assessment of Nutritional Status as a screening tool. Palliat Med. 2002;16:33-42.
120. Guigoz Y, Vellas B, Garry P. Mini Nutritional Assessment: A practical assessment tool for grading the nutritional state of elderly patients. In: Vellas B, Guigoz Y, Garry P, Albarede M, editors. The Mini Nutritional Assessment, facts and research in gerontology. Supplement 2. Paris: Serdi; 1994:15.
121. Visvanathan R, Penhall R, Chapman I. Nutritional screening of older people in a sub-acute care facility in Australia and its relation to discharge outcomes. Age Aging. 2004;33:260-5.
122. Visvanathan R, Macintosh C, Callary M, et al. The nutritional status of 250 older Australian recipients of domiciliary care services and its association with outcomes. J Am Geriatr Soc. 2003;51:1007-11.
123. Mitchell D, Smiciklas-Wright H, Friedmann J, Jensen G. Dietary intake assessed by the Nutrition Screening Initiative Level II screen is a sensitive but not specific indicator of nutrition risk in older adults. J Am Diet Assoc. 2002;102:842-4.
124. Shike M, Russell D, Detsky A, et al. Changes in body composition in patients with small cell lung cancer. Ann Int Med. 1984;101:303-9.
125. Mason JB. A clinical nutritionist’s search for meaning: Why should we bother to feed the acutely ill, hospitalized patient? Nutrition. 1996;12:279-81.
126. Muller J, Brenner U, Dienst C, et al. Preoperative parenteral feeding in patients with gastrointestinal carcinoma. Lancet. 1982;1:68-71.
127. Fan S, Lo C, Lai E, et al. Perioperative nutritional support in patients undergoing hepatectomy for hepatocellular carcinoma. N Engl J Med. 1994;331:1547-52.
128. Bozzetti F, Vavazzi C, Miceli R, et al. Perioperative TPN in malnourished, GI cancer patients: A randomized, clinical trial. JPEN J Parenter Enteral Nutr. 2000;24:7-14.
129. Brennan M, Pisters P, Posner M, et al. A prospective randomized trial of TPN after major pancreatic resection for malignancy. Ann Surg. 1994;220:436-41.
130. Shirabe K, Matsumata T, Shimada M, et al. A comparison of parenteral hyperalimentation and early enteral feeding regarding systemic immunity after major hepatic resection—a randomized, prospective study. Hepatogastroenterology. 1997;44:205-9.
131. Flynn M, Leightty F. Preoperative outpatient nutritional support of patients with squamous cancer of the upper aerodigestive tract. Am J Surg. 1987;154:359-62.
132. Smith R, Hartemink R, Hollinshead J, et al. Fine bore jejunostomy feeding following major abdominal surgery: A controlled randomized clinical trial. Br J Surg. 1985;72:458-61.
133. Mason JB, Roubenoff R. The unbearable lightness of being … a cirrhotic. Gastroenterology. 1993;105:1911-4.
134. Bozetti F, Cozzaglio L, Gavazzi C, et al. Nutritional support in patients with cancer of the esophagus: Impact on nutritional status, patient compliance, and survival. Tumori. 1998;84:681-6.
135. Senft M, Fietkau R, Iro H, et al. The influence of supportive nutritional therapy via percutaneous endoscopically guided gastrostomy on the quality of life of cancer patients. Support Care Cancer. 1993;1:272-5.
136. Stanga Z, Brunner A, Leuenberger M, et al. Nutrition in clinical practice—the refeeding syndrome: Illustrative cases and guidelines for prevention and treatment. Eur J Clin Nutr. 2008;62:687-94.
137. Apovian CM, McMahon MM, Bistrian BR. Guidelines for refeeding the marasmic patient. Crit Care Med. 1990;18:1030-4.
138. Weinsier RL, Krumdieck CL. Death resulting from overzealous total parenteral nutrition: The refeeding syndrome revisited. Am J Clin Nutr. 1981;34:393-6.
139. Corredor DG, Sabeh G, Mendelsohn LV, et al. Enhanced postglucose hypophosphatemia during starvation therapy of obesity. Metabolism. 1969;18:754-8.
140. Crook MA, Hally V, Panteli JV. The importance of the refeeding syndrome. Nutrition. 2001;17:632-7.
141. DeFronzo RA, Soman V, Sherwin RS, et al. Insulin binding to monocytes and insulin action in human obesity, starvation, and refeeding. J Clin Invest. 1978;62:204-8.
142. Keys A, Henschel A, Taylor HL. The size and function of the human heart at rest in semi-starvation and in subsequent rehabilitation. Am J Physiol. 1947;50:153-7.
143. Garnett ES, Barnard DL, Ford J, et al. Gross fragmentation of cardiac myofibrils after therapeutic starvation for obesity. Lancet. 1969;1:914-18.
144. Heymsfield SB, Bethel RA, Ansley JD, et al. Cardiac abnormalities in cachectic patients before and during nutritional repletion. Am Heart J. 1978;95:584-8.
145. Gottdiener JS, Gross HA, Henry WL, et al. Effects of self-induced starvation on cardiac size and function in anorexia nervosa. Circulation. 1978;58:425-9.
146. DeFronzo RA, Cooke CR, Andres R, et al. The effect of insulin on renal handling of sodium, potassium, calcium, and phosphate in man. J Clin Invest. 1975;55:845-9.
147. Nakasaki H, Ohta M, Soeda J, et al. Clinical and biochemical aspects of thiamine treatment for metabolic acidosis during total parenteral nutrition. Nutrition. 1997;13:110-17.
148. Isner JM, Roberts WC, Heymsfield SB, Yager J. Anorexia nervosa and sudden death. Ann Intern Med. 1985;102:49-53.
149. Wyrick WJJr, Rea WJ, McClelland RN. Rare complications with intravenous hyperosmotic alimentation. JAMA. 1970;211:1697-8.
150. Roediger WEW. Metabolic basis of starvation diarrhea: Implications for treatment. Lancet. 1986;1:1082-6.
151. Vazquez JA, Morse EL, Adibi SA. Effect of starvation on amino acid and peptide transport and peptide hydrolysis in humans. Am J Physiol. 1985;249:G563-7.
152. Hamilton C, Seidner DL. Metabolic bone disease and parenteral nutrition. Curr Gastroenterol Rep. 2004;6:335-41.
153. Drucker D, Lovshin J. New frontiers in the biology of GLP-2. Regul Pept. 2000;90:27-32.
154. Imamura M. Effects of surgical manipulation of the intestine on peptide YY and its physiology. Peptides. 2002;23:403-7.
155. Saunders DR, Saunders MD, Sillery JK. Beneficial effects of glucose polymer and a receptor blocker in a patient with a proximal ileostomy. Am J Gastroenterol. 1989;84:192-4.
156. Ladefoged K, Christensen KC, Hegnhj J, Jarnum S. Effect of a long-acting somatostatin analogue SMS 201-995 on jejunostomy effluents in patients with severe short bowel syndrome. Gut. 1989;30:943-7.
157. Farthing MJ. The role of somatostatin analogues in the treatment of refractory diarrhoea. Digestion. 1996;57(Suppl 1):107-13.
158. Cello J, Grendell J, Basuk P, et al. Effect of octreotide on refractory AIDS-associated diarrhea. Ann Int Med. 1991;115:705-10.
159. Beaugerie L, Baumer P, Chaussade S, et al. Treatment of refractory diarrhoea in AIDS with acetorphan and octreotide. Eur J Gastroenterol Hepatol. 1996;8:485-9.
160. Witt K, Pedersen NT. The long-acting somatostatin analogue SMS 201-995 causes malabsorption. Scand J Gastroenterol. 1989;24:1248-52.
161. Fisher RS, Rock E, Levin G, Malmud L. Effect of somatostatin on gallbladder emptying. Gastroenterology. 1987;92:885-9.
162. O’Keefe SJ, Haymond MW, Bennet WM, et al. Long-acting somatostatin analogue therapy and protein metabolism in patients with jejunostomies. Gastroenterology. 1994;107:379-83.
163. Mystakidou K, Katsouda E, Tsilika E, et al. Octreotide long-acting formulation (LAR) in chronic loperamide-refractory diarrhea not related to cancer treatment. Anticancer Res. 2006;26:2325-8.
164. Arrigoni E, Marteau P, Briet F, et al. Tolerance and absorption of lactose from milk and yogurt during short-bowel syndrome in humans. Am J Clin Nutr. 1994;60:926-30.
165. Edes TE, Walk BE, Austin JL. Diarrhea in tube-fed patients: Feeding formula not necessarily the cause. Am J Med. 1990;88:91-5.
166. Cosnes J, Gend JP, Evard D, LeQuintrec Y. Compensatory enteral hyperalimentation for management of patients with severe short bowel syndrome. Am J Clin Nutr. 1985;41:1002-6.
167. Woolf GM, Miller C, Kurian R, Jeejeebhoy KN. Diet for patients with a short bowel: High fat or high carbohydrate? Gastroenterology. 1983;84:823-8.
168. Woolf GM, Miller C, Kurian R, Jeejeebhoy KN. Nutritional absorption in short bowel syndrome: Evaluation of fluid, caloric, and divalent cation requirements. Dig Dis Sci. 1987;32:8-15.
169. McIntyre PB, Fitchew M, Lennard-Jones JE. Patients with a high jejunostomy do not need a special diet. Gastroenterology. 1986;91:25-33.
170. Andersson H, Isaksson B, Sjogren B. Fat-reduced diet in the symptomatic treatment of small bowel disease. Gut. 1974;15:351.
171. Andersson H, Jagenburg R. Fat-reduced diet in the treatment of hyperoxaluria in patients with ileopathy. Gut. 1974;15:360-6.
172. Jeppesen P, Mortensen P. The influence of a preserved colon on the absorption of medium chain fat in patients with small bowel resection. Gut. 1998;43:478-83.
173. Cosnes J, Evard D, Beaugerie L, et al. Improvement in protein absorption with small-peptide-based diet in patients with high jejunostomy. Nutrition. 1992;8:406-11.
174. Pizarro D, Posada G, Sandi L, Moran JR. Rice-based oral electrolyte solutions for the management of infantile diarrhea. N Engl J Med. 1991;324:517-21.
175. Lennard-Jones JE. Oral rehydration solutions in short bowel syndrome. Clin Ther. 1990;12:129-37.
176. Duggan C, Fontaine O, Pierce N, et al. Scientific rationale for a change in the composition of oral rehydration solution. JAMA. 2004;291:2628-31.
177. Griffin GE, Fagan EF, Hodgson HJ, Chadwick VS. Enteral therapy in the management of massive gut resection complicated by chronic fluid and electrolyte depletion. Dig Dis Sci. 1991;27:902-8.
178. Quitterer U, Hoffmann M, Freichel M, et al. Paradoxical block of parathormone secretion is mediated by increased activity of G alpha subunits. J Biol Chem. 2001;276:6763-9.
179. Muldowney F, McKeen T, Kyle L, et al. Parathormone-like effect of magnesium replenishment in steatorrhea. N Engl J Med. 1970;282:61-8.
180. Rude RK, Singer FR. Magnesium deficiency and excess. Annu Rev Med. 1981;32:245-59.
181. Fine KD, Santa Ana CA, Porter JL, Fordtran JS. Intestinal absorption of magnesium from food and supplements. J Clin Invest. 1991;88:396-402.
182. Hambidge KM, Huffer JW, Raboy V, et al. Zinc absorption from low-phytate hybrids of maize and their wild-type isohybrids. Am J Clin Nutr. 2004;79:1053-9.
183. Hoffman HN, Phyliky RL, Fleming CR. Zinc-induced copper deficiency. Gastroenterology. 1988;94:508-12.
184. Bailie GR, Clark JA, Lane CE, Lane PL. Hypersensitivity reactions and deaths associated with intravenous iron preparations. Nephrol Dial Transplant. 2005;20:1443-9.
185. Messing B, Crenn P, Beau P. Long-term survival and parenteral nutrition dependence in adult patients with short bowel syndrome. Gastroenterology. 1999;117:1043-50.
186. Scolapio J, Camilleri M, Flemming C, et al. Effect of growth hormone, glutamine, and diet on adaptation in short bowel syndrome. Gastroenterology. 1997;113:1074-81.
187. Szkudlarek J, Jeppesen P, Mortensen P. Effect of high-dose growth hormone with glutamine and no change in diet on intestinal absorption in short bowel patients. Gut. 2000;47:199-205.
188. Seguy D, Vahedi K, Kapel N, et al. Low-dose growth hormone in adult home parenteral nutrition-dependent short bowel syndrome patients. Gastroenterology. 2003;124:293-302.
189. Scolapio J, McGreevy K, Tennyson G, et al. Effect of glutamine in short bowel syndrome. Clin Nutr. 2001;20:319-23.