[level-membership-for-radiology-category]
CHAPTER 8 Nontraumatic Emergency Radiology of the Thorax
An emergency medicine physician once told a bright-eyed medical student on the first clinical shift:
CHEST RADIOGRAPHY
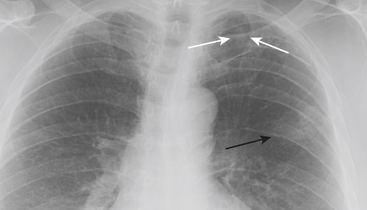
One principle that serves radiologists well is the establishment of a systematic pattern through which the interpreter progresses as he or she reads a CXR. While naturally drawn to look at the lungs, and while evaluation of pulmonary parenchyma is paramount, the interpreter must unerringly include assessment of extrapulmonary anatomy on every CXR. This includes evaluation of anatomy below the diaphragm, of lung parenchyma posterior to the diaphragm, of the bony thorax, spine, shoulders, and chest wall soft tissues, of the heart contours, mediastinum, and pulmonary hila, of pleural surfaces and interfaces, and of complex areas such as the pulmonary apices. Establishing a pattern of evaluation that systematically includes all of the anatomy encountered on a CXR will serve to avoid unfortunate errors of CXR interpretation (Fig. 8-1).
Pneumonia
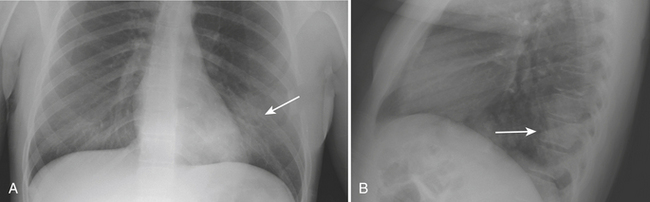
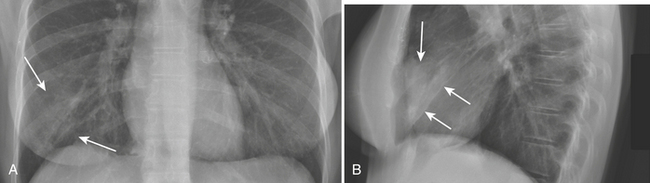
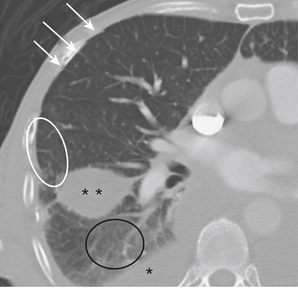
CXR and chest imaging are generally of limited value in upper respiratory infections. On CXR, pneumonia manifests as areas of increased density within the pulmonary parenchyma. The increased density is usually focal but may be multifocal or diffuse. Depending on the causative organism and the health and immune status of the patient, the density may manifest as confluent parenchymal consolidation (where vessels are obscured within the density), as hazy ground glass density (where vessel margins can be detected within the density), or as coarse reticular or reticulonodular opacities. These densities may be marginated by pleural or fissural boundaries. If available, the use of both posteroanterior (PA) and lateral projections is often helpful in detecting, confirming, or localizing areas of increased parenchymal density (Figs. 8-2 and 8-3).
Heart Failure
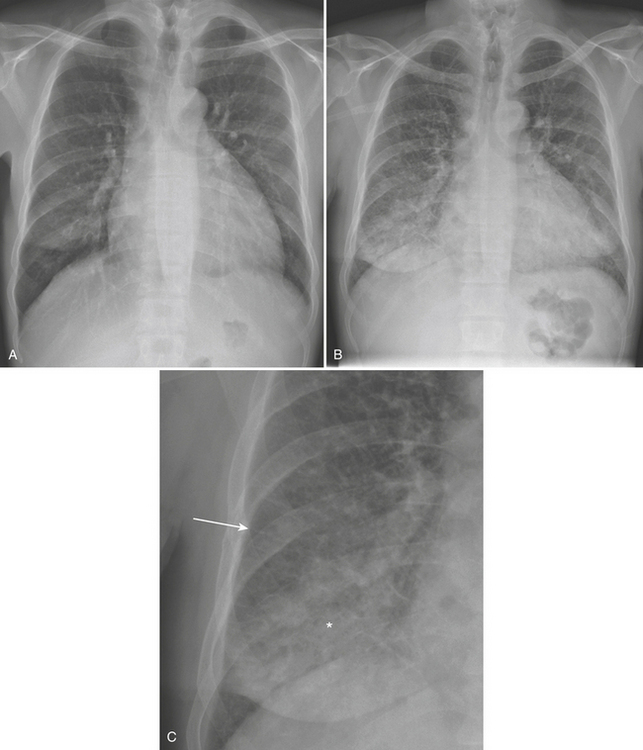
The sequence by which CHF leads to pulmonary edema and may manifest on CXR is familiar. Left ventricular failure results in increased pressure within the pulmonary venous system leading to pulmonary venous distention. The increased size of pulmonary veins on CXR, particularly in the upper lobes, manifests as “cephalization,” for which the determination can be relatively subjective at imaging. As pulmonary venous capacitance is exceeded, pulmonary vessels begin to leak transudative fluid into the pulmonary interstitium, including the septal, peribronchial, and perivascular spaces, and into the pleural space. The CXR correlates include septal lines (or “Kerley B” lines), peribronchial cuffing, indistinctness of vessel margins, and pleural effusions, respectively. With further progression, fluid begins to accumulate in alveolar spaces resulting in more confluent density that obscures vessel margins but in contrast accentuates the appearance of bronchial airways resulting in air bronchograms (Fig. 8-4).
COMPUTED TOMOGRAPHY
CT of the Pulmonary Parenchyma
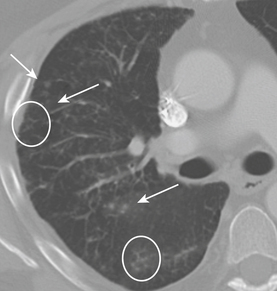
Septal thickening may be smooth, nodular, or irregular. Differential considerations for smooth septal thickening include pulmonary edema (with septal thickening being the equivalent of “Kerley B” lines seen on CXR) or ARDS, and pneumonia or pulmonary hemorrhage (Fig. 8-5). Septal thickening seen with these entities may be associated with “ground glass” density, the so-called crazy paving pattern. The “crazy paving” pattern has also been described as characteristic of alveolar proteinosis. Nodular septal thickening may be seen in lymphangitic metastases as well as sarcoidosis and silicosis. Nodules seen in sarcoidosis are characterized as perilymphatic, and thus may be centrilobular or septal (lymphatics are associated with both the septae and bronchovascular structures). Pulmonary fibrosis may also result in septal thickening, which may be irregular in nature and may be associated with honeycombing or other common findings of fibrosis, such as traction bronchiectasis.
Centrilobular opacities or nodules generally imply abnormalities of the small airways or vascular diseases, and are usually related to bronchiolitis of varying etiologies. The combination of centrilobular opacities/nodules with dilated/opacified bronchioles has been termed the “tree-in-bud” sign (Fig. 8-6). In the ED, centrilobular opacities/nodules are usually seen in the setting of an infectious bronchiolitis that may be due to bacterial or atypical organisms. Pulmonary aspiration can give a similar appearance. Other differential considerations for centrilobular opacities/nodules include pulmonary edema and hemorrhage, vasculitis, bronchoalveolar cell carcinoma, acute or subacute hypersensitivity pneumonitis, noninfectious bronchiolitis (as can be seen in smoking-related interstitial lung disease/respiratory bronchiolitis), and panbronchiolitis.
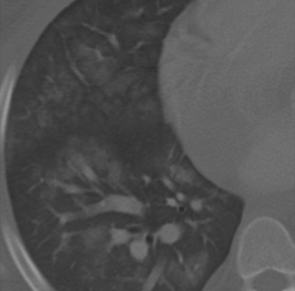
More generalized (panlobular) processes may lead to either ground glass or more consolidated opacities. If ground glass opacities are detected, the differential diagnosis is assisted by identification of ancillary findings. Ground glass opacities in the presence of honeycombing or other findings of fibrosis should point toward differential considerations among fibrotic lung diseases. Ground glass opacities in the presence of septal thickening (“crazy paving” pattern) should raise differential considerations including pulmonary edema, pneumonias of varying etiologies, and pulmonary hemorrhage, as well as entities less commonly encountered in the ED, including hypersensitivity pneumonitis, ARDS, and alveolar proteinosis. If ground glass opacities are encountered in the absence of ancillary findings the differential considerations become even broader and include interstitial pneumonia, infection, and drug reaction, in addition to the entities listed above (Fig. 8-7). Differential considerations for more consolidated densities include entities such as pneumonias, pulmonary edema, ARDS, and pulmonary hemorrhage, as well as acute eosinophilic pneumonia, masses, and fibrotic processes. Familiarity with the concept of evaluating pulmonary parenchyma based on analysis of the structures of the secondary pulmonary lobule will serve emergency radiologists well in their approach to formulating differential diagnoses for parenchymal disease.
Chest CT Techniques and Protocols
Scan Protocol Considerations
Contrast Timing Principles and Techniques
Indication-specific CT Protocol Techniques
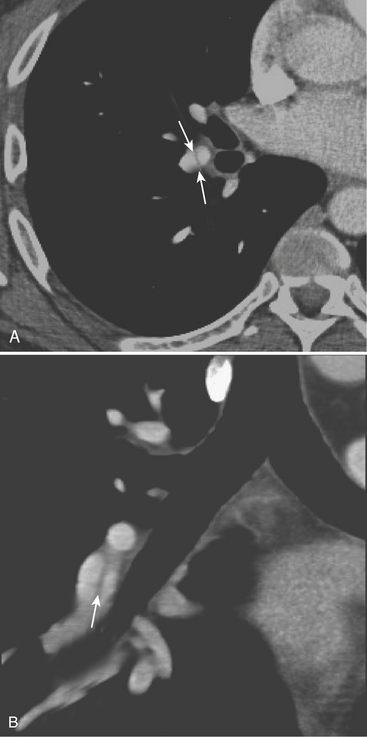
Upper Extremity Deep Venous Thrombosis or Superior Vena Cava Syndrome
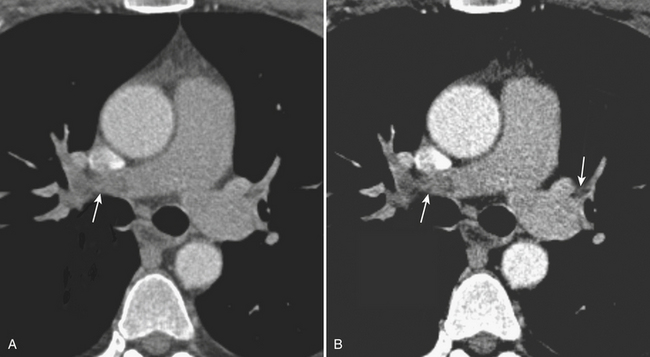
A delayed venous phase scan should be performed if there is high clinical suspicion for upper extremity or central vein thrombosis. The delayed phase produces more uniform venous opacification and eliminates the mixing artifacts typically observed from dense IVCM injected through one arm mixing in the SVC with the unopacified blood arriving from the other arm (Fig. 8-8). Coronal reformations can greatly aid diagnosis.
Aortic Dissection CTA
Currently, full dissection CTA protocols may include:
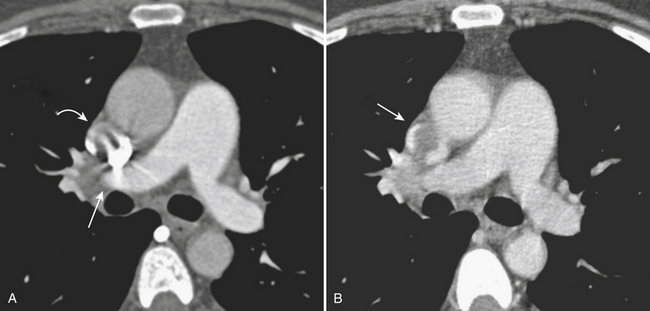
The arterial phase scan is often performed with cardiac gating in order to reduce the pulsation artifact, which can mimic focal aortic dissection at the aortic root. However, this artifact has a characteristic appearance on axial and MPR images, and can typically be readily differentiated from aortic dissection (Fig. 8-9). If the radiologist is readily familiar with this diagnostic pitfall, a nongated arterial phase scan can be used so as to reduce radiation exposure, which is significantly greater on cardiac-gated scans. If cardiac gating is utilized, a regular heart rate is required, preferably 65 or fewer beats per minute. For younger ED patients (generally younger than 50 years old) with a low pretest probability of aortic dissection and a low incidence of significant atherosclerotic disease, we screen with a physician-monitored, nongated, contrast-enhanced chest CT only in order to reduce the radiation exposure from multiple phase protocols. If needed, additional scanning can be readily undertaken if results of this scan show anything other than a normal aorta. Very rarely is this necessary.
THE PLEURA, PERICARDIUM, AND MEDIASTINUM
The Pleura
Pneumothorax
Pneumothorax is the presence of air within the pleural space. The etiologies of pneumothorax are multifactorial (Table 8-1). The most common imaging test performed to assess for pneumothorax is the chest radiograph, or CXR. Ideally, this is performed with upright patient positioning so that the air–pleural interface can be readily identified toward the apices. Expiratory imaging may accentuate the contrast between lung tissue and intrapleural gas. This method may be particularly helpful for smaller pneumothoraces, but is generally not required. The presence of pneumothorax is often more subtle on supine radiography, and small pneumothoraces can be easily overlooked.
| Etiology | Types |
|---|---|
| Trauma | Penetrating or blunt; barotrauma |
| Idiopathic | Primary or secondary |
| Iatrogenic | Following biopsy, surgery, central line placement, thoracentesis, mechanical ventilation, bronchoscopy |
| Infection | Pneumocystis carinii, necrotizing pneumonia |
| Neoplastic | Langerhans’ cell histiocytosis, sarcoma, lung cancer, various others |
| Congenital/Acquired | Emphysema, congenital bullae, lymphangioleiomyomatosis |
Recently, ultrasound (US) has gained attention as a rapid assessment tool to evaluate for pneumothorax in the ED and after chest interventions. The performance of US has been shown to be as good if not better than radiography, although it generally underperforms as a follow-up study. Additionally, greater variation in results should be expected due to differences in sonographer skill and experience. Traumatic pneumothorax is discussed in this text in Chapter 2, so only a brief comment is made here. The seal of the pleural space is easily broken by penetrating injury, and it is vulnerable because it is spread over a large surface area. Significant blunt trauma is estimated to cause pneumothorax in up to 30% to 40% of cases. It can lead to pneumothorax when broken ribs or other sharp structures expose the pleural space to atmospheric pressure, or when a preexisting bleb is ruptured. Fractured ribs on imaging should invoke a secondary search for pneumothorax. With positive pressure ventilation, barotrauma can lead to pneumothorax, particularly in patients with relatively noncompliant lung tissue (e.g., those with ARDS or interstitial lung disease). Barotrauma may also occur during sport diving or from nonpenetrating blast injuries resulting from explosive devices.
Pleural Effusion
Pleural effusion, defined as abnormally increased fluid within the pleural space, may be transudative or exudative in etiology. Transudative fluid is generally low in protein and typically develops in the setting of left heart failure, decreased oncotic pressure, or other systemic abnormality. Exudative fluid is often a consequence of breakdown of the barrier function of the pleura, leading to leakage of macromolecules and proteins. Less commonly encountered complex exudative pleural effusions include hemorrhagic fluid related to tuberculous infection, chylothorax related to thoracic duct injury, and eosinophilic effusions related to hypersensitivity (Table 8-2).
| Etiology | Types |
|---|---|
| Trauma | Hemothorax, chylothorax |
| Infectious | Empyema, tuberculous effusion |
| Gestational/Fertility | Ovarian hyperstimulation |
| Inflammatory | Postpericardiotomy, eosinophilic |
| Drug induced | Multiple factors |
| Reactive | Ascitic, pancreatitis |
Pericardium
Hemopericardium
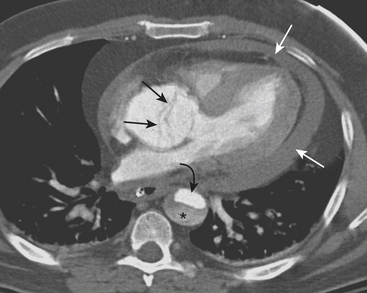
Hemopericardium is most often the result of acute blunt or penetrating trauma, from direct pericardial damage, myocardial contusion, or proximal aortic injury. Hemorrhage into the pericardial sac can rapidly lead to tamponade and circulatory collapse. In the absence of a history of trauma, type A aortic dissection, coronary artery aneurysm rupture, or postinfarct cardiac rupture must be considered. However, a dense pericardial effusion is not a sine qua non of hemopericardium or incipient tamponade. Radiographic and CT findings must be interpreted in conjunction with history and physical exam findings. Echocardiography should be performed if there are features causing concern for hemodynamic compromise (Fig. 8-10).
Mediastinum
Pneumomediastinum
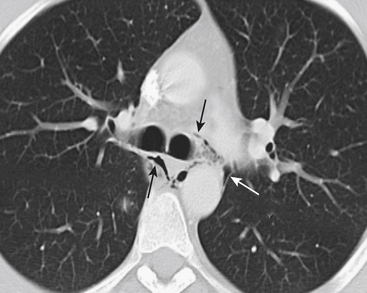
Typical causes of pneumomediastinum include trauma, asthma, drug use (Valsalva-induced), infection, and spontaneous pneumomediastinum. Traumatic causes (other than typical blunt or penetrating external trauma) may be the result of scope, tube, or line insertion (i.e., iatrogenic), positive pressure ventilation, or internal barotrauma related to vomiting (Boerhaave syndrome) or coughing against a closed glottis (Fig. 8-11). Pneumomediastinum generally requires no treatment apart from addressing the underlying cause.
SVC Syndrome
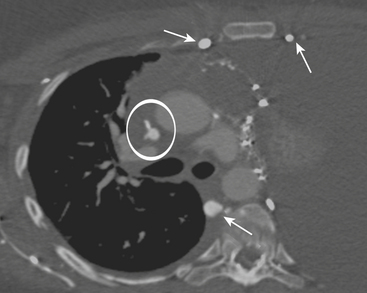
CXR may reveal a mediastinal abnormality in patients with clinically suspected SVC syndrome, such as a mediastinal mass or lymphadenopathy. Contrast-enhanced CT and MR angiography are the most reliable noninvasive methods of definitive diagnosis. CT is generally preferred as the initial study, owing to the prevalence of lung cancer and lymphoma as causative factors in the adult population and the ease and accuracy with which CT delineates these findings (Fig. 8-12).
THE THORACIC AORTA
Aortic Dissection
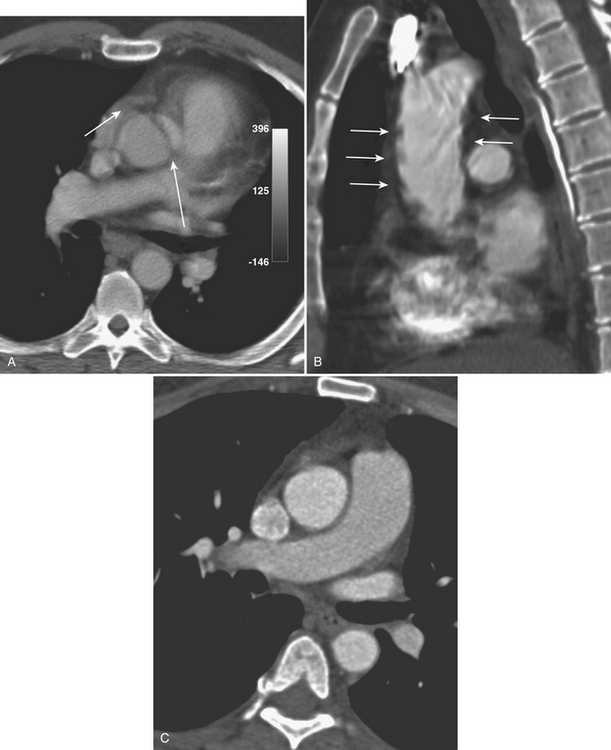
CT reliably classifies dissections as either type A or type B (Fig. 8-13; see also Fig. 8-10), the principal criterion for determining surgical (type A) versus medical (type B) intervention. In addition, CTA has been shown to reliably differentiate the true from false lumen. Distinguishing the true from false lumen had been less important with conventional surgical therapy but has since become critical for endovascular management. The false lumen is usually located in the right anterolateral position of the ascending aorta, the superior aspect of the arch, and the left lateral position of the descending aorta. However, the configuration of aortic dissection can be quite variable. The most reliable imaging criteria are identifying the continuity of the true lumen with the undissected portion of the normal aorta either proximally or distally, and identifying the false lumen’s termination into a blind sac. Establishing continuity can be more difficult for dissections that involve the aortic root, originate at the aortic arch, or involve the entire aorta. Lepage found that an acute angle between the dissection flap and outer wall on an axial CT image (the “beak” sign) and a larger luminal cross-sectional area were the two most useful indicators of the false lumen for both acute and chronic dissections as they were both sensitive and specific. The false lumen can be filled with either contrast-enhanced blood or thrombus. “Cobwebs,” which represent thin radiolucent filling defects attached to the aortic wall, are also highly specific for the false lumen but are seen infrequently. Outer wall calcifications are useful for indicating the true lumen in acute dissection but are unreliable in chronic dissection since neointima within a false lumen may calcify. While the direction of flap curvature is not a useful indicator, direct visualization of intimomedial rupture, seen as intimal discontinuity, evaginating intraluminal flap, and communication of the two lumina, reliably identifies the direction of entrance tear and differentiates true from false lumen. Identification of the tear site is important since both surgical and endovascular treatment aim to occlude the tear and induce thrombosis of the false lumen. In patients with aortic arch involvement, one lumen often spirals around the other, resulting in the appearance of three lumens on an axial CT image. The inner lumen invariably represents the true lumen. Enhanced CT typically shows either isodensity or hyperdensity of the true lumen (see Fig. 8-13).
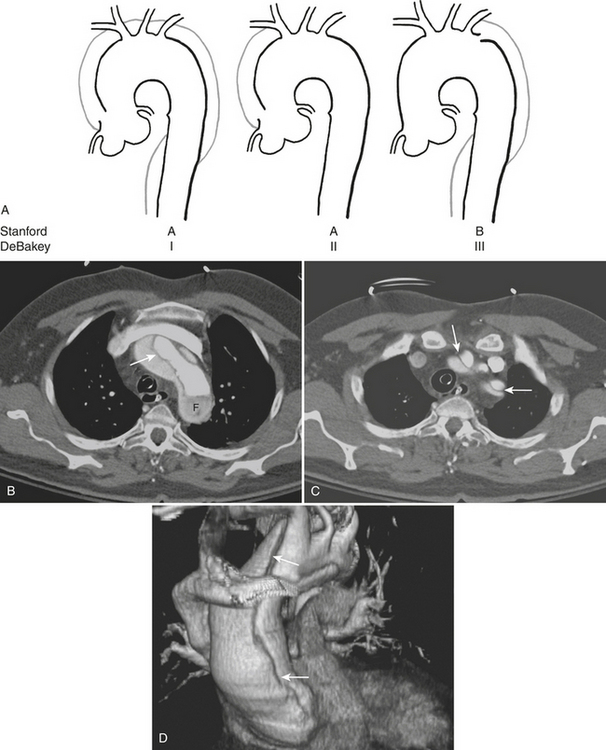
Figure 8-13 Aortic dissection. A, Diagram of Stanford aortic dissection classification. Type A dissections involve the ascending aorta, while type B dissections involve the descending aorta only. Although no longer in common clinical use, the older DeBakey classification scheme is included for reference. B, Image is of the patient shown in Figure 8-10. Axial image at the level of the aortic arch shows an intimal flap (arrow). The false lumen is hypoattenuating as a result of slow flow (F). C, Axial image at a level just above the arch shows involvement of the great vessels (arrows). D, 3D image with volume rendering clearly reveals extent of dissection (arrows).
Type A complications include intrapericardial rupture causing tamponade and great vessel or coronary artery involvement; CT can readily identify these (see Fig. 8-13). With ECG-gated MDCT, coronary and cerebral perfusion can be evaluated using the same contrast bolus. Moreover, ECG-gated MDCT permits dynamic imaging of the left ventricular outflow tract and assessment of aortic valve regurgitation. Further imaging to include an abdominal CTA may also be useful as a predictor of postoperative death in acute aortic dissection. The number of abdominal organs demonstrating decreased parenchymal enhancement was shown to be a strong factor in outcome for patients with acute aortic dissection, whereas the number of dissected branches was not a factor in postoperative death.
Acute Intramural Hematoma
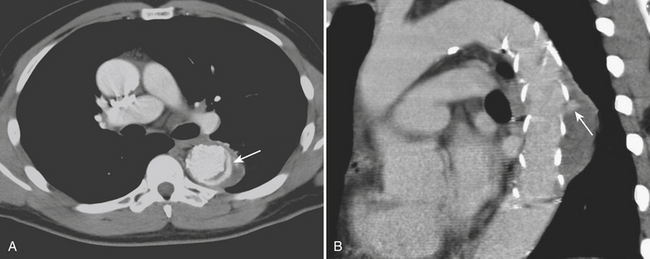
CT is the study of choice for making the initial diagnosis and has a reported accuracy of 100%. In the acute stage, unenhanced axial images reveal a hyperdense, smooth crescentic collection located eccentrically in the aortic wall, often without significant narrowing of the adjacent aortic lumen (Fig. 8-14). CT shows the IMH to have a constant circumferential relationship with the aortic wall rather than the spiraling configuration of aortic dissection. Internal displacement of intimal calcifications toward the lumen is typically seen. The ascending aorta and proximal descending aorta are most frequently involved. CTA images show no enhancement within the area of the IMH, and typically there is no branch occlusion.
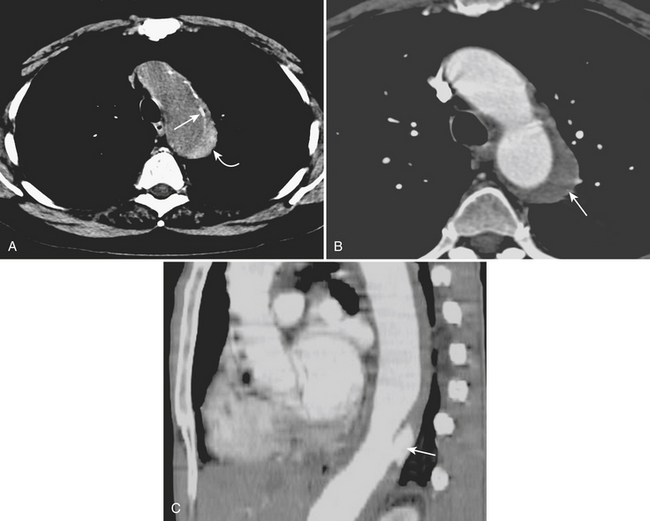
It is important to recognize the potential pitfalls in the diagnosis of IMH. If an unenhanced CT is not obtained, contrast in the aortic lumen can diminish conspicuity and even obscure detection of more subtle IMH on enhanced CTA images (see Fig. 8-14). IMH is not to be confused with mural hematoma, which is often associated with atheromatous plaque or aneurysm and is typically irregular and low in attenuation. The distinction is best appreciated on noncontrast axial CT images where calcifications are frequently a marker of the intima. Mural thrombus layers over the calcified intima, whereas IMH is subintimal in location.
IMH can occur with or without any other aortic abnormality. While most intramural hematomas resolve on follow-up CT, follow-up imaging is still important in the acute stages to assess for the development of ulcers (see Fig. 8-14). Ulcers can lead to saccular aneurysms and, less frequently, to overt dissection. Expansion of the hematoma may be a sign of impending rupture and is readily identified by CT. Although many cases of IMH not associated with ulcer have a stable early radiographic and clinical course, long-term follow-up may be indicated since fusiform aneurysm formation can be a common late complication in these patients.
Ulcerlike Diseases
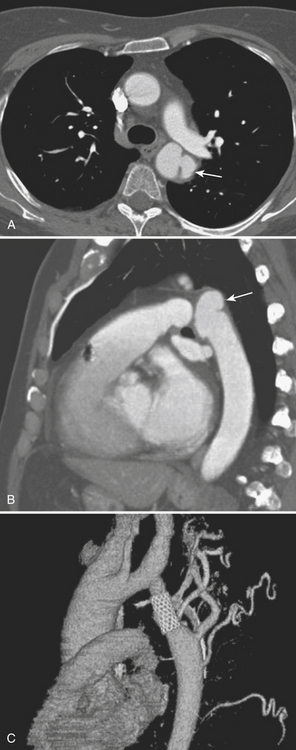
There is some controversy in the literature regarding nomenclature and clinical significance of aortic ulcers identified radiographically. Stanson first described a penetrating atherosclerotic ulcer (PAU) as a distinct entity from dissection and aneurysm, and defined it as an ulcerating atherosclerotic lesion that penetrates the internal elastic lamina allowing for hematoma formation within the media of the aortic wall. The principal CT characteristics (Fig. 8-15) seen in nearly all patients include advanced atherosclerotic disease of the thoracic aorta and a focal ulcer with adjacent subintimal hematoma beneath a frequently calcified and inwardly displaced intima. Clinical presentation varies from asymptomatic to acute chest pain similar to aortic dissection. Location can be helpful, since most cases of PAU are identified in the middle and distal thirds of the descending thoracic aorta, compared with type B dissection, which involves the proximal descending thoracic aorta.
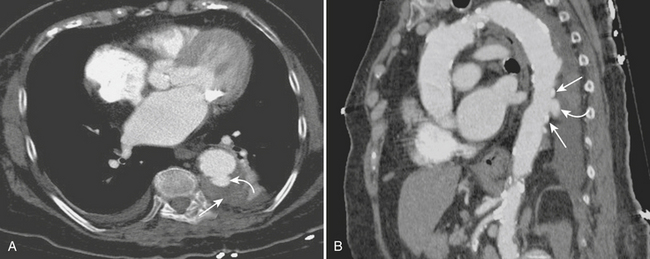
Ulcerlike lesions that occur in the setting of IMH (see Fig. 8-14) are likely distinct from penetrating atherosclerotic ulcers and tend to have a more aggressive course. CT identifies these ulcerlike projections (ULPs) along with or following the resolution of acute IMH in patients typically presenting with chest pain. As opposed to PAUs, ULPs are located predominantly in the ascending aorta, distal aortic arch, and proximal descending thoracic aorta.
Postoperative Thoracic Aorta
Graft Complications
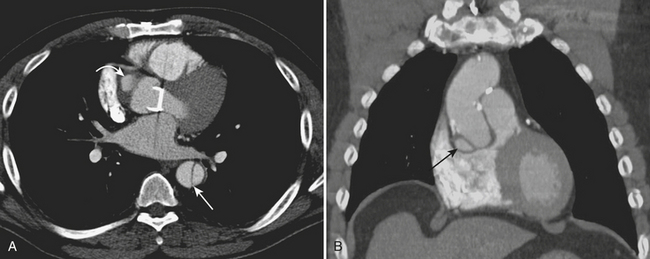
CT can identify important early mediastinal complications related to the grafting procedure, such as mediastinal abscess, anastomotic dehiscence, or postoperative bleeding. Delayed complications detected by CT include anastomotic dehiscence and leakage, pseudoaneurysm formation (Fig. 8-16), infection, and new or progressing disease of the native aorta. Paravalvular leaks can also be seen after aortic valve repair.
Stent-Graft Complications
CTA can accurately identify and classify endoleaks. Five types of endoleaks described include type I, flow around the graft attachment sites (proximal or distal); type II, retrograde flow from side branches into the aneurysmal sac; type III, graft disruption or graft malfunction; type IV, graft leaking or porosity; and type V, endotensive enlargement of the aneurysm sac without a visualized leak. An initial unenhanced scan should be performed to avoid mistaking high-density mineralization or postoperative materials for contrast leakage. A late acquisition is recommended, particularly for detecting type II endoleaks, since retrograde filling of the sac may be apparent only on the delayed phase. In addition, very narrow windows are recommended to detect subtle endoleaks. Interval increase in aneurysm diameter or sac volume can be an indirect sign of an endoleak. Axial CTA images can then confirm the presence and indicate the cause of the endoleak based on the configuration and localization of the leakage in relation to the stent-graft. Type I endoleaks are readily detectable (Fig. 8-17) and can cause a substantial increase in aneurysm size and lead to rupture if undetected or untreated. However, in the early postoperative period, CTA can detect very small type I endoleaks that have a tendency to seal spontaneously. Serial CTA can be used to monitor these cases for persistent leak and associated interval increases in aneurysm dimensions.
Assessment of Aortic Coarctation after Surgery
CTA imaging assesses all clinically relevant anatomic features after surgical treatment of aortic coarctation. When directly compared with the imaging findings of catheter angiography and correlated with pressure measurements, CTA was found to be reliable enough to replace catheter angiography in the postoperative care of patients with coarctation. CTA detects subtle findings of stenosis, aneurysms, pouches, and intimal flaps before any clinical complications are manifested (Fig. 8-18). Intramural calcification at the former coarctation site marks the site at risk for potential future dissection and atherosclerotic disease. Detection of such calcification is an advantage of CT over MRI, given the susceptibility artifact usually encountered with the latter. CTA also provides the necessary information for those patients requiring further invasive procedures. Narrowing on 3D images should be further evaluated by systolic pressure gradients directed in the region of morphologic abnormality, thereby decreasing contrast dose and number of projections needed.
IMAGING EVALUATION OF PULMONARY EMBOLISM
Imaging Techniques
The following paragraphs discuss the imaging techniques for pulmonary embolism (Box 8-1).
Chest Radiograph
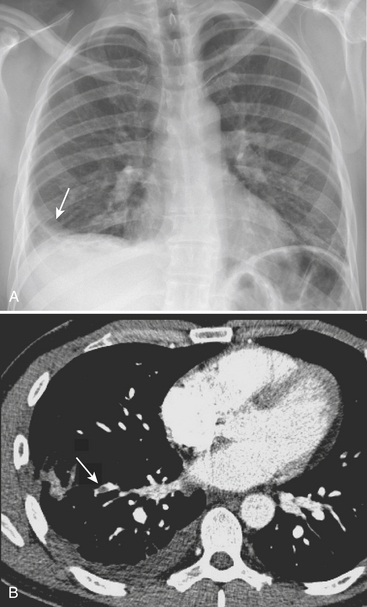
In the observations from the PIOPED study, the most common radiographic findings in patients with PE were atelectasis and/or parenchymal areas of increased opacity in the lower lung zones and pleural effusions. A negative chest radiograph had a negative predictive value of only 74%. Although infrequently observed, some CXR findings have been described as more suggestive of PE. The Hampton sign refers to a well-defined pleural-based area of increased opacity with a convex medial border, and relates to pulmonary infarction. It can help to differentiate pulmonary infarct from pleural thickening or effusion (Fig. 8-19). The Westermark sign refers to an area of oligemia distal to a large vessel that is occluded by PE. In the PIOPED study, oligemia was relatively uncommon but a highly specific radiographic finding for prediction of PE at angiography. The Fleischner sign refers to a prominent central artery, caused either by pulmonary hypertension secondary to peripheral emboli or by distention of the vessel by a large clot (Fig. 8-20). However, the PIOPED study concluded that there were no differences between patients with PE and those without PE in regard to most chest radiographic findings. Thus, the chest radiograph cannot exclude or confirm the presence of PE. It is most useful for detecting alternate chest pathologies and as a correlate exam for a ventilation-perfusion exam.
Ventilation-Perfusion Scan
Ventilation-perfusion (VQ) scan is often the second modality of choice when pulmonary embolism is suspected. Data from the PIOPED study showed that although it has a very high sensitivity (98%), the specificity is very low (10%). Technetium 99m macroaggregate albumin (MAA) is the radiopharmaceutical agent used for pulmonary perfusion, and it is injected intravenously with the patient in a supine position. If the perfusion images and the chest film are normal, the study is of low probability and the exam may be concluded. Otherwise, ventilation imaging is performed with xenon 133. The scintigraphic hallmark of pulmonary embolism is a perfusion defect corresponding to a bronchopulmonary segment that displays normal ventilation and with no correlating abnormality in the chest film. The modified PIOPED criteria are used for interpretation, determining if the study is normal, and determining if it is of low, intermediate, or high probability (Box 8-2). This subject is discussed in depth in Nuclear Medicine: The Requisites and in Chapter 12.
Box 8-2 Revised PIOPED Ventilation-Perfusion Scan Criteria
INTERMEDIATE PROBABILITY (20%–70%)
LOW PROBABILITY (≤19%)
From Gottschalk A, Sostman HD, Coleman RE Ventilation-perfusion scintigraphy in the PIOPED study. Part II: Evaluation of the scintigraphic criteria and interpretations. J Nucl Med 34:1119–1126, 1993. Reprinted with permission.
∗ Two large mismatched perfusion defects are borderline for “high probability.” Individual readers may correctly interpret individual scans with this pattern as “high probability.” In general, it is recommended that more than this degree of mismatch be present for the “high probability” category.
† Very extensive matched defects can be categorized as “low probability.” Single VQ matches are borderline for “low probability” and thus should be categorized as “intermediate” in most circumstances by most readers, although individual readers may correctly interpret individual scans with this pattern as “low probability.”
CT Pulmonary Angiography and CT Venography
CT Pulmonary Angiography
Technical Factors in CTPA
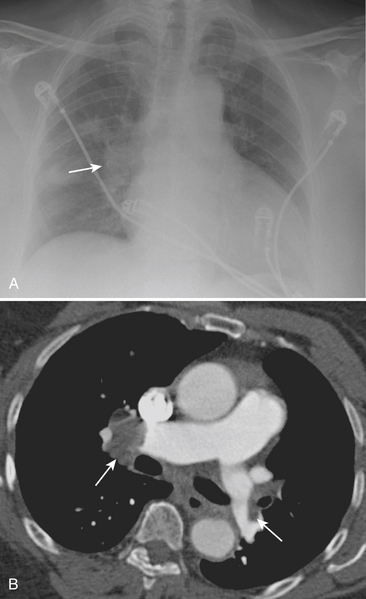
When interpreting a CTPA examination, the quality of the study should be assessed and reported, as it reflects diagnostic confidence. Adequate contrast opacification is essential at all levels of the pulmonary arterial tree (Fig. 8-21). If the entirety of the pulmonary arterial tree is not well opacified, one cannot state to which level of the pulmonary arterial branches one can confidently evaluate for the presence of pulmonary embolism.
Diagnostic Criteria for CTPA
The following CTPA findings are used as diagnostic criteria for acute pulmonary embolism:
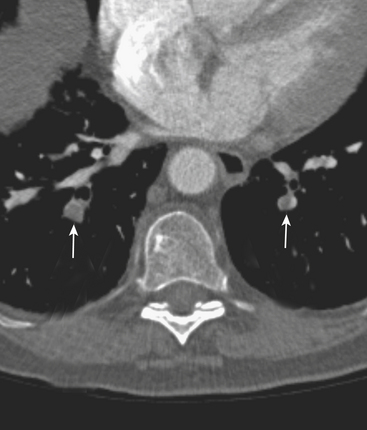
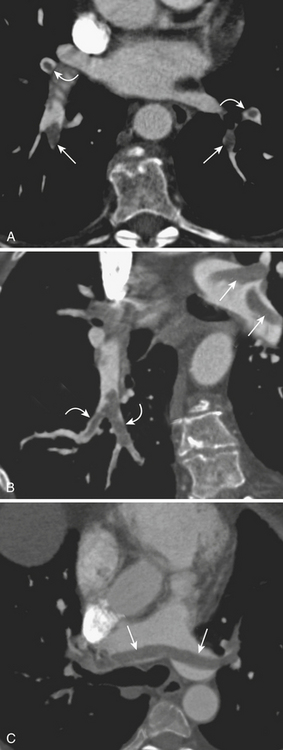
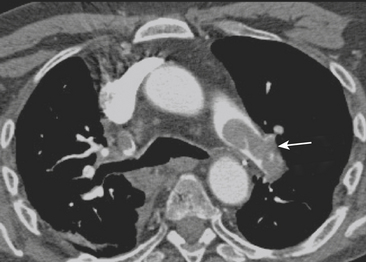
Figure 8-25 Acute pulmonary embolism. Axial CT image shows massive clot in the left main pulmonary artery (arrow).
The CTPA findings used as diagnostic criteria for chronic PE include:
Prognostic Factors for CTPA
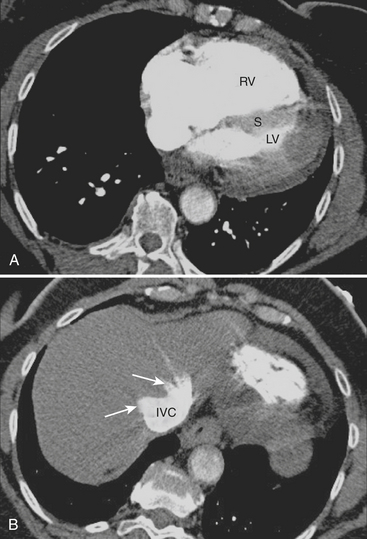
Most late deaths in patients diagnosed with PE are due to underlying diseases. However, the main cause of death within 30 days is right ventricular failure. It is therefore important to identify patients at high risk of right ventricular failure in order to establish the appropriate treatment. Thrombolysis, catheter intervention, and surgical embolectomy may be performed as adjuncts to anticoagulation and may reverse right ventricular failure and reduce the risk of recurrence and death. With newer-generation scanners, standardized cardiac views can be obtained when performing CTPA. Right ventricle enlargement on a four-chamber view in the setting of acute PE correlates with right ventricle dysfunction by echocardiography (Fig. 8-27). Right ventricle enlargement is present when the ratio of the diameter of the right ventricle to the diameter of the left ventricle is greater than 0.9. Other cardiovascular parameters seen on CTPA have been evaluated as predictors of mortality in patients with severe PE. These include findings such as reflux of contrast into the inferior vena cava, convex leftward bowing of the interventricular septum, and increased diameter of the azygos vein, superior vena cava, and aorta.
MR Pulmonary Angiography and MR Venography
MR Pulmonary Angiography
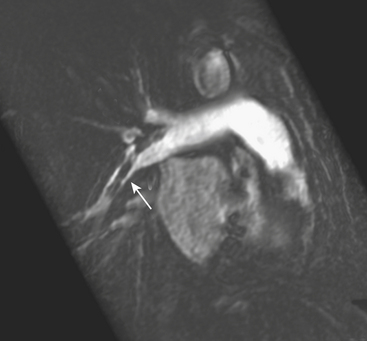
Emboli are detected as intraluminal filling defects or vascular cutoffs, just as in CTPA (Fig. 8-28). Gupta and colleagues emphasized the need to perform and review overlapping, small, subvolume targeted MIP images, as pulmonary emboli often lodge where abrupt changes in vessel diameter are found; this typically occurs where vessels branch. It may be difficult on single thin coronal sections to tell the difference between a normal bifurcation and a small embolus, and the review of targeted MIP images may help with this distinction. Because there is often some degree of unwanted pulmonary venous opacification, it is useful to obtain larger subvolume MIP images so that vessels can be followed to the hilum, thus allowing the differentiation of arteries and veins. Major drawbacks for pulmonary MRA include cardiac and respiratory motion artifacts, losses of signal in the presence of complex blood flow patterns, and magnetic susceptibility effects from the air-containing lungs.
CORONARY CT ANGIOGRAPHY IN THE ED
Evaluation of Chest Pain for Exclusion of Acute Coronary Syndrome
Coronary Artery Anatomy
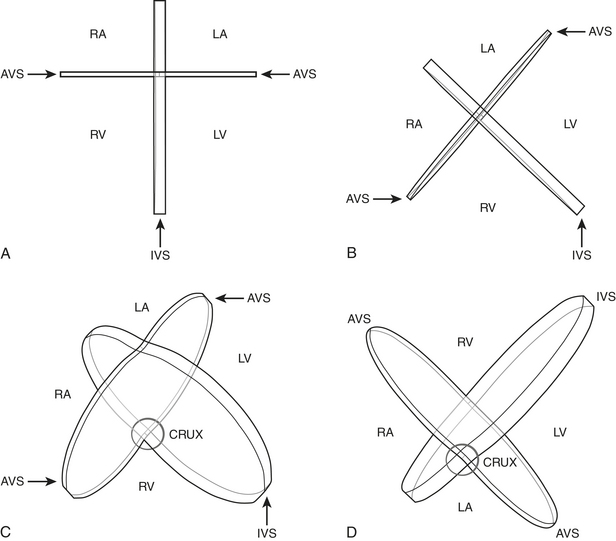
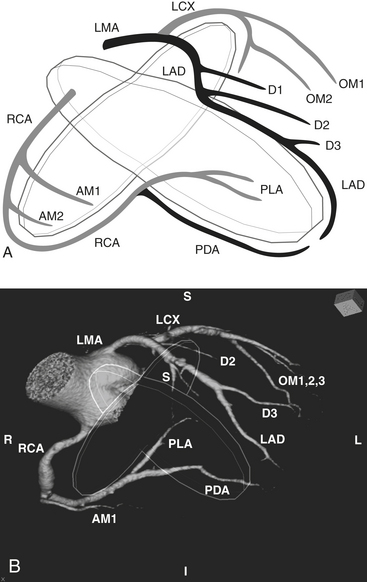
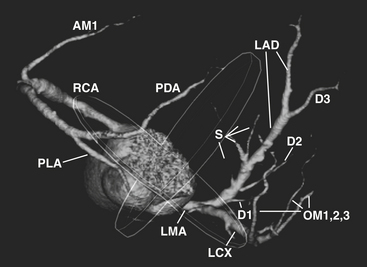
The word coronary is derived from the Latin coronalis, which means “of, relating to, or resembling a crown.” The coronary arteries can be envisioned as a set of two crossing rings which encircle (or “crown”) the heart, with the rings defined by the intersecting atrioventricular sulcus and interventricular septum (Fig. 8-29). Respectively, the RCA and left circumflex (LCX) arteries mirror one another and course within the right and left hemi-rings of the atrioventricular sulcus, while the left anterior descending (LAD) and posterior descending (PDA) arteries course within the anterior and posterior hemi-rings formed over the interventricular septum (Figs. 8-30 and 8-31).
RCA
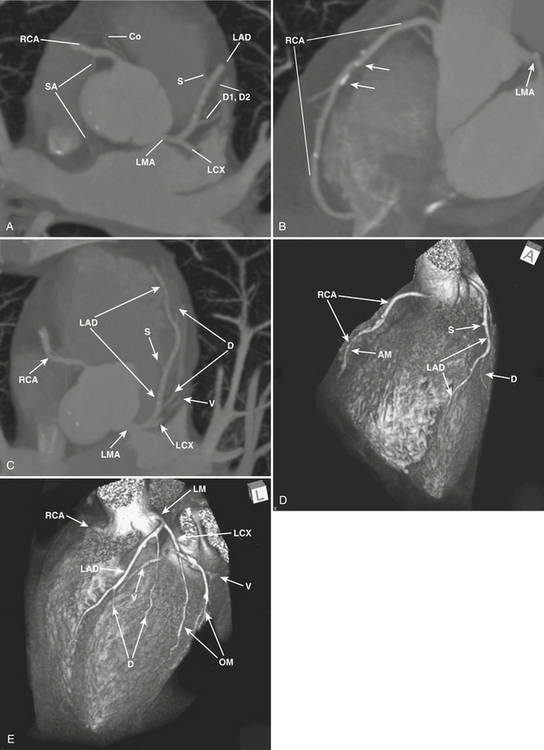
After arising from the right (or anterior) sinus of Valsalva, the RCA courses deep to the right atrial appendage within the right AV groove, following the AV groove until it intersects with the posterior interventricular septum, at the “crux” of the heart (see Fig. 8-29). For the purposes of clinical description of lesion location, the RCA is often divided into proximal (ostium to first main right ventricular branch), mid (first main branch to the acute margin), and distal (acute margin to the crux). Usually, the first branch off the RCA is the conus branch; however, the conus branch often (23% to 51%) has a separate ostium off the right sinus of Valsalva. The conus branch courses anteriorly in an arc over the conus or infundibulum and may form a collateral bridge to LAD branches (the “arc of Vieussens”), thus offering protection in cases of proximal RCA or LMA/LAD disease. The sinoatrial (SA) nodal branch/artery most commonly arises from the proximal RCA (60%) but often originates from the LCX (40%). This branch extends posteriorly along the interatrial groove and supplies branches to both atria as well as the SA node. The right ventricular, or acute marginal, branches emerge at right or acute angles from the RCA and vary in size and number as they supply the right ventricular myocardium. In right dominant circulations, the RCA continues in the atrioventricular sulcus until it intersects with the posterior interventricular septum at the crux, where the RCA gives off the PDA branch that courses along the posterior interventricular septum, supplying the lower third of the interventricular septum, as well as PLA branches (which supply the inferior wall of the left ventricle and the interventricular septum) and the AV nodal branch (which extends cephalad from the crux to the AV node).
LMA
The LMA arises from the left sinus of Valsalva and follows a short (usually 1 to 2 cm) course between the pulmonary trunk anteriorly and left atrial appendage posteriorly (Fig. 8-32). It normally bifurcates into the LAD and LCX arteries but may trifurcate with a third intermediate artery arising between the LAD and LCX. This intermediate artery has various names, including “ramus intermediate” or “ramus medians,” “median artery,” “left diagonal artery,” and “straight left ventricular artery,” and supplies different portions of the anterolateral left ventricular wall.
LAD
The LAD arises from the LMA and courses around the left side of the pulmonary trunk toward the proximal interventricular septum where it takes a roughly 90-degree downward turn and courses over the interventricular septum toward the apex (see Fig. 8-32). This downward turn over the proximal interventricular septum has clinical significance, as this is the point where the LAD becomes amenable to surgical bypass. The second diagonal branch often originates near this downward turn. By convention, the LAD is divided into three segments: proximal (LAD origin to first septal perforator), middle (first septal perforator to downward turn along interventricular sulcus/origin of second diagonal), and distal (second diagonal origin to vessel end). The LAD provides two major types of branches: the septal perforators, which generally arise at 90-degree angles from the LAD and penetrate into the interventricular septum to supply the upper two thirds of the septum, and the diagonal (D) branches, which arise at acute angles from the LAD to course over and supply the anterior/anterolateral wall of the left ventricle. The number of diagonal arteries varies, and they are named in order of their origin from the LAD (D1, D2, etc.). The LAD usually extends over the apex to supply the distal inferior wall and interventricular septum, but the PDA may supply these regions as well, and this distal LAD-PDA confluence is a source of potential collateralization in cases of RCA or LAD disease.
Coronary Artery Anomalies
Coronary artery anomalies are a heterogeneous constellation of anatomic variants (Fig. 8-33). While relatively uncommon (0.46% to 5.6% of normal population), certain forms carry elevated risk, making it important for the radiologist to detect and accurately define these variants. In particular, coronary anomalies cause up to 19% to 30% of sudden deaths in athletes. CCTA is superior to conventional angiography in delineating the ostial origin and proximal path of anomalous coronary arteries. Anomalies may be classified by the presence or absence of a shunt, or they may be classified as “malignant” or “nonmalignant” depending on their course and propensity to cause clinical symptoms or sudden death.
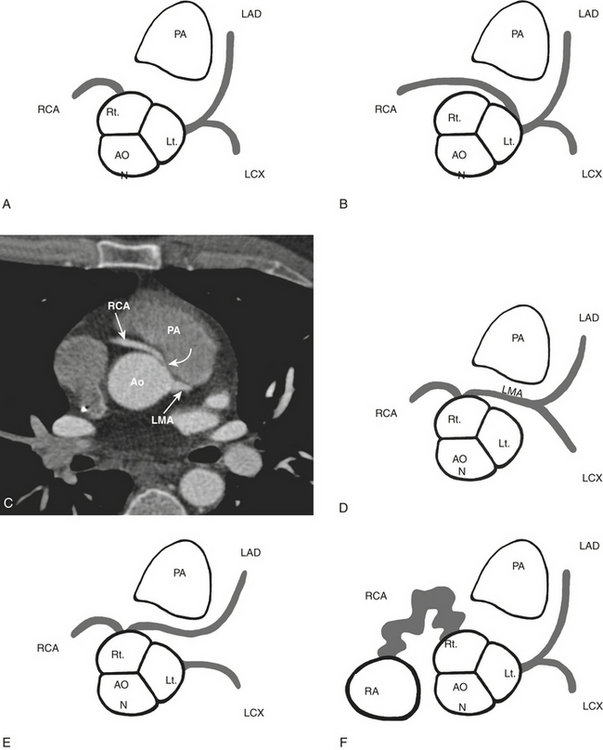
Malignant variants (associated with an increased risk of MI and sudden death) primarily consist of anomalous artery origins that result in an interarterial course, with the anomalous artery coursing between the aorta and pulmonary artery (see Fig. 8-33). Several factors contribute to jeopardizing the anomalous vessel in this position, including compression of the vessel between the aorta and pulmonary artery, especially during exercise, and acute-angle take-off and narrow ostial area of the proximal vessel resulting in diminished flow or occlusion. The most common interarterial variant is the RCA arising from the left sinus of Valsalva and coursing between the aorta and pulmonary artery to reach the right AV sulcus, although an LMA or LAD arising from the right sinus of Valsalva with an interarterial course may pose a higher risk to the patient. Anomalous coronary artery origin from the pulmonary artery is also considered malignant and is associated with myocardial ischemia and sudden death in early childhood.
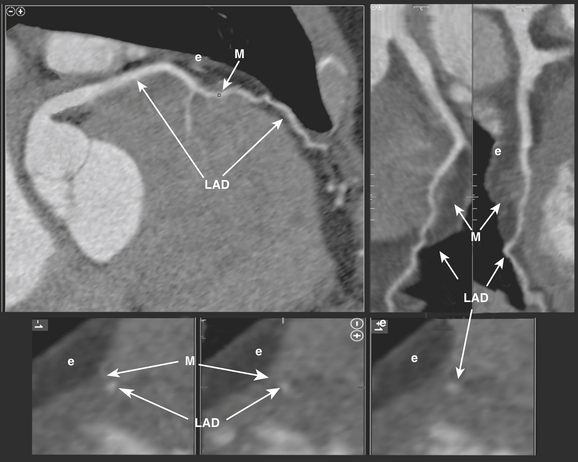
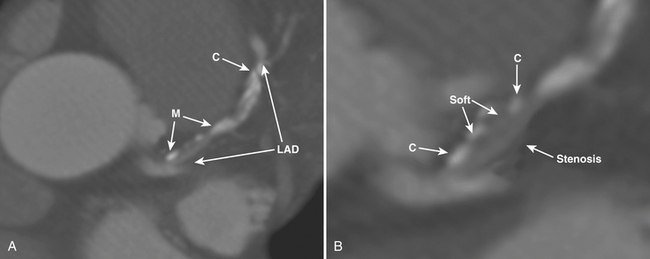
Myocardial bridging occurs when a coronary artery (usually the middle third of the LAD) deviates from a normal epicardial course to reside under superficial myocardial fibers for a short distance before reemerging to a normal epicardial position (Fig. 8-34). The prevalence and clinical significance of myocardial bridging are nebulous. While angiographic series report prevalence between 0.5% and 2.5%, pathologic series have reported prevalence between 15% and 85%. Generally thought to be benign, any specific case of myocardial bridging may have clinical significance, and cases have been associated with angina, myocardial ischemia and infarction, and sudden death. CCTA is effective at diagnosing myocardial bridging, due to its ability to visualize the myocardium as well as coronary arteries. The ability to image in diastolic and systolic phases may help gauge the clinical significance by defining the severity of lumenal compromise during systole. Interestingly, the bridged segment is often free of atherosclerotic disease. Because of this potential for clinical significance, myocardial bridging warrants reporting when encountered.
Coronary artery fistulas are abnormal communications between a coronary artery and another vascular structure such as the right ventricle (45%), the right atrium (25%), a pulmonary artery (15%), or the superior vena cava, left atrium, or left ventricle (less than 10%) (see Fig. 8-33). The involved coronary is often dilated and tortuous, and the anomalous connection may result in a left-to-right shunt, a hemodynamic steal phenomenon, and hypoperfusion or ischemia of the myocardium normally perfused by the involved vessel.
Image Evaluation
Coronary Artery Stenosis
While acquiring an ECG-gated CCTA exam, images are obtained in each of (generally) 10 to 20 phases throughout the cardiac cycle. Images from the (usually diastolic) phase in which the least coronary motion artifact is present are then utilized for image analysis. To evaluate CCTA images, review of the axial images as well as MPR and MIP images is performed (Figs. 8-35 and 8-36). Although reformatted images are valuable in defining and delineating stenoses, the axial images remain the cornerstone of the evaluation, as virtually all pathologies can be identified on the axial images. Once a stenosis is detected on the axial images, further evaluation of the lesion is best performed with two long-axis reformats through the vessel. Generally, 3- to 5-mm thin-slab MIP images are also useful for evaluating lesions in the long axis, and interactive evaluation is facilitated with sliding or rotating thin-slab MIP images. The interpreter should be aware that when using MIP images, stenoses may be masked or obscured by volume averaging.
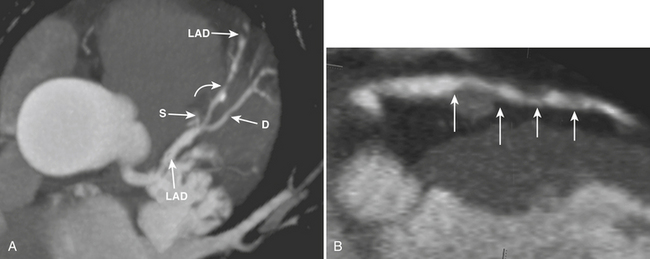
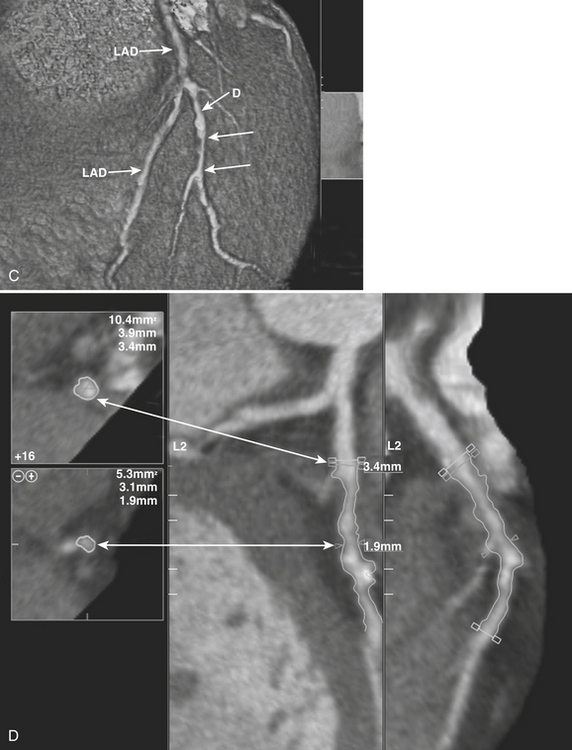
Once detected, a stenosis can be visually measured, or estimated, using a nearby “normal” segment of the vessel as a reference, or software-assisted quantitative assessment of the stenosis may be employed (see Fig. 8-35). Comparison of the visual estimate/measurement method versus quantitative software-assisted assessment of stenoses has revealed that software-assisted assessment provides higher accuracy for about the same user time required for visual estimation. However, while 64-slice CCTA has shown high accuracy in detecting 50% or greater stenoses, the ability to provide exact, quantitative measures of stenosis severity is hampered by current limits in spatial resolution. Because of this, the severity of stenoses is often classified in quartiles (0% to 25%, 26% to 50%, 51% to 75%, 76% or greater) or tertiles (0% to 30%, 31% to 70%, 71% to 99%), or some other variant, depending on local radiologist/cardiologist preferences.
Atherosclerotic Plaque Imaging
For coronary plaque analysis, CCTA has inherent limits in spatial and contrast resolution that prevent discernment of many of the components of plaque. However, calcium is well defined by CCTA and can be distinguished from “soft” plaque components (see Fig. 8-36). Coronary calcium scoring, or quantification of calcific coronary atherosclerotic plaque utilizing electron beam and MDCT, has been in use for over a decade. Generally, a threshold of 130 Hounsfield units is used to define calcified atherosclerotic plaque. “Soft,” or noncalcified, plaque can be discerned from calcified plaque on CCTA in this manner. Noncalcified soft plaque is heterogeneous in composition, consisting of various quantities of components as described above. On CCTA, soft coronary artery plaque is visualized as a structure that can be clearly assignable to the vessel wall (in at least two views) with densities less than the intraluminal contrast (see Fig. 8-36). On CCTA, plaque is generally classified as calcified, noncalcified, or mixed.
Aberle D., Wierner-Kronish J., Webb R., et al. Hydrostatic versus increased permeability pulmonary edema: Diagnosis based on radiographic criteria in critically ill patients. Radiology. 1988;168:73-79.
Achenbach S. Computed tomography coronary angiography. J Am Coll Cardiol. 2006;48:1919-1928.
Alpert J.S., Smith R., Carlson J., et al. Mortality in patients treated for pulmonary embolism. JAMA. 1976;236:1477-1480.
Anderson F.A.Jr., Wheeler H.B., Goldberg R.J., et al. A population-based perspective of the hospital incidence and case-fatality rates of deep vein thrombosis and pulmonary embolism. The Worcester DVT Study. Arch Intern Med. 1991;151:933-938.
Bae K.T. Peak contrast enhancement in CTA and MRA: When does it occur and why? Radiology. 2000;216:872-880.
Becattini C., Agnelli G. Acute pulmonary embolism: Risk stratification in the emergency department. Intern Emerg Med. 2007;2:119-129.
Begemann P.G., Bonacker M., Kemper J., et al. Evaluation of the deep venous system in patients with suspected pulmonary embolism with multi-detector CT: A prospective study in comparison to Doppler sonography. J Comput Assist Tomogr. 2003;27:399-409.
Bejvan S.M., Godwin J.D. Pneumomediastinum: Old signs and new signs. AJR Am J Roentgenol. 1996;166:1041-1048.
Brink J.A., Woodard P.K., Horesh L., et al. Depiction of pulmonary emboli with spiral CT: Optimization of display window settings in a porcine model. Radiology. 1997;204:703-708.
Busch S., Johnson T.R., Nikolaou K., et al. Visual and automatic grading of coronary artery stenoses with 64-slice CT angiography in reference to invasive angiography. Eur Radiol. 2007;17:1445-1451.
Chan S.S. Emergency bedside ultrasound to detect pneumothorax. Acad Emerg Med. 2003;10:91-94.
Chiles C., Woodard P.K., Gutierrez F.R., et al. Metastatic involvement of the heart and pericardium: CT and MR imaging. Radiographics. 2001;21:439-449.
Coche E.E., Muller N.L., Kim K.I., et al. Acute pulmonary embolism: Ancillary findings at spiral CT. Radiology. 1998;207:753-758.
Cook J.V., Kyriou J. Radiation from CT and perfusion scanning in pregnancy. BMJ. 2005;331:350.
Dake M.D., Miller D.C., Semba C.P., et al. Descending thoracic aortic aneurysm: CT findings after endovascular stent-graft placement. Radiology. 1999;212:169-174.
Dalen J.E. Pulmonary embolism: What have we learned since Virchow? Treatment and prevention. Chest. 2002;122:1801-1817.
de Hoyos A., Sundaresan S. Thoracic empyema. Surg Clin North Am. 2002;82(viii):643-671.
DeBakey M.E., McCollum C.H., Crawford E.S., et al. Dissection and dissecting aneurysms of the aorta: Twenty-year follow-up of five hundred twenty-seven patients treated surgically. Surgery. 1982;92:1118-1134.
Demos T.C., Posniak H.V., Marsan R.E. CT of aortic dissection. Semin Roentgenol. 1989;22:22-37.
Earnest F.4th, Muhm J.R., Sheedy P.F. Roentgenographic findings in thoracic aortic dissection. Mayo Clin Proc. 1979;54:43-50.
Elefteriades J.A. Natural history of thoracic aortic aneurysms: Indications for surgery, and surgical versus nonsurgical risks. Ann Thorac Surg. 2002;74:1877-1880.
Erasmus J.J., Goodman P.C., Patz E.F. Management of malignant pleural effusions and pneumothorax. Radiol Clin North Am. 2000;38:375-383.
Erbel R., Engberding R., Daniel W., et al. Echocardiography in diagnosis of aortic dissection. Lancet. 1989;1:457-461.
Ersoy H., Goldhaber S.Z., Cai T., et al. Time-resolved MR angiography: A primary screening examination of patients with suspected pulmonary embolism and contraindications to administration of iodinated contrast material. AJR Am J Roentgenol. 2007;188:1246-1254.
Evans A.J., Sostman H.D., Knelson M.H., et al. 1992 ARRS Executive Council Award. Detection of deep venous thrombosis: Prospective comparison of MR imaging with contrast venography. AJR Am J Roentgenol. 1993;161:131-139.
Evans A.J., Sostman H.D., Witty L.A., et al. Detection of deep venous thrombosis: Prospective comparison of MR imaging and sonography. J Magn Reson Imaging. 1996;6:44-51.
Farkouh M.E., Smars P.A., Reeder G.S., et al. A clinical trial of a chest pain observation unit for patients with unstable angina. New Engl J Med. 1998;339:1882-1888.
Fisher E.R., Stern E.J., Godwin J.D., et al. Acute aortic dissection. Radiographics. 1994;14:1263-1271.
Fisher R.G., Sanchez-Torres M., Whigham C.J., Thomas J.W., et al. “Lumps” and “bumps” that mimic acute aortic and brachiocephalic vessel injury. Radiographics. 1997;17:825-834.
Fiss D.M. Normal coronary anatomy and anatomic variations: Applications in cardiac imaging. Appl Radiol. 2007;36(Suppl):14-26.
Fricke B.L., Donnelly L.F., Frush D.P., et al. In-plane bismuth breast shields for pediatric CT: Effects on radiation dose and image quality using experimental and clinical data. AJR Am J Roentgenol. 2003;180:407-411.
Froehner S.C., Wagner M., Brunn J., et al. CT angiography for assessment of coronary artery anomalies. In: Schoepf U.J., editor. CT of the Heart: Principles and Applications. Totowa, NJ: Humana Press, 2004.
Gallagher M.J., Raff G.L. Use of multislice CT for the evaluation of emergency room patients with chest pain. Catheter Cardiovasc Interv. 2007;71:92-99.
Ganaha F., Miller D.C., Sugimoto K., et al. Prognosis of intramural hematoma with and without penetrating ulcer: A clinical and radiological analysis. Circulation. 2002;106:342-348.
Ghaye B., Ghuysen A., Willems V., et al. Severe pulmonary embolism: Pulmonary artery clot load scores and cardiovascular parameters as predictors of mortality. Radiology. 2006;239:884-891.
Ghaye B., Remy J., Remy-Jardin M. Non-traumatic thoracic emergencies. CT diagnosis of acute pulmonary embolism: The first 10 years. Eur Radiol. 2002;12:1886-1905.
Gibler W.B., Cannon C.P., Blomkalns A.L., et al. American Heart Association Scientific Statement: Practical Implementation of the Guidelines for Unstable Angina/Non–ST-Segment Elevation Myocardial Infarction in the Emergency Department. A scientific statement from the American Heart Association Council on Clinical Cardiology (Subcommittee on Acute Cardiac Care), Council of Cardiovascular Nursing, and Quality of Care and Outcomes Research Interdisciplinary Working Group, in collaboration with the Society of Chest Pain Centers. Circulation. 2005;111:2699-2710.
Giuntini C., Di Ricco G., Marini C., et al. Pulmonary embolism: Epidemiology. Chest. 1995;107(Suppl 1):3S-9S.
Goldstein J.A. Cardiac tamponade, constrictive pericarditis, and restrictive cardiomyopathy. Curr Probl Cardiol. 2004;29:503-567.
Goldstein J.A., Gallagher M.J., O’Neill W.W., et al. A randomized controlled trial of multi-slice coronary computed tomography for evaluation of acute chest pain. J Am Coll Cardiol. 2007;49:863-871.
Golzarian J., Dussaussois L., Abada H.T., et al. Helical CT of aorta after endolumenal stent-graft therapy: Value of biphasic acquisition. AJR Am J Roentgenol. 1998;171:329-331.
Gomes M.N., Choyke P.L. Infected aortic aneurysms: CT diagnosis. J Cardiovasc Surg. 1992;33:684-689.
Gordon R. The deep sulcus sign. Radiology. 1980;136:25-27.
Gorich J., Rilinger N., Sokiranski R., et al. Leakages after endovascular repair of aortic aneurysms. Radiology. 1999;213:767-772.
Gosselin M.V., Rassner U.A., Thieszen S.L., et al. Contrast dynamics during CT pulmonary angiogram: Analysis of an inspiration associated artifact. J Thorac Imaging. 2004;19:1-7.
Gottschalk A., Sostman H.D., Coleman R.E., et al. Ventilation-perfusion scintigraphy in the PIOPED study. Part II: Evaluation of the scintigraphic criteria and interpretations. J Nucl Med. 1993;34:1119-1126.
Gottschalk A., Stein P.D., Goodman L.R., Sostman H.D. Overview of prospective investigation of pulmonary embolism diagnosis II. Semin Nucl Med. 2002;32:173-182.
Gotway M.B., Dawn S.K., et al. Thoracic aorta imaging with multisclice CT. Radiol Clin North Am. 2003;41:521-543.
Gotway M.B., Marder S.R., Hanks D.K., et al. Thoracic complications of illicit drug use: An organ system approach. Radiographics. 2002;22(Special issue):S119-S135.
Guinet C., Buy J.N., Ghossain M.A., et al. Aortic anastomotic pseudoaneurysms: US, CT, MR, and angiography. J Comput Assist Tomogr. 1992;16:182-188.
Gupta A., Frazer C.K., Ferguson J.M., et al. Acute pulmonary embolism: Diagnosis with MR angiography. Radiology. 1999;210:353-359.
Gurney J.W. No fooling around: Direct visualization of pulmonary embolism. Radiology. 1993;188:618-619.
Hager A., Kaemmerer H., Leppert A., et al. Follow-up of adults with coarctation of the aorta: Comparison of helical CT and MRI, and impact on assessing diameter changes. Chest. 2004;126:1169-1176.
Halliday K.E., Al-Kutoubi A. Draped aorta: CT sign of contained leak in aortic aneurysms. Radiology. 1996;199:41-43.
Hansell D.M., Armstrong P., Lynch D.A., McAdams H. Imaging of Diseases of the Chest. Philadelphia: Elsevier Mosby; 2005.
Harris J.A., Bis K.G., Glover J.L., et al. Penetrating atherosclerotic ulcers of the aorta. J Vasc Surg. 1994;19:90-98.
Hayashi H., Matsuoka Y., Sakamoto I., et al. Penetrating atherosclerotic ulcer of the aorta: Imaging features and disease concept. Radiographics. 2000;20:995-1005.
Hazirolan T., Canyigit M., Karcaaltincaba M., et al. Myocardial bridging on MDCT. AJR Am J Roentgenol. 2007;188:1074-1080.
Heart Disease and Stroke Statistics – 2007 Update, American Heart Association.
Heit J.A. Venous thromboembolism epidemiology: Implications for prevention and management. Semin Thromb Hemost. 2002;28(Suppl 2):S3-S13.
Hoffmann U., Ferencik M., Cury R.C., et al. Coronary CT angiography. J Nucl Med. 2006;47:797-806.
Hoffmann U., Nagurney J.T., Moselewski F., et al. Coronary multidetector computed tomography in the assessment of patients with acute chest pain. Circulation. 2006;114:2251-2260.
Hoffmann U., Pena A.J., Cury R.C., et al. Cardiac CT in emergency department patients with acute chest pain. Radiographics. 2006;26:963-980.
Hoffmann U., Pena A.J., Moselewski F., et al. MDCT in the early triage of patients with acute chest pain. AJR Am J Radiol. 2006;187:1240-1247.
Hutschala D., Fleck T., Czerny M., et al. Endolumenal stent-graft placement in patients with acute aortic dissection type B. Eur J Cardiothorac Surg. 2002;21:964-969.
Jeudy J., White C.S. Evaluation of acute chest pain in the emergency department: Utility of multidetector computed tomography. Semin Ultrasound CT MR. 2007;28:109-114.
Johnson K.W., Rutherford R.B., Tilson M.D., et al. Suggested standards for reporting on arterial aneurysms. J Vasc Surg. 1991;13:452-458.
Jones G, Sharma A, Bennett B, et al: Innovations in Operations. Tomorrow’s ED: An Emergency Diagnostic Center Proprietary Analysis by Sg2 Health Care Intelligence, Skokie, Ill, 2007. Available at www.sg2.com.
Kaji S., Akasaka T., Horibata Y., et al. Long-term prognosis of patients with type A aortic intramural hematoma. Circulation. 2002;106(Suppl 1):S248-S252.
Kaji S., Nishigami K., Akasawa T., et al. Prediction of progression or regression of type A aortic intramural hematoma by computed tomography. Circulation. 1999;100:II281-286.
Kalra M.K., Maher M.M., Toth T.L., et al. Strategies for CT radiation dose optimization. Radiology. 2004:619-628.
Kanne J.P., Lalani T.A. Role of computed tomography and magnetic resonance imaging for deep venous thrombosis and pulmonary embolism. Circulation. 2004;109(12, Suppl 1):I15-21.
Kapoor V., Ferris J.V., Fuhrman C.R. Intimomedial rupture: A new CT finding to distinguish true from false lumen in aortic dissection. AJR Am J Roentgenol. 2004;183:109-112.
Kasper W., Konstantinides S., Geibel A., et al. Management strategies and determinants of outcome in acute major pulmonary embolism: Results of a multicenter registry. J Am Coll Cardiol. 1997;30:1165-1171.
Kazerooni E.A., Bree R.L., Williams D.M. Penetrating atherosclerotic ulcers of the descending thoracic aorta: Evaluation with CT and distinction from aortic dissection. Radiology. 1992;183:759-765.
Kim S.Y., Leo J.B., Do K.H., et al. Coronary artery anomalies: Classification and ECG-gated multi-detector row CT findings with angiographic correlation. Radiographics. 2006;26:317-334.
Ko S.M., Kwon J.H. Multidetector-row CT coronary angiographic finding of myocardial bridging. Int J Card Imaging. 2007;23:71.
Kuhlman J.E., Pozniak M.A., Collins J., et al. Radiographic and CT findings of blunt chest trauma: Aortic injuries and looking beyond them. Radiographics. 1998;18:1085-1106. discussion 1107–1108; quiz 1
Lande A., Berkmen Y.M. Aortitis: Pathologic, clinical and arteriographic review. Radiol Clin North Am. 1976;14:219-240.
Langwieler T.E., Steffani K.D., Bogoevski D.P., et al. Spontaneous pneumomediastinum. Ann Thorac Surg. 2004;78:711-713.
Leber A.W., Becker A., Knez A., et al. Accuracy of 64–slice computed tomography to classify and quantify plaque volumes in the proximal coronary system: A comparative study using intravascular ultrasound. J Am Coll Cardiol. 2006;47:672-677.
Leber A.W., Knez A., von Ziegler F., et al. Quantification of obstructive and nonobstructive coronary lesions by 64-slice computed tomography: A comparative study with quantitative coronary angiography and intravascular ultrasound. J Am Coll Cardiol. 2005;46:147-154.
Ledbetter S., Stuk J.L., Kaufman J.A. Helical (spiral) CT in the evaluation of emergent thoracic aortic syndromes. Radiol Clin North Am. 1999;37:575-589.
LePage M.A., Quint L.E., Sonnad S.S., et al. Aortic dissection: CT features that distinguish true lumen from false lumen. AJR Am J Roentgenol. 2001;177:207-211.
Libby P. Atherosclerosis: Disease biology affecting the coronary vasculature. Am J Cardiol. 2006;98(Suppl 12A):3Q-9Q.
Light R.W. Parapneumonic effusions and empyema. Proc Am Thorac Soc. 2006;3:75-80.
Macedo T.A., Stanson A.W., Oderich G.S., et al. Infected aortic aneurysms: Imaging findings. Radiology. 2004;231:250-257.
Mark A.S., McCarthy S.M., Moss A.V., et al. Detection of abdominal aortic graft infection: Comparison of CT and In-labelled white blood cell scans. AJR Am J Roentgenol. 1985;144:315-318.
McCaig L.F., Nawar E.N. National Hospital Ambulatory Medical Care Survey: 2004 Emergency Department Summary. Advance Data from Vital and Health Statistics, no 372. Hyattsville, MD: National Center for Health Statistics; 2006.
McCollough C.H., Bruesewitz M.R., Kofler J.M. CT dose reduction and dose management tools: Overview of available options. Radiographics. 2006;26:503-512.
McLoud C. Thoracic Radiology: The Requisites. Philadelphia: Mosby; 1998.
Meaney J.F., Weg J.G., Chenevert T.L., et al. Diagnosis of pulmonary embolism with magnetic resonance angiography. N Engl J Med. 1997;336:1422-1427.
Miller L.A. Chest wall, lung, and pleural space trauma. Radiol Clin North Am. 2006;44(viii):213-224.
Mirvis S.E. Diagnostic imaging of acute thoracic injury. Semin Ultrasound CT MR. 2004;25:156-179.
Mirvis S.E., Shanmuganathan K. Imaging in Trauma and Critical Care. Philadelphia: WB Saunders; 2003.
Mita T., Arita T., Matsunaga N., et al. Complications of endovascular repair for thoracic and abdominal aortic aneurysm: An imaging spectrum. Radiographics. 2000;20:1263-1278.
Naghavi M., Libby P., Falk E., et al. From vulnerable plaque to vulnerable patient: A call for new definitions and risk assessment strategies—part I. Circulation. 2003;108:1664-1672.
Naghavi M., Libby P., Falk E., et al. From vulnerable plaque to vulnerable patient: A call for new definitions and risk assessment strategies—part II. Circulation. 2003;108:1772-1778.
Noppen M., Alexander P., Driesen P., et al. Werkgroep voor Medische Thoracoscopie en Interventionele Bronchoscopie. Quantification of the size of primary spontaneous pneumothorax: Accuracy of the Light index. Respiration. 2001;68:396-399.
O’Connor A.R., Morgan W.E. Radiological review of pneumothorax. BMJ. 2005;330:1493-1497.
O’Hara P.J., Borkowski G.P., Hertzer N.R., et al. Natural history of periprosthetic air on computerized axial tomographic examination of the abdomen following abdominal aortic aneurysm repair. J Vasc Surg. 1984;1:429-433.
Orton D.F., LeVeen R.F., Saigh J.A., et al. Aortic prosthetic graft infections: Radiologic manifestations and implications for management. Radiographics. 2000;20:977-993.
Oudkerk M., van Beek E.J., Wielopolski P., et al. Comparison of contrast-enhanced magnetic resonance angiography and conventional pulmonary angiography for the diagnosis of pulmonary embolism: A prospective study. The Lancet. 2002;359:1643-1647.
Park J.H., Chung J.W., Im J., et al. Takayasu arteritis: Evaluation of mural changes in the aorta and pulmonary artery with CT angiography. Radiology. 1995;196:89-93.
Patel K., Makeryus A., Meraj P., et al. 64-detector coronary angiography for the quantification of acute angle take-off and narrow ostial areas in patients with anomalous coronary arteries. Int. J Cardiovasc Imaging. 2007;23:103.
Porcel J.M., Light R.W. Diagnostic approach to pleural effusion in adults. Am Fam Physician. 2006;73:1211-1220.
Posniak H.V., Olson M.C., Demos T.C., et al. CT of thoracic aortic aneurysms. Radiographics. 1990;10:839-855.
Prasad S.R., Wittram C., Shepard A., et al. Standard-dose and 50%-reduced-dose chest CT: Comparing the effect on image quality. AJR Am J Roentgenol. 2002;179:461-465.
Quint L.E., Francis I.R., Williams D.M., et al. Synthetic interposition grafts of the thoracic aorta: Postoperative appearance on serial CT studies. Radiology. 1999;211:317-324.
Quint L.E., Williams D.E., Francis I.R., et al. Ulcerlike lesions of the aorta: Imaging features and natural history. Radiology. 2001;218:719-723.
Quiroz R., Kucher N., Schoepf U.J., et al. Right ventricular enlargement on chest computed tomography: Prognostic role in acute pulmonary embolism. Circulation. 2004;109:2401-2404.
Qureshi N.R., Gleeson F.V. Imaging of pleural disease. Clin Chest Med. 2006;27:193-213.
Qvarfordt P.G., Reilly L.M., Mark A.S., et al. Computerized tomographic assessment of graft incorporation after aortic reconstruction. Am J Surg. 1985;150:227-231.
Remy-Jardin M., Bahepar J., Lafitte J.J., et al. Multi-detector row CT angiography of pulmonary circulation with gadolinium-based contrast agents: Prospective evaluation in 60 patients. Radiology. 2006;238:1022-1035.
Remy-Jardin M., Remy J., Artaud D., et al. Spiral CT of pulmonary embolism: Technical considerations and interpretive pitfalls. J Thorac Imaging. 1997;12:103-117.
Remy-Jardin M., Tillie-Leblond I., Szapiro D., et al. CT angiography of pulmonary embolism in patients with underlying respiratory disease: Impact of multislice CT on image quality and negative predictive value. Eur Radiol. 2002;12:1971-1978.
Riley P., Rooney S., Bonser R., Guest P. Imaging the post-operative thoracic aorta: Normal anatomy and pitfalls. BJR. 2001;74:1150-1158.
Rofsky N.M., Weinreb J.C., Grossi E.A., et al. Aortic aneurysm and dissection: Normal MR imaging and CT findings after surgical repair with the continuous-suture graft-inclusion technique. Radiology. 1993;186:195-201.
Roos J.E., Willmann J.K., Weishaupt D., et al. Thoracic aorta: Motion artifact reduction with retrospective and prospective electrocardiography-assisted multi-detector row CT. Radiology. 2002;272:271-277.
Rozenblit A., Marin M.L., Veith F.J., et al. Endovascular repair of abdominal aortic aneurysm: Value of postoperative follow-up with helical CT. AJR Am J Roentgenol. 1995;16:1473-1479.
Rozmus G., Daubert J.P., Huang D.T., et al. Venous thrombosis and stenosis after implantation of pacemakers and defibrillators. J Interv Card Electrophysiol. 2005;13:9-19.
Sahn S.A., Heffner J.E. Spontaneous pneumothorax. N Engl J Med. 2000;342:868-874.
Sakai T., Dake M.D., Semba C.P., et al. Descending thoracic aortic aneurysm: Thoracic CT findings after endovascular stent-graft placement. Radiology. 1999;212:169-174.
Sartori S., Tombesi P., Trevisani L., et al. Accuracy of transthoracic sonography in detection of pneumothorax after sonographically guided lung biopsy: Prospective comparison with chest radiography. AJR Am J Roentgenol. 2007;188:37-41.
Savino G., Herzog C., Costello P., et al. 64 slice cardiovascular CT in the ED: Concepts and first experiences. La Radiologica Medica (Italy). 2006;111:481-496.
Schaffler G.J., Sorantin E., Groell R., et al. Helical CT angiography with maximum intensity projection in the assessment of aortic coarctation after surgery. AJR Am J Roentgenol. 2000;175:1041-1045.
Schoder M., Cartes-Zumelzu F., Grabenwoger M., et al. Elective endovascular stent-graft repair of thoracic aortic aneurysms: Clinical results and midterm follow-up. AJR Am J Roentgenol. 2003;180:709-715.
Schoepf U.J., Costello P. CT angiography for diagnosis of pulmonary embolism: State of the art. Radiology. 2004;230:329-337.
Schoepf U.J., Goldhaber S.Z., Costello P. Spiral computed tomography for acute pulmonary embolism. Circulation. 2004;109:2160-2167.
Schoepf U.J., Kucher N., Kipfmueller F., et al. Right ventricular enlargement on chest computed tomography: A predictor of early death in acute pulmonary embolism. Circulation. 2004;110:3276-3280.
Schoepf U.J., Zwerner P.L., Savino G., et al. How I do it: Coronary CT angiography. Radiology. 2007;244:48-63.
Schueller-Weidekamm C., Schaefer-Prokop C.M., Weber M., et al. CT angiography of pulmonary arteries to detect pulmonary embolism: Improvement of vascular enhancement with low kilovoltage settings. Radiology. 2006;241:899-907.
Siegel C.L., Cohan R.H., Korobkin M., et al. Abdominal aortic aneurysm morphology: CT features in patients with ruptured and unruptured aneurysms. AJR Am J Roentgenol. 1994;163:1123-1129.
Small J.H., Dixon A.K., Coulden R.A., et al. Fast CT for aortic dissection. BJR. 1996;69:900-905.
Sommer T., Fehske W., Holzknecht N., et al. Aortic dissection: A comparative study of diagnosis with spiral CT, multiplanar transesophageal echocardiography, and MR imaging. Radiology. 1996;199:347-352.
Song J.K., Kim H.S., Song J.M., et al. Outcomes of medically treated patients with aortic intramural hematoma. Am J Med. 2002;113:181-187.
Spodick D.H. Acute cardiac tamponade. N Engl J Med. 2003;349:684-690.
Stanson A.W., Kazmier F.J., Hollier L.H., et al. Penetrating atherosclerotic ulcers of the thoracic aorta: Natural history and clinicopathologic correlations. Ann Vasc Surg. 1986;1:15-23.
Stein P.D., Athanasoulis C., Alavi A., et al. Complications and validity of pulmonary angiography in acute pulmonary embolism. Circulation. 1992;85:462-468.
Stein P.D., Hull R.D., Pineo G. Strategy that includes serial noninvasive leg tests for diagnosis of thromboembolic disease in patients with suspected acute pulmonary embolism based on data from PIOPED: Prospective Investigation of Pulmonary Embolism Diagnosis. Arch Intern Med. 1995;155:2101-2104.
Stein P.D., Woodard P.K., Hull R.D., et al. Gadolinium-enhanced magnetic resonance angiography for detection of acute pulmonary embolism: An in-depth review. Chest. 2003;124:2324-2328.
Stein P.D., Woodard P.K., Weg J.G., et al. Diagnostic pathways in acute pulmonary embolism: Recommendations of the PIOPED II investigators. Radiology. 2007;242:15-21.
Stern E.J., Frank M.S. Acute traumatic hemopericardium. AJR Am J Roentgenol. 1994;162:1305-1306.
Sudwarts G., Foler D. Best evidence topic report: Does plain radiography predict pneumothorax size? Emerg Med J. 2007;24:49.
Sueyoshi E., Matsuoka Y., Imada T., et al. New development of an ulcerlike projection in aortic intramural hematoma: CT evaluation. Radiology. 2002;224:536-541.
Sueyoshi E., Matsuoka Y., Sakamoto I. Fate of intramural hematoma of the aorta: CT evaluation. J Comput Assist Tomogr. 1997;21:931-938.
Tatli S., Yucel E.K., Lipton M.J. CT and MR imaging of the thoracic aorta: Current techniques and clinical applications. Radiol Clin North Am. 2004;42:565-585.
Thilo C., Costello P., Schoepf U.J. Coronary artery anomalies at 64 slice coronary CT angiography. Scientific exhibit at the annual meeting of the European Congress of Radiology. 2007.
Tillie-Leblond I., Mastora I., Radenne F., et al. Risk of pulmonary embolism after a negative spiral CT angiogram in patients with pulmonary disease: 1-year clinical follow-up study. Radiology. 2002;223:461-467.
Tittle S.L., Lynch R.J., Cole P.E., et al. Midterm follow-up of penetrating ulcer and intramural hematoma of the aorta. J Thorac Cardiovasc Surg. 2002;123:1051-1059.
Tokuda Y., Matsushima D., Stein G.H., et al. Intrapleural fibrinolytic agents for empyema and complicated parapneumonic effusions: A meta-analysis. Chest. 2006;129:783-790.
Value of the ventilation/perfusion scan in acute pulmonary embolism. Results of the prospective investigation of pulmonary embolism diagnosis (PIOPED). The PIOPED Investigators. JAMA. 1990;263:2753-2759.
Van Dyke C.W., Flamm S.D., White R.D. Disease of the thoracic aorta. In Freundlich I.M., Bragg D.G., editors: A Radiologic Approach to Disease, 2nd ed, Baltimore, MD: Williams and Wilkins, 1997.
Van Guens R.J.M., Cademartiri F. Anatomy of the coronary arteries and veins in CT imaging. In: Schoepf U.J., editor. CT of the Heart Principles and Applications. Totowa, NJ: Humana Press, 2004.
Van Marrewijk C., Buth J., Harris P.L., et al. Significance of endoleaks after endovascular repair of abdominal aortic aneurysms. J Vasc Surg. 2002;35:461-473.
Vernhet H., Serfaty J.M., Serhal M., et al. Abdominal CT angiography before surgery as a predictor of postoperative death in acute aortic dissection. AJR Am J Roentgenol. 2004;182:875-879.
Von Kodolitsch Y., Csosz S.K., Koschyk D.H., et al. Intramural hematoma of the aorta: Predictors of progression to dissection and rupture. Circulation. 2003;107:1158-1163.
Vrachliotis T.G., Bis K.G., Haidary A., et al. Atypical chest pain: Coronary, aortic, and pulmonary vasculature enhancement at biphasic single-injection 64-section CT angiography. Radiology. 2007;243:368-376.
Wang Z.J., Reddy G.P., Gotway M.B., et al. CT and MR imaging of pericardial disease. Radiographics. 2003;23(Special issue):S167-S180.
Washington L., Goodman L.R., Gonyo M.B., et al. CT for thromboembolic disease. Radiol Clin North Am. 2002;40:751-771.
Webb R.W., Muller N.L., Naidich D.P. High-Resolution CT of the Lung, 3rd ed. Philadelphia: Lippincott Williams & Wilkins; 2001. pp 49–192
Wells P.S., Ginsberg J.S., Anderson D.R., et al. Use of a clinical model for safe management of patients with suspected pulmonary embolism. Ann Intern Med. 1998;129:997-1005.
Wever J.J., Blankensteijn J.D., van Rijn J.C., et al. Inter- and intraobserver variability of CT measurements obtained after endovascular repair of abdominal aortic aneurysms. AJR Am J Roentgenol. 2000;175:1279-1282.
White C.S., Kuo D. Chest pain in the emergency department: Role of multidetector CT. Radiology. 2007;245:672-681.
Wilson L.D., Detterbeck F.C., Yahalom J. Clinical practice: Superior vena cava syndrome with malignant causes. N Engl J Med. 2007;356:1862-1869.
Wittram C. How I do it: CT pulmonary angiography. AJR Am J Roentgenol. 2007;188:1255-1261.
Wittram C., Maher M.M., Yoo A.J., et al. CT angiography of pulmonary embolism: Diagnostic criteria and causes of misdiagnosis. Radiographics. 2004;24:1219-1238.
Wolfe M.W., Lee R.T., Feldstein M.L., et al. Prognostic significance of right ventricular hypokinesis and perfusion lung scan defects in pulmonary embolism. Am Heart J. 1994;127:1371-1375.
Woodard P.K. Pulmonary arteries must be seen before they can be assessed. Radiology. 1997;204:1112.
Worsley D.F., Alavi A., Aronchick J.M., et al. Chest radiographic findings in patients with acute pulmonary embolism: Observations from the PIOPED study. Radiology. 1993;189:133-136.
Yamada I., Nakagawa T., Himeno Y., et al. Takayasu arteritis: Evaluation of the thoracic aorta with CT angiography. Radiology. 1998;209:103-109.
Yoshida S., Akiba H., Yama N., et al. Thoracic involvement of type A aortic dissection and intramural hematoma. Radiology. 2003;228:430-435.
[/level-membership-for-radiology-category][not-level-membership-for-radiology-category]
CHAPTER 8 Nontraumatic Emergency Radiology of the Thorax
An emergency medicine physician once told a bright-eyed medical student on the first clinical shift:
CHEST RADIOGRAPHY
One principle that serves radiologists well is the establishment of a systematic pattern through which the interpreter progresses as he or she reads a CXR. While naturally drawn to look at the lungs, and while evaluation of pulmonary parenchyma is paramount, the interpreter must unerringly include assessment of extrapulmonary anatomy on every CXR. This includes evaluation of anatomy below the diaphragm, of lung parenchyma posterior to the diaphragm, of the bony thorax, spine, shoulders, and chest wall soft tissues, of the heart contours, mediastinum, and pulmonary hila, of pleural surfaces and interfaces, and of complex areas such as the pulmonary apices. Establishing a pattern of evaluation that systematically includes all of the anatomy encountered on a CXR will serve to avoid unfortunate errors of CXR interpretation (Fig. 8-1).
Pneumonia
CXR and chest imaging are generally of limited value in upper respiratory infections. On CXR, pneumonia manifests as areas of increased density within the pulmonary parenchyma. The increased density is usually focal but may be multifocal or diffuse. Depending on the causative organism and the health and immune status of the patient, the density may manifest as confluent parenchymal consolidation (where vessels are obscured within the density), as hazy ground glass density (where vessel margins can be detected within the density), or as coarse reticular or reticulonodular opacities. These densities may be marginated by pleural or fissural boundaries. If available, the use of both posteroanterior (PA) and lateral projections is often helpful in detecting, confirming, or localizing areas of increased parenchymal density (Figs. 8-2 and 8-3).
Heart Failure
The sequence by which CHF leads to pulmonary edema and may manifest on CXR is familiar. Left ventricular failure results in increased pressure within the pulmonary venous system leading to pulmonary venous distention. The increased size of pulmonary veins on CXR, particularly in the upper lobes, manifests as “cephalization,” for which the determination can be relatively subjective at imaging. As pulmonary venous capacitance is exceeded, pulmonary vessels begin to leak transudative fluid into the pulmonary interstitium, including the septal, peribronchial, and perivascular spaces, and into the pleural space. The CXR correlates include septal lines (or “Kerley B” lines), peribronchial cuffing, indistinctness of vessel margins, and pleural effusions, respectively. With further progression, fluid begins to accumulate in alveolar spaces resulting in more confluent density that obscures vessel margins but in contrast accentuates the appearance of bronchial airways resulting in air bronchograms (Fig. 8-4).
COMPUTED TOMOGRAPHY
CT of the Pulmonary Parenchyma
Septal thickening may be smooth, nodular, or irregular. Differential considerations for smooth septal thickening include pulmonary edema (with septal thickening being the equivalent of “Kerley B” lines seen on CXR) or ARDS, and pneumonia or pulmonary hemorrhage (Fig. 8-5). Septal thickening seen with these entities may be associated with “ground glass” density, the so-called crazy paving pattern. The “crazy paving” pattern has also been described as characteristic of alveolar proteinosis. Nodular septal thickening may be seen in lymphangitic metastases as well as sarcoidosis and silicosis. Nodules seen in sarcoidosis are characterized as perilymphatic, and thus may be centrilobular or septal (lymphatics are associated with both the septae and bronchovascular structures). Pulmonary fibrosis may also result in septal thickening, which may be irregular in nature and may be associated with honeycombing or other common findings of fibrosis, such as traction bronchiectasis.
Centrilobular opacities or nodules generally imply abnormalities of the small airways or vascular diseases, and are usually related to bronchiolitis of varying etiologies. The combination of centrilobular opacities/nodules with dilated/opacified bronchioles has been termed the “tree-in-bud” sign (Fig. 8-6). In the ED, centrilobular opacities/nodules are usually seen in the setting of an infectious bronchiolitis that may be due to bacterial or atypical organisms. Pulmonary aspiration can give a similar appearance. Other differential considerations for centrilobular opacities/nodules include pulmonary edema and hemorrhage, vasculitis, bronchoalveolar cell carcinoma, acute or subacute hypersensitivity pneumonitis, noninfectious bronchiolitis (as can be seen in smoking-related interstitial lung disease/respiratory bronchiolitis), and panbronchiolitis.
More generalized (panlobular) processes may lead to either ground glass or more consolidated opacities. If ground glass opacities are detected, the differential diagnosis is assisted by identification of ancillary findings. Ground glass opacities in the presence of honeycombing or other findings of fibrosis should point toward differential considerations among fibrotic lung diseases. Ground glass opacities in the presence of septal thickening (“crazy paving” pattern) should raise differential considerations including pulmonary edema, pneumonias of varying etiologies, and pulmonary hemorrhage, as well as entities less commonly encountered in the ED, including hypersensitivity pneumonitis, ARDS, and alveolar proteinosis. If ground glass opacities are encountered in the absence of ancillary findings the differential considerations become even broader and include interstitial pneumonia, infection, and drug reaction, in addition to the entities listed above (Fig. 8-7). Differential considerations for more consolidated densities include entities such as pneumonias, pulmonary edema, ARDS, and pulmonary hemorrhage, as well as acute eosinophilic pneumonia, masses, and fibrotic processes. Familiarity with the concept of evaluating pulmonary parenchyma based on analysis of the structures of the secondary pulmonary lobule will serve emergency radiologists well in their approach to formulating differential diagnoses for parenchymal disease.
Chest CT Techniques and Protocols
Scan Protocol Considerations
Contrast Timing Principles and Techniques
Indication-specific CT Protocol Techniques
Upper Extremity Deep Venous Thrombosis or Superior Vena Cava Syndrome
A delayed venous phase scan should be performed if there is high clinical suspicion for upper extremity or central vein thrombosis. The delayed phase produces more uniform venous opacification and eliminates the mixing artifacts typically observed from dense IVCM injected through one arm mixing in the SVC with the unopacified blood arriving from the other arm (Fig. 8-8). Coronal reformations can greatly aid diagnosis.
Aortic Dissection CTA
Currently, full dissection CTA protocols may include:
The arterial phase scan is often performed with cardiac gating in order to reduce the pulsation artifact, which can mimic focal aortic dissection at the aortic root. However, this artifact has a characteristic appearance on axial and MPR images, and can typically be readily differentiated from aortic dissection (Fig. 8-9). If the radiologist is readily familiar with this diagnostic pitfall, a nongated arterial phase scan can be used so as to reduce radiation exposure, which is significantly greater on cardiac-gated scans. If cardiac gating is utilized, a regular heart rate is required, preferably 65 or fewer beats per minute. For younger ED patients (generally younger than 50 years old) with a low pretest probability of aortic dissection and a low incidence of significant atherosclerotic disease, we screen with a physician-monitored, nongated, contrast-enhanced chest CT only in order to reduce the radiation exposure from multiple phase protocols. If needed, additional scanning can be readily undertaken if results of this scan show anything other than a normal aorta. Very rarely is this necessary.
THE PLEURA, PERICARDIUM, AND MEDIASTINUM
The Pleura
Pneumothorax
Pneumothorax is the presence of air within the pleural space. The etiologies of pneumothorax are multifactorial (Table 8-1). The most common imaging test performed to assess for pneumothorax is the chest radiograph, or CXR. Ideally, this is performed with upright patient positioning so that the air–pleural interface can be readily identified toward the apices. Expiratory imaging may accentuate the contrast between lung tissue and intrapleural gas. This method may be particularly helpful for smaller pneumothoraces, but is generally not required. The presence of pneumothorax is often more subtle on supine radiography, and small pneumothoraces can be easily overlooked.
| Etiology | Types |
|---|---|
| Trauma | Penetrating or blunt; barotrauma |
| Idiopathic | Primary or secondary |
| Iatrogenic | Following biopsy, surgery, central line placement, thoracentesis, mechanical ventilation, bronchoscopy |
| Infection | Pneumocystis carinii, necrotizing pneumonia |
| Neoplastic | Langerhans’ cell histiocytosis, sarcoma, lung cancer, various others |
| Congenital/Acquired | Emphysema, congenital bullae, lymphangioleiomyomatosis |
Recently, ultrasound (US) has gained attention as a rapid assessment tool to evaluate for pneumothorax in the ED and after chest interventions. The performance of US has been shown to be as good if not better than radiography, although it generally underperforms as a follow-up study. Additionally, greater variation in results should be expected due to differences in sonographer skill and experience. Traumatic pneumothorax is discussed in this text in Chapter 2, so only a brief comment is made here. The seal of the pleural space is easily broken by penetrating injury, and it is vulnerable because it is spread over a large surface area. Significant blunt trauma is estimated to cause pneumothorax in up to 30% to 40% of cases. It can lead to pneumothorax when broken ribs or other sharp structures expose the pleural space to atmospheric pressure, or when a preexisting bleb is ruptured. Fractured ribs on imaging should invoke a secondary search for pneumothorax. With positive pressure ventilation, barotrauma can lead to pneumothorax, particularly in patients with relatively noncompliant lung tissue (e.g., those with ARDS or interstitial lung disease). Barotrauma may also occur during sport diving or from nonpenetrating blast injuries resulting from explosive devices.
Pleural Effusion
Pleural effusion, defined as abnormally increased fluid within the pleural space, may be transudative or exudative in etiology. Transudative fluid is generally low in protein and typically develops in the setting of left heart failure, decreased oncotic pressure, or other systemic abnormality. Exudative fluid is often a consequence of breakdown of the barrier function of the pleura, leading to leakage of macromolecules and proteins. Less commonly encountered complex exudative pleural effusions include hemorrhagic fluid related to tuberculous infection, chylothorax related to thoracic duct injury, and eosinophilic effusions related to hypersensitivity (Table 8-2).
| Etiology | Types |
|---|---|
| Trauma | Hemothorax, chylothorax |
| Infectious | Empyema, tuberculous effusion |
| Gestational/Fertility | Ovarian hyperstimulation |
| Inflammatory | Postpericardiotomy, eosinophilic |
| Drug induced | Multiple factors |
| Reactive | Ascitic, pancreatitis |
Pericardium
Hemopericardium
Hemopericardium is most often the result of acute blunt or penetrating trauma, from direct pericardial damage, myocardial contusion, or proximal aortic injury. Hemorrhage into the pericardial sac can rapidly lead to tamponade and circulatory collapse. In the absence of a history of trauma, type A aortic dissection, coronary artery aneurysm rupture, or postinfarct cardiac rupture must be considered. However, a dense pericardial effusion is not a sine qua non of hemopericardium or incipient tamponade. Radiographic and CT findings must be interpreted in conjunction with history and physical exam findings. Echocardiography should be performed if there are features causing concern for hemodynamic compromise (Fig. 8-10).
Mediastinum
Pneumomediastinum
Typical causes of pneumomediastinum include trauma, asthma, drug use (Valsalva-induced), infection, and spontaneous pneumomediastinum. Traumatic causes (other than typical blunt or penetrating external trauma) may be the result of scope, tube, or line insertion (i.e., iatrogenic), positive pressure ventilation, or internal barotrauma related to vomiting (Boerhaave syndrome) or coughing against a closed glottis (Fig. 8-11). Pneumomediastinum generally requires no treatment apart from addressing the underlying cause.
SVC Syndrome
CXR may reveal a mediastinal abnormality in patients with clinically suspected SVC syndrome, such as a mediastinal mass or lymphadenopathy. Contrast-enhanced CT and MR angiography are the most reliable noninvasive methods of definitive diagnosis. CT is generally preferred as the initial study, owing to the prevalence of lung cancer and lymphoma as causative factors in the adult population and the ease and accuracy with which CT delineates these findings (Fig. 8-12).
