9 Non-Invasive Strength Analysis of the Spine Using Clinical CT Scans
KEY POINTS
Introduction
Osteoporosis is widely recognized as an underdiagnosed and undertreated disease. According to the National Osteoporosis Foundation and the National Institutes of Health, 10 million Americans are estimated to have osteoporosis, and another 34 million are at increased risk due to low bone mass, but only about 20% of those eligible to be screened are actually tested and only a fraction of those are positively diagnosed and treated. Above age 50, the density of vertebral trabecular bone decreases at a rate of about 2.2% to 3.0% per year for women, depending on age, and by about 1.7% to 2.5% per year for men,1 with about 700,000 osteoporotic spine fractures occurring annually in the united States2.
Management of osteoporosis in the over-50 age group is important both to avoid such fractures and to optimize spine surgery outcomes. A recent study from Taiwan3 estimated that for all major spine surgical cases, not including vertebroplasty or kyphoplasty, 47% of women and 46% of men over age 50 had low bone mass or “osteopenia” — a BMD T-score of between −1.0 and −2.5 — and 44% of women and 12% of men had osteoporosis — a BMD T-score of less than −2.5. As the size of the aging population continues to increase, a huge and growing proportion of spine surgery patients may have compromised bone strength. This presents a challenge to the spine surgeon using any sort of instrumentation or implant for stabilization, since the underlying bone and the bone-implant interface need to be strong enough to sustain the stresses both from daily activities and spurious overloads.
A number of different types of imaging modalities are now available for noninvasive assessment of bone density, structure, and strength.4 The dual-energy x-ray (DXA) scan is the current clinical standard for bone density assessment. However, DXA for the spine has a number of limitations. Being a 2D imaging modality, a DXA scan combines all bone morphology in the anterior-posterior direction. Thus, arthritic changes in the posterior elements, degenerative osteophytic growths around the endplates, and aortic calcification all produce bone mineral density increases in the DXA scan — increases that confound the measurement of bone mineral density in the load-bearing vertebral body. DXA scans also provide very limited information on the morphology, density, or strength of the pedicles. As a result of these limitations, DXA of the spine is less predictive of the risk of osteoporotic fractures than is DXA of the hip, DXA of the spine can be highly misleading in terms of measuring actual bone mineral density of the vertebrae or pedicles, and there remains a need for improved strength and fracture risk assessment of the spine.
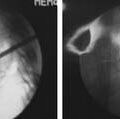
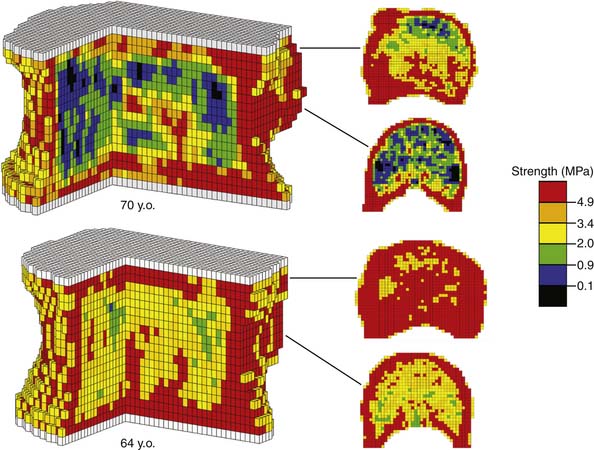
Computed tomography (CT), being a 3D imaging modality, provides a powerful alternative to DXA and is preferable to magnetic resonance imaging (MRI) for bone strength assessment since it provides quantitative information on bone mineral density.4 One limitation with CT analysis is the difficulty of interpreting the large amount of information in the scan in terms of a clinically relevant outcome such as bone strength. This is because a low value of bone mineral density at a particular location within the bone does not necessarily indicate a problem with overall bone strength. Conversely, such a local decrease in density may not show up in an averaged measure of bone mineral density, but may be problematic if that local decrease in density occurs in such a location as to appreciably compromise strength. To overcome this limitation, a sophisticated engineering structural computational analysis technique known as “finite element analysis” can be applied to CT scans to provide an estimate of vertebral strength,5 in much the same way as engineers perform computational strength analysis of such complex 3D structures as bridges, aircraft components, and engine parts (Figure 9-1). The resulting “biomechanical computed tomography” (BCT) technology, which represents a post hoc analysis of a clinical CT exam, is now being used in a variety of clinical research studies that address vertebral strength, aging, osteoporosis and its various therapeutic treatments. Because BCT creates a mechanical model of the patient’s bone, it can also be adapted to include a virtual implant and in that way provide estimates of strength and stability of various bone-implant constructs — all from analysis of a patient’s preoperative CT scan.
Clinical Case
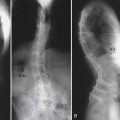
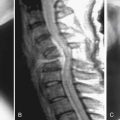
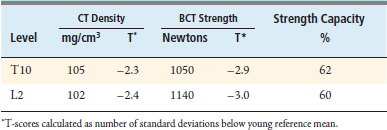
The BCT analysis was used to estimate the vertebral strength for T10 and L2 in order to better assess the osteoporotic status of the vertebrae (Table 9-1). Analysis of the scans showed substantial posterior arthritic changes and that the bone strength was three standard deviations lower than the mean value for a young reference population. The volumetric density scores of the trabecular bone based on the CT data indicated low trabecular bone density — almost in the osteoporosis range — but they did not reflect that this patient had low cortical density and relatively small bones, both of which also contributed to her very low bone strength. The DXA spinal T-scores were therefore misleading because of the substantial posterior calcification, arthritic changes, low cortical density, and small bone size. Calculations of the strength-capacity — which take into consideration the expected magnitude of the in vivo forces acting on the patient’s spine (see later in the chapter for more details) — were in the 60% range, indicating that the strength of this patient’s vertebra was only about 60% of what it should be in order to safely lift a 10-kg object with back bent (a “worst case” strenuous loading condition). Based on these findings, the surgeon instrumented from T12-L1, advised the patient of her elevated risk of vertebral fracture, and referred her for an endocrine consultation.
Basic Science
Aging of the Spine
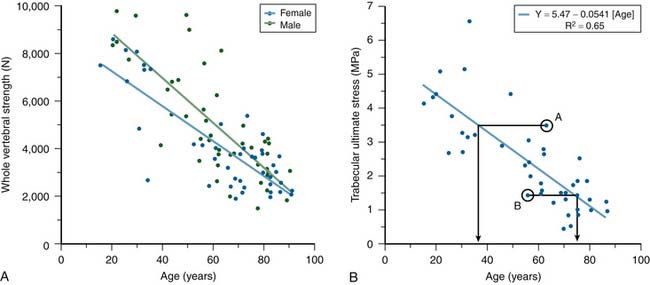
Substantial changes occur to vertebrae with aging. Cadaver studies have shown that whole vertebral strength decreases by about 12% per decade from ages 25 to 85 (Figure 9-2). Although these changes are due primarily to a loss of bone density, which is offset in part by subtle increases in bone size, the loss of cortical bone is generally not as pronounced as the loss of the trabecular bone.1 DXA generally is unable to distinguish between cortical and trabecular bone in the spine, due to its projectional nature. Aging of the spine is also accompanied by osteoarthritic changes (formation of osteophytes, etc.) around the disc and endplates. Again, due to projectional limitations, such degenerative changes are manifested as increases in BMD on DXA exams — effectively adding noise to the BMD signal from the more biomechanically relevant vertebral body portion of the spine. There is also substantial heterogeneity in trabecular strength across the population at any age (Figure 9-2). Thus, although advanced age is associated with low bone strength, age, sex, and DXA information are inadequate for clinical assessment of vertebral strength for an individual patient.
Finite Element Analysis of CT Scans — Biomechanical Computed Tomography
Because of the above-mentioned concerns over the fidelity of DXA scans for the spine and the substantial heterogeneity across patients in vertebral bone, quantitative CT is preferred for bone density assessment in the spine4 However, CT alone provides density measures in preselected regions of interest within the vertebra, e.g., trabecular centrum vs. trabecular bone near the endplates vs. all trabecular bone vs. all trabecular bone plus the cortex, etc., and such outcomes can be difficult to interpret with respect to actual strength of either the isolated vertebra or a vertebral bone-implant construct. In addition, use of CT-derived density data alone would be difficult for assessment of different surgical options because there would be no way to measure any biomechanical effect of the implant on stresses in the bone. To overcome these limitations, clinical CT scans can now be converted into biomechanical structural models of the patient’s bones in a highly automated and repeatable fashion using a combination of sophisticated imaging processing and finite element modeling. This technology, termed biomechanical computed tomography (BCT) because it represents a biomechanical analysis of a CT scan, has the main advantage of providing a strength outcome that is integrative in nature, not requiring specification of any particular region of interest with the bone. It can also account for typical in vivo loading conditions and can be used on isolated vertebrae, motion segments, or bones with virtually implanted prostheses. With appropriate comparison versus population reference values and biomechanical threshold values, such information can be used to assist the physician in various stages of the decision-making process during patient management.
BCT has been used for over two decades in orthopedic laboratory research to study the mechanical behavior of such bones as the femur, humerus, radius, tibia, cranium, and vertebra, with and without implants, and more recently has found use in a number of clinical research studies. It has been well validated in cadaver studies, for both the hip and spine, and has consistently been found to be a better predictor of measured cadaveric strength than is BMD as measured by either DXA or quantitative CT alone. The technique is now undergoing extensive clinical validation for a variety of osteoporosis clinical applications. In the first published study of clinical BCT,6 it was found that a measure of lumbar vertebral strength better discriminated between osteoporotic and non-osteoporotic subjects than did bone density (Figure 9-3). In a more recent study, BCT has been shown to differentiate those with prevalent vertebral fractures from those without, after accounting for age and despite areal BMD not being able to differentiate the fracture from no-fracture groups.7 BCT has also been used to assess the effects of various drug treatments at the spine and can detect statistically significant between-treatment effects in the spine earlier than can DXA.8

In addition to providing measures of vertebral density and strength, BCT can also be used to implement controlled variations of the patient-specific models to produce additional strength outcomes of potential clinical significance. For example, by virtually peeling away the outer layer of bone and then running a second virtual stress test for strength analysis of the remaining bone, it is possible to quantify the strength effects associated with just the trabecular or cortical compartment.8 Such studies have shown, for example, that strength associated with the outer two millimeters of bone in the vertebral body (which encompasses the cortical shell) is highly predictive of fracture at the spine groups7 and can be differentially affected versus the trabecular compartment by various drug treatments.8,9 The BCT technique so far has been used only in clinical research studies and is not yet FDA-approved.
Clinical Practice Guidelines
Another outcome from the BCT analysis beyond strength is the “strength-capacity” (aka the “safety factor” in engineering analysis), defined as the ratio of the strength of the bone to the magnitude of the estimated applied in vivo force acting on the bone. This is the reciprocal of the “load-to-strength” ratio often used in biomechanics research studies.10 The lower the value of the strength-capacity, the higher is the likelihood of fracture in the event of the simulated event, e.g., for the spine, bending over and lifting 10 kg. For example, if the vertebral strength for a patient’s L2 was computed to be 2000 N, and the estimated in vivo force for lifting a 10 kg object with back bent was 3000 N, the strength-capacity of the patient’s L2 vertebra for this activity would be 2000/3000 = 66%. This indicates that the patient’s bone has only 66% of the strength necessary to safely engage in this lifting activity. While, in theory, strength-capacity values less than 100% would indicate that the bone is too weak to withstand the applied in vivo forces, because of the difficulty of estimating in vivo forces in an absolute accurate sense, strength-capacity values are, at present, best interpreted in relative terms. The in vivo force for a given activity can be calculated as part of the BCT analysis using such patient-specific information as weight and height, and various skeletal measurements obtained from the patient’s CT exam including muscle size and location.
Clinical Case Examples
Comparing Teriparatide and Alendronate for Treatment of Osteoporosis
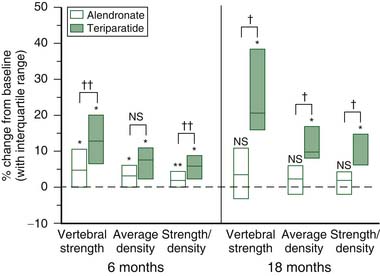
Teriparatide and alendronate increase bone mineral density through opposite effects on bone remodeling, namely via anabolic and antiresorptive actions, respectively. In this study8, two randomly assigned groups of postmenopausal osteoporotic women (N=28 teriparatide; N=25 alendronate) who had quantitative CT scans of the spine at baseline and postbaseline (6 months and 18 months) were analyzed with BCT for L3 vertebral compressive strength. At 18 months, patients in both treatment groups had increased vertebral strength, the median percentage increase being over fivefold greater for teriparatide (Figure 9-4). Larger increases in the ratio of strength to density were observed for teriparatide, and these were primarily attributed to preferential increases in trabecular strength that occurred only for this treatment. At 6 months, the between-treatment effect was statistically significant for vertebral strength but not for BMD, demonstrating the ability of BCT to differentiate treatment effects earlier than DXA. Further, median changes in the BCT-measured vertebral strength for the teriparatide and alendronate groups were 4.9% and 13.0%, respectively, and for DXA-measured spine BMD were 2.0% and 3.4%, respectively, indicating that changes were generally much larger for BCT than for DXA.
Alendronate Treatment in Rheumatoid Arthritic Patients
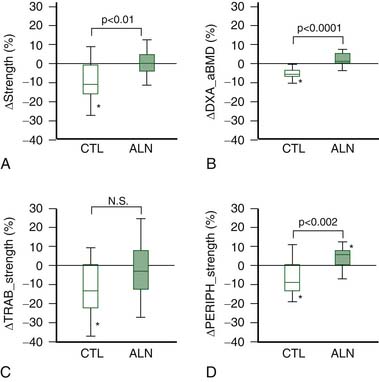
In this study,9 BCT analysis was applied to 29 rheumatoid arthritic patients, randomly assigned to be treated or not with either alendronate for their osteoporosis, but most of whom were on some sort of steroidal medication for their rheumatoid arthritis. Results indicated that, after 12 months of treatment, there was on average a loss in the nontreated group of 10.6%, which was completely arrested with alendronate treatment, primarily by its positive effect on the outer 2 mm of vertebral bone (Figure 9-5). These results demonstrate the substantial loss of vertebral strength that can occur in RA patients and the usefulness of alendronate treatment for arresting such loss.
Assessing Risk of Vertebral Fracture in Postmenopausal Women
Data from a cross-section study on vertebral fracture prevalence were used to compare the abilities of BMD by DXA vs. vertebral strength and the strength-capacity by BCT for vertebral fracture risk assessment7. Forty postmenopausal women with a clinically-diagnosed vertebral fracture (confirmed semiquantitatively) due to moderate trauma (cases: mean age, 78.6 ±9.0 years) were identified from an age-stratified sample of Rochester, MN women, and were compared to 40 controls with no osteoporotic fracture (70.9 ± 6.8 years). Results indicated that DXA-based BMD for the spine or total hip were not significantly different between fractures and controls, but age-adjusted BCT-measures of vertebral strength and load-to-strength ratio (the reciprocal of strength-capacity) were 23% lower and 36% higher, respectively. The age-adjusted odds ratio per standard deviation increase for the load-to-strength ratio measure was 3.2 (p < 0.05), versus a nonsignificant value of 0.70 for spine region BMD by DXA. Thus, if an individual presented to the clinic with a load-to-strength ratio that was 2.5 SD above the age-matched average value for his or her sex, she or he would be at an 18-fold (= 3.22.5) elevated risk of fracture compared to the age-matched average. This study demonstrates the ability of the BCT-measured load-to-strength ratio (and thus its reciprocal, the strength-capacity) to provide additional fracture predictive ability compared to DXA-measured BMD.
Discussion
One clinical challenge with using BCT for fracture risk assessment is the actual need for a CT scan and the associated cost and radiation exposure. For an assessment of osteoporosis fracture risk, this leads to more radiation and a more expensive test than a traditional DXA exam. However, if the technique is used to analyze a previously-acquired CT exam, then the BCT fracture risk assessment analysis per se becomes less expensive than a DXA exam, more convenient than a DXA exam, and requires no extra radiation, because no new CT exam is required. Such previously-acquired CT exams would include a pelvic, spine, or abdomen CT, or such specialized CT exams as CT colonography, CT angiography, or CT for calcium scoring. Further development could lead to the application of BCT to such low-energy CT scanning techniques as intraoperative C-arm and O-arm scanning, which would be advantageous particularly for intraoperative osteoporosis screening and surgical planning.
1. Riggs B.L., Melton L.J., Robb R.A., Camp J.J., Atkinson E.J., McDaniel L., et al. A population-based assessment of rates of bone loss at multiple skeletal sites: evidence for substantial trabecular bone loss in young adult women and men. J. Bone Miner. Res.. 2008;23(2):205-214.
2. Melton L.J. Epidemiology of spinal osteoporosis. Spine. 1997;22(Suppl. 24):2S-11S.
3. Chin D.K., Park J.Y., Yoon Y.S., Kuh S.U., Jin B.H., Kim K.S., et al. Prevalence of osteoporosis in patients requiring spine surgery: incidence and significance of osteoporosis in spine disease. Osteoporosis Int.. 2007;18(9):1219-1224.
4. Bouxsein M.L. Technology insight: noninvasive assessment of bone strength in osteoporosis. Nat. Clin. Pract.. 2008;4(6):310-318.
5. Crawford R.P., Cann C.E., Keaveny T.M. Finite element models predict in vitro vertebral body compressive strength better than quantitative computed tomography. Bone. 2003;33(4):744-750.
6. Faulkner K.G., Cann C.E., Hasegawa B.H. Effect of bone distribution on vertebral strength: assessment with patient-specific nonlinear finite element analysis. Radiology. 1991;179(3):669-674.
7. Melton L.J., Riggs B.L., Keaveny T.M., Achenbach S.J., Hoffmann P.F., Camp J.J., et al. Structural determinants of vertebral fracture risk. J. Bone Miner. Res.. 2007;22(12):1885-1892.
8. Keaveny T.M., Donley D.W., Hoffmann P.F., Mitlak B.H., Glass E.V., San Martin J.A. Effects of teriparatide and alendronate on vertebral strength as assessed by finite element modeling of QCT scans in women with osteoporosis. J. Bone Miner. Res.. 2007;22(1):149-157.
9. Mawatari T., Miura H., Hamai S., Shuto T., Nakashima Y., Okazaki K., et al. Vertebral strength changes in rheumatoid arthritis patients treated with alendronate, as assessed by finite element analysis of clinical computed tomography scans: a prospective randomized clinical trial. Arthritis Rheum.. 2008;58(11):3340-3349.
10. Keaveny T.M., Bouxsein M.L. Theoretical implications of the biomechanical fracture threshold. J. Bone Miner. Res.. 2008;23(10):1541-1547.